Post Syndicated from JJ Lei original https://aws.amazon.com/blogs/devops/safely-handle-configuration-drift-with-cloudformation-drift-aware-change-sets/
Introduction
Is configuration drift preventing you from accessing the speed, safety, and governance benefits of AWS CloudFormation for infrastructure management? Configuration drift occurs when cloud resources are modified outside of CloudFormation, leading to a mismatch in the actual state and template definition of resources. Drift tends to accumulate from infrastructure changes that engineers make via the AWS Management Console to resolve production incidents or troubleshoot malfunctioning applications. Drift can cause unexpected changes during subsequent IaC deployments or leave resources in a non-compliant state. Unresolved drift can lead to cost increases when resources are over-provisioned outside of template definitions, or compliance violations that may result in audit penalties. Additionally, drift makes it hard to reproduce applications for testing or disaster recovery.
CloudFormation now offers drift-aware change sets that allow you to safely handle configuration drift and keep your infrastructure in sync with your templates. In this post, we will explore the process of leveraging drift-aware change sets to resolve common scenarios in which drift impacts the availability or security of your application.
Solution Overview
Drift-aware change sets are a type of CloudFormation change sets that can bring drifted resources in line with template definitions and preview the required changes to actual infrastructure states before deployment. Drift-aware change sets surface a three-way comparison of your new template, actual resource states, and previous template before deployment, allowing you to prevent unexpected overwrites of drift. Additionally, drift-aware change sets offer you a systematic mechanism to restore drifted resources to approved template definitions, strengthening the reproducibility and compliance posture of applications. You can create drift-aware change sets either from the CloudFormation Management Console or from the AWS CLI or SDK by passing the --deployment-mode REVERT_DRIFT parameter to the CreateChangeSet API.
Prerequisites
• AWS CLI latest version with CloudFormation permissions configured.
• AWS Identity and Access Management (IAM) permissions required: Permissions to create and manage CloudFormation stacks, AWS Lambda functions, Security Groups, Amazon Simple Storage Service (Amazon S3) buckets, and IAM roles. PowerUserAccess or Administrator access recommended for testing.
• Test environment (non-production AWS account recommended)
• Basic CloudFormation knowledge (stacks, templates, change sets)
Important Note: These sample templates are provided for educational purposes only and should not be used in production environments without proper security review and testing. You are responsible for testing, securing, and optimizing these templates based on your specific quality control practices and standards. Deploying these templates may incur AWS charges for creating or using AWS resources. Work with your security and legal teams to meet your organizational security, regulatory, and compliance requirements before any production deployment.
Scenario 1: Prevent Dangerous Overwrites
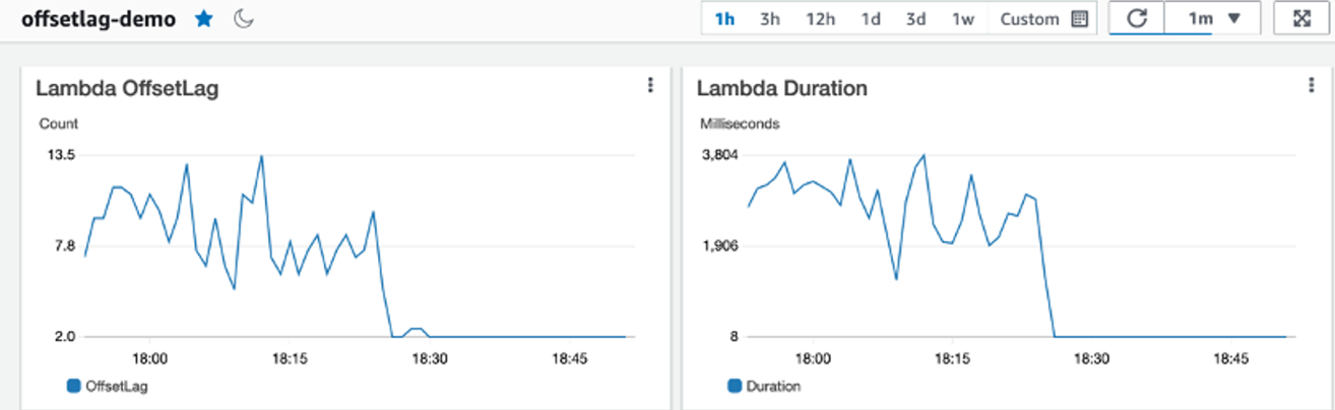
This scenario demonstrates how drift-aware change sets prevent dangerous overwrites when Lambda function memory is increased outside of CloudFormation during an outage, and a subsequent template update could accidentally reduce memory, causing performance issues.
Story: Your team deploys a Lambda function with 128 MB memory via CloudFormation. During a production outage, an engineer increases the memory to 512 MB through the Lambda Console to resolve performance issues. Later, another developer updates the template to 256 MB for a code change, unaware of the console modification. Without drift-aware change sets, CloudFormation would unexpectedly reduce memory from 512 MB to 256 MB—potentially causing the outage to recur.
User journey: Create stack with 128MB => Increase memory to 512MB via console during outage => Create drift-aware change set with 256MB template => Review three-way comparison showing dangerous memory reduction => Cancel change set to prevent outage => Update template to match production state (512MB) => Create and execute drift-aware change set with updated template (512MB) to resolve drift
Scenario Flow
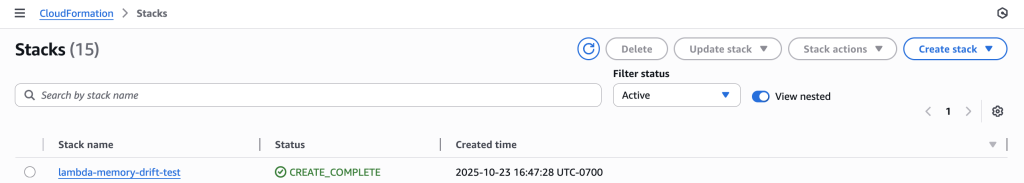
1. Create Stack
Deploy CloudFormation stack with Lambda function (128 MB memory).

CloudFormation stack “lambda-memory-drift-test” successfully deployed with CREATE_COMPLETE status
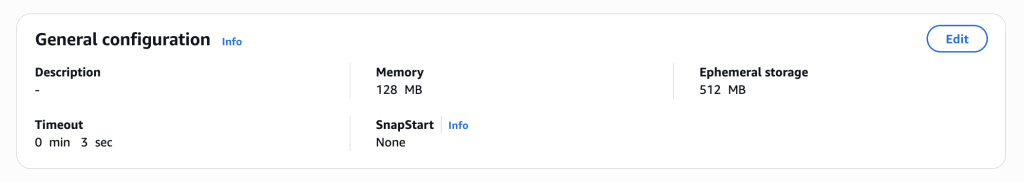
2. Emergency Memory Increase (Console)
Manually increase Lambda memory to 512 MB through AWS Console (simulating emergency performance fix during outage).

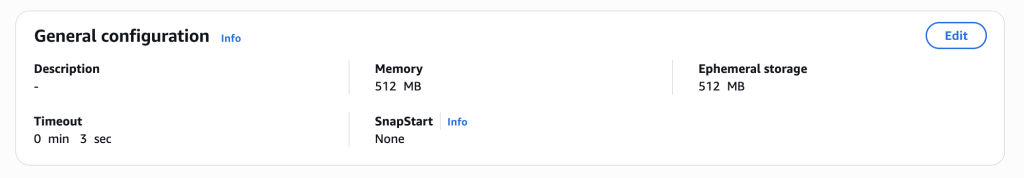
Initial Lambda function showing 128 MB memory as configured in template

Lambda memory increased to 512 MB through console during outage, creating drift from template
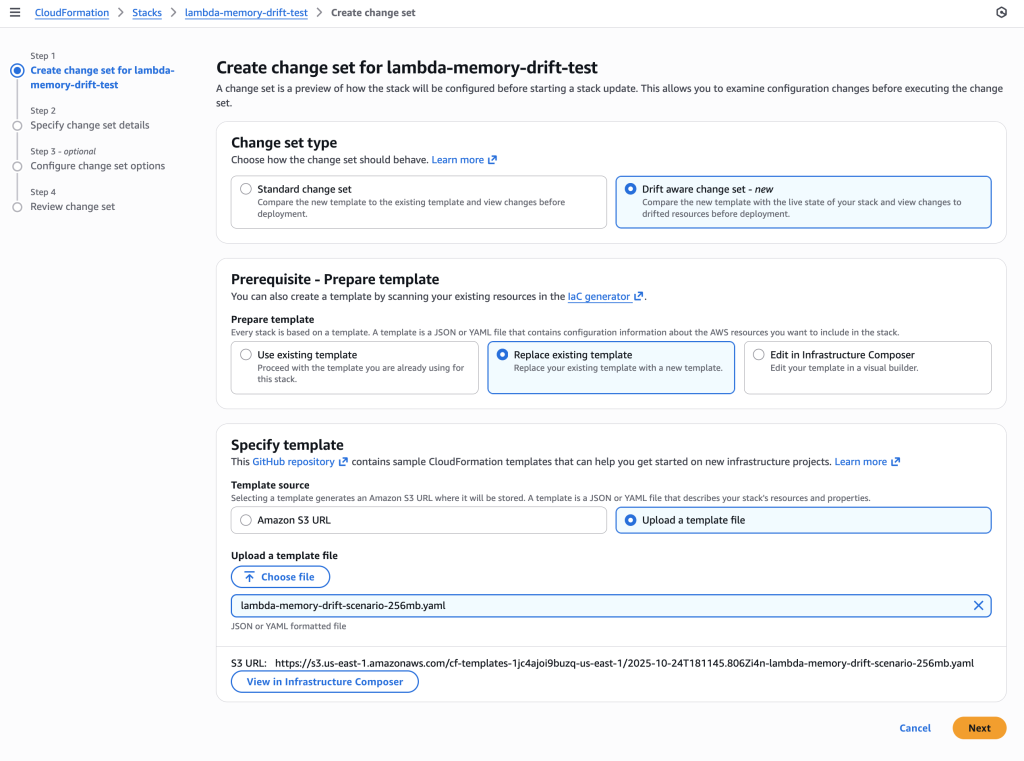
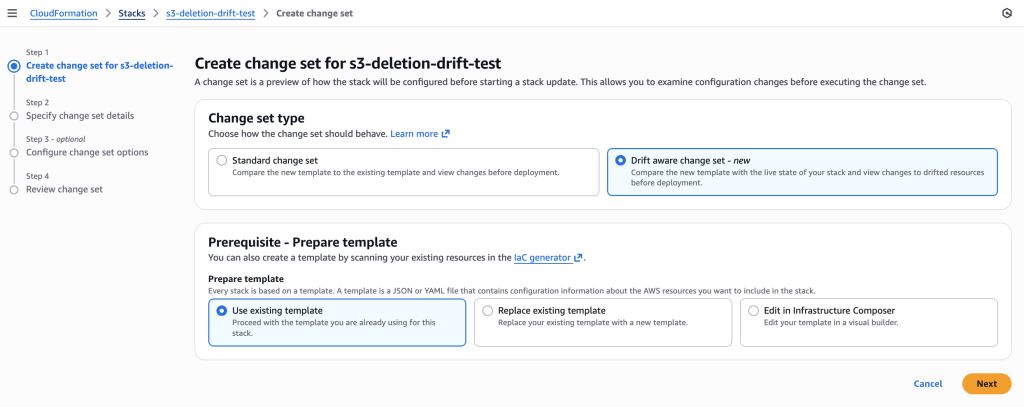
3. Create Drift-Aware Change Set
Create change set with 256 MB template using drift-aware mode to reveal the dangerous memory reduction.

CloudFormation console showing the new “Drift aware change set” option selected. This compares the new template with the live state of your stack and shows changes to drifted resources before deployment, unlike standard change sets that only compare templates.
aws cloudformation create-change-set \
--stack-name lambda-memory-drift-test \
--change-set-name detect-memory-overwrite \
--template-body file://lambda-memory-drift-scenario-256mb.yaml \
--deployment-mode REVERT_DRIFT \
--capabilities CAPABILITY_IAM \
--region us-east-1
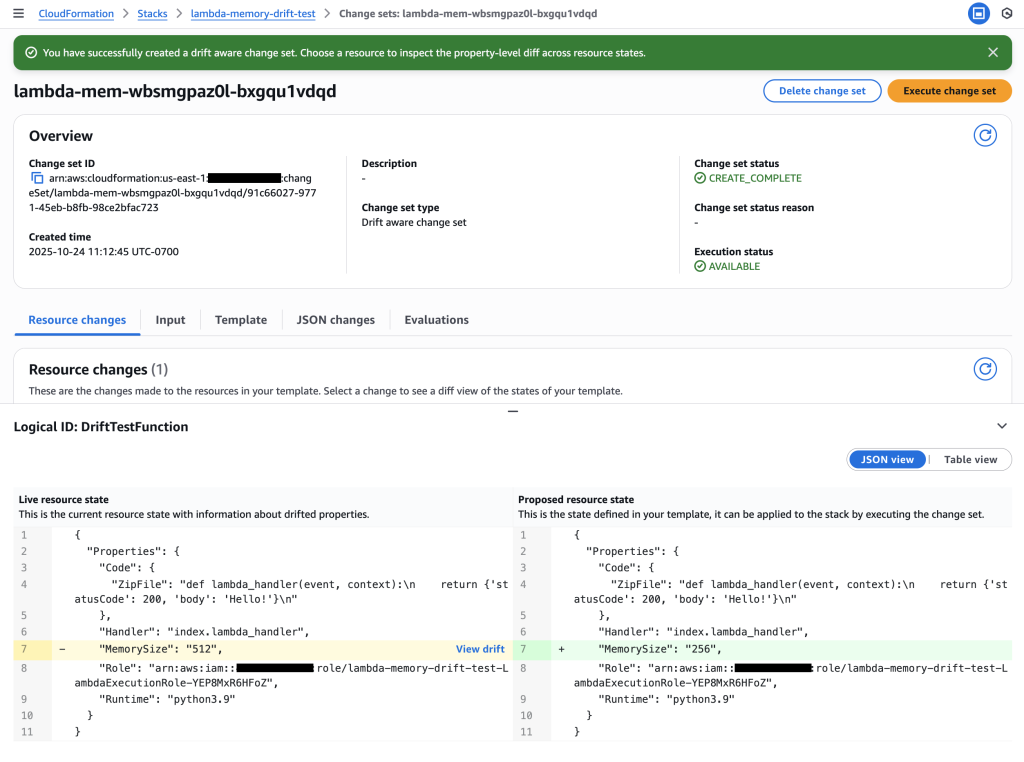
4. Review Change Set – The Critical Three-Way Comparison
Examine the drift-aware change set to see the dangerous memory reduction that would occur.

Critical insight revealed: The change set shows Live resource state (512 MB) vs Proposed resource state (256 MB), revealing a dangerous memory reduction that would impact performance.

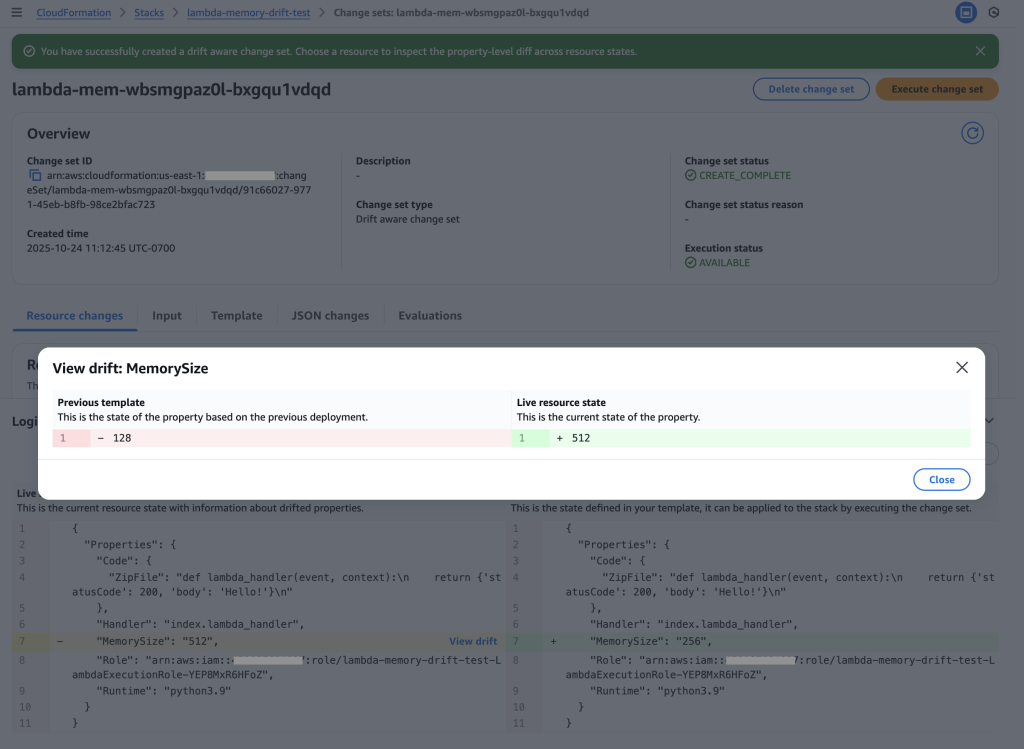
Drift analysis: Clicking “View drift” reveals the complete picture – Previous template (128 MB) vs Live resource state (512 MB). This shows the live state has 4x more memory than the original template, indicating emergency changes were made during the outage that must be preserved.
Key Insight: The drift-aware change set reveals that:
- Previous template: 128 MB (original deployment)
- Live resource state: 512 MB (emergency change during outage)
- Proposed template: 256 MB (new deployment)
This would cause a dangerous reduction from 512 MB to 256 MB, potentially recreating the original performance issue. Without drift-aware change sets, this critical information would be hidden.
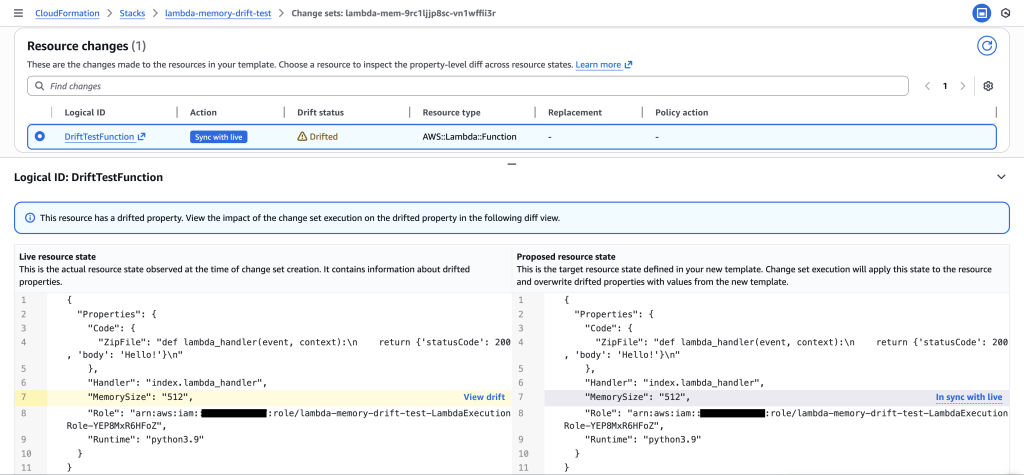
5. Recreate Drift-aware Change Set with Updated Template (512MB) to Resolve Drift
Update the template to match the live production state (512 MB) and create a new drift-aware change set to safely resolve the drift.

Resolution confirmed: The drift-aware change set shows both Live resource state and Proposed resource state at 512 MB, with change set action ” Sync with live”. This verifies that the updated template now matches production, preventing the dangerous memory reduction and safely resolving the drift without impacting performance.
CloudFormation Templates
Initial Template (128 MB):
Resources:
  DriftTestFunction:
    Type: AWS::Lambda::Function
    Properties:
      Runtime: python3.9
      Handler: index.lambda_handler
      MemorySize: 128
      ReservedConcurrentExecutions: 5
      Role: !GetAtt LambdaExecutionRole.Arn
      Code:
        ZipFile: |
          def lambda_handler(event, context):
              return {'statusCode': 200, 'body': 'Hello!'}
  LambdaExecutionRole:
    Type: AWS::IAM::Role
    Properties:
      AssumeRolePolicyDocument:
        Statement:
          - Effect: Allow
            Principal:
              Service: lambda.amazonaws.com
            Action: sts:AssumeRole
      ManagedPolicyArns:
        - arn:aws:iam::aws:policy/service-role/AWSLambdaBasicExecutionRole
Updated Template (256 MB – lambda-memory-drift-scenario-256mb.yaml):
Resources:
  DriftTestFunction:
    Type: AWS::Lambda::Function
    Properties:
      Runtime: python3.9
      Handler: index.lambda_handler
      MemorySize: 256
      ReservedConcurrentExecutions: 5
      Role: !GetAtt LambdaExecutionRole.Arn
      Code:
        ZipFile: |
          def lambda_handler(event, context):
              return {'statusCode': 200, 'body': 'Hello!'}
  LambdaExecutionRole:
    Type: AWS::IAM::Role
    Properties:
      AssumeRolePolicyDocument:
        Statement:
          - Effect: Allow
            Principal:
              Service: lambda.amazonaws.com
            Action: sts:AssumeRole
      ManagedPolicyArns:
        - arn:aws:iam::aws:policy/service-role/AWSLambdaBasicExecutionRole
CLI Commands
- Create stack:
aws cloudformation create-stack --stack-name lambda-memory-drift-test --template-body file://lambda-memory-drift-scenario.yaml --capabilities CAPABILITY_IAM --region us-east-1
- Get function name:
aws cloudformation describe-stack-resources --stack-name lambda-memory-drift-test --logical-resource-id DriftTestFunction --query 'StackResources[0].PhysicalResourceId' --output text --region us-east-1
- Create drift-aware change set:
aws cloudformation create-change-set --stack-name lambda-memory-drift-test --change-set-name detect-memory-overwrite --template-body file://lambda-memory-drift-scenario-256mb.yaml --deployment-mode REVERT_DRIFT --capabilities CAPABILITY_IAM --region us-east-1
- Describe change set:
aws cloudformation describe-change-set --change-set-name detect-memory-overwrite --stack-name lambda-memory-drift-test --region us-east-1
Scenario 2: Remediate Unauthorized Changes
This scenario demonstrates how drift-aware change sets systematically remediate unauthorized changes when a developer adds temporary debugging rules to a security group but forgets to remove them, creating a compliance violation.
Story: Your team deploys a security group with only HTTP access via CloudFormation for compliance. During debugging, a developer adds SSH access (port 22) through the AWS Console for their IP address to troubleshoot an application issue. They forget to remove this rule after debugging. Later, security compliance requires reverting to the original template state. A standard change set shows no changes since the template is unchanged, but a drift-aware change set can detect and systematically remove the unauthorized SSH rule.
User journey: Create stack with HTTP-only access => Add SSH rule via console for debugging => Forget to remove SSH rule => Create drift-aware change set with REVERT_DRIFT mode => Review change set showing SSH rule removal => Execute change set to restore compliance
Scenario Flow
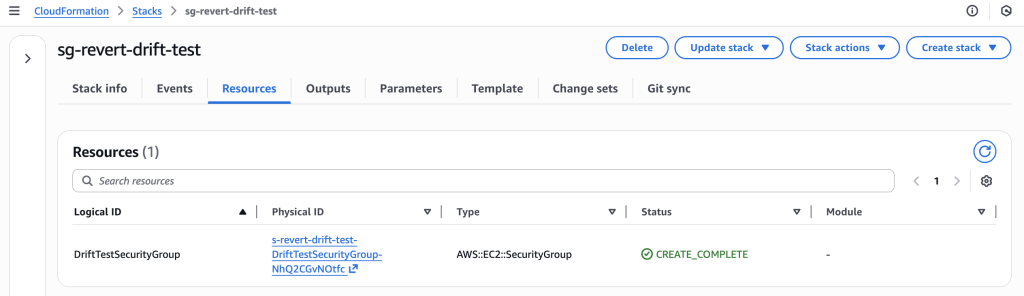
1. Create Stack
Deploy CloudFormation stack with security group allowing only HTTP traffic.

CloudFormation stack “sg-revert-drift-test” successfully deployed with DriftTestSecurityGroup resource
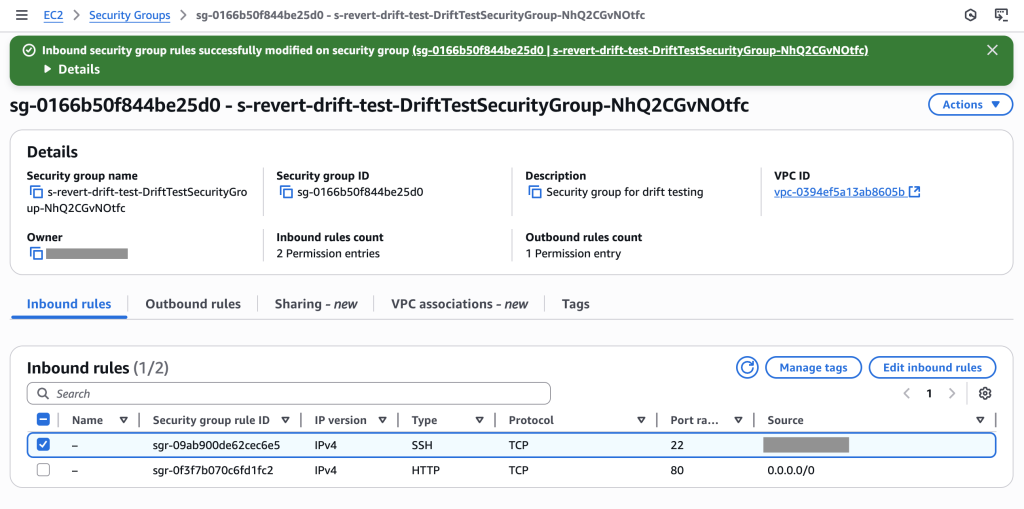
2. Make Unauthorized Changes (Console)
Manually add SSH ingress rule through AWS Console (simulating developer debugging access that wasn’t removed).

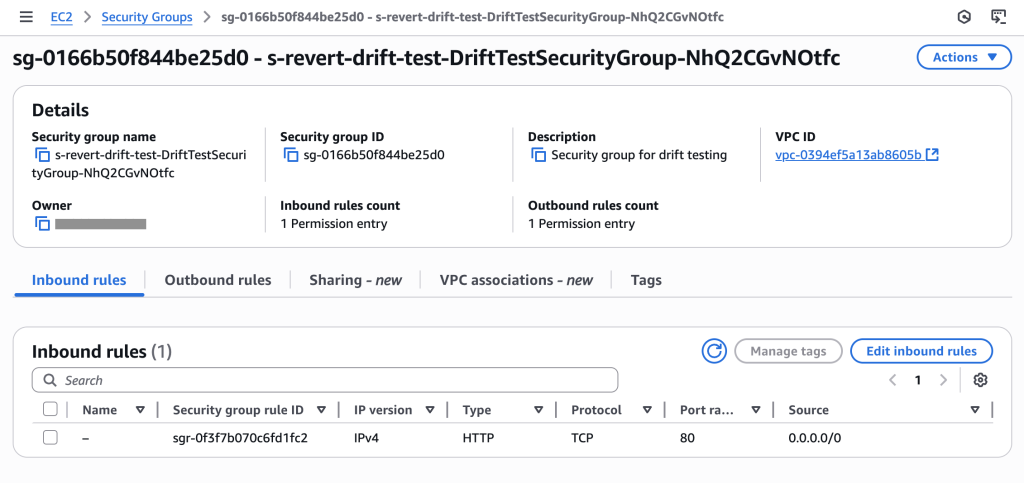
Initial security group showing only HTTP (port 80) access as configured in template – compliant state

Security group now shows 2 permission entries: SSH (port 22) for specific IP and HTTP (port 80) for all traffic. The SSH rule creates drift and a compliance violation that needs systematic removal.
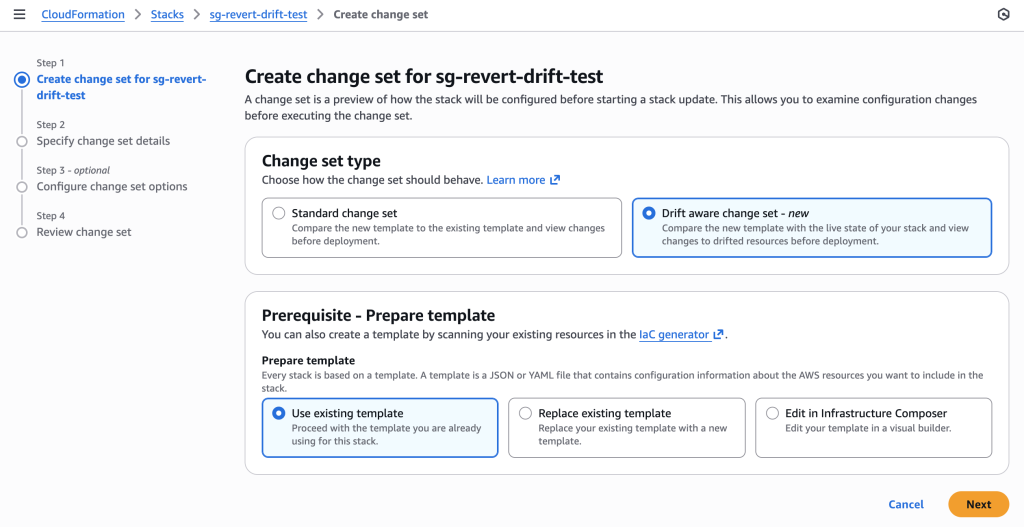
3. Create Drift-Aware Change Set
Create change set using REVERT_DRIFT mode to systematically remove the unauthorized SSH rule.

Creating drift-aware change set for security group compliance restoration. Note the “Drift aware change set” option is selected to compare with live state and detect unauthorized changes.
aws cloudformation create-change-set \
--stack-name sg-revert-drift-test \
--change-set-name revert-ssh-drift \
--use-previous-template \
--deployment-mode REVERT_DRIFT \
--region us-east-1
4. Review Change Set – Systematic Compliance Restoration
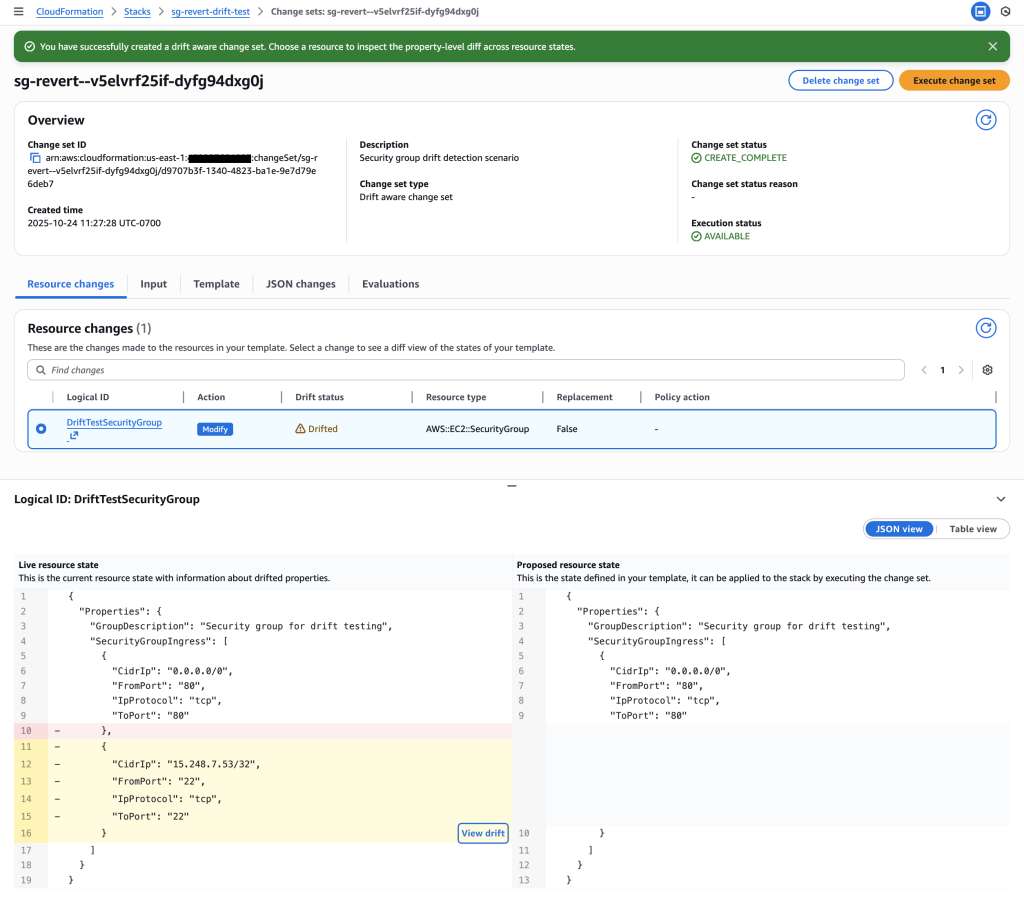
Examine the drift-aware change set to see systematic removal of unauthorized SSH rule.

Compliance violation detected: The drift -aware change set shows that the SSH rule in the live resource state (rule 232 for IP 15.248.7.53/32 on port 22) is not present in the proposed resource state derived from the template. This unauthorized SSH rule violates security policy and will be systematically removed
Key Insight: The drift-aware change set enables systematic compliance restoration by:
- Previous template: Only HTTP (port 80) access – compliant state
- Live resource state: HTTP + SSH (port 22) for 15.248.7.53/32 – compliance violation
- Action: Remove unauthorized SSH rule to restore compliance
This provides a systematic, auditable way to remove unauthorized changes rather than manual cleanup.

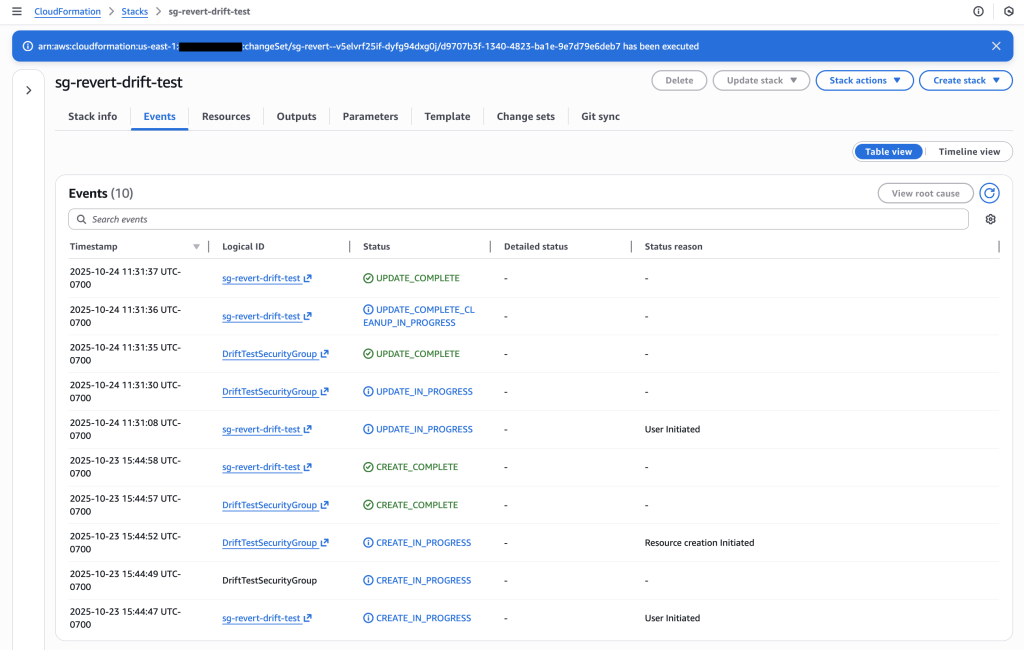
Stack events showing successful execution of the drift-aware change set – SSH rule removed
CloudFormation Templates
security-group-drift-scenario.yaml:
Resources:
  DriftTestSecurityGroup:
    Type: AWS::EC2::SecurityGroup
    Properties:
      GroupDescription: "Security group for drift testing"
      SecurityGroupIngress:
        - IpProtocol: tcp
          FromPort: 80
          ToPort: 80
          CidrIp: 0.0.0.0/0
          Description: "Allow HTTP traffic for demo purposes"
      SecurityGroupEgress:
        - IpProtocol: -1
          CidrIp: 0.0.0.0/0
          Description: "Allow all outbound traffic"
CLI Commands
- Create stack:
aws cloudformation create-stack --stack-name sg-revert-drift-test --template-body file://security-group-drift-scenario.yaml --region us-east-1
- Get security group ID:
aws ec2 describe-security-groups --filters "Name=tag:aws:cloudformation:stack-name,Values=sg-revert-drift-test" --query 'SecurityGroups[0].GroupId' --output text --region us-east-1
- Create drift-aware change set:
aws cloudformation create-change-set --stack-name sg-revert-drift-test --change-set-name revert-ssh-drift --template-body file://security-group-drift-scenario.yaml --deployment-mode REVERT_DRIFT --region us-east-1
- Describe change set:
aws cloudformation describe-change-set --change-set-name revert-ssh-drift --stack-name sg-revert-drift-test --region us-east-1
Scenario 3: Recreate Deleted Resources
This scenario demonstrates drift detection when a dependent resource (logs bucket) is accidentally deleted outside of CloudFormation during troubleshooting. The main application bucket depends on this logs bucket for access logging. You need to recreate the deleted resource while maintaining the existing infrastructure dependencies.
Story: Your team deploys a main S3 bucket with a dependent logs bucket for access logging via CloudFormation. During troubleshooting, an operator accidentally deletes the logs bucket through the AWS Console. The main bucket still exists but its logging configuration now references a non-existent bucket. You need to recreate the deleted logs bucket while maintaining the dependency relationship.
User journey: Create stack with main and logs buckets => Accidentally delete logs bucket => Create drift-aware change set with REVERT_DRIFT mode => Review change set showing LogBucket will be recreated => Execute change set to restore deleted resource
Scenario Flow
1. Create Stack
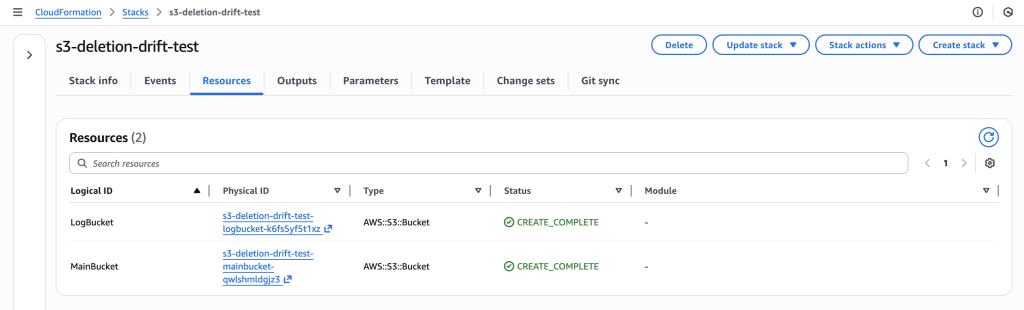
Deploy CloudFormation stack with main S3 bucket and dependent logs bucket.

CloudFormation stack “s3-deletion-drift-test” successfully deployed with both LogBucket and MainBucket resources in CREATE_COMPLETE status
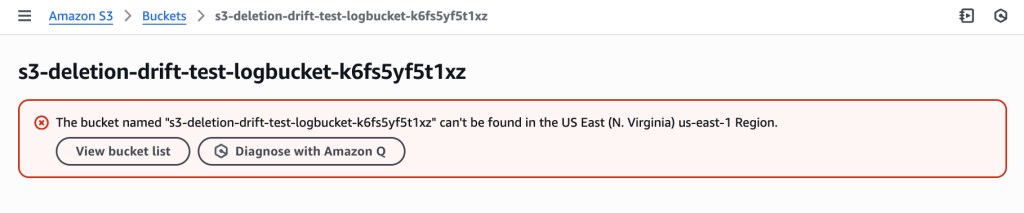
2. Accidental Deletion (Console)
Manually delete the logs bucket through AWS Console (simulating accidental deletion during troubleshooting).

LogBucket accidentally deleted outside of CloudFormation during troubleshooting, creating drift – the MainBucket still exists but its logging configuration now references a non-existent bucket
3. Create Drift-Aware Change Set
Create change set using REVERT_DRIFT mode to recreate the deleted LogBucket.

Creating drift-aware change set with “Drift aware change set” option selected to detect and recreate the deleted resource by comparing template with live state
aws cloudformation create-change-set \
--stack-name s3-deletion-drift-test \
--change-set-name recreate-deleted-bucket \
--use-previous-template \
--deployment-mode REVERT_DRIFT \
--region us-east-1
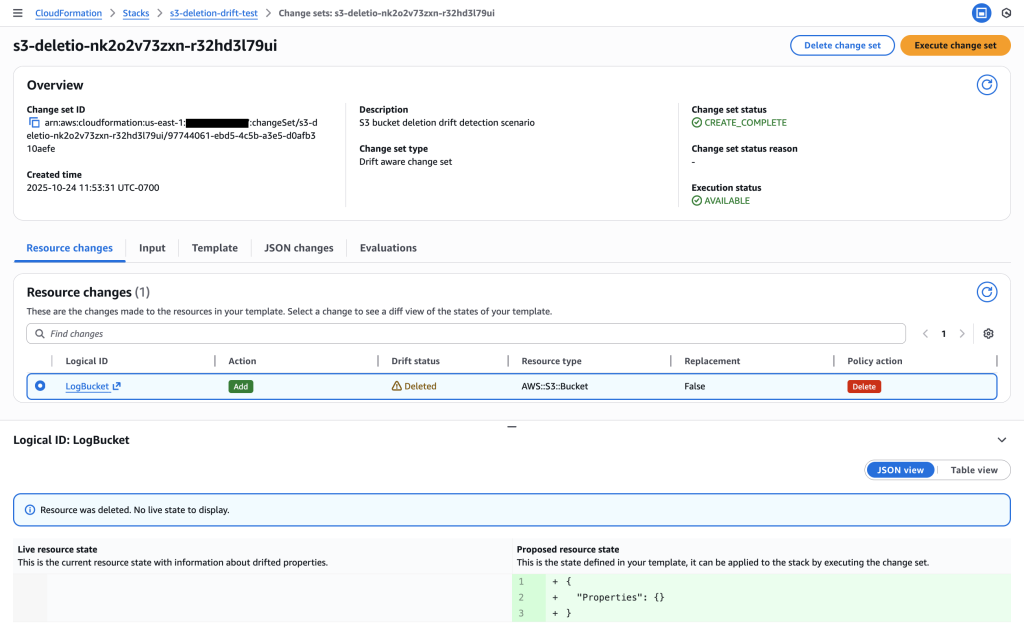
4. Review Change Set – Resource Recreation
Examine change set to see LogBucket recreation while preserving MainBucket dependencies.

Change set preview showing LogBucket will be recreated to restore the deleted resource and MainBucket updated to maintain infrastructure dependencies
Key Insight: The drift-aware change set detects that:
- Template expectation: Both LogBucket and MainBucket should exist
- Live resource state: Only MainBucket exists, LogBucket is missing
- Action: Recreate LogBucket with original configuration to restore logging functionality
This enables systematic recovery of accidentally deleted resources while maintaining infrastructure dependencies.
CloudFormation Templates
s3-drift-scenario.yaml:
Resources:
  LogBucket:
    Type: AWS::S3::Bucket
    Properties:
      BucketEncryption:
        ServerSideEncryptionConfiguration:
          - ServerSideEncryptionByDefault:
              SSEAlgorithm: AES256
      PublicAccessBlockConfiguration:
        BlockPublicAcls: true
        BlockPublicPolicy: true
        IgnorePublicAcls: true
        RestrictPublicBuckets: true
      VersioningConfiguration:
        Status: Enabled

  MainBucket:
    Type: AWS::S3::Bucket
    Properties:
      BucketEncryption:
        ServerSideEncryptionConfiguration:
          - ServerSideEncryptionByDefault:
              SSEAlgorithm: AES256
      PublicAccessBlockConfiguration:
        BlockPublicAcls: true
        BlockPublicPolicy: true
        IgnorePublicAcls: true
        RestrictPublicBuckets: true
      VersioningConfiguration:
        Status: Enabled
      LoggingConfiguration:
        DestinationBucketName: !Ref LogBucket
CLI Commands
- Create stack:
aws cloudformation create-stack --stack-name s3-deletion-drift-test --template-body file://s3-drift-scenario.yaml --region us-east-1
- Get LogBucket name:
aws cloudformation describe-stack-resources --stack-name s3-deletion-drift-test --logical-resource-id LogBucket --query 'StackResources[0].PhysicalResourceId' --output text --region us-east-1
- Create drift-aware change set:
aws cloudformation create-change-set --stack-name s3-deletion-drift-test --change-set-name recreate-deleted-bucket --template-body file://s3-drift-scenario.yaml --deployment-mode REVERT_DRIFT --region us-east-1
- Describe change set:
aws cloudformation describe-change-set --change-set-name recreate-deleted-bucket --stack-name s3-deletion-drift-test --region us-east-1
Best Practices
When working with drift-aware change sets, consider these best practices:
• Always review three-way comparisons before executing change sets to understand the full impact
• Use REVERT_DRIFT deployment mode when you want to bring resources back to template compliance
• Document emergency changes made outside of CloudFormation to inform future template updates
• Implement change management processes to minimize unauthorized drift
• Regular drift detection helps identify configuration changes before they become problematic
• Test drift-aware change sets in non-production environments first
Cleanup
Important: Execute these cleanup commands promptly after completing the scenarios to avoid incurring unnecessary AWS charges. Resources such as Lambda functions, S3 buckets (even if empty), and security groups may incur costs if left running. Ensure all stacks are successfully deleted by verifying the DELETE_COMPLETE status.
Commands to delete all test resources:
# Scenario 1: Lambda Memory Drift
aws cloudformation delete-stack --stack-name lambda-memory-drift-test --region us-east-1

# Scenario 2: Security Group Drift
aws cloudformation delete-stack --stack-name sg-revert-drift-test --region us-east-1

# Scenario 3: S3 Bucket Deletion Drift
aws cloudformation delete-stack --stack-name s3-deletion-drift-test --region us-east-1

# Verify all stacks are deleted
aws cloudformation list-stacks --stack-status-filter DELETE_COMPLETE --region us-east-1
Note: CloudFormation will automatically clean up all resources created by the stacks, including Lambda functions, security groups, and S3 buckets.
Conclusion
Drift-aware change sets enable you to mitigate the operational and security risks of configuration drift, allowing you to confidently automate and govern your infrastructure updates with CloudFormation. Through the scenarios described in this post, you have seen how you can leverage drift-aware change sets to prevent outages in production environments, maintain the integrity of your test environments, and manage the compliance posture of all environments. Remember to thoroughly review the infrastructure changes previewed by drift-aware change sets before executing deployments.
Available Now
Drift-aware change sets are available in AWS Regions where CloudFormation is available. Please refer to the AWS Region table to learn more.


 Never expose your keys publicly!


 Sid Vantair is a Solutions Architect with AWS covering Strategic accounts. He thrives on resolving complex technical issues to overcome customer hurdles. Outside of work, he cherishes spending time with his family and fostering inquisitiveness in his children.