Post Syndicated from Dipankar Kushari original https://aws.amazon.com/blogs/big-data/automate-notifications-on-slack-for-amazon-redshift-query-monitoring-rule-violation/
In this post, we walk you through how to set up automatic notifications of query monitoring rule (QMR) violations in Amazon Redshift to a Slack channel, so that Amazon Redshift users can take timely action.
Amazon Redshift is a fully managed, petabyte-scale data warehouse service in the cloud. With Amazon Redshift, you can analyze your data to derive holistic insights about your business and your customers. One of the challenges is to protect the data warehouse workload from poorly written queries that can consume significant resources. Amazon Redshift query monitoring rules are a feature of workload management (WLM) that allow automatic handling of poorly written queries. Rules that are applied to a WLM queue allow queries to be logged, canceled, hopped (only available with manual WLM), or to change priority (only available with automatic WLM). The reason to use QMRs is to protect against wasteful use of the cluster. You can also use these rules to log resource-intensive queries, which provides the opportunity to establish governance for ad hoc workloads.
The Amazon Redshift cluster automatically collects query monitoring rules metrics. This convenient mechanism lets you view attributes like the following:
- Query runtime, in seconds
- Query return row count
- The CPU time for a SQL statement
It also makes Amazon Redshift Spectrum metrics available, such as the number of Redshift Spectrum rows and MBs scanned by a query.
When a query violates a QMR, Amazon Redshift logs the violation into the STL_WLM_RULE_ACTION system view. If the action is aborted for the queries that violate a QMR, end-users see an error that indicates query failure due to violation of QMRs. We recommend that administrative team members periodically examine violations listed in the STL_WLM_RULE_ACTION table and coach the involved end-users on how to avoid future rule violations.
Alternately, a centralized team, using a Slack channel for collaboration and monitoring, can configure Amazon Redshift events and alarms to be sent to their channel, so that they can take timely action. In the following sections, we walk you through how to set up automatic notifications of QMR violations to a Slack channel through the use of Slack events and alarms. This allows Amazon Redshift users to be notified and take timely actions without the need to query the system view.
Solution overview
To demonstrate how you can receive automatic notification to a Slack channel for QMR violation, we have designed the following architecture. As shown in the following diagram, we have mixed workload extract, transform, and load (ETL), business intelligence (BI) dashboards, and analytics applications that are powered by an Amazon Redshift cluster. The solution relies on AWS Lambda and Amazon Simple Notification Service (Amazon SNS) to send notifications of Amazon Redshift QMR violations to Slack.

To implement this solution, you create an Amazon Redshift cluster and attach a custom defined parameter group.
Amazon Redshift provides one default parameter group for each parameter group family. The default parameter group has preset values for each of its parameters, and it can’t be modified. If you want to use different parameter values than the default parameter group, you must create a custom parameter group and then associate your cluster with it.
In the parameter group, you can use automatic WLM and define a few workload queues, such as a queue for processing ETL workloads and a reporting queue for user queries. You can name the default queue adhoc. With automatic WLM, Amazon Redshift determines the optimal concurrency and memory allocation for each query that is running in each queue.
For each workload queue, you can define one or more QMRs. For example, you can create a rule to abort a user query if it runs for more than 300 seconds or returns more than 1 billion rows. Similarly, you can create a rule to log a Redshift Spectrum query that scans more than 100 MB.
The Amazon Redshift WLM evaluates metrics every 10 seconds. It records details about actions that result from QMR violation that is associated with user-defined queues in the STL_WLM_RULE_ACTION system table. In this solution, a Lambda function is scheduled to monitor the STL_WLM_RULE_ACTION system table every few minutes. When the function is invoked, if it finds a new entry, it publishes a detailed message to an SNS topic. A second Lambda function, created as the target subscriber to the SNS topic, is invoked whenever any message is published to the SNS topic. This second function invokes a pre-created Slack webhook, which sends the message that was received through the SNS topic to the Slack channel of your choice. (For more information on publishing messages by using Slack webhooks, see Sending messages using incoming webhooks.)
To summarize, the solution involves the following steps:
- Create an Amazon Redshift custom parameter group and add workload queues.
- Configure query monitoring rules.
- Attach the custom parameter group to the cluster.
- Create a SNS topic.
- Create a Lambda function and schedule it to run every 5 minutes by using an Amazon EventBridge rule.
- Create the Slack resources.
- Add an incoming webhook and authorize the Slack app to post messages to a Slack channel.
- Create the second Lambda function and subscribe to the SNS topic.
- Test the solution.
Create an Amazon Redshift custom parameter group and add workload queues
In this step, you create an Amazon Redshift custom parameter group with automatic WLM enabled. You also create the following queues to separate the workloads in the parameter group:
- reporting – The
reportingqueue runs BI reporting queries that are performed by any user who belongs to the Amazon Redshift database group namedreporting_group - adhoc – The default queue, renamed
adhoc, performs any query that is not sent to any other queue
Complete the following steps to create your parameter group and add workload queues:
- Create a parameter group, named
csblog, with automatic WLM enabled. - On the Amazon Redshift console, select the custom parameter group you created.
- Choose Edit workload queues.
- On the Modify workload queues page, choose Add queue.
- Fill in the Concurrency scaling mode and Query priority fields as needed to create the
reportingqueue. - Repeat these steps to add the
adhocqueue.
For more information about WLM queues, refer to Configuring workload management.
Configure query monitoring rules
In this step, you add QMRs to each workload queue. For instructions, refer to Creating or modifying a query monitoring rule using the console.
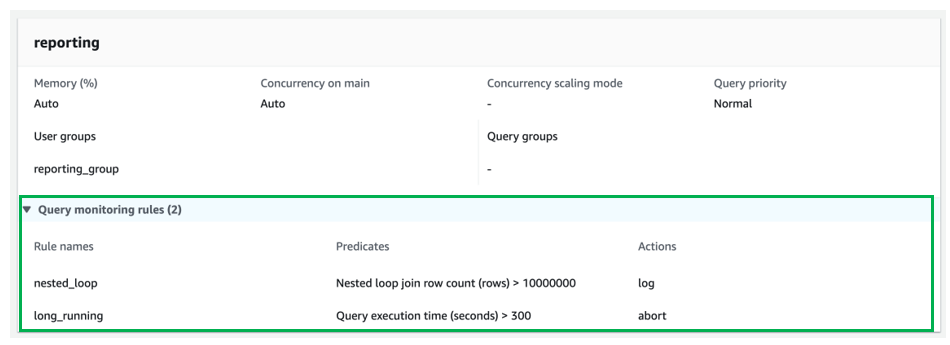
For the reporting queue, add the following QMRs:
- nested_loop – Logs any query involved in a nested loop join that results in a row count more than 10,000,000 rows.
- long_running – Stops queries that run for more than 300 seconds (5 minutes).
For the adhoc queue, add the following QMRs:
- returned_rows – Stops any query that returns more than 1,000,000 rows back to the calling client application (this isn’t practical and can degrade the end-to-end performance of the application).
- spectrum_scan – Stops any query that scans more than 1000 MB of data from an Amazon Simple Storage Service (Amazon S3) data lake by using Redshift Spectrum.

Attach the custom parameter group to the cluster
To attach the custom parameter group to your provisioned Redshift cluster, follow the instructions in Associating a parameter group with a cluster. If you don’t already have a provisioned Redshift cluster, refer to Create a cluster.
For this post, we attached our custom parameter group csblog to an already created provisioned Amazon Redshift cluster.

Create an SNS topic
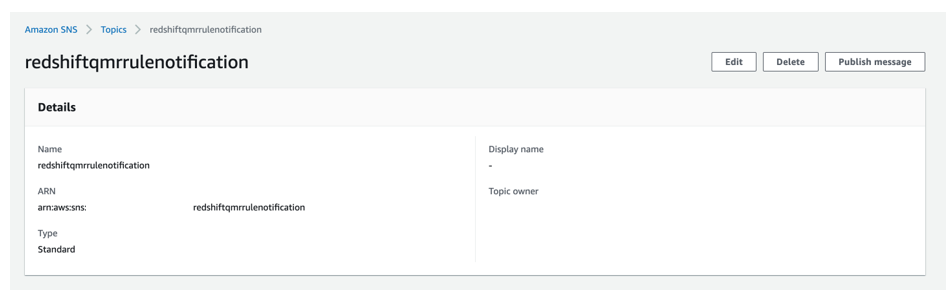
In this step, you create an SNS topic that receives a detailed message of QMR violation from the Lambda function that checks the Amazon Redshift system table for QMR violation entries. For instructions, refer to Creating an Amazon SNS topic.
For this post, we created an SNS topic named redshiftqmrrulenotification.
Create a Lambda function to monitor the system table
In this step, you create a Lambda function that monitors the STL_WLM_RULE_ACTION system table. Whenever any record is found in the table since the last time the function ran, the function publishes a detailed message to the SNS topic that you created earlier. You also create an EventBridge rule to invoke the function every 5 minutes.
For this post, we create a Lambda function named redshiftqmrrule that is scheduled to run every 5 minutes via an EventBridge rule named Redshift-qmr-rule-Lambda-schedule. For instructions, refer to Building Lambda functions with Python.
The following screenshot shows the function that checks the pg_catalog.stl_wlm_rule_action table.

To create an EventBridge rule and associate it with the Lambda function, refer to Create a Rule.
The following screenshot shows the EventBridge rule Redshift-qmr-rule-Lambda-schedule, which calls the function every 5 minutes.

We use the following Python 3.9 code for this Lambda function. The function uses an Amazon Redshift Data API call that uses GetClusterCredentials for temporary credentials.
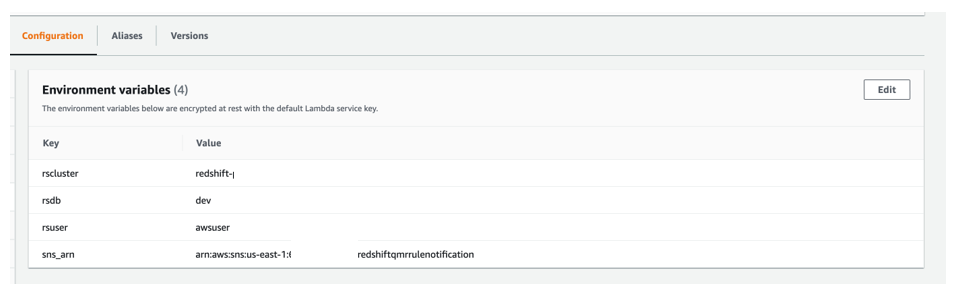
We use four environment variables for this Lambda function:
- rscluster – The Amazon Redshift provisioned cluster identifier
- rsdb – The Amazon Redshift database where you’re running these tests
- rsuser – The Amazon Redshift user who has the privilege to run queries on
pg_catalog.stl_wlm_rule_action - sns_arn – The Amazon Resource Name (ARN) of the SNS topic that we created earlier
Create Slack resources
In this step, you create a new Slack workspace (if you don’t have one already), a new private Slack channel (only if you don’t have one or don’t want to use an existing one), and a new Slack app in the Slack workspace. For instructions, refer to Create a Slack workspace, Create a channel, and Creating an app.
For this post, we created the following resources in the Slack website and Slack desktop app:
- A Slack workspace named
RedshiftQMR*****

- A private channel, named
redshift-qmr-notification-*****-*******, in the newly created Slack workspace

- A new Slack app in the Slack workspace, named
RedshiftQMRRuleNotification(using the From Scratch option)


Add an incoming webhook and authorize Slack app
In this step, you enable and add an incoming webhook to the Slack workspace that you created. For full instructions, refer to Enable Incoming Webhooks and Create an Incoming Webhook. You also authorize your Slack app so that it can post messages to the private Slack channel.
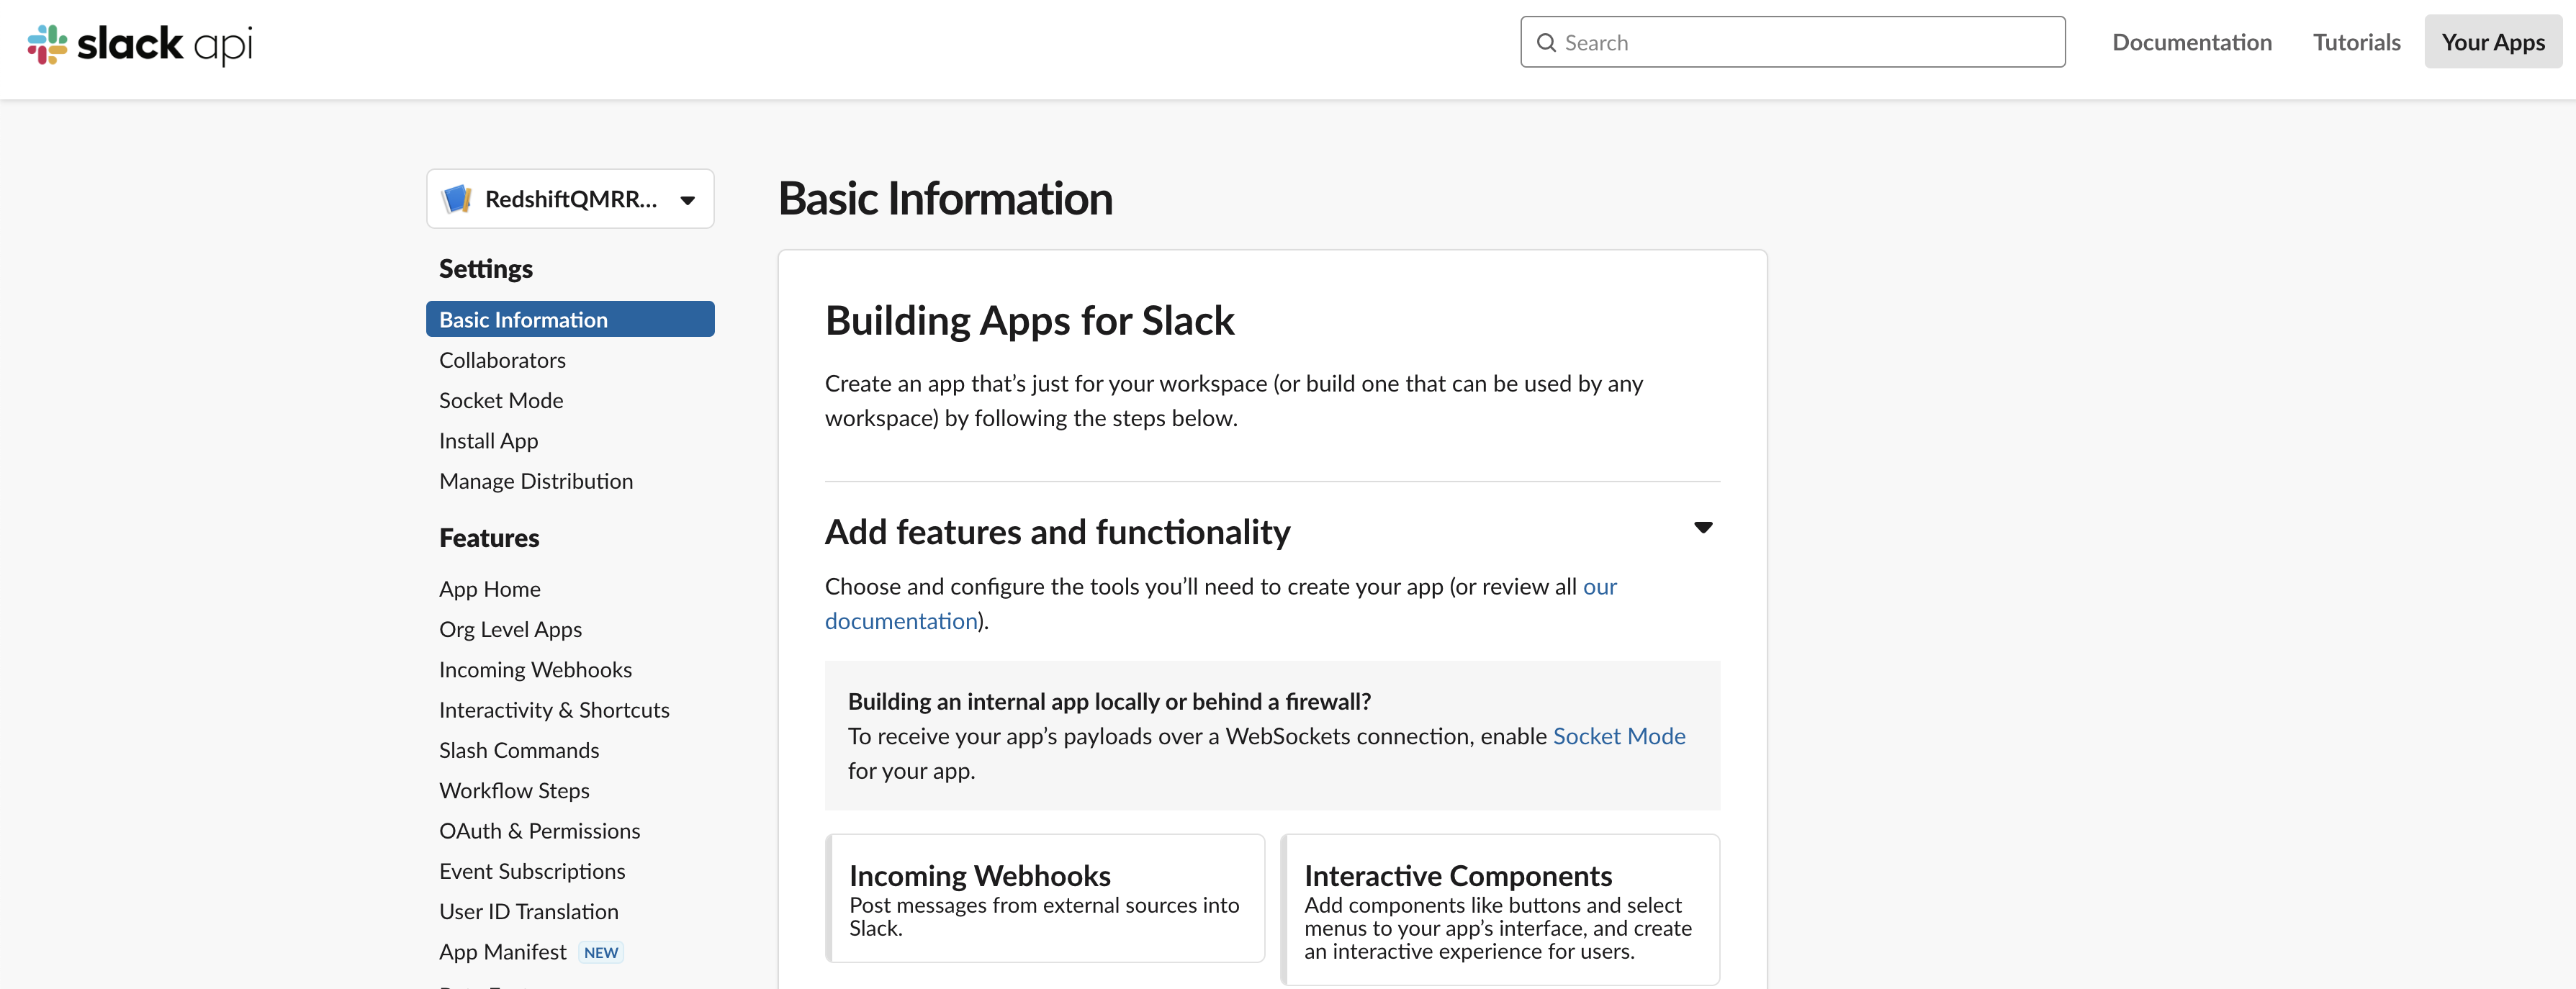
- In the Slack app, under Settings in the navigation pane, choose Basic Information.
- Choose Incoming Webhooks.

- Turn on Activate Incoming Webhooks.

- Choose Add New Webhook to Workspace.
- Authorize the Slack app
RedshiftQMRRuleNotificationso that it can post messages to the private Slack channelredshift-qmr-notification-*****-*******.


The following screenshot shows the details of the newly added incoming webhook.

Create a second Lambda function and subscribe to the SNS topic
In this step, you create a second Lambda function that is subscribed to the SNS topic that you created earlier. For full instructions, refer to Building Lambda functions with Python and Subscribing a function to a topic.
For this post, we create a second function named redshiftqmrrulesnsinvoke, which is subscribed to the SNS topic redshiftqmrrulenotification. The second function sends a detailed QMR violation message (received from the SNS topic) to the designated Slack channel named redshift-qmr-notification-*. This function uses the incoming Slack webhook that we created earlier.

We also create an SNS subscription of the second Lambda function to the SNS topic that we created previously.

The following is the Python 3.9 code used for the second Lambda function:
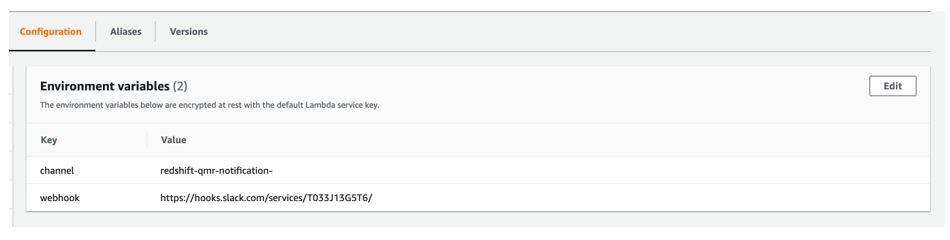
We use two environment variables for the second Lambda function:
- channel – The Slack channel that we created
- webhook – The Slack webhook that we created
Test the solution
To show the effect of the QMRs, we ran queries that violate the QMRs we set up.
Test 1: Returned rows
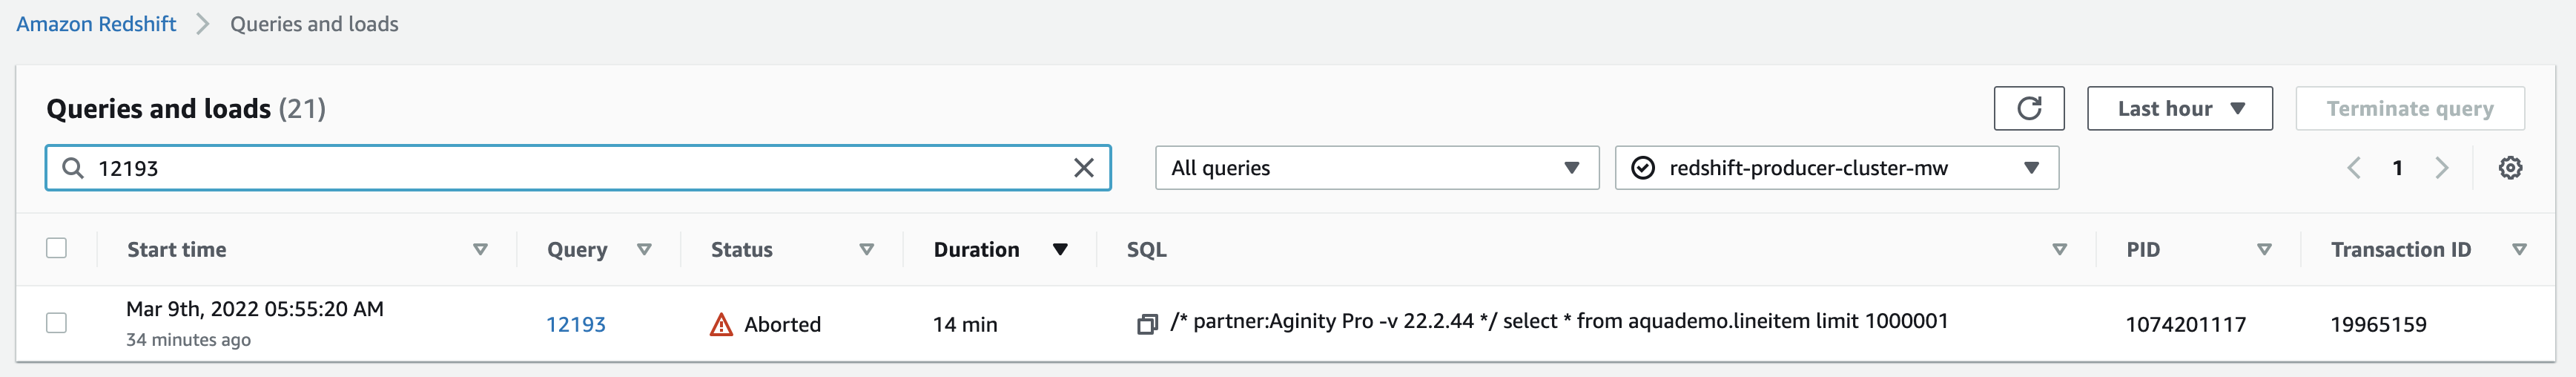
Test 1 looks for violations of the returned_rows QMR, in which the return row count is over 1,000,000 for a query that ran in the adhoc queue.
We created and loaded a table named lineitem in a schema named aquademo, which has more than 18 billion records. You can refer to the GitHub repo to create and load the table.
We ran the following query, which violated the returned_rows QMR, and the query was stopped as specified in the action set in the QMR.
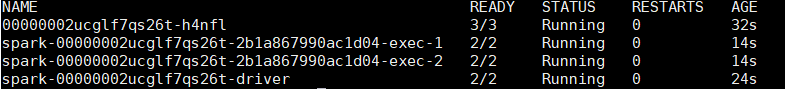
The following screenshot shows the view from the Amazon Redshift client after running the query.

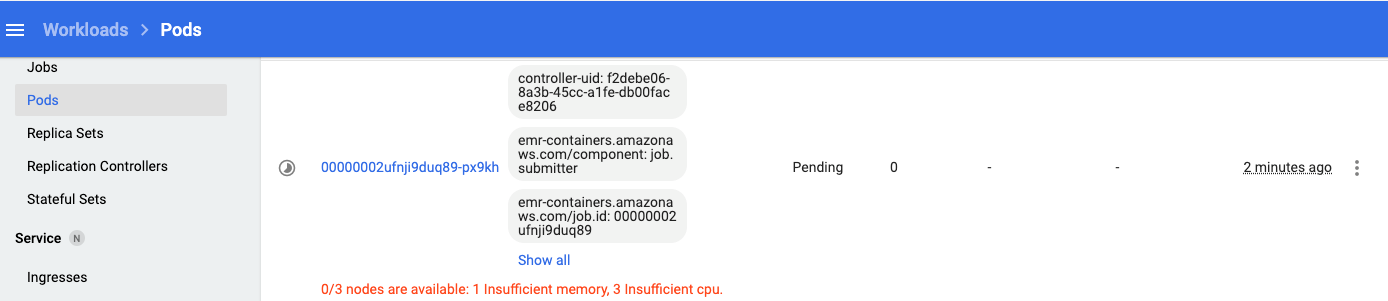
The following screenshot shows the view on the Amazon Redshift console.
The following screenshot shows the notification we received in our Slack channel.

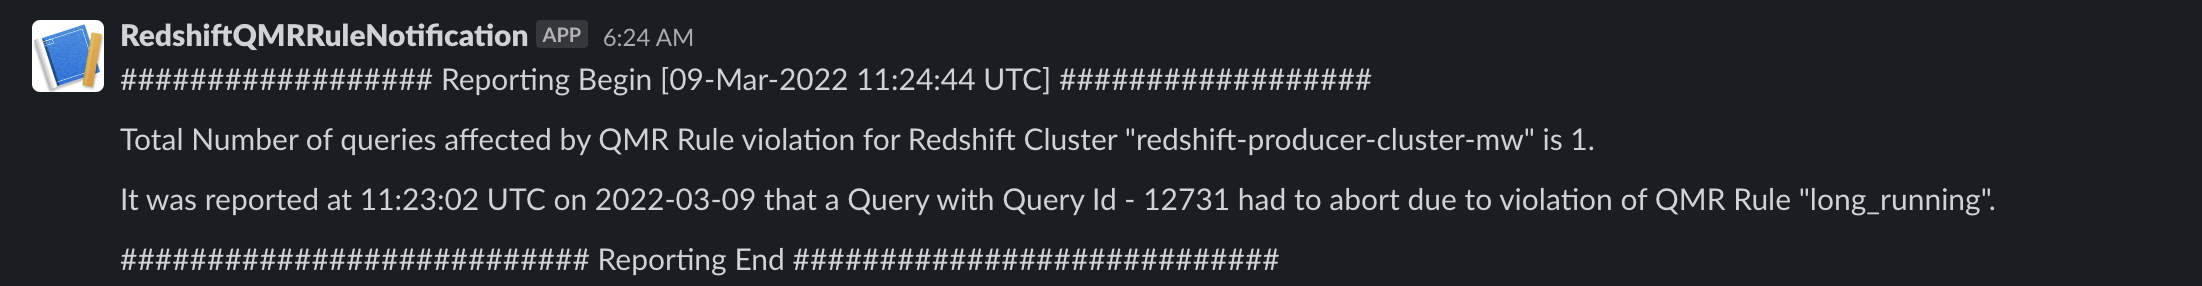
Test 2: Long-running queries
Test 2 looks for violations of the long_running QMR, in which query runtime is over 300 seconds for a user who belongs to reporting_group.
In the following code, we created a new Amazon Redshift group named reporting_group and added a new user, named reporting_user, to the group. reporting_group is assigned USAGE and SELECT privileges on all tables in the retail and aquademo schemas.
We set the session authorization to reporting_user so the query runs in the reporting queue. We ran the following query, which violated the long_running QMR, and the query was stopped as specified in the action set in the QMR:
The following screenshot shows the view from the Amazon Redshift client.

The following screenshot shows the view on the Amazon Redshift console.

The following screenshot shows the notification we received in our Slack channel.
Test 3: Nested loops
Test 3 looks for violations of the nested_loop QMR, in which the nested loop join row count is over 10,000,000 for a user who belongs to reporting_group.
We set the session authorization to reporting_user so the query runs in the reporting queue. We ran the following query, which violated the nested_loop QMR, and the query logged the violation as specified in the action set in the QMR:
Before we ran the original query, we also checked the explain plan and noted that this nested loop will return more than 10,000,000 rows. The following screenshot shows the query explain plan.

The following screenshot shows the notification we received in our Slack channel.

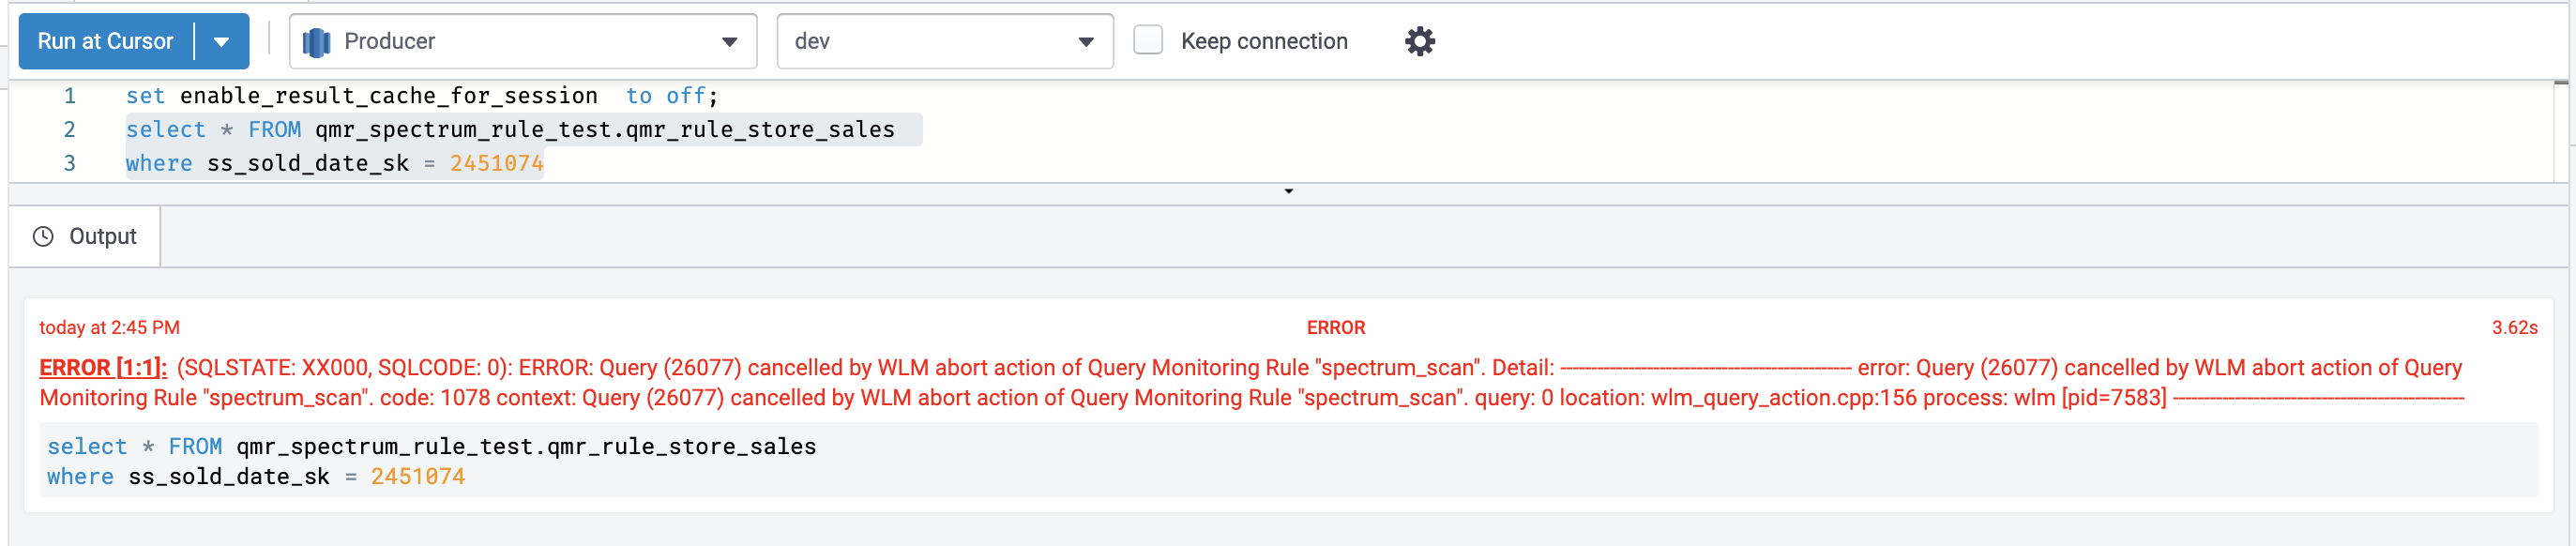
Test 4: Redshift Spectrum scans
Test 4 looks for violations of the spectrum_scan QMR, in which Redshift Spectrum scans exceed 1000 MB for a query that ran in the adhoc queue.
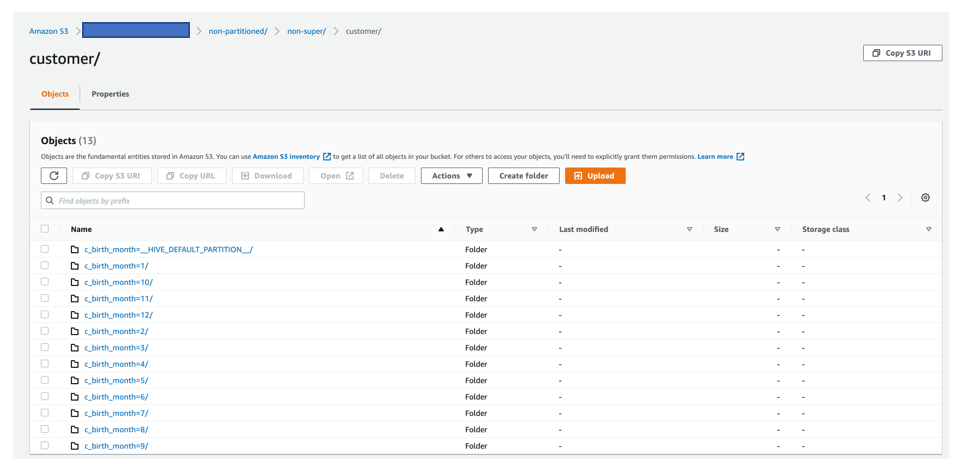
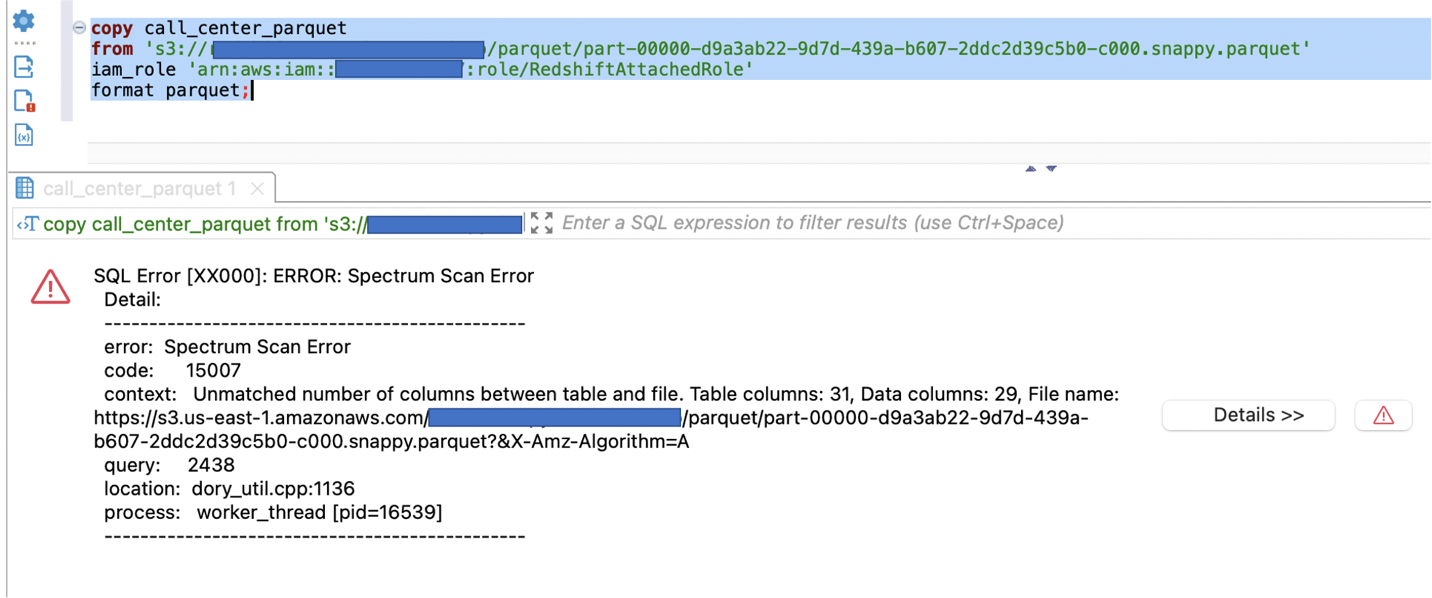
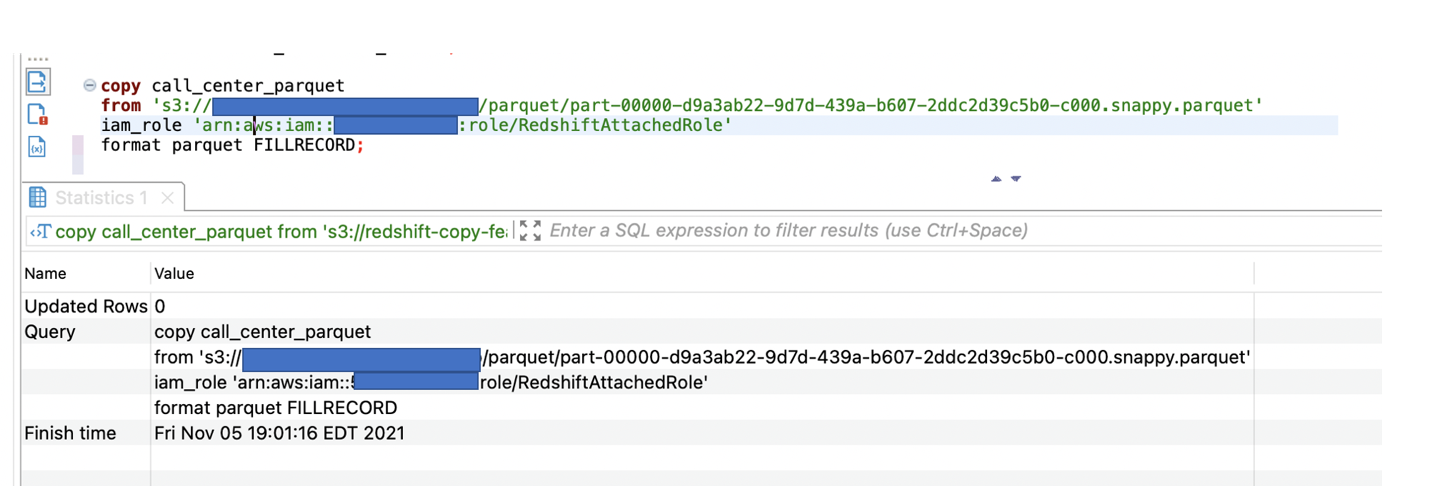
For this example, we used store_sales data (unloaded from an Amazon Redshift table that was created by using the TPC-DS benchmark data) loaded in an Amazon S3 location. Data in Amazon S3 is non-partitioned under one prefix and has a volume around 3.9 GB. We created an external schema (qmr_spectrum_rule_test) and external table (qmr_rule_store_sales) in Redshift Spectrum.
We used the following steps to run this test with the sample data:
- Run an unload SQL command:
- Create an external schema from Redshift Spectrum:
- Create an external table in Redshift Spectrum:
- Run the following query:
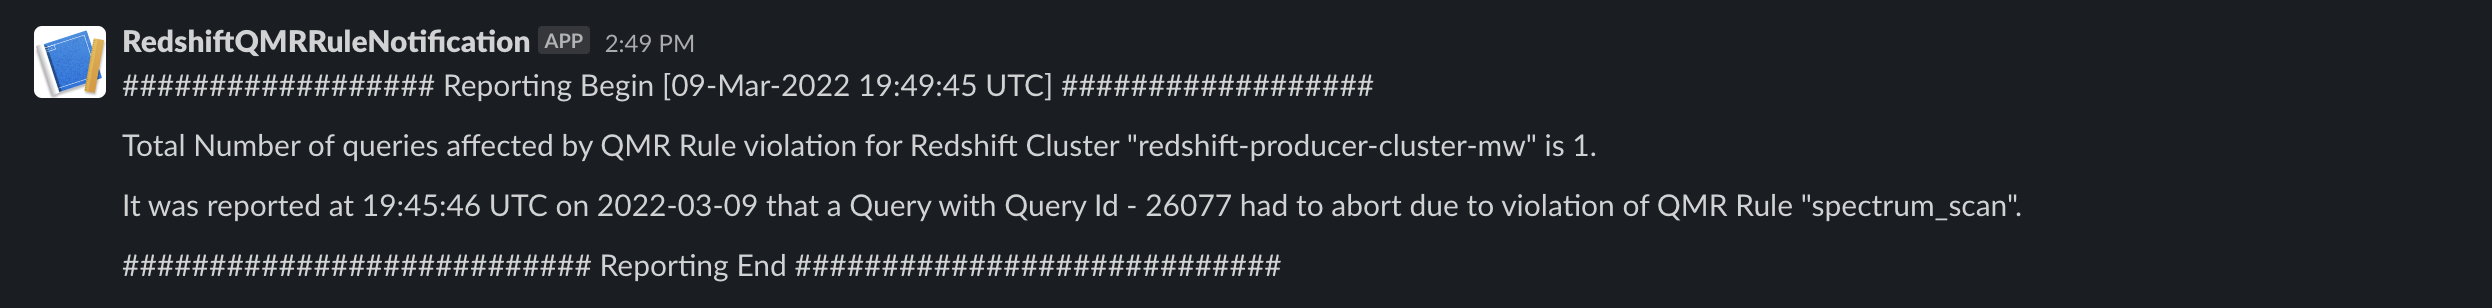
The query violated the spectrum_scan QMR, and the query was stopped as specified in the action set in the QMR.
The following screenshot shows the view from the Amazon Redshift client.
The following screenshot shows the view on the Amazon Redshift console.

The following screenshot shows the notification we received in our Slack channel.
Clean up
When you’re finished with this solution, we recommend deleting the resources you created to avoid incurring any further charges.
Conclusion
Amazon Redshift is a powerful, fully managed data warehouse that can offer significantly increased performance and lower cost in the cloud. In this post, we discussed how you can automate notification of misbehaving queries on Slack by using query monitoring rules. QMRs can help you maximize cluster performance and throughput when supporting mixed workloads. Use these instructions to set up your Slack channel to receive automatic notifications from your Amazon Redshift cluster for any violation of QMRs.
About the Authors
 Dipankar Kushari is a Senior Specialist Solutions Architect in the Analytics team at AWS.
 Harshida Patel is a Specialist Senior Solutions Architect in the Analytics team at AWS.