Tag Archives: Amazon Elastic Kubernetes Service

Set up fine-grained permissions for your data pipeline using MWAA and EKS

Post Syndicated from Ulrich Hinze original https://aws.amazon.com/blogs/big-data/set-up-fine-grained-permissions-for-your-data-pipeline-using-mwaa-and-eks/

This is a guest blog post co-written with Patrick Oberherr from Contentful and Johannes Günther from Netlight Consulting.

This blog post shows how to improve security in a data pipeline architecture based on Amazon Managed Workflows for Apache Airflow (Amazon MWAA) and Amazon Elastic Kubernetes Service (Amazon EKS) by setting up fine-grained permissions, using HashiCorp Terraform for infrastructure as code.

Many AWS customers use Amazon EKS to execute their data workloads. The advantages of Amazon EKS include different compute and storage options depending on workload needs, higher resource utilization by sharing underlying infrastructure, and a vibrant open-source community that provides purpose-built extensions. The Data on EKS project provides a series of templates and other resources to help customers get started on this journey. It includes a description of using Amazon MWAA as a job scheduler.

Contentful is an AWS customer and AWS Partner Network (APN) partner. Behind the scenes of their Software-as-a-Service (SaaS) product, the Contentful Composable Content Platform, Contentful uses insights from data to improve business decision-making and customer experience. Contentful engaged Netlight, an APN consulting partner, to help set up a data platform to gather these insights.

Most of Contentful’s application workloads run on Amazon EKS, and knowledge of this service and Kubernetes is widespread in the organization. That’s why Contentful’s data engineering team decided to run data pipelines on Amazon EKS as well. For job scheduling, they started with a self-operated Apache Airflow on an Amazon EKS cluster and later switched to Amazon MWAA to reduce engineering and operations overhead. The job execution remained on Amazon EKS.

Contentful runs a complex data pipeline using this infrastructure, including ingestion from multiple data sources and different transformation jobs, for example using dbt. The whole pipeline shares a single Amazon MWAA environment and a single Amazon EKS cluster. With a diverse set of workloads in a single environment, it is necessary to apply the principle of least privilege, ensuring that individual tasks or components have only the specific permissions they need to function.

By segmenting permissions according to roles and responsibilities, Contentful’s data engineering team was able to create a more robust and secure data processing environment, which is essential for maintaining the integrity and confidentiality of the data being handled.

In this blog post, we walk through setting up the infrastructure from scratch and deploying a sample application using Terraform, Contentful’s tool of choice for infrastructure as code.

Prerequisites

To follow along this blog post, you need the latest version of the following tools installed:

Overview

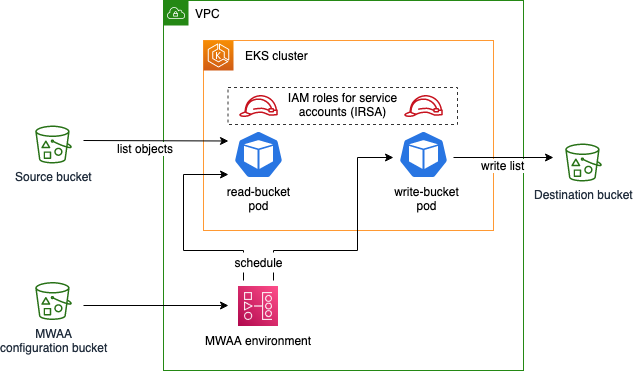
In this blog post, you will create a sample application with the following infrastructure:

Architecture drawing of the sample application deployed in this blog post

The sample Airflow workflow lists objects in the source bucket, temporarily stores this list using Airflow XComs, and writes the list as a file to the destination bucket. This application is executed using Amazon EKS pods, scheduled by an Amazon MWAA environment. You deploy the EKS cluster and the MWAA environment into a virtual private cloud (VPC) and apply least-privilege permissions to the EKS pods using IAM roles for service accounts. The configuration bucket for Amazon MWAA contains runtime requirements, as well as the application code specifying an Airflow Directed Acyclic Graph (DAG).

Initialize the project and create buckets

Create a file main.tf with the following content in an empty directory:

locals {
  region = "us-east-1"
}

provider "aws" {
  region = local.region
}

resource "aws_s3_bucket" "source_bucket" {
  bucket_prefix = "source"
}

resource "aws_s3_object" "dummy_object" {
  bucket  = aws_s3_bucket.source_bucket.bucket
  key     = "dummy.txt"
  content = ""
}

resource "aws_ssm_parameter" "source_bucket" {
  name  = "mwaa_source_bucket"
  type  = "SecureString"
  value = aws_s3_bucket.source_bucket.bucket
}

resource "aws_s3_bucket" "destination_bucket" {
  bucket_prefix = "destination"
  force_destroy = true
}

resource "aws_ssm_parameter" "destination_bucket" {
  name  = "mwaa_destination_bucket"
  type  = "SecureString"
  value = aws_s3_bucket.destination_bucket.bucket
}

This file defines the Terraform AWS provider as well as the source and destination bucket, whose names are exported as AWS Systems Manager parameters. It also tells Terraform to upload an empty object named dummy.txt into the source bucket, which enables the Airflow sample application we will create later to receive a result when listing bucket content.

Initialize the Terraform project and download the module dependencies by issuing the following command:

terraform init

Create the infrastructure:

terraform apply

Terraform asks you to acknowledge changes to the environment and then starts deploying resources in AWS. Upon successful deployment, you should see the following success message:

Apply complete! Resources: 5 added, 0 changed, 0 destroyed.

Create VPC

Create a new file vpc.tf in the same directory as main.tf and insert the following:

data "aws_availability_zones" "available" {}

locals {
  cidr = "10.0.0.0/16"
  azs  = slice(data.aws_availability_zones.available.names, 0, 3)
}

module "vpc" {
  name               = "data-vpc"
  source             = "terraform-aws-modules/vpc/aws"
  version            = "~> 4.0"
  cidr               = local.cidr
  azs                = local.azs
  public_subnets     = [for k, v in local.azs : cidrsubnet(local.cidr, 8, k + 48)]
  private_subnets    = [for k, v in local.azs : cidrsubnet(local.cidr, 4, k)]
  enable_nat_gateway = true
}

This file defines the VPC, a virtual network, that will later host the Amazon EKS cluster and the Amazon MWAA environment. Note that we use an existing Terraform module for this, which wraps configuration of underlying network resources like subnets, route tables, and NAT gateways.

Download the VPC module:

terraform init

Deploy the new resources:

terraform apply

Note which resources are being created. By using the VPC module in our Terraform file, much of the underlying complexity is taken away when defining our infrastructure, but it’s still useful to know what exactly is being deployed.

Note that Terraform now handles resources we defined in both files, main.tf and vpc.tf, because Terraform includes all .tf files in the current working directory.

Create the Amazon MWAA environment

Create a new file mwaa.tf and insert the following content:

locals {
  requirements_filename = "requirements.txt"
  airflow_version       = "2.6.3"
  requirements_content  = <<EOT
apache-airflow[cncf.kubernetes]==${local.airflow_version}
EOT
}

module "mwaa" {
  source = "github.com/aws-ia/terraform-aws-mwaa?ref=1066050"

  name              = "mwaa"
  airflow_version   = local.airflow_version
  environment_class = "mw1.small"

  vpc_id             = module.vpc.vpc_id
  private_subnet_ids = slice(module.vpc.private_subnets, 0, 2)

  webserver_access_mode = "PUBLIC_ONLY"

  requirements_s3_path = local.requirements_filename
}

resource "aws_s3_object" "requirements" {
  bucket  = module.mwaa.aws_s3_bucket_name
  key     = local.requirements_filename
  content = local.requirements_content

  etag = md5(local.requirements_content)
}

Like before, we use an existing module to save configuration effort for the Amazon MWAA environment. The module also creates the configuration bucket, which we use to specify the runtime dependency of the application (apache-airflow-cncf-kubernetes) in the requirements.txt file. This package, in combination with the preinstalled package apache-airflow-amazon, enables interaction with Amazon EKS.

Download the MWAA module:

terraform init

Deploy the new resources:

terraform apply

This operation takes 20–30 minutes to complete.

Create the Amazon EKS cluster

Create a file eks.tf with the following content:

module "cluster" {
  source = "github.com/aws-ia/terraform-aws-eks-blueprints?ref=8a06a6e"

  cluster_name    = "data-cluster"
  cluster_version = "1.27"

  vpc_id             = module.vpc.vpc_id
  private_subnet_ids = module.vpc.private_subnets
  enable_irsa        = true

  managed_node_groups = {
    node_group = {
      node_group_name = "node-group"
      desired_size    = 1
    }
  }
  application_teams = {
    mwaa = {}
  }

  map_roles = [{
    rolearn  = module.mwaa.mwaa_role_arn
    username = "mwaa-executor"
    groups   = []
  }]
}

data "aws_eks_cluster_auth" "this" {
  name = module.cluster.eks_cluster_id
}

provider "kubernetes" {
  host                   = module.cluster.eks_cluster_endpoint
  cluster_ca_certificate = base64decode(module.cluster.eks_cluster_certificate_authority_data)
  token                  = data.aws_eks_cluster_auth.this.token
}

resource "kubernetes_role" "mwaa_executor" {
  metadata {
    name      = "mwaa-executor"
    namespace = "mwaa"
  }

  rule {
    api_groups = [""]
    resources  = ["pods", "pods/log", "pods/exec"]
    verbs      = ["get", "list", "create", "patch", "delete"]
  }
}

resource "kubernetes_role_binding" "mwaa_executor" {
  metadata {
    name      = "mwaa-executor"
    namespace = "mwaa"
  }
  role_ref {
    api_group = "rbac.authorization.k8s.io"
    kind      = "Role"
    name      = kubernetes_role.mwaa_executor.metadata[0].name
  }
  subject {
    kind      = "User"
    name      = "mwaa-executor"
    api_group = "rbac.authorization.k8s.io"
  }
}

output "configure_kubectl" {
  description = "Configure kubectl: make sure you're logged in with the correct AWS profile and run the following command to update your kubeconfig"
  value       = "aws eks --region ${local.region} update-kubeconfig --name ${module.cluster.eks_cluster_id}"
}

To create the cluster itself, we take advantage of the Amazon EKS Blueprints for Terraform project. We also define a managed node group with one node as the target size. Note that in cases with fluctuating load, scaling your cluster with Karpenter instead of the managed node group approach shown above makes the cluster scale more flexibly. We used managed node groups primarily because of the ease of configuration.

We define the identity that the Amazon MWAA execution role assumes in Kubernetes using the map_roles variable. After configuring the Terraform Kubernetes provider, we give the Amazon MWAA execution role permissions to manage pods in the cluster.

Download the EKS Blueprints for Terraform module:

terraform init

Deploy the new resources:

terraform apply

This operation takes about 12 minutes to complete.

Create IAM roles for service accounts

Create a file roles.tf with the following content:

data "aws_iam_policy_document" "source_bucket_reader" {
  statement {
    actions   = ["s3:ListBucket"]
    resources = ["${aws_s3_bucket.source_bucket.arn}"]
  }
  statement {
    actions   = ["ssm:GetParameter"]
    resources = [aws_ssm_parameter.source_bucket.arn]
  }
}

resource "aws_iam_policy" "source_bucket_reader" {
  name   = "source_bucket_reader"
  path   = "/"
  policy = data.aws_iam_policy_document.source_bucket_reader.json
}

module "irsa_source_bucket_reader" {
  source = "github.com/aws-ia/terraform-aws-eks-blueprints//modules/irsa"

  eks_cluster_id              = module.cluster.eks_cluster_id
  eks_oidc_provider_arn       = module.cluster.eks_oidc_provider_arn
  irsa_iam_policies           = [aws_iam_policy.source_bucket_reader.arn]
  kubernetes_service_account  = "source-bucket-reader-sa"
  kubernetes_namespace        = "mwaa"
  create_kubernetes_namespace = false
}

data "aws_iam_policy_document" "destination_bucket_writer" {
  statement {
    actions   = ["s3:PutObject"]
    resources = ["${aws_s3_bucket.destination_bucket.arn}/*"]
  }
  statement {
    actions   = ["ssm:GetParameter"]
    resources = [aws_ssm_parameter.destination_bucket.arn]
  }
}

resource "aws_iam_policy" "destination_bucket_writer" {
  name   = "irsa_destination_bucket_writer"
  policy = data.aws_iam_policy_document.destination_bucket_writer.json
}

module "irsa_destination_bucket_writer" {
  source = "github.com/aws-ia/terraform-aws-eks-blueprints//modules/irsa"

  eks_cluster_id              = module.cluster.eks_cluster_id
  eks_oidc_provider_arn       = module.cluster.eks_oidc_provider_arn
  irsa_iam_policies           = [aws_iam_policy.destination_bucket_writer.arn]
  kubernetes_service_account  = "destination-bucket-writer-sa"
  kubernetes_namespace        = "mwaa"
  create_kubernetes_namespace = false
}

This file defines two Kubernetes service accounts, source-bucket-reader-sa and destination-bucket-writer-sa, and their permissions against the AWS API, using IAM roles for service accounts (IRSA). Again, we use a module from the Amazon EKS Blueprints for Terraform project to simplify IRSA configuration. Note that both roles only get the minimum permissions that they need, defined using AWS IAM policies.

Download the new module:

terraform init

Deploy the new resources:

terraform apply

Create the DAG

Create a file dag.py defining the Airflow DAG:

from datetime import datetime

from airflow import DAG
from airflow.providers.amazon.aws.operators.eks import EksPodOperator

dag = DAG(
    "dag_with_fine_grained_permissions",
    description="DAG with fine-grained permissions",
    default_args={
        "cluster_name": "data-cluster",
        "namespace": "mwaa",
        "get_logs": True,
        "is_delete_operator_pod": True,
    },
    schedule="@hourly",
    start_date=datetime(2023, 1, 1),
    catchup=False,
)

read_bucket = EksPodOperator(
    task_id="read-bucket",
    pod_name="read-bucket",
    service_account_name="source-bucket-reader-sa",
    image="amazon/aws-cli:latest",
    cmds=[
        "sh",
        "-xc",
        "aws s3api list-objects --output json --bucket $(aws ssm get-parameter --name mwaa_source_bucket --with-decryption --query 'Parameter.Value' --output text)  > /airflow/xcom/return.json",
    ],
    do_xcom_push=True,
    dag=dag,
)

write_bucket = EksPodOperator(
    task_id="write-bucket",
    pod_name="write-bucket",
    service_account_name="destination-bucket-writer-sa",
    image="amazon/aws-cli:latest",
    cmds=[
        "sh",
        "-xc",
        "echo '{{ task_instance.xcom_pull('read-bucket')|tojson }}' > list.json; aws s3 cp list.json s3://$(aws ssm get-parameter --name mwaa_destination_bucket  --with-decryption --query 'Parameter.Value' --output text)",
    ],
    dag=dag,
)

read_bucket >> write_bucket

The DAG is defined to run on an hourly schedule, with two tasks read_bucket with service account source-bucket-reader-sa and write_bucket with service account destination-bucket-writer-sa, running after one another. Both are run using the EksPodOperator, which is responsible for scheduling the tasks on Amazon EKS, using the AWS CLI Docker image to run commands. The first task lists files in the source bucket and writes the list to Airflow XCom. The second task reads the list from XCom and stores it in the destination bucket. Note that the service_account_name parameter differentiates what each task is permitted to do.

Create a file dag.tf to upload the DAG code to the Amazon MWAA configuration bucket:

locals {
  dag_filename = "dag.py"
}

resource "aws_s3_object" "dag" {
  bucket = module.mwaa.aws_s3_bucket_name
  key    = "dags/${local.dag_filename}"
  source = local.dag_filename

  etag = filemd5(local.dag_filename)
}

Deploy the changes:

terraform apply

The Amazon MWAA environment automatically imports the file from the S3 bucket.

Run the DAG

In your browser, navigate to the Amazon MWAA console and select your environment. In the top right-hand corner, select Open Airflow UI . You should see the following:

Screenshot of the MWAA user interface

To trigger the DAG, in the Actions column, select the play symbol and then select Trigger DAG. Click on the DAG name to explore the DAG run and its results.

Navigate to the Amazon S3 console and choose the bucket starting with “destination”. It should contain a file list.json recently created by the write_bucket task. Download the file to explore its content, a JSON list with a single entry.

Clean up

The resources you created in this walkthrough incur AWS costs. To delete the created resources, issue the following command:

terraform destroy

And approve the changes in the Terraform CLI dialog.

Conclusion

In this blog post, you learned how to improve the security of your data pipeline running on Amazon MWAA and Amazon EKS by narrowing the permissions of each individual task.

To dive deeper, use the working example created in this walkthrough to explore the topic further: What happens if you remove the service_account_name parameter from an Airflow task? What happens if you exchange the service account names in the two tasks?

For simplicity, in this walkthrough we used a flat file structure with Terraform and Python files inside a single directory. We did not adhere to the standard module structure proposed by Terraform, which is generally recommended. In a real-life project, splitting up the project into multiple Terraform projects or modules may also increase flexibility, speed, and independence between teams owning different parts of the infrastructure.

Lastly, make sure to study the Data on EKS documentation, which provides other valuable resources for running your data pipeline on Amazon EKS, as well as the Amazon MWAA and Apache Airflow documentation for implementing your own use cases. Specifically, have a look at this sample implementation of a Terraform module for Amazon MWAA and Amazon EKS, which contains a more mature approach to Amazon EKS configuration and node automatic scaling, as well as networking.

If you have any questions, you can start a new thread on AWS re:Post or reach out to AWS Support.


About the Authors

Ulrich Hinze is a Solutions Architect at AWS. He partners with software companies to architect and implement cloud-based solutions on AWS. Before joining AWS, he worked for AWS customers and partners in software engineering, consulting, and architecture roles for 8+ years.

Patrick Oberherr is a Staff Data Engineer at Contentful with 4+ years of working with AWS and 10+ years in the Data field. At Contentful he is responsible for infrastructure and operations of the data stack which is hosted on AWS.

Johannes Günther is a cloud & data consultant at Netlight with 5+ years of working with AWS. He has helped clients across various industries designing sustainable cloud platforms and is AWS certified.

Let’s Architect! Security in software architectures

Post Syndicated from Luca Mezzalira original https://aws.amazon.com/blogs/architecture/lets-architect-security-in-software-architectures/

Security is fundamental for each product and service you are building with. Whether you are working on the back-end or the data and machine learning components of a system, the solution should be securely built.

In 2022, we discussed security in our post Let’s Architect! Architecting for Security. Today, we take a closer look at general security practices for your cloud workloads to secure both networks and applications, with a mix of resources to show you how to architect for security using the services offered by Amazon Web Services (AWS).

In this edition of Let’s Architect!, we share some practices for protecting your workloads from the most common attacks, introduce the Zero Trust principle (you can learn how AWS itself is implementing it!), plus how to move to containers and/or alternative approaches for managing your secrets.

A deep dive on the current security threat landscape with AWS

This session from AWS re:Invent, security engineers guide you through the most common threat vectors and vulnerabilities that AWS customers faced in 2022. For each possible threat, you can learn how it’s implemented by attackers, the weaknesses attackers tend to leverage, and the solutions offered by AWS to avert these security issues. We describe this as fundamental architecting for security: this implies adopting suitable services to protect your workloads, as well as follow architectural practices for security.

Take me to this re:Invent 2022 session!

Statistics about common attacks and how they can be launched

Statistics about common attacks and how they can be launched

Zero Trust: Enough talk, let’s build better security

What is Zero Trust? It is a security model that produces higher security outcomes compared with the traditional network perimeter model.

How does Zero Trust work in practice, and how can you start adopting it? This AWS re:Invent 2022 session defines the Zero Trust models and explains how to implement one. You can learn how it is used within AWS, as well as how any architecture can be built with these pillars in mind. Furthermore, there is a practical use case to show you how Delphix put Zero Trust into production.

Take me to this re:Invent 2022 session!

AWS implements the Zero Trust principle for managing interactions across different services

AWS implements the Zero Trust principle for managing interactions across different services

A deep dive into container security on AWS

Nowadays, it’s vital to have a thorough understanding of a container’s underlying security layers. AWS services, like Amazon Elastic Kubernetes Service and Amazon Elastic Container Service, have harnessed these Linux security-layer protections, keeping a sharp focus on the principle of least privilege. This approach significantly minimizes the potential attack surface by limiting the permissions and privileges of processes, thus upholding the integrity of the system.

This re:Inforce 2023 session discusses best practices for securing containers for your distributed systems.

Take me to this re:Inforce 2023 session!

Fundamentals and best practices to secure containers

Fundamentals and best practices to secure containers

Migrating your secrets to AWS Secrets Manager

Secrets play a critical role in providing access to confidential systems and resources. Ensuring the secure and consistent management of these secrets, however, presents a challenge for many organizations.

Anti-patterns observed in numerous organizational secrets management systems include sharing plaintext secrets via unsecured means, such as emails or messaging apps, which can allow application developers to view these secrets in plaintext or even neglect to rotate secrets regularly. This detailed guidance walks you through the steps of discovering and classifying secrets, plus explains the implementation and migration processes involved in transferring secrets to AWS Secrets Manager.

Take me to this AWS Security Blog post!

An organization's perspectives and responsibilities when building a secrets management solution

An organization’s perspectives and responsibilities when building a secrets management solution

Conclusion

We’re glad you joined our conversation on building secure architectures! Join us in a couple of weeks when we’ll talk about cost optimization on AWS.

To find all the blogs from this series, visit the Let’s Architect! list of content on the AWS Architecture Blog.

AWS Cloud service considerations for designing multi-tenant SaaS solutions

Post Syndicated from Dennis Greene original https://aws.amazon.com/blogs/architecture/aws-cloud-service-considerations-for-designing-multi-tenant-saas-solutions/

An increasing number of software as a service (SaaS) providers are considering the move from single to multi-tenant to utilize resources more efficiently and reduce operational costs. This blog aims to inform customers of considerations when evaluating a transformation to multi-tenancy in the Amazon Web Services (AWS) Cloud. You’ll find valuable information on how to optimize your cloud-based SaaS design to reduce operating expenses, increase resiliency, and offer a high-performing experience for your customers.

Single versus multi-tenancy

In a multi-tenant architecture, resources like compute, storage, and databases can be shared among independent tenants. In contrast, a single-tenant architecture allocates exclusive resources to each tenant.

Let’s consider a SaaS product that needs to support many customers, each with their own independent deployed website. Using a single-tenant model (see Figure 1), the SaaS provider may opt to utilize a dedicated AWS account to host each tenant’s workloads. To contain their respective workloads, each tenant would have their own Amazon Elastic Compute Cloud (Amazon EC2) instances organized within an Auto Scaling group. Access to the applications running in these EC2 instances would be done via an Application Load Balancer (ALB). Each tenant would be allocated their own database environment using Amazon Relational Database Service (RDS). The website’s storage (consisting of PHP, JavaScript, CSS, and HTML files) would be provided by Amazon Elastic Block Store (EBS) volumes attached to the EC2 instances. The SaaS provider would have a control plane AWS account used to create and modify these tenant-specific accounts.

Single-tenant configuration

Figure 1. Single-tenant configuration

To transition to a multi-tenant pattern, the SaaS provider can use containerization to package each website, and a container orchestrator to deploy the websites across shared compute nodes (EC2 instances). Kubernetes can be employed as a container orchestrator, and a website would then be represented by a Kubernetes deployment and its associated pods. A Kubernetes namespace would serve as the logical encapsulation of the tenant-specific resources, as each tenant would be mapped to one Kubernetes namespace. The Kubernetes HorizontalPodAutoscaler can be utilized for autoscaling purposes, dynamically adjusting the number of replicas in the deployment on a given namespace based on workload demands.

When additional compute resources are required, tools such as the Cluster Autoscaler, or Karpenter, can dynamically add more EC2 instances to the shared Kubernetes Cluster. An ALB can be reused by multiple tenants to route traffic to the appropriate pods. For RDS, SaaS providers can use tenant-specific database schemas to separate tenant data. For static data, Amazon Elastic File System (EFS) and tenant-specific directories can be employed. The SaaS provider would still have a control plane AWS account that would now interact with the Kubernetes and AWS APIs to create and update tenant-specific resources.

This transition to a multi-tenant design utilizing Kubernetes, Amazon Elastic Kubernetes Service (EKS), and other managed services offers numerous advantages. It enables efficient resource utilization by leveraging containerization and auto-scaling capabilities, reducing costs, and optimizing performance (see Figure 2).

Multi-tenant configuration

Figure 2. Multi-tenant configuration

EKS cluster sizing and customer segmentation considerations in multi-tenancy designs

A high concentration of SaaS tenants hosted within the same system results in a large “blast radius.” This means a failure within the system has the potential to impact all resident tenants. This situation can lead to downtime for multiple tenants at once. To address this problem, SaaS providers are encouraged to partition their customers amongst multiple AWS accounts, each with their own deployments of this multi-tenant architecture. The number of tenants that can be present in a single cluster is a determination that can only be made by the SaaS provider after weighing the risks. Compare the shared fate of some subset of their customers, against the possible efficiency benefits of a multi-tenant architecture.

EKS security

SaaS providers must evaluate whether it’s appropriate for them to make use of containers as a workload isolation boundary. This is of particular importance in multi-tenant Kubernetes architectures, given that containers running on a single Amazon EC2 instance will share the underlying Linux kernel. Security vulnerabilities place this shared resource (the EC2 instance) at risk from attack vectors from the host Linux instance. Risk is elevated when any container running in a Kubernetes Pod cluster initiates untrusted code. This risk is heightened if SaaS providers permit tenants to “bring their code”. Kubernetes is a single tenant orchestrator, but with a multi-tenant approach to SaaS architectures, a single instance of the Amazon EKS control plane will be shared among all the workloads running within a cluster. Amazon EKS considers the cluster as the hard isolation security boundary. Every Amazon EKS managed Kubernetes cluster is isolated in a dedicated single-tenant Amazon VPC. At present, hard multi-tenancy can only be implemented by provisioning a unique cluster for each tenant.

EFS considerations

A SaaS provider may consider EFS as the storage solution for the static content of the multiple tenants. This provides them with a straightforward, serverless, and elastic file system. Directories may be used to separate the content for each tenant. While this approach of creating tenant-specific directories in EFS provides many benefits, there may be challenges harvesting per-tenant utilization and performance metrics. This can result in operational challenges for providers that need to granularly meter per-tenant usage of resources. Consequently, noisy neighbors will be difficult to identify and remediate. To resolve this, SaaS providers should consider building a custom solution to monitor the individual tenants in the multi-tenant file system by leveraging storage and throughput/IOPS metrics.

RDS considerations

Multi-tenant workloads, where data for multiple customers or end users is consolidated in the same RDS database cluster, can present operational challenges regarding per-tenant observability. Both MySQL Community Edition and open-source PostgreSQL have limited ability to provide per-tenant observability and resource governance. AWS customers operating multi-tenant workloads often use a combination of ‘database’ or ‘schema’ and ‘database user’ accounts as substitutes. AWS customers should use alternate mechanisms to establish a mapping between a tenant and these substitutes. This will give you the ability to process raw observability data from the database engine externally. You can then map these substitutes back to tenants, and distinguish tenants in the observability data.

Conclusion

In this blog, we’ve shown what to consider when moving to a multi-tenancy SaaS solution in the AWS Cloud, how to optimize your cloud-based SaaS design, and some challenges and remediations. Invest effort early in your SaaS design strategy to explore your customer requirements for tenancy. Work backwards from your SaaS tenants end goals. What level of computing performance do they require? What are the required cyber security features? How will you, as the SaaS provider, monitor and operate your platform with the target tenancy configuration? Your respective AWS account team is highly qualified to advise on these design decisions. Take advantage of reviewing and improving your design using the AWS Well-Architected Framework. The tenancy design process should be followed by extensive prototyping to validate functionality before production rollout.

Related information

AWS Week in Review – Updates on Amazon FSx for NetApp ONTAP, AWS Lambda, eksctl, Karpetner, and More – July 17, 2023

Post Syndicated from Channy Yun original https://aws.amazon.com/blogs/aws/aws-week-in-review-updates-on-amazon-fsx-for-netapp-ontap-aws-lambda-eksctl-karpetner-and-more-july-17-2023/

The Data Centered: Eastern Oregon, a five-part mini-documentary series looking at the real-life impact of the more than $15 billion investment AWS has made in the local community, and how the company supports jobs, generates economic growth, provides skills training and education, and unlocks opportunities for local businesses suppliers.

Last week, I watched a new episode introducing the Data Center Technician training program offered by AWS to train people with little or no previous technical experience in the skills they need to work in data centers and other information technology (IT) roles. This video reminded me of my first days of cabling and transporting servers in data centers. Remember, there are still people behind cloud computing.

Last Week’s Launches
Here are some launches that got my attention:

Amazon FSx for NetApp ONTAP Updates – Jeff Barr introduced Amazon FSx for NetApp ONTAP support for SnapLock, an ONTAP feature that gives you the power to create volumes that provide write once read many (WORM) functionality for regulatory compliance and ransomware protection. In addition, FSx for NetApp ONTAP now supports IPSec encryption of data in transit and two additional monitoring and troubleshooting capabilities that you can use to monitor file system events and diagnose network connectivity.

AWS Lambda detects and stops recursive loops in Lambda functions – In certain scenarios, due to resource misconfiguration or code defects, a processed event might be sent back to the same service or resource that invoked the Lambda function. This can cause an unintended recursive loop and result in unintended usage and costs for customers. With this launch, Lambda will stop recursive invocations between Amazon SQS, Lambda, and Amazon SNS after 16 recursive calls. For more information, refer to our documentation or the launch blog post.

Email notification

Amazon CloudFront supports for 3072-bit RSA certificates – You can now associate their 3072-bit RSA certificates with CloudFront distributions to enhance communication security between clients and CloudFront edge locations. To get started, associate a 3072-bit RSA certificate with your CloudFront distribution using console or APIs. There are no additional fees associated with this feature. For more information, please refer to the CloudFront Developer Guide.

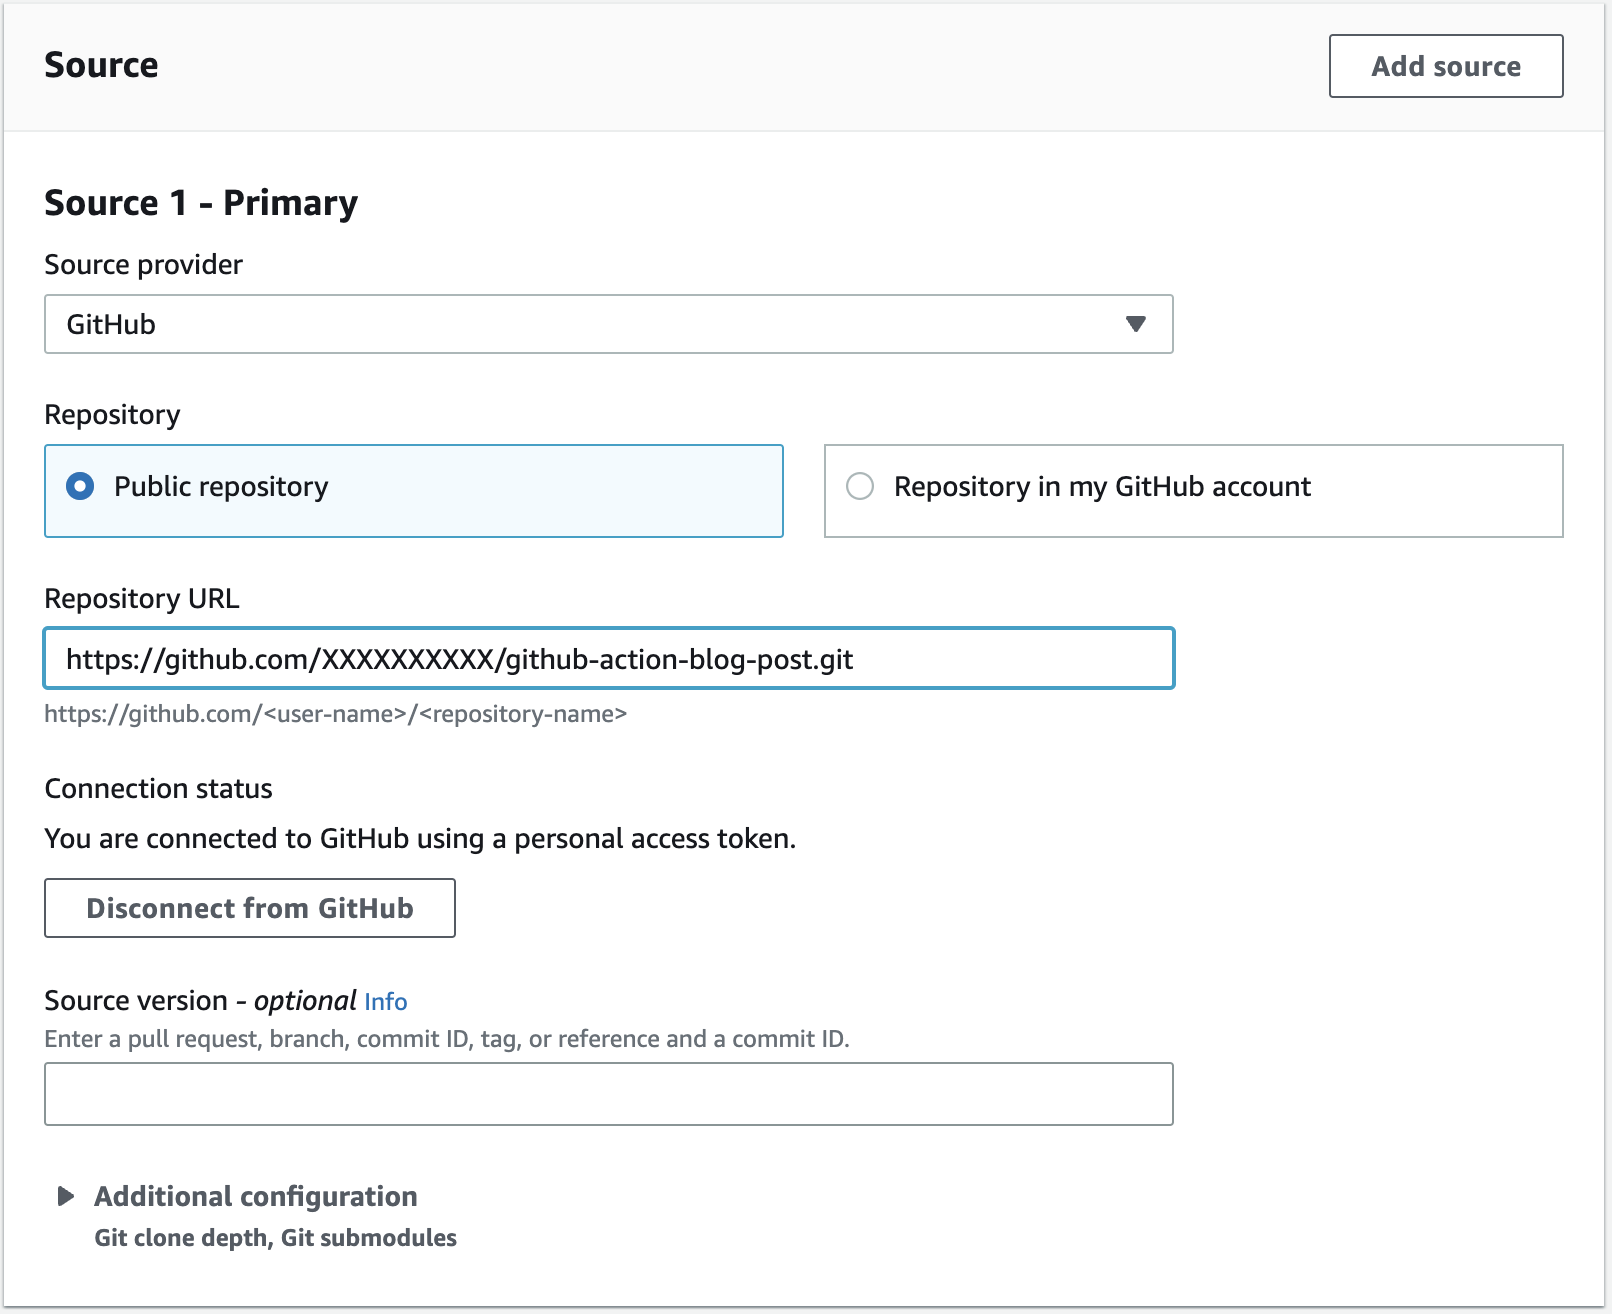
Running GitHub Actions with AWS CodeBuild – Two weeks ago, AWS CodeBuild started to support GitHub Actions. You can now define GitHub Actions steps directly in the BuildSpec and run them alongside CodeBuild commands. Last week, the AWS DevOps Blog published the blog post about using the Liquibase GitHub Action for deploying changes to an Amazon Aurora database in a private subnet. You can learn how to integrate AWS CodeBuild and nearly 20,000 GitHub Actions developed by the open source community.

CodeBuild configuration showing the GitHub repository URL

Amazon DynamoDB local version 2.0 – You can develop and test applications by running Amazon DynamoDB local in your local development environment without incurring any additional costs. The new 2.0 version allows Java developers to use DynamoDB local to work with Spring Boot 3 and frameworks such as Spring Framework 6 and Micronaut Framework 4 to build modernized, simplified, and lightweight cloud-native applications.

For a full list of AWS announcements, be sure to keep an eye on the What’s New at AWS page.

Open Source Updates
Last week, we introduced new open source projects and significant roadmap contributions to the Jupyter community.

New joint maintainership between Weaveworks and AWS for eksctl – Now the eksctl open source project has been moved from the Weaveworks GitHub organization to a new top level GitHub organization—eksctl-io—that will be jointly maintained by Weaveworks and AWS moving forward. The eksctl project can now be found on GitHub.

Karpenter now supports Windows containers – Karpenter is an open source flexible, high-performance Kubernetes node provisioning and management solution that you can use to quickly scale Amazon EKS clusters. With the launch of version 0.29.0, Karpenter extends the automated node provisioning support to Windows containers running on EKS. Read this blog post for a step-by-step guide on how to get started with Karpenter for Windows node groups.

Updates in Amazon Aurora and Amazon OpenSearch Service – Following the announcement of updates to the PostgreSQL database in May by the open source community, we’ve updated Amazon Aurora PostgreSQL-Compatible Edition to support PostgreSQL 15.3, 14.8, 13.11, 12.15, and 11.20. These releases contain product improvements and bug fixes made by the PostgreSQL community, along with Aurora-specific improvements. You can also run OpenSearch version 2.7 in Amazon OpenSearch Service. With OpenSearch 2.7 (also released in May), we’ve made several improvements to observability, security analytics, index management, and geospatial capabilities in OpenSearch Service.

To learn about weekly updates for open source at AWS, check out the latest AWS open source newsletter by Ricardo.

Upcoming AWS Events
Check your calendars and sign up for these AWS events:

AWS Storage Day on August 9 – Join a one-day virtual event that will help you to better understand AWS storage services and make the most of your data. Register today.

AWS Global Summits – Sign up for the AWS Summit closest to your city: Hong Kong (July 20), New York City (July 26), Taiwan (August 2-3), São Paulo (August 3), and Mexico City (August 30).

AWS Community Days – Join a community-led conference run by AWS user group leaders in your region: Malaysia (July 22), Philippines (July 29-30), Colombia (August 12), and West Africa (August 19).

AWS re:Invent 2023 – Join us to hear the latest from AWS, learn from experts, and connect with the global cloud community. Registration is now open.

You can browse all upcoming AWS-led in-person and virtual events, and developer-focused events such as AWS DevDay.

Take the AWS Blog Customer Survey
We’re focused on improving our content to provide a better customer experience, and we need your feedback to do so. Take our survey to share insights regarding your experience on the AWS Blog.

This survey is hosted by an external company. AWS handles your information as described in the AWS Privacy Notice. AWS will own the data gathered via this survey and will not share the information collected with survey respondents.

That’s all for this week. Check back next Monday for another Week in Review!

Channy

This post is part of our Week in Review series. Check back each week for a quick roundup of interesting news and announcements from AWS!

Simulating Kubernetes-workload AZ failures with AWS Fault Injection Simulator

Post Syndicated from Siva Guruvareddiar original https://aws.amazon.com/blogs/architecture/simulating-kubernetes-workload-az-failures-with-aws-fault-injection-simulator/

In highly distributed systems, it is crucial to ensure that applications function correctly even during infrastructure failures. One common infrastructure failure scenario is when an entire Availability Zone (AZ) becomes unavailable. Applications are often deployed across multiple AZs to ensure high availability and fault tolerance in cloud environments such as Amazon Web Services (AWS).

Kubernetes helps manage and deploy applications across multiple nodes and AZs, though it can be difficult to test how your applications will behave during an AZ failure. This is where fault injection simulators come in. The AWS Fault Injection Simulator (AWS FIS) service can intentionally inject faults or failures into a system to test its resilience. In this blog post, we will explore how to use an AWS FIS to simulate an AZ failure for Kubernetes workloads.

Solution overview

To ensure that Kubernetes cluster workloads are architected to handle failures, you must test their resilience by simulating real-world failure scenarios. Kubernetes allows you to deploy workloads across multiple AZs to handle failures, but it’s still important to test how your system behaves during AZ failures. To do this, we use a microservice for product details with the aim of running this microservice using auto-scaling with both Cluster Autoscaler (CA, from Kubernetes community) and Karpenter and test how the system responds to varying traffic levels.

This blog post explores a load test to mimic the behavior of hundreds of users accessing the service concurrently to simulate a realistic failure scenario. This test uses AWS FIS to disrupt network connectivity, and simulate AZ failure in a controlled manner. This allows us to measure how users are impacted when using CA and then with Karpenter.

Both CA and Karpenter automatically adjust the size of a cluster based on the resource requirements of the running workloads. By comparing the performance of the microservice under these two autoscaling tools, we can determine which tool is better-suited to handle such scenarios.

Figure 1 demonstrates the solution’s architecture.

Architecture flow for Microservices to simulate a realistic failure scenario

Figure 1. Architecture flow for microservices to simulate a realistic failure scenario

Prerequisites

Install the following utilities on a Linux-based host machine, which can be an Amazon Elastic Compute Cloud (Amazon EC2) instance, AWS Cloud9 instance, or a local machine with access to your AWS account:

Setting up a microservice environment

This blog post consists of two major parts: Bootstrap and experiment. The bootstrap section provides step-by-step instructions for:

  • Creating and deploying a sample microservice
  • Creating an AWS IAM role for the FIS service
  • Creating an FIS experiment template

By following these bootstrap instructions, you can set up your own environment to test the different autoscaling tools’ performance in Kubernetes.

In the experiment section, we showcase how the system behaves with CA, then Karpenter.

Let’s start by setting a few environment variables using the following code:

export FIS_ACCOUNT_ID=$(aws sts get-caller-identity --query 'Account' --output text)
export FIS_AWS_REGION=us-west-2
export FIS_CLUSTER_NAME="fis-simulation-cluster"

Next, clone the sample repository which contains the code for our solution:

git clone https://github.com/aws-samples/containers-blog-maelstrom.git
cd ./containers-blog-maelstrom/fis-simulation-blog

Step 1. Bootstrap the environment

This solution uses Amazon EKS for AWS Cloud Development Kit (AWS CDK) Blueprints to provision our Amazon EKS cluster.

The first step to any AWS CDK deployment is bootstrapping the environment. cdk bootstrap is an AWS Command Line Interface (AWS CLI) tool that prepares the environment with resources required by AWS CDK to perform deployments into that environment (for example, a combination of AWS account and AWS Region).

Let’s run the below commands to bootstrap your environment and install all node dependencies required for deploying the solution:

npm install
cdk bootstrap aws://$FIS_ACCOUNT_ID/$FIS_AWS_REGION

We’ll use Amazon EKS Blueprints for CDK to create an Amazon EKS cluster and deploy add-ons. This stack deploys the following add-ons into the cluster:

  • AWS Load Balancer Controller
  • AWS VPC CNI
  • Core DNS
  • Kube-proxy

Step 2. Create an Amazon EKS cluster

Run the below command to deploy the Amazon EKS cluster:

npm install
cdk deploy "*" --require-approval never

Deployment takes approximately 20-30 minutes; then you will have a fully functioning Amazon EKS cluster in your account.

fis-simulation-cluster

Deployment time: 1378.09s

Copy and run the aws eks update-kubeconfig ... command from the output section to gain access to your Amazon EKS cluster using kubectl.

Step 3. Deploy a microservice to Amazon EKS

Use the code from the following Github repository and deploy using Helm.

git clone https://github.com/aws-containers/eks-app-mesh-polyglot-demo.git
helm install workshop eks-app-mesh-polyglot-demo/workshop/helm-chart/

Note: You are not restricted to this one as a mandate. If you have other microservices, use the same. This command deploys the following three microservices:

  1. Frontend-node as the UI to the product catalog application
  2. Catalog detail backend
  3. Product catalog backend

To test the resiliency, let’s take one of the microservice viz productdetail, the backend microservice as an example. When checking the status of a service like the following, you will see that proddetail is of type ClusterIP, which is accessible only within the cluster. To access this outside of the cluster, perform the following steps.

kubectl get service proddetail -n workshop
NAME          TYPE           CLUSTER-IP       EXTERNAL-IP   PORT(S)     AGE                                                                   5000/TCP       11h
proddetail    ClusterIP      10.100.168.219   <none>        3000/TCP    11m

Create ingress class

cat <<EOF | kubectl create -f -
apiVersion: networking.k8s.io/v1
kind: IngressClass
metadata:
  name: aws-alb
spec:
  controller: ingress.k8s.aws/alb  
EOF

Create ingress resource

cat <<EOF | kubectl create -f -
apiVersion: networking.k8s.io/v1
kind: Ingress
metadata:
  namespace: workshop
  name: proddtl-ingress
  annotations:
    alb.ingress.kubernetes.io/scheme: internet-facing
    alb.ingress.kubernetes.io/target-type: ip
spec:
  ingressClassName: aws-alb
  rules:
  - http:
      paths:
      - path: /
        pathType: Prefix
        backend:
          service:
            name: proddetail
            port:
               number: 3000
EOF          

After this, your web URL is ready:

kubectl get ingress -n workshop
NAME              CLASS     HOSTS   ADDRESS                                                                  PORTS   AGE
proddtl-ingress   aws-alb   *       k8s-workshop-proddtli-166014b35f-354421654.us-west-1.elb.amazonaws.com   80      14s

Test the connectivity from your browser:

Testing the connectivity from your browser

Figure 2. Testing the connectivity from your browser

Step 4. Create an IAM Role for AWS FIS

Before an AWS FIS experiment, create an IAM role. Let’s create a trust policy and attach as shown here:

cat > fis-trust-policy.json << EOF
{
    "Version": "2012-10-17",
    "Statement": [
        {
            "Effect": "Allow",
            "Principal": {
                "Service": [
                  "fis.amazonaws.com"
                ]
            },
            "Action": "sts:AssumeRole"
        }
    ]
}
EOF
aws iam create-role --role-name my-fis-role --assume-role-policy-document file://permissons/fis-trust-policy.json

Create an AWS FIS policy and attach

aws iam attach-role-policy --role-name my-fis-role --policy-arn  arn:aws:iam::aws:policy/service-role/AWSFaultInjectionSimulatorNetworkAccess
aws iam attach-role-policy --role-name my-fis-role --policy-arn  arn:aws:iam::aws:policy/CloudWatchAgentServerPolicy
aws iam attach-role-policy --role-name my-fis-role --policy-arn  arn:aws:iam::aws:policy/service-role/AWSFaultInjectionSimulatorEKSAccess
aws iam attach-role-policy --role-name my-fis-role --policy-arn  arn:aws:iam::aws:policy/service-role/AWSFaultInjectionSimulatorEC2Access
aws iam attach-role-policy --role-name my-fis-role --policy-arn  arn:aws:iam::aws:policy/service-role/AWSFaultInjectionSimulatorSSMAccess

Step 5: Create an AWS FIS experiment

Use AWS FIS to create an experiment to disrupt the network connectivity as below. Use the following experiment template with the IAM role created from the previous step:

Experiment template

Figure 3. Experiment template

Step 6. Failure simulation with AWS FIS on CA and Karpenter

We’ve completed microservice setup, made it internet-accessible, and created an AWS FIS template to simulate failures. Now let’s experiment with how the system behaves with different autoscalers: CA and Karpenter.

With the microservice available within Amazon EKS cluster, we’ll use Locust to simulate user behavior with a total of 100 users trying to access the URLs concurrently.

For the following experiments, Run 1 shows 100 users trying to access the service without any system disruptions. We’ll then move to AWS FIS and disrupt network connectivity in Run 2. Measuring the user impact and comparing it to the results from the first run provides insights on how the system responds to failures and can be improved for greater reliability and performance.

Simulating failures with Cluster Autoscaler (CA)

To perform this experiment, select your experiment template and click Start experiment, then enter start in the field. Currently 12 replicas of the proddetail microservice are running.

As the following Locust charts detail, Run 1 completed without failures. Run 2 simulated network connectivity disruption, resulting in a visible failure rate of 4 percent, with a peak of 7 failures at one time.

For this experiment, we used a total of seven nodes of type t3.small. Use eks-node-viewer to visualize dynamic node usage within a cluster.

CA experiment results

Figure 4. CA experiment results

Dynamic node usage within cluster

Figure 5. Dynamic node usage within cluster

Simulating failures with Karpenter

Continuing the same experiment with 12 replicas of the proddetail microservice, this time we are using Karpenter. As in the following figures, the cluster uses a combination of t3.small and “C” and “M” instances provided in Karpenter’s provisioner configuration.

In Run 1, we observe 0 failures. In Run 2, when network connectivity was disrupted by AWS FIS, Karpenter was able to maintain user requests with almost 0 percent failure. This outcome highlights the effectiveness of Karpenter as an autoscaler for maintaining high availability by carefully configuring the provisioner.

Karpenter experiment results

Figure 6. Karpenter experiment results

Dynamic node usage within cluster

Figure 7. Dynamic node usage within cluster

Cleanup

Use the following commands to clean up your experiment environment.

#delete Ingress resources
kubectl delete ingress proddtl-ingresss -n workshop
kubectl delete ingressclass aws-alb

#delete IAM resources
aws iam delete-role --role-name my-fis-role

#delete FIS resources
fis_template_id=`aws fis list-experiment-templates --region $FIS_AWS_REGION |jq ".experimentTemplates[0].id"`
aws fis delete-experiment-template --id $fis_template_id --region $FIS_AWS_REGION

#delete application resources and cluster
helm uninstall workshop
cdk destroy

Conclusion

This experiment results show that Karpenter performs better and recovers quicker from network disrupt connectivity than Cluster Autoscaler. The figures in this blog post highlight Karpenter’s resiliency and ability to scale and recover from failures quickly.

While this experiment provides valuable insights into the performance and reliability of Kubernetes workloads in the face of failures, it’s important to acknowledge that this is not a true test of an AZ unavailable situation. In a real-world scenario, an AZ failure can have a cascading effect, potentially impacting other services that workloads depend upon. But simulating an AZ failure in a controlled environment helps you better understand how your Kubernetes cluster and applications will behave in an actual failure scenario. This knowledge can help you identify and address any issues before they occur in production, ensuring that your applications remain highly available and resilient.

In summary, this experiment provides good insights into the performance and resilience of Kubernetes workloads. It is not a perfect representation of a real-world AZ failure, but by leveraging tools such as AWS FIS and carefully configuring autoscaling policies, you can take proactive steps to optimize performance and ensure high availability for critical applications.

Let’s Architect! Multi-tenant SaaS architectures

Post Syndicated from Luca Mezzalira original https://aws.amazon.com/blogs/architecture/lets-architect-multi-tenant-saas-architectures/

In a multi-tenant architecture multiple instances of an application run on a shared infrastructure. With this type of approach, each tenant is isolated from others, typically through logical separation, while utilizing a shared infrastructure. This allows multiple tenants to use the same application and maintain their data security, privacy, and customization requirements.

Understanding architectural patterns for multi-tenancy has become crucial for architects and developers aiming to deliver scalable, secure, and cost-effective solutions. Isolating tenant data is a fundamental responsibility for Software as a Service (SaaS) providers. In this edition of Let’s Architect!, we talk about comprehensive exploration of multi-tenant architectures, covering various aspects, such as SaaS microservices, SaaS serverless, SaaS EKS, and an insightful whitepaper.

SaaS microservices deep dive: Simplifying multi-tenant development

In this session, Michael Beardsley, Principal Solutions Architect at AWS, takes a deep dive into the realm of multi-tenant microservices, exploring various patterns and strategies that enable the seamless implementation of multi-tenant microservices, all while ensuring that additional complexity is not imposed upon the SaaS builders. He shares practical patterns to simplify the development process by addressing crucial aspect, such as authorization, data access, tenant isolation, metrics, billing, logging, and a plethora of other considerations; this is irrespective of the chosen compute platform (like Amazon Elastic Container Service, Amazon Elastic Kubernetes Service [Amazon EKS], or AWS Lambda) or database solution.

There is another session available that highlights specific techniques and architecture strategies that can directly impact the success of a SaaS business. If you’re interested in learning more about optimizing multi-tenant SaaS architecture, this session is a great opportunity.

Take me to this video!

SaaS multi-tenant microservices

SaaS multi-tenant microservices

Building a Multi-Tenant SaaS Solution Using AWS Serverless Services

In this AWS Partner Network (APN) Blog post, you will explore a reference solution that presents a comprehensive perspective on a functional multi-tenant serverless SaaS environment. This solution effectively showcases various essential components required to construct a multi-tenant SaaS solution using serverless services, including onboarding processes, tenant isolation mechanisms, data partitioning techniques, a tenant deployment pipeline, and robust observability measures.

By delving into these aspects, you can gain valuable insights into the architecture and design considerations involved in creating a successful multi-tenant SaaS solution.

Take me to this AWS APN blogpost!

Tenant registration flow

Tenant registration flow

Amazon EKS SaaS deep dive: A multi-tenant EKS SaaS solution

In this re:Invent 2021 presentation, Tod Golding, Principal Partner Solutions Architect, chats about a SaaS reference solution that addresses fundamental multi-tenant considerations, examining its approach to core SaaS topics, including tenant isolation, identity, onboarding, tenant administration, and data partitioning. The goal is to explore an Amazon EKS SaaS architecture through the lens of working code and highlight the key architectural strategies that were used in this reference environment.

There is also valuable information available on Github regarding EKS multi-tenancy. Exploring the Github repositories related to EKS multi-tenancy can provide further insights, resources, and practical examples for implementing multi-tenant architectures on EKS. This presentation is an engaging way to dive deeper into this topic and gain a more comprehensive understanding of best practices and real-world implementations.

Take me to this video!

Tenant deployment model

Tenant deployment model

Saas Storage Strategies

Storage represents a challenging aspect of building and delivering multi-tenant software solutions. There are different strategies that can be used to partition tenant data, each with a unique set of trade-offs for implementing separation between tenants. This whitepaper covers different storage models for multi-tenancy; in particular, you can learn about the:

  • Silo model (data from the tenant is fully isolated)
  • Pool model (all the tenants use the same database and table)
  • Bridge model (single database but a different table for each tenant)

For each of these models, the whitepaper describes in detail how they can be implemented, as well as the different trade-offs in terms of isolation and agility. You can also discover how these tenancy models can be implemented specifically on databases, such as Amazon DynamoDB and Amazon Relational Database Service, thus covering both NoSQL and SQL scenarios.

Take me to this whitepaper!

Partitioning model tradeoffs

Partitioning model tradeoffs

See you next time!

Thanks for joining our conversation on multi-tenant SaaS architectures! Next time, we’ll talk about open-source technologies.

To find all the blogs from this series, you can check out the Let’s Architect! list of content on the AWS Architecture Blog.

Introducing Amazon EMR on EKS job submission with Spark Operator and spark-submit

Post Syndicated from Lotfi Mouhib original https://aws.amazon.com/blogs/big-data/introducing-amazon-emr-on-eks-job-submission-with-spark-operator-and-spark-submit/

Amazon EMR on EKS provides a deployment option for Amazon EMR that allows organizations to run open-source big data frameworks on Amazon Elastic Kubernetes Service (Amazon EKS). With EMR on EKS, Spark applications run on the Amazon EMR runtime for Apache Spark. This performance-optimized runtime offered by Amazon EMR makes your Spark jobs run fast and cost-effectively. The EMR runtime provides up to 5.37 times better performance and 76.8% cost savings, when compared to using open-source Apache Spark on Amazon EKS.

Building on the success of Amazon EMR on EKS, customers have been running and managing jobs using the emr-containers API, creating EMR virtual clusters, and submitting jobs to the EKS cluster, either through the AWS Command Line Interface (AWS CLI) or Apache Airflow scheduler. However, other customers running Spark applications have chosen Spark Operator or native spark-submit to define and run Apache Spark jobs on Amazon EKS, but without taking advantage of the performance gains from running Spark on the optimized EMR runtime. In response to this need, starting from EMR 6.10, we have introduced a new feature that lets you use the optimized EMR runtime while submitting and managing Spark jobs through either Spark Operator or spark-submit. This means that anyone running Spark workloads on EKS can take advantage of EMR’s optimized runtime.

In this post, we walk through the process of setting up and running Spark jobs using both Spark Operator and spark-submit, integrated with the EMR runtime feature. We provide step-by-step instructions to assist you in setting up the infrastructure and submitting a job with both methods. Additionally, you can use the Data on EKS blueprint to deploy the entire infrastructure using Terraform templates.

Infrastructure overview

In this post, we walk through the process of deploying a comprehensive solution using eksctl, Helm, and AWS CLI. Our deployment includes the following resources:

  • A VPC, EKS cluster, and managed node group, set up with the eksctl tool
  • Essential Amazon EKS managed add-ons, such as the VPC CNI, CoreDNS, and KubeProxy set up with the eksctl tool
  • Cluster Autoscaler and Spark Operator add-ons, set up using Helm
  • A Spark job execution AWS Identity and Access Management (IAM) role, IAM policy for Amazon Simple Storage Service (Amazon S3) bucket access, service account, and role-based access control, set up using the AWS CLI and eksctl

Prerequisites

Verify that the following prerequisites are installed on your machine:

Set up AWS credentials

Before proceeding to the next step and running the eksctl command, you need to set up your local AWS credentials profile. For instructions, refer to Configuration and credential file settings.

Deploy the VPC, EKS cluster, and managed add-ons

The following configuration uses us-west-1 as the default Region. To run in a different Region, update the region and availabilityZones fields accordingly. Also, verify that the same Region is used in the subsequent steps throughout the post.

Enter the following code snippet into the terminal where your AWS credentials are set up. Make sure to update the publicAccessCIDRs field with your IP before you run the command below. This will create a file named eks-cluster.yaml:

cat <<EOF >eks-cluster.yaml
---
apiVersion: eksctl.io/v1alpha5
kind: ClusterConfig
metadata:
  name: emr-spark-operator
  region: us-west-1 # replace with your region
  version: "1.25"
vpc:
  clusterEndpoints:
    publicAccess: true
    privateAccess: true
  publicAccessCIDRs: ["YOUR-IP/32"]
availabilityZones: ["us-west-1a","us-west-1b"] # replace with your region
iam:
  withOIDC: true
  serviceAccounts:
  - metadata:
      name: cluster-autoscaler
      namespace: kube-system
    wellKnownPolicies:
      autoScaler: true
    roleName: eksctl-cluster-autoscaler-role
managedNodeGroups:
  - name: m5x
    instanceType: m5.xlarge
    availabilityZones: ["us-west-1a"]
    volumeSize: 100
    volumeType: gp3
    minSize: 2
    desiredCapacity: 2
    maxSize: 10
    tags:
      k8s.io/cluster-autoscaler/enabled: "true"
      k8s.io/cluster-autoscaler/eks-nvme: "owned" 
addons:
  - name: vpc-cni
    version: latest
  - name: coredns
    version: latest
  - name: kube-proxy
    version: latest
cloudWatch:
  clusterLogging:
    enableTypes: ["*"]
EOF

Use the following command to create the EKS cluster : eksctl create cluster -f eks-cluster.yaml

Deploy Cluster Autoscaler

Cluster Autoscaler is crucial for automatically adjusting the size of your Kubernetes cluster based on the current resource demands, optimizing resource utilization and cost. Create an autoscaler-helm-values.yaml file and install the Cluster Autoscaler using Helm:

cat <<EOF >autoscaler-helm-values.yaml
---
autoDiscovery:
    clusterName: emr-spark-operator
    tags:
      - k8s.io/cluster-autoscaler/enabled
      - k8s.io/cluster-autoscaler/{{ .Values.autoDiscovery.clusterName }}
awsRegion: us-west-1 # Make sure the region same as the EKS Cluster
rbac:
  serviceAccount:
    create: false
    name: cluster-autoscaler
EOF
helm repo add autoscaler https://kubernetes.github.io/autoscaler
helm install nodescaler autoscaler/cluster-autoscaler \
--namespace kube-system \
--values autoscaler-helm-values.yaml --debug

You can also set up Karpenter as a cluster autoscaler to automatically launch the right compute resources to handle your EKS cluster’s applications. You can follow this blog on how to setup and configure Karpenter.

Deploy Spark Operator

Spark Operator is an open-source Kubernetes operator specifically designed to manage and monitor Spark applications running on Kubernetes. It streamlines the process of deploying and managing Spark jobs, by providing a Kubernetes custom resource to define, configure and run Spark applications, as well as manage the job life cycle through Kubernetes API. Some customers prefer using Spark Operator to manage Spark jobs because it enables them to manage Spark applications just like other Kubernetes resources.

Currently, customers are building their open-source Spark images and using S3a committers as part of job submissions with Spark Operator or spark-submit. However, with the new job submission option, you can now benefit from the EMR runtime in conjunction with EMRFS. Starting with Amazon EMR 6.10 and for each upcoming version of the EMR runtime, we will release the Spark Operator and its Helm chart to use the EMR runtime.

In this section, we show you how to deploy a Spark Operator Helm chart from an Amazon Elastic Container Registry (Amazon ECR) repository and submit jobs using EMR runtime images, benefiting from the performance enhancements provided by the EMR runtime.

Install Spark Operator with Helm from Amazon ECR

The Spark Operator Helm chart is stored in an ECR repository. To install the Spark Operator, you first need to authenticate your Helm client with the ECR repository. The charts are stored under the following path: ECR_URI/spark-operator.

Authenticate your Helm client and install the Spark Operator:

aws ecr get-login-password \
--region us-west-1 | helm registry login \
--username AWS \
--password-stdin 608033475327.dkr.ecr.us-west-1.amazonaws.com

You can authenticate to other EMR on EKS supported Regions by obtaining the AWS account ID for the corresponding Region. For more information, refer to how to select a base image URI.

Install Spark Operator

You can now install Spark Operator using the following command:

helm install spark-operator-demo \
oci://608033475327.dkr.ecr.us-west-1.amazonaws.com/spark-operator \
--set emrContainers.awsRegion=us-west-1 \
--version 1.1.26-amzn-0 \
--set serviceAccounts.spark.create=false \
--namespace spark-operator \
--create-namespace

To verify that the operator has been installed correctly, run the following command:

helm list --namespace spark-operator -o yaml

Set up the Spark job execution role and service account

In this step, we create a Spark job execution IAM role and a service account, which will be used in Spark Operator and spark-submit job submission examples.

First, we create an IAM policy that will be used by the IAM Roles for Service Accounts (IRSA). This policy enables the driver and executor pods to access the AWS services specified in the policy. Complete the following steps:

  1. As a prerequisite, either create an S3 bucket (aws s3api create-bucket --bucket <ENTER-S3-BUCKET> --create-bucket-configuration LocationConstraint=us-west-1 --region us-west-1) or use an existing S3 bucket. Replace <ENTER-S3-BUCKET> in the following code with the bucket name.
  2. Create a policy file that allows read and write access to an S3 bucket:
    cat >job-execution-policy.json <<EOL
    {
        "Version": "2012-10-17",
        "Statement": [
            {
                "Effect": "Allow",
                "Action": [
                    "s3:GetObject",
                    "s3:ListBucket",
                    "s3:PutObject",
                    "s3:DeleteObject",
                    "s3:AbortMultipartUpload",
                    "s3:ListMultipartUploadParts"
                ],
                "Resource": [
                    "arn:aws:s3:::<ENTER-S3-BUCKET>",
                    "arn:aws:s3:::<ENTER-S3-BUCKET>/*",
                    "arn:aws:s3:::aws-data-lake-workshop/*",
                    "arn:aws:s3:::nyc-tlc",
                    "arn:aws:s3:::nyc-tlc/*"
                ]
            }
        ]
    }
    EOL

  3. Create the IAM policy with the following command:
    aws iam create-policy --policy-name emr-job-execution-policy --policy-document file://job-execution-policy.json

  4. Next, create the service account named emr-job-execution-sa-role as well as the IAM roles. The following eksctl command creates a service account scoped to the namespace and service account defined to be used by the executor and driver. Make sure to replace <ENTER_YOUR_ACCOUNT_ID> with your account ID before running the command:
    eksctl create iamserviceaccount \
    --cluster=emr-spark-operator \
    --region us-west-1 \
    --name=emr-job-execution-sa \
    --attach-policy-arn=arn:aws:iam::<ENTER_YOUR_ACCOUNT_ID>:policy/emr-job-execution-policy \
    --role-name=emr-job-execution-irsa \
    --namespace=data-team-a \
    --approve

  5. Create an S3 bucket policy to allow only the execution role create in step 4 to write and read from the S3 bucket create in step 1. Make sure to replace <ENTER_YOUR_ACCOUNT_ID> with your account ID before running the command:
    cat > bucketpolicy.json<<EOL
    {
        "Version": "2012-10-17",
        "Statement": [
            {
                "Effect": "Allow",
                "Action": [
                    "s3:GetObject",
                    "s3:ListBucket",
                    "s3:PutObject",
                    "s3:DeleteObject",
                    "s3:AbortMultipartUpload",
                    "s3:ListMultipartUploadParts"
                ], "Principal": {
                    "AWS": "arn:aws:iam::<ENTER_YOUR_ACCOUNT_ID>:role/emr-job-execution-irsa"
                },
                "Resource": [
                    "arn:aws:s3:::<ENTER-S3-BUCKET>",
                    "arn:aws:s3:::<ENTER-S3-BUCKET>/*"
                ]
            }
        ]
    }
    EOL
    
    aws s3api put-bucket-policy --bucket ENTER-S3-BUCKET-NAME --policy file://bucketpolicy.json

  6. Create a Kubernetes role and role binding required for the service account used in the Spark job run:
    cat <<EOF >emr-job-execution-rbac.yaml
    ---
    apiVersion: rbac.authorization.k8s.io/v1
    kind: Role
    metadata:
      name: emr-job-execution-sa-role
      namespace: data-team-a
    rules:
      - apiGroups: ["", "batch","extensions"]
        resources: ["configmaps","serviceaccounts","events","pods","pods/exec","pods/log","pods/portforward","secrets","services","persistentvolumeclaims"]
        verbs: ["create","delete","get","list","patch","update","watch"]
    ---
    apiVersion: rbac.authorization.k8s.io/v1
    kind: RoleBinding
    metadata:
      name: emr-job-execution-sa-rb
      namespace: data-team-a
    roleRef:
      apiGroup: rbac.authorization.k8s.io
      kind: Role
      name: emr-job-execution-sa-role
    subjects:
      - kind: ServiceAccount
        name: emr-job-execution-sa
        namespace: data-team-a
    EOF

  7. Apply the Kubernetes role and role binding definition with the following command:
kubectl apply -f emr-job-execution-rbac.yaml

So far, we have completed the infrastructure setup, including the Spark job execution roles. In the following steps, we run sample Spark jobs using both Spark Operator and spark-submit with the EMR runtime.

Configure the Spark Operator job with the EMR runtime

In this section, we present a sample Spark job that reads data from public datasets stored in S3 buckets, processes them, and writes the results to your own S3 bucket. Make sure that you update the S3 bucket in the following configuration by replacing <ENTER_S3_BUCKET> with the URI to your own S3 bucket refered in step 2 of the “Set up the Spark job execution role and service account section. Also, note that we are using data-team-a as a namespace and emr-job-execution-sa as a service account, which we created in the previous step. These are necessary to run the Spark job pods in the dedicated namespace, and the IAM role linked to the service account is used to access the S3 bucket for reading and writing data.

Most importantly, notice the image field with the EMR optimized runtime Docker image, which is currently set to emr-6.10.0. You can change this to a newer version when it’s released by the Amazon EMR team. Also, when configuring your jobs, make sure that you include the sparkConf and hadoopConf settings as defined in the following manifest. These configurations enable you to benefit from EMR runtime performance, AWS Glue Data Catalog integration, and the EMRFS optimized connector.

  1. Create the file (emr-spark-operator-example.yaml) locally and update the S3 bucket location so that you can submit the job as part of the next step:
    cat <<EOF >emr-spark-operator-example.yaml
    ---
    apiVersion: "sparkoperator.k8s.io/v1beta2"
    kind: SparkApplication
    metadata:
      name: taxi-example
      namespace: data-team-a
    spec:
      type: Scala
      mode: cluster
      # EMR optimized runtime image
      image: "483788554619.dkr.ecr.eu-west-1.amazonaws.com/spark/emr-6.10.0:latest"
      imagePullPolicy: Always
      mainClass: ValueZones
      mainApplicationFile: s3://aws-data-lake-workshop/spark-eks/spark-eks-assembly-3.3.0.jar
      arguments:
        - s3://nyc-tlc/csv_backup
        - "2017"
        - s3://nyc-tlc/misc/taxi _zone_lookup.csv
        - s3://<ENTER_S3_BUCKET>/emr-eks-results
        - emr_eks_demo
      hadoopConf:
        # EMRFS filesystem config
        fs.s3.customAWSCredentialsProvider: com.amazonaws.auth.WebIdentityTokenCredentialsProvider
        fs.s3.impl: com.amazon.ws.emr.hadoop.fs.EmrFileSystem
        fs.AbstractFileSystem.s3.impl: org.apache.hadoop.fs.s3.EMRFSDelegate
        fs.s3.buffer.dir: /mnt/s3
        fs.s3.getObject.initialSocketTimeoutMilliseconds: "2000"
        mapreduce.fileoutputcommitter.algorithm.version.emr_internal_use_only.EmrFileSystem: "2"
        mapreduce.fileoutputcommitter.cleanup-failures.ignored.emr_internal_use_only.EmrFileSystem: "true"
      sparkConf:
        spark.eventLog.enabled: "true"
        spark.eventLog.dir: "s3://<ENTER_S3_BUCKET>/"
        spark.kubernetes.driver.pod.name: driver-nyc-taxi-etl
        # Required for EMR Runtime and Glue Catalogue
        spark.driver.extraClassPath: /usr/lib/hadoop-lzo/lib/*:/usr/lib/hadoop/hadoop-aws.jar:/usr/share/aws/aws-java-sdk/*:/usr/share/aws/emr/emrfs/conf:/usr/share/aws/emr/emrfs/lib/*:/usr/share/aws/emr/emrfs/auxlib/*:/usr/share/aws/emr/security/conf:/usr/share/aws/emr/security/lib/*:/usr/share/aws/hmclient/lib/aws-glue-datacatalog-spark-client.jar:/usr/share/java/Hive-JSON-Serde/hive-openx-serde.jar:/usr/share/aws/sagemaker-spark-sdk/lib/sagemaker-spark-sdk.jar:/home/hadoop/extrajars/*
        spark.driver.extraLibraryPath: /usr/lib/hadoop/lib/native:/usr/lib/hadoop-lzo/lib/native:/docker/usr/lib/hadoop/lib/native:/docker/usr/lib/hadoop-lzo/lib/native
        spark.executor.extraClassPath: /usr/lib/hadoop-lzo/lib/*:/usr/lib/hadoop/hadoop-aws.jar:/usr/share/aws/aws-java-sdk/*:/usr/share/aws/emr/emrfs/conf:/usr/share/aws/emr/emrfs/lib/*:/usr/share/aws/emr/emrfs/auxlib/*:/usr/share/aws/emr/security/conf:/usr/share/aws/emr/security/lib/*:/usr/share/aws/hmclient/lib/aws-glue-datacatalog-spark-client.jar:/usr/share/java/Hive-JSON-Serde/hive-openx-serde.jar:/usr/share/aws/sagemaker-spark-sdk/lib/sagemaker-spark-sdk.jar:/home/hadoop/extrajars/*
        spark.executor.extraLibraryPath: /usr/lib/hadoop/lib/native:/usr/lib/hadoop-lzo/lib/native:/docker/usr/lib/hadoop/lib/native:/docker/usr/lib/hadoop-lzo/lib/native
        # EMRFS commiter
        spark.sql.parquet.output.committer.class: com.amazon.emr.committer.EmrOptimizedSparkSqlParquetOutputCommitter
        spark.sql.parquet.fs.optimized.committer.optimization-enabled: "true"
        spark.sql.emr.internal.extensions: com.amazonaws.emr.spark.EmrSparkSessionExtensions
        spark.executor.defaultJavaOptions: -verbose:gc -XX:+PrintGCDetails -XX:+PrintGCDateStamps -XX:+UseParallelGC -XX:InitiatingHeapOccupancyPercent=70 -XX:OnOutOfMemoryError='kill -9 %p'
        spark.driver.defaultJavaOptions:  -XX:OnOutOfMemoryError='kill -9 %p' -XX:+UseParallelGC -XX:InitiatingHeapOccupancyPercent=70
      sparkVersion: "3.3.1"
      restartPolicy:
        type: Never
      driver:
        cores: 1
        memory: "4g"
        serviceAccount: emr-job-execution-sa
      executor:
        cores: 1
        instances: 4
        memory: "4g"
        serviceAccount: emr-job-execution-sa
    EOF

  2. Run the following command to submit the job to the EKS cluster:
    kubectl apply -f emr-spark-operator-example.yaml

    The job may take 4–5 minutes to complete, and you can verify the successful message in the driver pod logs.

  3. Verify the job by running the following command:
kubectl get pods -n data-team-a

Enable access to the Spark UI

The Spark UI is an important tool for data engineers because it allows you to track the progress of tasks, view detailed job and stage information, and analyze resource utilization to identify bottlenecks and optimize your code. For Spark jobs running on Kubernetes, the Spark UI is hosted on the driver pod and its access is restricted to the internal network of Kubernetes. To access it, we need to forward the traffic to the pod with kubectl. The following steps take you through how to set it up.

Run the following command to forward traffic to the driver pod:

kubectl port-forward <driver-pod-name> 4040:4040

You should see text similar to the following:

Forwarding from 127.0.0.1:4040 -> 4040
Forwarding from [::1]:4040 → 4040

If you didn’t specify the driver pod name at the submission of the SparkApplication, you can get it with the following command:

kubectl get pods -l spark-role=driver,spark-app-name=<your-spark-app-name> -o jsonpath='{.items[0].metadata.name}'

Open a browser and enter http://localhost:4040 in the address bar. You should be able to connect to the Spark UI.

spark-ui-screenshot

Spark History Server

If you want to explore your job after its run, you can view it through the Spark History Server. The preceding SparkApplication definition has the event log enabled and stores the events in an S3 bucket with the following path: s3://YOUR-S3-BUCKET/. For instructions on setting up the Spark History Server and exploring the logs, refer to Launching the Spark history server and viewing the Spark UI using Docker.

spark-submit

spark-submit is a command line interface for running Apache Spark applications on a cluster or locally. It allows you to submit applications to Spark clusters. The tool enables simple configuration of application properties, resource allocation, and custom libraries, streamlining the deployment and management of Spark jobs.

Beginning with Amazon EMR 6.10, spark-submit is supported as a job submission method. This method currently only supports cluster mode as the submission mechanism. To submit jobs using the spark-submit method, we reuse the IAM role for the service account we set up earlier. We also use the S3 bucket used for the Spark Operator method. The steps in this section take you through how to configure and submit jobs with spark-submit and benefit from EMR runtime improvements.

  1. In order to submit a job, you need to use the Spark version that matches the one available in Amazon EMR. For Amazon EMR 6.10, you need to download the Spark 3.3 version.
  2. You also need to make sure you have Java installed in your environment.
  3. Unzip the file and navigate to the root of the Spark directory.
  4. In the following code, replace the EKS endpoint as well as the S3 bucket then run the script:
./bin/spark-submit \
--class ValueZones \
--master k8s://EKS-ENDPOINT \
--conf spark.kubernetes.namespace=data-team-a \
--conf spark.kubernetes.container.image=608033475327.dkr.ecr.us-west-1.amazonaws.com/spark/emr-6.10.0:latest \
--conf spark.kubernetes.authenticate.driver.serviceAccountName=emr-job-execution-sa \
--conf spark.kubernetes.authenticate.executor.serviceAccountName=emr-job-execution-sa \
--conf spark.driver.extraClassPath="/usr/lib/hadoop-lzo/lib/*:/usr/lib/hadoop/hadoop-aws.jar:/usr/share/aws/aws-java-sdk/*:/usr/share/aws/emr/emrfs/conf:/usr/share/aws/emr/emrfs/lib/*:/usr/share/aws/emr/emrfs/auxlib/*:/usr/share/aws/emr/security/conf:/usr/share/aws/emr/security/lib/*:/usr/share/aws/hmclient/lib/aws-glue-datacatalog-spark-client.jar:/usr/share/java/Hive-JSON-Serde/hive-openx-serde.jar:/usr/share/aws/sagemaker-spark-sdk/lib/sagemaker-spark-sdk.jar:/home/hadoop/extrajars/*" \
--conf spark.driver.extraLibraryPath="/usr/lib/hadoop/lib/native:/usr/lib/hadoop-lzo/lib/native:/docker/usr/lib/hadoop/lib/native:/docker/usr/lib/hadoop-lzo/lib/native" \
--conf spark.executor.extraClassPath="/usr/lib/hadoop-lzo/lib/*:/usr/lib/hadoop/hadoop-aws.jar:/usr/share/aws/aws-java-sdk/*:/usr/share/aws/emr/emrfs/conf:/usr/share/aws/emr/emrfs/lib/*:/usr/share/aws/emr/emrfs/auxlib/*:/usr/share/aws/emr/security/conf:/usr/share/aws/emr/security/lib/*:/usr/share/aws/hmclient/lib/aws-glue-datacatalog-spark-client.jar:/usr/share/java/Hive-JSON-Serde/hive-openx-serde.jar:/usr/share/aws/sagemaker-spark-sdk/lib/sagemaker-spark-sdk.jar:/home/hadoop/extrajars/*" \
--conf spark.executor.extraLibraryPath="/usr/lib/hadoop/lib/native:/usr/lib/hadoop-lzo/lib/native:/docker/usr/lib/hadoop/lib/native:/docker/usr/lib/hadoop-lzo/lib/native" \
--conf spark.hadoop.fs.s3.customAWSCredentialsProvider=com.amazonaws.auth.WebIdentityTokenCredentialsProvider \
--conf spark.hadoop.fs.s3.impl=com.amazon.ws.emr.hadoop.fs.EmrFileSystem \
--conf spark.hadoop.fs.AbstractFileSystem.s3.impl=org.apache.hadoop.fs.s3.EMRFSDelegate \
--conf spark.hadoop.fs.s3.buffer.dir=/mnt/s3 \
--conf spark.hadoop.fs.s3n.impl=com.amazon.ws.emr.hadoop.fs.EmrFileSystem \
--deploy-mode cluster \
s3://aws-data-lake-workshop/spark-eks/spark-eks-assembly-3.3.0.jar s3://nyc-tlc/csv_backup 2017 s3://nyc-tlc/misc/taxi_zone_lookup.csv s3://S3_BUCKET/emr-eks-results emr_eks_demo

The job takes about 7 minutes to complete with two executors of one core and 1 G of memory.

Using custom kubernetes schedulers

Customers running a large volume of jobs concurrently might face challenges related to providing fair access to compute capacity that they aren’t able to solve with the standard scheduling and resource utilization management Kubernetes offers. In addition, customers that are migrating from Amazon EMR on Amazon Elastic Compute Cloud (Amazon EC2) and are managing their scheduling with YARN queues will not be able to transpose them to Kubernetes scheduling capabilities.

To overcome this issue, you can use custom schedulers like Apache Yunikorn or Volcano.Spark Operator natively supports these schedulers, and with them you can schedule Spark applications based on factors such as priority, resource requirements, and fairness policies, while Spark Operator simplifies application deployment and management. To set up Yunikorn with gang scheduling and use it in Spark applications submitted through Spark Operator, refer to Spark Operator with YuniKorn.

Clean up

To avoid unwanted charges to your AWS account, delete all the AWS resources created during this deployment:

eksctl delete cluster -f eks-cluster.yaml

Conclusion

In this post, we introduced the EMR runtime feature for Spark Operator and spark-submit, and explored the advantages of using this feature on an EKS cluster. With the optimized EMR runtime, you can significantly enhance the performance of your Spark applications while optimizing costs. We demonstrated the deployment of the cluster using the eksctl tool, , you can also use the Data on EKS blueprints for deploying a production-ready EKS which you can use for EMR on EKS and leverage these new deployment methods in addition to the EMR on EKS API job submission method. By running your applications on the optimized EMR runtime, you can further enhance your Spark application workflows and drive innovation in your data processing pipelines.


About the Authors

Lotfi Mouhib is a Senior Solutions Architect working for the Public Sector team with Amazon Web Services. He helps public sector customers across EMEA realize their ideas, build new services, and innovate for citizens. In his spare time, Lotfi enjoys cycling and running.

Vara Bonthu is a dedicated technology professional and Worldwide Tech Leader for Data on EKS, specializing in assisting AWS customers ranging from strategic accounts to diverse organizations. He is passionate about open-source technologies, data analytics, AI/ML, and Kubernetes, and boasts an extensive background in development, DevOps, and architecture. Vara’s primary focus is on building highly scalable data and AI/ML solutions on Kubernetes platforms, helping customers harness the full potential of cutting-edge technology for their data-driven pursuits.
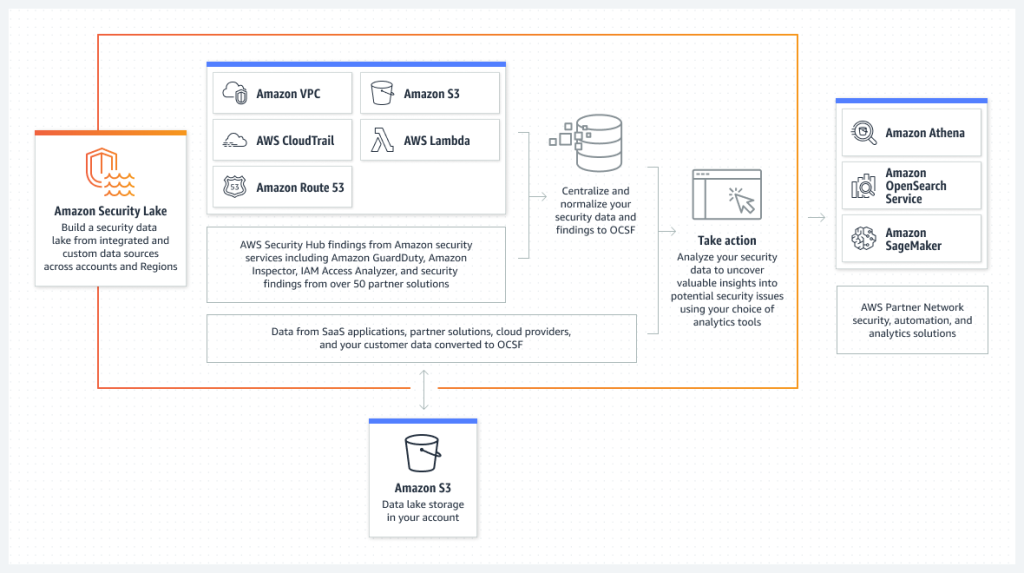
AWS Week in Review – Amazon Security Lake Now GA, New Actions on AWS Fault Injection Simulator, and More – June 5, 2023

Post Syndicated from Veliswa Boya original https://aws.amazon.com/blogs/aws/aws-week-in-review-amazon-security-lake-now-ga-new-actions-on-aws-fault-injection-simulator-and-more-june-5-2023/

Last Wednesday, I traveled to Cape Town to speak at the .Net Developer User Group. My colleague Francois Bouteruche also gave a talk but joined virtually. I enjoyed my time there—what an amazing community! Join the group in order to learn about upcoming events.

Now onto the AWS updates from last week. There was a lot of news related to AWS, and I have compiled a few announcements you need to know. Let’s get started!

Last Week’s Launches
Here are a few launches from last week that you might have missed:

Amazon Security Lake is now Generally Available – This service automatically centralizes security data from AWS environments, SaaS providers, on-premises environments, and cloud sources into a purpose-built data lake stored in your account, making it easier to analyze security data, gain a more comprehensive understanding of security across your entire organization, and improve the protection of your workloads, applications, and data. Read more in Channy’s post announcing the preview of Security Lake.

New AWS Direct Connect Location in Santiago, Chile – The AWS Direct Connect service lets you create a dedicated network connection to AWS. With this service, you can build hybrid networks by linking your AWS and on-premises networks to build applications that span environments without compromising performance. Last week we announced the opening of a new AWS Direct Connect location in Santiago, Chile. This new Santiago location offers dedicated 1 Gbps and 10 Gbps connections, with MACsec encryption available for 10 Gbps. For more information on over 115 Direct Connect locations worldwide, visit the locations section of the Direct Connect product detail pages.

New actions on AWS Fault Injection Simulator for Amazon EKS and Amazon ECS – Had it not been for Adrian Hornsby’s LinkedIn post I would have missed this announcement. We announced the expanded support of AWS Fault Injection Simulator (FIS) for Amazon Elastic Kubernetes Service (EKS) and Amazon Elastic Container Service (ECS). This expanded support adds additional AWS FIS actions for Amazon EKS and Amazon ECS. Learn more about Amazon ECS task actions here, and Amazon EKS pod actions here.

Other AWS News
A few more news items and blog posts you might have missed:

Autodesk Uses Sagemaker to Improve Observability – One of our customers, Autodesk, used AWS services including Amazon Sagemaker, Amazon Kinesis, and Amazon API Gateway to build a platform that enables development and deployment of near-real time personalization experiments by modeling and responding to user behavior data. All this delivered a dynamic, personalized experience for Autodesk’s customers. Read more about the story at AWS Customer Stories.

AWS DMS Serverless – We announced AWS DMS Serverless which lets you automatically provision and scale capacity for migration and data replication. Donnie wrote about this announcement here.

For AWS open-source news and updates, check out the latest newsletter curated by my colleague Ricardo Sueiras to bring you the most recent updates on open-source projects, posts, events, and more.

For a full list of AWS announcements, be sure to keep an eye on the What’s New at AWS page.

Upcoming AWS Events
We have the following upcoming events. These give you the opportunity to meet with other tech enthusiasts and learn:

AWS Silicon Innovation Day (June 21) – A one-day virtual event that will allow you to understand AWS Silicon and how you can use AWS’s unique silicon offerings to innovate. Learn more and register here.

AWS Global Summits – Sign up for the AWS Summit closest to where you live: London (June 7), Washington, DC (June 7–8), Toronto (June 14).

AWS Community Days – Join these community-led conferences where event logistics and content are planned, sourced, and delivered by community leaders: Chicago, Illinois (June 15), and Chile (July 1).

And with that, I end my very first Week in Review post, and this was such fun to write. Come back next Monday for another Week in Review!

Veliswa x

This post is part of our Week in Review series. Check back each week for a quick roundup of interesting news and announcements from AWS!

How SOCAR handles large IoT data with Amazon MSK and Amazon ElastiCache for Redis

Post Syndicated from Younggu Yun original https://aws.amazon.com/blogs/big-data/how-socar-handles-large-iot-data-with-amazon-msk-and-amazon-elasticache-for-redis/

This is a guest blog post co-written with SangSu Park and JaeHong Ahn from SOCAR. 

As companies continue to expand their digital footprint, the importance of real-time data processing and analysis cannot be overstated. The ability to quickly measure and draw insights from data is critical in today’s business landscape, where rapid decision-making is key. With this capability, businesses can stay ahead of the curve and develop new initiatives that drive success.

This post is a continuation of How SOCAR built a streaming data pipeline to process IoT data for real-time analytics and control. In this post, we provide a detailed overview of streaming messages with Amazon Managed Streaming for Apache Kafka (Amazon MSK) and Amazon ElastiCache for Redis, covering technical aspects and design considerations that are essential for achieving optimal results.

SOCAR is the leading Korean mobility company with strong competitiveness in car-sharing. SOCAR wanted to design and build a solution for a new Fleet Management System (FMS). This system involves the collection, processing, storage, and analysis of Internet of Things (IoT) streaming data from various vehicle devices, as well as historical operational data such as location, speed, fuel level, and component status.

This post demonstrates a solution for SOCAR’s production application that allows them to load streaming data from Amazon MSK into ElastiCache for Redis, optimizing the speed and efficiency of their data processing pipeline. We also discuss the key features, considerations, and design of the solution.

Background

SOCAR operates about 20,000 cars and is planning to include other large vehicle types such as commercial vehicles and courier trucks. SOCAR has deployed in-car devices that capture data using AWS IoT Core. This data was then stored in Amazon Relational Database Service (Amazon RDS). The challenge with this approach included inefficient performance and high resource usage. Therefore, SOCAR looked for purpose-built databases tailored to the needs of their application and usage patterns while meeting the future requirements of SOCAR’s business and technical requirements. The key requirements for SOCAR included achieving maximum performance for real-time data analytics, which required storing data in an in-memory data store.

After careful consideration, ElastiCache for Redis was selected as the optimal solution due to its ability to handle complex data aggregation rules with ease. One of the challenges faced was loading data from Amazon MSK into the database, because there was no built-in Kafka connector and consumer available for this task. This post focuses on the development of a Kafka consumer application that was designed to tackle this challenge by enabling performant data loading from Amazon MSK to Redis.

Solution overview

Extracting valuable insights from streaming data can be a challenge for businesses with diverse use cases and workloads. That’s why SOCAR built a solution to seamlessly bring data from Amazon MSK into multiple purpose-built databases, while also empowering users to transform data as needed. With fully managed Apache Kafka, Amazon MSK provides a reliable and efficient platform for ingesting and processing real-time data.

The following figure shows an example of the data flow at SOCAR.

solution overview

This architecture consists of three components:

  • Streaming data – Amazon MSK serves as a scalable and reliable platform for streaming data, capable of receiving and storing messages from a variety of sources, including AWS IoT Core, with messages organized into multiple topics and partitions
  • Consumer application – With a consumer application, users can seamlessly bring data from Amazon MSK into a target database or data storage while also defining data transformation rules as needed
  • Target databases – With the consumer application, the SOCAR team was able to load data from Amazon MSK into two separate databases, each serving a specific workload

Although this post focuses on a specific use case with ElastiCache for Redis as the target database and a single topic called gps, the consumer application we describe can handle additional topics and messages, as well as different streaming sources and target databases such as Amazon DynamoDB. Our post covers the most important aspects of the consumer application, including its features and components, design considerations, and a detailed guide to the code implementation.

Components of the consumer application

The consumer application comprises three main parts that work together to consume, transform, and load messages from Amazon MSK into a target database. The following diagram shows an example of data transformations in the handler component.

consumer-application

The details of each component are as follows:

  • Consumer – This consumes messages from Amazon MSK and then forwards the messages to a downstream handler.
  • Loader – This is where users specify a target database. For example, SOCAR’s target databases include ElastiCache for Redis and DynamoDB.
  • Handler – This is where users can apply data transformation rules to the incoming messages before loading them into a target database.

Features of the consumer application

This connection has three features:

  • Scalability – This solution is designed to be scalable, ensuring that the consumer application can handle an increasing volume of data and accommodate additional applications in the future. For instance, SOCAR sought to develop a solution capable of handling not only the current data from approximately 20,000 vehicles but also a larger volume of messages as the business and data continue to grow rapidly.
  • Performance – With this consumer application, users can achieve consistent performance, even as the volume of source messages and target databases increases. The application supports multithreading, allowing for concurrent data processing, and can handle unexpected spikes in data volume by easily increasing compute resources.
  • Flexibility – This consumer application can be reused for any new topics without having to build the entire consumer application again. The consumer application can be used to ingest new messages with different configuration values in the handler. SOCAR deployed multiple handlers to ingest many different messages. Also, this consumer application allows users to add additional target locations. For example, SOCAR initially developed a solution for ElastiCache for Redis and then replicated the consumer application for DynamoDB.

Design considerations of the consumer application

Note the following design considerations for the consumer application:

  • Scale out – A key design principle of this solution is scalability. To achieve this, the consumer application runs with Amazon Elastic Kubernetes Service (Amazon EKS) because it can allow users to increase and replicate consumer applications easily.
  • Consumption patterns – To receive, store, and consume data efficiently, it’s important to design Kafka topics depending on messages and consumption patterns. Depending on messages consumed at the end, messages can be received into multiple topics of different schemas. For example, SOCAR has many different topics that are consumed by different workloads.
  • Purpose-built database – The consumer application supports loading data into multiple target options based on the specific use case. For example, SOCAR stored real-time IoT data in ElastiCache for Redis to power real-time dashboard and web applications, while storing recent trip information in DynamoDB that didn’t require real-time processing.

Walkthrough overview

The producer of this solution is AWS IoT Core, which sends out messages into a topic called gps. The target database of this solution is ElastiCache for Redis. ElastiCache for Redis a fast in-memory data store that provides sub-millisecond latency to power internet-scale, real-time applications. Built on open-source Redis and compatible with the Redis APIs, ElastiCache for Redis combines the speed, simplicity, and versatility of open-source Redis with the manageability, security, and scalability from Amazon to power the most demanding real-time applications.

The target location can be either another database or storage depending on the use case and workload. SOCAR uses Amazon EKS to operate the containerized solution to achieve scalability, performance, and flexibility. Amazon EKS is a managed Kubernetes service to run Kubernetes in the AWS Cloud. Amazon EKS automatically manages the availability and scalability of the Kubernetes control plane nodes responsible for scheduling containers, managing application availability, storing cluster data, and other key tasks.

For the programming language, the SOCAR team decided to use the Go Programming language, utilizing both the AWS SDK for Go and a Goroutine, a lightweight logical or virtual thread managed by the Go runtime, which makes it easy to manage multiple threads. The AWS SDK for Go simplifies the use of AWS services by providing a set of libraries that are consistent and familiar for Go developers.

In the following sections, we walk through the steps to implement the solution:

  1. Create a consumer.
  2. Create a loader.
  3. Create a handler.
  4. Build a consumer application with the consumer, loader, and handler.
  5. Deploy the consumer application.

Prerequisites

For this walkthrough, you should have the following:

Create a consumer

In this example, we use a topic called gps, and the consumer includes a Kafka client that receives messages from the topic. SOCAR created a struct and built a consumer (called NewConsumer in the code) to make it extendable. With this approach, any additional parameters and rules can be added easily.

To authenticate with Amazon MSK, SOCAR uses IAM. Because SOCAR already uses IAM to authenticate other resources, such as Amazon EKS, it uses the same IAM role (aws_msk_iam_v2) to authenticate clients for both Amazon MSK and Apache Kafka actions.

The following code creates the consumer:

type Consumer struct {
	logger      *zerolog.Logger
	kafkaReader *kafka.Reader
}

func NewConsumer(logger *zerolog.Logger, awsCfg aws.Config, brokers []string, consumerGroupID, topic string) *Consumer {
	return &Consumer{
		logger: logger,
		kafkaReader: kafka.NewReader(kafka.ReaderConfig{
			Dialer: &kafka.Dialer{
				TLS:           &tls.Config{MinVersion: tls.VersionTLS12},
				Timeout:       10 * time.Second,
				DualStack:     true,
				SASLMechanism: aws_msk_iam_v2.NewMechanism(awsCfg),
			},
			Brokers:     brokers, //
			GroupID:     consumerGroupID, //
			Topic:       topic, //
			StartOffset: kafka.LastOffset, //
		}),
	}
}

func (consumer *Consumer) Close() error {
	var err error = nil
	if consumer.kafkaReader != nil {
		err = consumer.kafkaReader.Close()
		consumer.logger.Info().Msg("closed kafka reader")
	}
	return err
}

func (consumer *Consumer) Consume(ctx context.Context) (kafka.message, error) {
	return consumer.kafkaReader.Readmessage(ctx)
}

Create a loader

The loader function, represented by the Loader struct, is responsible for loading messages to the target location, which in this case is ElastiCache for Redis. The NewLoader function initializes a new instance of the Loader struct with a logger and a Redis cluster client, which is used to communicate with the ElastiCache cluster. The redis.NewClusterClient object is initialized using the NewRedisClient function, which uses IAM to authenticate the client for Redis actions. This ensures secure and authorized access to the ElastiCache cluster. The Loader struct also contains the Close method to close the Kafka reader and free up resources.

The following code creates a loader:

type Loader struct {
	logger      *zerolog.Logger
	redisClient *redis.ClusterClient
}

func NewLoader(logger *zerolog.Logger, redisClient *redis.ClusterClient) *Loader {
	return &Loader{
		logger:      logger,
		redisClient: redisClient,
	}
}

func (consumer *Consumer) Close() error {
	var err error = nil
	if consumer.kafkaReader != nil {
		err = consumer.kafkaReader.Close()
		consumer.logger.Info().Msg("closed kafka reader")
	}
	return err
}

func (consumer *Consumer) Consume(ctx context.Context) (kafka.Message, error) {
	return consumer.kafkaReader.ReadMessage(ctx)
}

func NewRedisClient(ctx context.Context, awsCfg aws.Config, addrs []string, replicationGroupID, username string) (*redis.ClusterClient, error) {
	redisClient := redis.NewClusterClient(&redis.ClusterOptions{
		NewClient: func(opt *redis.Options) *redis.Client {
			return redis.NewClient(&redis.Options{
				Addr: opt.Addr,
				CredentialsProvider: func() (username string, password string) {
					token, err := BuildRedisIAMAuthToken(ctx, awsCfg, replicationGroupID, opt.Username)
					if err != nil {
						panic(err)
					}
					return opt.Username, token
				},
				PoolSize:    opt.PoolSize,
				PoolTimeout: opt.PoolTimeout,
				TLSConfig:   &tls.Config{InsecureSkipVerify: true},
			})
		},
		Addrs:       addrs,
		Username:    username,
		PoolSize:    100,
		PoolTimeout: 1 * time.Minute,
	})
	pong, err := redisClient.Ping(ctx).Result()
	if err != nil {
		return nil, err
	}
	if pong != "PONG" {
		return nil, fmt.Errorf("failed to verify connection to redis server")
	}
	return redisClient, nil
}

Create a handler

A handler is used to include business rules and data transformation logic that prepares data before loading it into the target location. It acts as a bridge between a consumer and a loader. In this example, the topic name is cars.gps.json, and the message includes two keys, lng and lat, with data type Float64. The business logic can be defined in a function like handlerFuncGpsToRedis and then applied as follows:

type (
	handlerFunc    func(ctx context.Context, loader *Loader, key, value []byte) error
	handlerFuncMap map[string]handlerFunc
)

var HandlerRedis = handlerFuncMap{
	"cars.gps.json":   handlerFuncGpsToRedis
}

func GetHandlerFunc(funcMap handlerFuncMap, topic string) (handlerFunc, error) {
	handlerFunc, exist := funcMap[topic]
	if !exist {
		return nil, fmt.Errorf("failed to find handler func for '%s'", topic)
	}
	return handlerFunc, nil
}

func handlerFuncGpsToRedis(ctx context.Context, loader *Loader, key, value []byte) error {
	// unmarshal raw data to map
	data := map[string]interface{}{}
	err := json.Unmarshal(value, &data)
	if err != nil {
		return err
	}

	// prepare things to load on redis as geolocation
	name := string(key)
	lng, err := getFloat64ValueFromMap(data, "lng")
	if err != nil {
		return err
	}
	lat, err := getFloat64ValueFromMap(data, "lat")
	if err != nil {
		return err
	}

	// add geolocation to redis
	return loader.RedisGeoAdd(ctx, "cars#gps", name, lng, lat)
}

Build a consumer application with the consumer, loader, and handler

Now you have created the consumer, loader, and handler. The next step is to build a consumer application using them. In a consumer application, you read messages from your stream with a consumer, transform them using a handler, and then load transformed messages into a target location with a loader. These three components are parameterized in a consumer application function such as the one shown in the following code:

type Connector struct {
	ctx    context.Context
	logger *zerolog.Logger

	consumer *Consumer
	handler  handlerFuncMap
	loader   *Loader
}

func NewConnector(ctx context.Context, logger *zerolog.Logger, consumer *Consumer, handler handlerFuncMap, loader *Loader) *Connector {
	return &Connector{
		ctx:    ctx,
		logger: logger,

		consumer: consumer,
		handler:  handler,
		loader:   loader,
	}
}

func (connector *Connector) Close() error {
	var err error = nil
	if connector.consumer != nil {
		err = connector.consumer.Close()
	}
	if connector.loader != nil {
		err = connector.loader.Close()
	}
	return err
}

func (connector *Connector) Run() error {
	wg := sync.WaitGroup{}
	defer wg.Wait()
	handlerFunc, err := GetHandlerFunc(connector.handler, connector.consumer.kafkaReader.Config().Topic)
	if err != nil {
		return err
	}
	for {
		msg, err := connector.consumer.Consume(connector.ctx)
		if err != nil {
			if errors.Is(context.Canceled, err) {
				break
			}
		}

		wg.Add(1)
		go func(key, value []byte) {
			defer wg.Done()
			err = handlerFunc(connector.ctx, connector.loader, key, value)
			if err != nil {
				connector.logger.Err(err).Msg("")
			}
		}(msg.Key, msg.Value)
	}
	return nil
}

Deploy the consumer application

To achieve maximum parallelism, SOCAR containerizes the consumer application and deploys it into multiple pods on Amazon EKS. Each consumer application contains a unique consumer, loader, and handler. For example, if you need to receive messages from a single topic with five partitions, you can deploy five identical consumer applications, each running in its own pod. Similarly, if you have two topics with three partitions each, you should deploy two consumer applications, resulting in a total of six pods. It’s a best practice to run one consumer application per topic, and the number of pods should match the number of partitions to enable concurrent message processing. The pod number can be specified in the Kubernetes deployment configuration

There are two stages in the Dockerfile. The first stage is the builder, which installs build tools and dependencies, and builds the application. The second stage is the runner, which uses a smaller base image (Alpine) and copies only the necessary files from the builder stage. It also sets the appropriate user permissions and runs the application. It’s also worth noting that the builder stage uses a specific version of the Golang image, while the runner stage uses a specific version of the Alpine image, both of which are considered to be lightweight and secure images.

The following code is an example of the Dockerfile:

# builder
FROM golang:1.18.2-alpine3.16 AS builder
RUN apk add build-base
WORKDIR /usr/src/app
COPY go.mod go.sum ./
RUN go mod download
COPY . .
RUN go build -o connector .

# runner
FROM alpine:3.16.0 AS runner
WORKDIR /usr/bin/app
RUN apk add --no-cache tzdata
RUN addgroup --system app && adduser --system --shell /bin/false --ingroup app app
COPY --from=builder /usr/src/app/connector .
RUN chown -R app:app /usr/bin/app
USER app
ENTRYPOINT ["/usr/bin/app/connector"]

Conclusion

In this post, we discussed SOCAR’s approach to building a consumer application that enables IoT real-time streaming from Amazon MSK to target locations such as ElastiCache for Redis. We hope you found this post informative and useful. Thank you for reading!


About the Authors

SangSu Park is the Head of Operation Group at SOCAR. His passion is to keep learning, embrace challenges, and strive for mutual growth through communication. He loves to travel in search of new cities and places.

jaehongJaeHong Ahn is a DevOps Engineer in SOCAR’s cloud infrastructure team. He is dedicated to promoting collaboration between developers and operators. He enjoys creating DevOps tools and is committed to using his coding abilities to help build a better world. He loves to cook delicious meals as a private chef for his wife.

bdb-2857-youngguYounggu Yun works at AWS Data Lab in Korea. His role involves helping customers across the APAC region meet their business objectives and overcome technical challenges by providing prescriptive architectural guidance, sharing best practices, and building innovative solutions together.

Let’s Architect! Getting started with containers

Post Syndicated from Luca Mezzalira original https://aws.amazon.com/blogs/architecture/lets-architect-getting-started-with-containers/

Most of AWS customers building cloud-native applications or modernizing applications choose containers to run their microservices applications to accelerate innovation and time to market while lowering their total cost of ownership (TCO). Using containers in AWS comes with other benefits, such as increased portability, scalability, and flexibility.

The combination of containers technologies and AWS services also provides features such as load balancing, auto scaling, and service discovery, making it easier to deploy and manage applications at scale.

In this edition of Let’s Architect! we share useful resources to help you to get started with containers on AWS.

Container Build Lens

This whitepaper describes the Container Build Lens for the AWS Well-Architected Framework. It helps customers review and improve their cloud-based architectures and better understand the business impact of their design decisions. The document describes general design principles for containers, as well as specific best practices and implementation guidance using the Six Pillars of the Well-Architected Framework.

Take me to explore the Containers Build Lens!

Follow Containers Build Lens Best practices to architect your containers-based workloads

Follow Containers Build Lens Best practices to architect your containers-based workloads.

EKS Workshop

The EKS Workshop is a useful resource to familiarize yourself with Amazon Elastic Kubernetes Service (Amazon EKS) by practicing on real use-cases. It is built to help users learn about Amazon EKS features and integrations with popular open-source projects. The workshop is abstracted into high-level learning modules, including Networking, Security, DevOps Automation, and more. These are further broken down into standalone labs focusing on a particular feature, tool, or use case.

Once you’re done experimenting with EKS Workshop, start building your environments with Amazon EKS Blueprints, a collection of Infrastructure as Code (IaC) modules that helps you configure and deploy consistent, batteries-included Amazon EKS clusters across accounts and regions following AWS best practices. Amazon EKS Blueprints are available in both Terraform and CDK.

Take me to this workshop!

The workshop is abstracted into high-level learning modules, including Networking, Security, DevOps Automation, and more.

The workshop is abstracted into high-level learning modules, including Networking, Security, DevOps Automation, and more.

Architecting for resiliency on AWS App Runner

Learn how to architect an highly available and resilient application using AWS App Runner. With App Runner, you can start with just the source code of your application or a container image. The complexity of running containerized applications is abstracted away, including the cloud resources needed for running your web application or API. App Runner manages load balancers, TLS certificates, auto scaling, logs, metrics, teachability and more, so you can focus on implementing your business logic in a highly scalable and elastic environment.

Take me to this blog post!

A high-level architecture for an available and resilient application with AWS App Runner.

A high-level architecture for an available and resilient application with AWS App Runner

Securing Kubernetes: How to address Kubernetes attack vectors

As part of designing any modern system on AWS, it is necessary to think about the security implications and what can affect your security posture. This session introduces the fundamentals of the Kubernetes architecture and common attack vectors. It also includes security controls provided by Amazon EKS and suggestions on how to address them. With these strategies, you can learn how to reduce risk for your Kubernetes-based workloads.

Take me to this video!

Some common attack vectors that need addressing with Kubernetes

Some common attack vectors that need addressing with Kubernetes

See you next time!

Thanks for exploring architecture tools and resources with us!

Next time we’ll talk about serverless.

To find all the posts from this series, check out the Let’s Architect! page of the AWS Architecture Blog.

Amazon GuardDuty Now Supports Amazon EKS Runtime Monitoring

Post Syndicated from Channy Yun original https://aws.amazon.com/blogs/aws/amazon-guardduty-now-supports-amazon-eks-runtime-monitoring/

Since Amazon GuardDuty launched in 2017, GuardDuty has been capable of analyzing tens of billions of events per minute across multiple AWS data sources, such as AWS CloudTrail event logs, Amazon Virtual Private Cloud (Amazon VPC) Flow Logs, and DNS query logs, Amazon Simple Storage Service (Amazon S3) data plane events, Amazon Elastic Kubernetes Service (Amazon EKS) audit logs, and Amazon Relational Database Service (Amazon RDS) login events to protect your AWS accounts and resources.

In 2020, GuardDuty added Amazon S3 protection to continuously monitor and profile S3 data access events and configurations to detect suspicious activities in Amazon S3. Last year, GuardDuty launched Amazon EKS protection to monitor control plane activity by analyzing Kubernetes audit logs from existing and new EKS clusters in your accounts, Amazon EBS malware protection to scan malicious files residing on an EC2 instance or container workload using EBS volumes, and Amazon RDS protection to identify potential threats to data stored in Amazon Aurora databases—recently generally available.

GuardDuty combines machine learning (ML), anomaly detection, network monitoring, and malicious file discovery using various AWS data sources. When threats are detected, GuardDuty automatically sends security findings to AWS Security Hub, Amazon EventBridge, and Amazon Detective. These integrations help centralize monitoring for AWS and partner services, automate responses to malware findings, and perform security investigations from GuardDuty.

Today, we are announcing the general availability of Amazon GuardDuty EKS Runtime Monitoring to detect runtime threats from over 30 security findings to protect your EKS clusters. The new EKS Runtime Monitoring uses a fully managed EKS add-on that adds visibility into individual container runtime activities, such as file access, process execution, and network connections.

GuardDuty can now identify specific containers within your EKS clusters that are potentially compromised and detect attempts to escalate privileges from an individual container to the underlying Amazon EC2 host and the broader AWS environment. GuardDuty EKS Runtime Monitoring findings provide metadata context to identify potential threats and contain them before they escalate.

Configure EKS Runtime Monitoring in GuardDuty
To get started, first enable EKS Runtime Monitoring with just a few clicks in the GuardDuty console.

Once you enable EKS Runtime Monitoring, GuardDuty can start monitoring and analyzing the runtime-activity events for all the existing and new EKS clusters for your accounts. If you want GuardDuty to deploy and update the required EKS-managed add-on for all the existing and new EKS clusters in your account, choose Manage agent automatically. This will also create a VPC endpoint through which the security agent delivers the runtime events to GuardDuty.

If you configure EKS Audit Log Monitoring and runtime monitoring together, you can achieve optimal EKS protection both at the cluster control plane level, and down to the individual pod or container operating system level. When used together, threat detection will be more contextual to allow quick prioritization and response. For example, a runtime-based detection on a pod exhibiting suspicious behavior can be augmented by an audit log-based detection, indicating the pod was unusually launched with elevated privileges.

These options are default, but they are configurable, and you can uncheck one of the boxes in order to disable EKS Runtime Monitoring. When you disable EKS Runtime Monitoring, GuardDuty immediately stops monitoring and analyzing the runtime-activity events for all the existing EKS clusters. If you had configured automated agent management through GuardDuty, this action also removes the security agent that GuardDuty had deployed.

Manage GuardDuty Agent Manually
If you want to manually deploy and update the EKS managed add-on, including the GuardDuty agent, per cluster in your account, uncheck Manage agent automatically in the EKS protection configuration.

When managing the add-on manually, you are also responsible for creating the VPC endpoint through which the security agent delivers the runtime events to GuardDuty. In the VPC endpoint console, choose Create endpoint. In the step, choose Other endpoint services for Service category, enter com.amazonaws.us-east-1.guardduty-data for Service name in the US East (N. Virginia) Region, and choose Verify service.

After the service name is successfully verified, choose VPC and subnets where your EKS cluster resides. Under Additional settings, choose Enable DNS name. Under Security groups, choose a security group that has the in-bound port 443 enabled from your VPC (or your EKS cluster).

Add the following policy to restrict VPC endpoint usage to the specified account only:

{
	"Version": "2012-10-17",
	"Statement": [
		{
			"Action": "*",
			"Resource": "*",
			"Effect": "Allow",
			"Principal": "*"
		},
		{
			"Condition": {
				"StringNotEquals": {
					"aws:PrincipalAccount": "123456789012"
				}
			},
			"Action": "*",
			"Resource": "*",
			"Effect": "Deny",
			"Principal": "*"
		}
	]
}

Now, you can install the Amazon GuardDuty EKS Runtime Monitoring add-on for your EKS clusters. Select this add-on in the Add-ons tab in your EKS cluster profile on the Amazon EKS console.

When you enable EKS Runtime Monitoring in GuardDuty and deploy the Amazon EKS add-on for your EKS cluster, you can view the new pods with the prefix amazon-guardduty-agent. GuardDuty now starts to consume runtime-activity events from all EC2 hosts and containers in the cluster. GuardDuty then analyzes these events for potential threats.

These pods collect various event types and send them to the GuardDuty backend for threat detection and analysis. When managing the add-on manually, you need to go through these steps for each EKS cluster that you want to monitor, including new EKS clusters. To learn more, see Managing GuardDuty agent manually in the AWS documentation.

Checkout EKS Runtime Security Findings
When GuardDuty detects a potential threat and generates a security finding, you can view the details of the corresponding findings. These security findings indicate either a compromised EC2 instance, container workload, an EKS cluster, or a set of compromised credentials in your AWS environment.

If you want to generate EKS Runtime Monitoring sample findings for testing purposes, see Generating sample findings in GuardDuty in the AWS documentation. Here is an example of potential security issues: a newly created or recently modified binary file in an EKS cluster has been executed.

The ResourceType for an EKS Protection finding type could be an Instance, EKSCluster, or Container. If the Resource type in the finding details is EKSCluster, it indicates that either a pod or a container inside an EKS cluster is potentially compromised. Depending on the potentially compromised resource type, the finding details may contain Kubernetes workload details, EKS cluster details, or instance details.

The Runtime details such as process details and any required context describe information about the observed process, and the runtime context describes any additional information about the potentially suspicious activity.

To remediate a compromised pod or container image, see Remediating Kubernetes security issues discovered by GuardDuty in the AWS documentation. This document describes the recommended remediation steps for each resource type. To learn more about security finding types, see GuardDuty EKS Runtime Monitoring finding types in the AWS documentation.

Now Available
You can now use Amazon GuardDuty for EKS Runtime Monitoring. For a full list of Regions where EKS Runtime Monitoring is available, visit region-specific feature availability.

The first 30 days of GuardDuty for EKS Runtime Monitoring are available at no additional charge for existing GuardDuty accounts. If you enabled GuardDuty for the first time, EKS Runtime Monitoring is not enabled by default, and needs to be enabled as described above. After the trial period ends in the GuardDuty, you can see the estimated cost of EKS Runtime Monitoring. To learn more, see the GuardDuty pricing page.

For more information, see the Amazon GuardDuty User Guide and send feedback to AWS re:Post for Amazon GuardDuty or through your usual AWS support contacts.

Channy

Build event-driven data pipelines using AWS Controllers for Kubernetes and Amazon EMR on EKS

Post Syndicated from Victor Gu original https://aws.amazon.com/blogs/big-data/build-event-driven-data-pipelines-using-aws-controllers-for-kubernetes-and-amazon-emr-on-eks/

An event-driven architecture is a software design pattern in which decoupled applications can asynchronously publish and subscribe to events via an event broker. By promoting loose coupling between components of a system, an event-driven architecture leads to greater agility and can enable components in the system to scale independently and fail without impacting other services. AWS has many services to build solutions with an event-driven architecture, such as Amazon EventBridge, Amazon Simple Notification Service (Amazon SNS), Amazon Simple Queue Service (Amazon SQS), and AWS Lambda.

Amazon Elastic Kubernetes Service (Amazon EKS) is becoming a popular choice among AWS customers to host long-running analytics and AI or machine learning (ML) workloads. By containerizing your data processing tasks, you can simply deploy them into Amazon EKS as Kubernetes jobs and use Kubernetes to manage underlying computing compute resources. For big data processing, which requires distributed computing, you can use Spark on Amazon EKS. Amazon EMR on EKS, a managed Spark framework on Amazon EKS, enables you to run Spark jobs with benefits of scalability, portability, extensibility, and speed. With EMR on EKS, the Spark jobs run using the Amazon EMR runtime for Apache Spark, which increases the performance of your Spark jobs so that they run faster and cost less than open-source Apache Spark.

Data processes require a workflow management to schedule jobs and manage dependencies between jobs, and require monitoring to ensure that the transformed data is always accurate and up to date. One popular orchestration tool for managing workflows is Apache Airflow, which can be installed in Amazon EKS. Alternatively, you can use the AWS-managed version, Amazon Managed Workflows for Apache Airflow (Amazon MWAA). Another option is to use AWS Step Functions, which is a serverless workflow service that integrates with EMR on EKS and EventBridge to build event-driven workflows.

In this post, we demonstrate how to build an event-driven data pipeline using AWS Controllers for Kubernetes (ACK) and EMR on EKS. We use ACK to provision and configure serverless AWS resources, such as EventBridge and Step Functions. Triggered by an EventBridge rule, Step Functions orchestrates jobs running in EMR on EKS. With ACK, you can use the Kubernetes API and configuration language to create and configure AWS resources the same way you create and configure a Kubernetes data processing job. Because most of the managed services are serverless, you can build and manage your entire data pipeline using the Kubernetes API with tools such as kubectl.

Solution overview

ACK lets you define and use AWS service resources directly from Kubernetes, using the Kubernetes Resource Model (KRM). The ACK project contains a series of service controllers, one for each AWS service API. With ACK, developers can stay in their familiar Kubernetes environment and take advantage of AWS services for their application-supporting infrastructure. In the post Microservices development using AWS controllers for Kubernetes (ACK) and Amazon EKS blueprints, we show how to use ACK for microservices development.

In this post, we show how to build an event-driven data pipeline using ACK controllers for EMR on EKS, Step Functions, EventBridge, and Amazon Simple Storage Service (Amazon S3). We provision an EKS cluster with ACK controllers using Terraform modules. We create the data pipeline with the following steps:

  1. Create the emr-data-team-a namespace and bind it with the virtual cluster my-ack-vc in Amazon EMR by using the ACK controller.
  2. Use the ACK controller for Amazon S3 to create an S3 bucket. Upload the sample Spark scripts and sample data to the S3 bucket.
  3. Use the ACK controller for Step Functions to create a Step Functions state machine as an EventBridge rule target based on Kubernetes resources defined in YAML manifests.
  4. Use the ACK controller for EventBridge to create an EventBridge rule for pattern matching and target routing.

The pipeline is triggered when a new script is uploaded. An S3 upload notification is sent to EventBridge and, if it matches the specified rule pattern, triggers the Step Functions state machine. Step Functions calls the EMR virtual cluster to run the Spark job, and all the Spark executors and driver are provisioned inside the emr-data-team-a namespace. The output is saved back to the S3 bucket, and the developer can check the result on the Amazon EMR console.

The following diagram illustrates this architecture.

Prerequisites

Ensure that you have the following tools installed locally:

Deploy the solution infrastructure

Because each ACK service controller requires different AWS Identity and Access Management (IAM) roles for managing AWS resources, it’s better to use an automation tool to install the required service controllers. For this post, we use Amazon EKS Blueprints for Terraform and the AWS EKS ACK Addons Terraform module to provision the following components:

  • A new VPC with three private subnets and three public subnets
  • An internet gateway for the public subnets and a NAT Gateway for the private subnets
  • An EKS cluster control plane with one managed node group
  • Amazon EKS-managed add-ons: VPC_CNI, CoreDNS, and Kube_Proxy
  • ACK controllers for EMR on EKS, Step Functions, EventBridge, and Amazon S3
  • IAM execution roles for EMR on EKS, Step Functions, and EventBridge

Let’s start by cloning the GitHub repo to your local desktop. The module eks_ack_addons in addon.tf is for installing ACK controllers. ACK controllers are installed by using helm charts in the Amazon ECR public galley. See the following code:

cd examples/usecases/event-driven-pipeline
terraform init
terraform plan
terraform apply -auto-approve #defaults to us-west-2

The following screenshot shows an example of our output. emr_on_eks_role_arn is the ARN of the IAM role created for Amazon EMR running Spark jobs in the emr-data-team-a namespace in Amazon EKS. stepfunction_role_arn is the ARN of the IAM execution role for the Step Functions state machine. eventbridge_role_arn is the ARN of the IAM execution role for the EventBridge rule.

The following command updates kubeconfig on your local machine and allows you to interact with your EKS cluster using kubectl to validate the deployment:

region=us-west-2
aws eks --region $region update-kubeconfig --name event-driven-pipeline-demo

Test your access to the EKS cluster by listing the nodes:

kubectl get nodes
# Output should look like below
NAME                                        STATUS   ROLES    AGE     VERSION
ip-10-1-10-64.us-west-2.compute.internal    Ready    <none>   19h     v1.24.9-eks-49d8fe8
ip-10-1-10-65.us-west-2.compute.internal    Ready    <none>   19h     v1.24.9-eks-49d8fe8
ip-10-1-10-7.us-west-2.compute.internal     Ready    <none>   19h     v1.24.9-eks-49d8fe8
ip-10-1-10-73.us-west-2.compute.internal    Ready    <none>   19h     v1.24.9-eks-49d8fe8
ip-10-1-11-96.us-west-2.compute.internal    Ready    <none>   19h     v1.24.9-eks-49d8fe8
ip-10-1-12-197.us-west-2.compute.internal   Ready    <none>   19h     v1.24.9-eks-49d8fe8

Now we’re ready to set up the event-driven pipeline.

Create an EMR virtual cluster

Let’s start by creating a virtual cluster in Amazon EMR and link it with a Kubernetes namespace in EKS. By doing that, the virtual cluster will use the linked namespace in Amazon EKS for running Spark workloads. We use the file emr-virtualcluster.yaml. See the following code:

apiVersion: emrcontainers.services.k8s.aws/v1alpha1
kind: VirtualCluster
metadata:
  name: my-ack-vc
spec:
  name: my-ack-vc
  containerProvider:
    id: event-driven-pipeline-demo  # your eks cluster name
    type_: EKS
    info:
      eksInfo:
        namespace: emr-data-team-a # namespace binding with EMR virtual cluster

Let’s apply the manifest by using the following kubectl command:

kubectl apply -f ack-yamls/emr-virtualcluster.yaml

You can navigate to the Virtual clusters page on the Amazon EMR console to see the cluster record.

Create an S3 bucket and upload data

Next, let’s create a S3 bucket for storing Spark pod templates and sample data. We use the s3.yaml file. See the following code:

apiVersion: s3.services.k8s.aws/v1alpha1
kind: Bucket
metadata:
  name: sparkjob-demo-bucket
spec:
  name: sparkjob-demo-bucket

kubectl apply -f ack-yamls/s3.yaml

If you don’t see the bucket, you can check the log from the ACK S3 controller pod for details. The error is mostly caused if a bucket with the same name already exists. You need to change the bucket name in s3.yaml as well as in eventbridge.yaml and sfn.yaml. You also need to update upload-inputdata.sh and upload-spark-scripts.sh with the new bucket name.

Run the following command to upload the input data and pod templates:

bash spark-scripts-data/upload-inputdata.sh

The sparkjob-demo-bucket S3 bucket is created with two folders: input and scripts.

Create a Step Functions state machine

The next step is to create a Step Functions state machine that calls the EMR virtual cluster to run a Spark job, which is a sample Python script to process the New York City Taxi Records dataset. You need to define the Spark script location and pod templates for the Spark driver and executor in the StateMachine object .yaml file. Let’s make the following changes (highlighted) in sfn.yaml first:

  • Replace the value for roleARN with stepfunctions_role_arn
  • Replace the value for ExecutionRoleArn with emr_on_eks_role_arn
  • Replace the value for VirtualClusterId with your virtual cluster ID
  • Optionally, replace sparkjob-demo-bucket with your bucket name

See the following code:

apiVersion: sfn.services.k8s.aws/v1alpha1
kind: StateMachine
metadata:
  name: run-spark-job-ack
spec:
  name: run-spark-job-ack
  roleARN: "arn:aws:iam::xxxxxxxxxxx:role/event-driven-pipeline-demo-sfn-execution-role"   # replace with your stepfunctions_role_arn
  tags:
  - key: owner
    value: sfn-ack
  definition: |
      {
      "Comment": "A description of my state machine",
      "StartAt": "input-output-s3",
      "States": {
        "input-output-s3": {
          "Type": "Task",
          "Resource": "arn:aws:states:::emr-containers:startJobRun.sync",
          "Parameters": {
            "VirtualClusterId": "f0u3vt3y4q2r1ot11m7v809y6",  
            "ExecutionRoleArn": "arn:aws:iam::xxxxxxxxxxx:role/event-driven-pipeline-demo-emr-eks-data-team-a",
            "ReleaseLabel": "emr-6.7.0-latest",
            "JobDriver": {
              "SparkSubmitJobDriver": {
                "EntryPoint": "s3://sparkjob-demo-bucket/scripts/pyspark-taxi-trip.py",
                "EntryPointArguments": [
                  "s3://sparkjob-demo-bucket/input/",
                  "s3://sparkjob-demo-bucket/output/"
                ],
                "SparkSubmitParameters": "--conf spark.executor.instances=10"
              }
            },
            "ConfigurationOverrides": {
              "ApplicationConfiguration": [
                {
                 "Classification": "spark-defaults",
                "Properties": {
                  "spark.driver.cores":"1",
                  "spark.executor.cores":"1",
                  "spark.driver.memory": "10g",
                  "spark.executor.memory": "10g",
                  "spark.kubernetes.driver.podTemplateFile":"s3://sparkjob-demo-bucket/scripts/driver-pod-template.yaml",
                  "spark.kubernetes.executor.podTemplateFile":"s3://sparkjob-demo-bucket/scripts/executor-pod-template.yaml",
                  "spark.local.dir" : "/data1,/data2"
                }
              }
              ]
            }...

You can get your virtual cluster ID from the Amazon EMR console or with the following command:

kubectl get virtualcluster -o jsonpath={.items..status.id}
# result:
f0u3vt3y4q2r1ot11m7v809y6  # VirtualClusterId

Then apply the manifest to create the Step Functions state machine:

kubectl apply -f ack-yamls/sfn.yaml

Create an EventBridge rule

The last step is to create an EventBridge rule, which is used as an event broker to receive event notifications from Amazon S3. Whenever a new file, such as a new Spark script, is created in the S3 bucket, the EventBridge rule will evaluate (filter) the event and invoke the Step Functions state machine if it matches the specified rule pattern, triggering the configured Spark job.

Let’s use the following command to get the ARN of the Step Functions state machine we created earlier:

kubectl get StateMachine -o jsonpath={.items..status.ackResourceMetadata.arn}
# result
arn: arn:aws:states:us-west-2:xxxxxxxxxx:stateMachine:run-spark-job-ack # sfn_arn

Then, update eventbridge.yaml with the following values:

  • Under targets, replace the value for roleARN with eventbridge_role_arn

Under targets, replace arn with your sfn_arn

  • Optionally, in eventPattern, replace sparkjob-demo-bucket with your bucket name

See the following code:

apiVersion: eventbridge.services.k8s.aws/v1alpha1
kind: Rule
metadata:
  name: eb-rule-ack
spec:
  name: eb-rule-ack
  description: "ACK EventBridge Filter Rule to sfn using event bus reference"
  eventPattern: | 
    {
      "source": ["aws.s3"],
      "detail-type": ["Object Created"],
      "detail": {
        "bucket": {
          "name": ["sparkjob-demo-bucket"]    
        },
        "object": {
          "key": [{
            "prefix": "scripts/"
          }]
        }
      }
    }
  targets:
    - arn: arn:aws:states:us-west-2:xxxxxxxxxx:stateMachine:run-spark-job-ack # replace with your sfn arn
      id: sfn-run-spark-job-target
      roleARN: arn:aws:iam::xxxxxxxxx:role/event-driven-pipeline-demo-eb-execution-role # replace your eventbridge_role_arn
      retryPolicy:
        maximumRetryAttempts: 0 # no retries
  tags:
    - key:owner
      value: eb-ack

By applying the EventBridge configuration file, an EventBridge rule is created to monitor the folder scripts in the S3 bucket sparkjob-demo-bucket:

kubectl apply -f ack-yamls/eventbridge.yaml

For simplicity, the dead-letter queue is not set and maximum retry attempts is set to 0. For production usage, set them based on your requirements. For more information, refer to Event retry policy and using dead-letter queues.

Test the data pipeline

To test the data pipeline, we trigger it by uploading a Spark script to the S3 bucket scripts folder using the following command:

bash spark-scripts-data/upload-spark-scripts.sh

The upload event triggers the EventBridge rule and then calls the Step Functions state machine. You can go to the State machines page on the Step Functions console and choose the job run-spark-job-ack to monitor its status.

For the Spark job details, on the Amazon EMR console, choose Virtual clusters in the navigation pane, and then choose my-ack-vc. You can review all the job run history for this virtual cluster. If you choose Spark UI in any row, you’re redirected the Spark history server for more Spark driver and executor logs.

Clean up

To clean up the resources created in the post, use the following code:

aws s3 rm s3://sparkjob-demo-bucket --recursive # clean up data in S3
kubectl delete -f ack-yamls/. #Delete aws resources created by ACK
terraform destroy -target="module.eks_blueprints_kubernetes_addons" -target="module.eks_ack_addons" -auto-approve -var region=$region
terraform destroy -target="module.eks_blueprints" -auto-approve -var region=$region
terraform destroy -auto-approve -var region=$regionterraform destroy -auto-approve -var region=$region

Conclusion

This post showed how to build an event-driven data pipeline purely with native Kubernetes API and tooling. The pipeline uses EMR on EKS as compute and uses serverless AWS resources Amazon S3, EventBridge, and Step Functions as storage and orchestration in an event-driven architecture. With EventBridge, AWS and custom events can be ingested, filtered, transformed, and reliably delivered (routed) to more than 20 AWS services and public APIs (webhooks), using human-readable configuration instead of writing undifferentiated code. EventBridge helps you decouple applications and achieve more efficient organizations using event-driven architectures, and has quickly become the event bus of choice for AWS customers for many use cases, such as auditing and monitoring, application integration, and IT automation.

By using ACK controllers to create and configure different AWS services, developers can perform all data plane operations without leaving the Kubernetes platform. Also, developers only need to maintain the EKS cluster because all the other components are serverless.

As a next step, clone the GitHub repository to your local machine and test the data pipeline in your own AWS account. You can modify the code in this post and customize it for your own needs by using different EventBridge rules or adding more steps in Step Functions.


About the authors

Victor Gu is a Containers and Serverless Architect at AWS. He works with AWS customers to design microservices and cloud native solutions using Amazon EKS/ECS and AWS serverless services. His specialties are Kubernetes, Spark on Kubernetes, MLOps and DevOps.

Michael Gasch is a Senior Product Manager for AWS EventBridge, driving innovations in event-driven architectures. Prior to AWS, Michael was a Staff Engineer at the VMware Office of the CTO, working on open-source projects, such as Kubernetes and Knative, and related distributed systems research.

Peter Dalbhanjan is a Solutions Architect for AWS based in Herndon, VA. Peter has a keen interest in evangelizing AWS solutions and has written multiple blog posts that focus on simplifying complex use cases. At AWS, Peter helps with designing and architecting variety of customer workloads.

Genomics workflows, Part 5: automated benchmarking

Post Syndicated from Rostislav Markov original https://aws.amazon.com/blogs/architecture/genomics-workflows-part-5-automated-benchmarking/

Launching and running genomics workflows can take hours and involves large pools of compute instances that process data at a petabyte scale. Benchmarking helps you evaluate workflow performance and discover faster and cheaper ways of running them.

In practice, performance evaluations happen irregularly because of the associated heavy lifting. In this blog post, we discuss how life-science research teams can automate evaluations.

Business Benefits

An automated benchmarking solution provides:

  • more accurate enterprise resource planning by performing historical analytics,
  • lower cost to the business by comparing performance on different resource types, and
  • cost transparency to the business by quantifying periodical chargeback.

We’ve used automated benchmarking to compare processing times on different services such as Amazon Elastic Compute Cloud (Amazon EC2), AWS Batch, AWS ParallelCluster, Amazon Elastic Kubernetes Service (Amazon EKS), and on-premises HPC clusters. Scientists, financiers, technical leaders, and other stakeholders can build reports and dashboards to compare consumption data by consumer, workflow type, and time period.

Design pattern

Our automated benchmarking solution measures performance on two dimensions:

  • Timing: measures the duration of a workflow launch on a specific dataset
  • Pricing: measures the associated cost

This solution can be extended to other performance metrics such as iterations per second or process/thread distribution across compute nodes.

Our requirements include the following:

  • Consistent measurement of timing based on workflow status (such as preparing, waiting, ready, running, failed, complete)
  • Extensible pricing models based on unit prices (the Amazon EC2 Spot price at a specific period of time compared to Amazon EC2 On-Demand pricing)
  • Scalable, cost-efficient, and flexible data store enabling historical benchmarking and estimations
  • Minimal infrastructure management overhead

We choose a serverless design pattern using AWS Step Functions orchestration, AWS Lambda for our application code, and Amazon DynamoDB to track workflow launch IDs and states (as described in Part 3). We assume that the genomics workflows run on AWS Batch with genomics data on Amazon FSx for Lustre (Part 1). AWS Step Functions allows us to break down processing into smaller steps and avoid monolithic application code. Our evaluation process runs in four steps:

  1. Monitor for completed workflow launches in the DynamoDB stream using an Amazon EventBridge pipe with a Step Functions workflow as target. This event-driven approach is more efficient than periodic polling and avoids custom code for parsing status and cost values in all records of the DynamoDB stream.
  2. Collect a list of all compute resources associated with the workflow launch. Design a Lambda function that queries the AWS Batch API (see Part 1) to describe compute environment parameters like the Amazon EC2 instance IDs and their details, such as processing times, instance family/size, and allocation strategy (for example, Spot Instances, Reserved Instances, On-Demand Instances).
  3. Calculate the cost of all consumed resources. We achieve this with another Lambda function, which calculates the total price based on unit prices from the AWS Price List Query API.
  4. Our state machine updates the total price in the DynamoDB table without the need for additional application code.

Figure 1 visualizes these steps.

Automated benchmarking of genomics workflows

Figure 1. Automated benchmarking of genomics workflows

Implementation considerations

AWS Step Functions orchestrates our benchmarking workflow reliably and makes our application code easy to maintain. Figure 2 summarizes the state machine transitions that we’ll describe.

AWS Step Functions state machine for automated benchmarking

Figure 2. AWS Step Functions state machine for automated benchmarking

Gather consumption details

Configure the DynamoDB stream view type to New image so that the entire item is passed through as it appears after it was changed. We set up an Amazon EventBridge pipe with event filtering and the DynamoDB stream as a source. Our event filter uses multiple matching on records with a status of COMPLETE, but no cost entry in order to avoid an infinite loop. Once our state machine has updated the DynamoDB item with the workflow price, the resulting record in the DynamoDB stream will not pass our event filter.

The syntax of our event filter is as follows:

{
  "dynamodb": {
    "NewImage": {
      "status": {
        "S": ["COMPLETE"]
      },
      "totalCost": {
        "S": [{
          "exists": false
        }]
      }
    }
  }
}

We use an input transformer to simplify follow-on parsing by removing unnecessary metadata from the event.

The consumed resources included in the stream record are the auto-scaling group ID for AWS Batch and the Amazon FSx for Lustre volume ID. We use the DescribeJobs API (describe_jobs in Boto3) to determine which compute resources were used. If the response is a list of EC2 instances, we then look up consumption information including start and end times using the ListJobs API (list_jobs in Boto3) for each compute node. We use describe_volumes with filters on the identified EC2 instances to obtain the size and type of Amazon Elastic Block Store (Amazon EBS) volumes.

Calculate prices

Another Lambda function obtains the associated unit prices of all consumed resources using the GetProducts request of AWS Price List Query API (get_products in Boto3) and then parsing the pricePerUnit value. For Spot Instances, we use describe_spot_price_history of the EC2 client in Boto3 and specify the time range and instance types for which we want to receive prices.

Calculate the price of workflow launches based on the following factors:

  • Number and size of EC2 instances in auto-scaling node groups
  • Size of EBS volumes and Amazon FSx for Lustre
  • Processing duration

Our Python-based Lambda function calculates the total, rounds it, and delivers the price breakdown in the following format:

total_cost: str, instance_cost: str, volume_cost: str, filesystem_cost: str

Lastly, we put the price breakdown to the DynamoDB table using UpdateItem directly from the Amazon States Language.

Note that AWS credits and enterprise discounts might not be reflected in the responses of the AWS Price List Query API unless applied to the particular AWS account. This is often considered best practice in light of least-privilege considerations.

In the past, we’ve also used AWS Cost Explorer instead of the AWS Price List API. AWS Cost Explorer data is updated at least once every 24 hours. You can denote the pending price status in the DynamoDB table item and use the Wait state to delay the calculation process.

The presented solution can be extended to other compute services such as Amazon Elastic Kubernetes Service (Amazon EKS). For Amazon EKS, events are enriched with the cluster ID from the DynamoDB table and the price calculation should also include control plane costs.

Conclusion

Life-science research teams use benchmarking to compare workflow performance and inform their architectural decisions. Such evaluations are effort-intensive and therefore done irregularly.

In this blog post, we showed how life-science research teams can automate benchmarking for their scientific workflows. The insights teams gain from automated benchmarking indicate continuous optimization opportunities, such as by adjusting compute node configuration. The evaluation data is also available on demand for other purposes including chargeback.

Stay tuned for our next post in which we show how to use historical benchmarking data for price estimations of future workflow launches.

Related information

Realtime monitoring of microservices and cloud-native applications with IBM Instana SaaS on AWS

Post Syndicated from Eduardo Monich Fronza original https://aws.amazon.com/blogs/architecture/realtime-monitoring-of-microservices-and-cloud-native-applications-with-ibm-instana-saas-on-aws/

Customers are adopting microservices architecture to build innovative and scalable applications on Amazon Web Services (AWS). These microservices applications are deployed across multiple AWS services, and customers are looking for comprehensive observability solutions that can help them effectively monitor and manage the performance of their applications in real-time.

IBM Instana is a fully automated application performance management (APM) solution, available to customers as a fully managed software as a service (SaaS) solution on AWS. It is specifically designed to help customers address the challenges of monitoring microservices and cloud-native applications in real-time. It uses artificial intelligence and machine learning to provide detailed insights into the health and behavior of applications, allowing developers and IT teams to gain real-time insights into their microservices applications, optimize performance, and quickly identify and troubleshoot issues.

This post explains the capabilities of IBM Instana to automatically collect observability metrics, traces, and events from microservices deployed on AWS cloud, as well as on-premises, to provide full visibility into the performance of individual components and applications as a whole.

IBM Instana solution overview

IBM Instana is designed to be highly scalable and adaptable to changing microservices applications environments. Its architecture (Figure 1) consists of several components that work together to provide comprehensive monitoring for microservices and cloud-native applications.

Instana’s main building blocks are host agents and agent sensors that are deployed in a customer’s AWS account and responsible for collecting, aggregating, and sending detailed monitoring information of applications and AWS services to the Instana SaaS backend.

The Instana SaaS backend services provide several key components, including data collectors, storage services, analytics engines, and user interfaces. It allows customers to process and analyze data in real-time, generate actionable insights, have a comprehensive view of their applications and infrastructure performance, enabling them to quickly identify and resolve issues and improve their overall operations.

IBM Instana architecture on AWS

Figure 1. IBM Instana architecture on AWS

Monitoring data

Instana monitors and observes microservices and cloud-native applications by collecting beacons, traces, and one-second metrics:

  • Beacons are small monitoring payloads that are transmitted by a JavaScript agent to the Instana servers, modeling specific events occurring within the lifecycle of a page view of a website; for example, page loading, resource retrieval, and HTTP requests.
  • Traces are detailed records of the requests and transactions that flow through a microservice architecture. They record the sequence of events that occur when a request is processed, including the services that are involved, the duration of each service, and any errors or exceptions that occur. Instana automatically correlates traces across services to provide a complete view of an entire transaction. This allows for easy identification and diagnosis of performance issues.
  • Metrics are numerical values that represent the performance and resource utilization of a microservice or infrastructure component. Metrics are collected by Instana Agents and sent to the Instana backend at regular intervals. Instana Agents collect hundreds of different metrics, including (but not limited to) CPU usage, memory usage, network traffic, and disk I/O.

This information is captured by Instana agents and sensors, which also collect application configurations and events, plus discover application building blocks, including clusters, containers, and services.

IBM Instana agents and sensors

The Instana host agent is a lightweight software component that collects and aggregates data from various sensors before sending the data to the Instana backend. It can be deployed to AWS services, including Amazon Elastic Compute Cloud (Amazon EC2), Amazon Elastic Kubernetes Service (Amazon EKS), AWS Fargate, AWS Lambda, or Red Hat OpenShift Service on AWS (ROSA). A single host agent, one per host, is used to collect data from monitored systems.

Once Instana agents are running, they automatically detect applications and services, such as containers running on Amazon EKS, and processes like Nginx, NodeJS, Spring Boot, Postgres, Elasticsearch, or Cassandra. For each component detected, different Instana sensors are automatically downloaded, installed, and configured to monitor the environment.

Instana sensors are small programs that are designed to attach and monitor one specific technology and pass their data to the agent. They are automatically managed, updated, loaded, and unloaded by the host agent.

These sensors can monitor several different AWS services like Lambda, Amazon DynamoDB, Amazon Simple Storage Service (Amazon S3), Amazon Aurora, Amazon Simple Queue Service, and Amazon Managed Streaming for Apache Kafka. They collect data—like request and error rates, latency, CPU utilization—via AWS APIs and Amazon CloudWatch.

Instana also provides sensors to collect data from applications running on AWS, like IBM MQ, IBM Db2, or Red Hat OpenShift Container Platform. Review IBM’s full list of supported technologies and AWS services.

Instana also provides tracers, which are used with runtimes like Java, .NET, NodeJS, plus others. They modify code execution to capture logs, traces at request level, and send those back to the Instana agent.

With the use of sensors, the host agent collects configuration data and monitors the applications it has detected. The host agent also handles communications with the Instana SaaS backend services. It collects, aggregates and sends logs, traces and records metrics (such as response times, error rates, and resource utilization) every second to the Instana SaaS backend in real-time, using secure and efficient communication protocols.

IBM Instana SaaS

The Instana SaaS backend is the heart of the Instana APM solution and responsible for processing, storing, and analyzing the monitoring data collected from the Instana agents and sensors installed in the customer’s infrastructure.

It consists of several components and services that work together to provide real-time monitoring and analysis of microservices applications, including:

  • Data collectors: Receive and process data from the Instana agents and sensors, and store it in the Instana backend for further analysis.
  • Analytics engine: Analyzes the data collected by the agents and sensors to provide insights into the performance and health of the microservices applications.
  • User interface: Web-based interface that customers use to view and analyze their monitoring data.
  • Alerting engine: Generates alerts when thresholds or anomalies are detected in the monitoring data.
  • Data storage: Time-series database that stores the monitoring data collected by the agents and sensors. Allows customers to query and analyze the data in real-time.
  • Integrations: Integrates with various third-party tools, such as Slack, PagerDuty, and ServiceNow, providing seamless alerting and incident management.

IBM Instana backend: making sense of the situation in real time

The Instana SaaS platform automatically ingests data from agents and continuously updates a dependency map (Figure 2). This map presents every dependency in context, giving users an easy way to understand the interrelationships between application components and services.

This understanding enables users to identify the upstream and downstream impacts of any issue, ensuring that they stay informed about any potential impacts.

An example of an IBM Instana dependency map

Figure 2. An example of an IBM Instana dependency map

Instana traces every request end-to-end without sampling. The traces are analyzed in real-time, providing metrics that make any performance problems immediately visible. In the event of an incident, Instana can illustrate how a single issue can generate a ripple effect and impact a number of directly and indirectly connected services. Using the relationship information from the Dynamic Graph, Instana’s automatic root-cause analysis can precisely aggregate the individual issues into a single incident.

Applications monitoring with IBM Instana

Figure 3. Applications monitoring with IBM Instana

Developers, IT operations, or site reliability engineers (SREs) can access the Instana backend end-user monitoring interface (Figure 3) or end-user monitoring (EUM) interface (Figure 4) to view monitoring data of their workloads. These can be websites, mobile applications, AWS services, and infrastructure levels. From this UI, these personas can access service dashboards that show key performance indicators (KPIs), like response time and error rate.

End-user monitoring with IBM Instana

Figure 4. End-user monitoring with IBM Instana

The following actions demonstrate how an EUM for a JavaScript application, deployed to Amazon S3 can be completed:

  • Developers inject Instana JavaScript code (Figure 5) into the static website (HTML).
  • When a user visits the website, the JavaScript agent sends beacons to the Instana backend.
  • Dashboards show specific events of the website lifecycle, including page loading, JS errors, and HTTP requests.
  • Teams access Instana UI to check performance matrices. They can configure Smart Alerts with custom alerting policies based on specific metrics and KPIs.
  • Smart Alerts can send alerts via various channels, such as email, Slack, or IBM Watson AIOps Webhook.
  • In case of an incident, teams can use Instana to retrieve various performance metrics for root-cause analysis.
  • Developers can resolve the issues and apply the patch.
IBM Instana EUM JavaScript agent

Figure 5. IBM Instana EUM JavaScript agent

Instana also offers Smart Alerts (Figure 6) to provide a more intuitive process of managing alerts. With Smart Alerts, customers can automatically generate alerting configurations using relevant KPIs and automatic threshold detection for use cases like website slowness or website errors.

IBM Instana Smart Alerts

Figure 6. IBM Instana Smart Alerts

Conclusion

In this post, we discussed how IBM Instana provides a comprehensive monitoring solution with the right tools to help you implement a real-time observability and monitoring solution. It allows you to gain insight into your microservices and cloud-native applications, including visibility into AWS services, containers, on-premises infrastructure, and other technologies. Instana can quickly identify and resolve issues before they impact end-users, ensuring that your applications are performing optimally.

As an IT administrator, developer, or business owner, IBM Instana on AWS give a deeper understanding of your applications and help you make data-driven decisions to improve overall performance.

Additional resources

Disaster Recovery Solutions with AWS-Managed Services, Part 3: Multi-Site Active/Passive

Post Syndicated from Brent Kim original https://aws.amazon.com/blogs/architecture/disaster-recovery-solutions-with-aws-managed-services-part-3-multi-site-active-passive/

Welcome to the third post of a multi-part series that addresses disaster recovery (DR) strategies with the use of AWS-managed services to align with customer requirements of performance, cost, and compliance. In part two of this series, we introduced a DR concept that utilizes managed services through a backup and restore strategy with multiple Regions. The post also introduces a multi-site active/passive approach.

The multi-site active/passive approach is best for customers who have business-critical workloads with higher availability requirements over other active/passive environments. A warm-standby strategy (as in Figure 1) is more costly than other active/passive strategies, but provides good protection from downtime and data loss outside of an active/active (A/A) environment.

Warm standby

Figure 1. Warm standby

Implementing the multi-site active/passive strategy

By replicating across multiple Availability Zones in same Region, your workloads become resilient to the failure of an entire data center. Using multiple Regions provides the most resilient option to deploy workloads, which safeguards against the risk of failure of multiple data centers.

Let’s explore an application that processes payment transactions and is modernized to utilize managed services in the AWS Cloud, as in Figure 2.

Warm standby with managed services

Figure 2. Warm standby with managed services

Let’s cover each of the components of this application, as well as how managed services behave in a multisite environment.

1. Amazon Route53 – Active/Passive Failover: This configuration consists of primary resources to be available, and secondary resources on standby in the case of failure of the primary environment. You would just need to create the records and specify failover for the routing policy. When responding to queries, Amazon Route 53 includes only the healthy primary resources. If the primary record configured in the Route 53 health check shows as unhealthy, Route 53 responds to DNS queries using the secondary record.

2. Amazon EKS control plane: Amazon Elastic Kubernetes Service (Amazon EKS) control plane nodes run in an account managed by AWS. Each EKS cluster control plane is single-tenant and unique, and runs on its own set of Amazon Elastic Compute Cloud (Amazon EC2) instances. Amazon EKS is also a Regional service, so each cluster is confined to the Region where it is deployed, with each cluster being a standalone entity.

3. Amazon EKS data plane: Operating highly available and resilient applications requires a highly available and resilient data plane. It’s best practice to create worker nodes using Amazon EC2 Auto Scaling groups instead of creating individual Amazon EC2 instances and joining them to the cluster.

Figure 2 shows three nodes in the primary Region while there will only be a single node in the secondary. In case of failover, the data plane scales up to meet the workload requirements. This strategy deploys a functional stack to the secondary Region to test Region readiness before failover. You can use Velero with Portworx to manage snapshots of persistent volumes. These snapshots can be stored in an Amazon Simple Storage Service (Amazon S3) bucket in the primary Region, which is replicated to an Amazon S3 bucket in another Region using Amazon S3 cross-Region replication.

During an outage in the primary Region, Velero restores volumes from the latest snapshots in the standby cluster.

4. Amazon OpenSearch Service: With cross-cluster replication in Amazon OpenSearch Service, you can replicate indexes, mappings, and metadata from one OpenSearch Service domain to another. The domain follows an active-passive replication model where the follower index (where the data is replicated) pulls data from the leader index. Using cross-cluster replication helps to ensure recovery from disaster events and allows you to replicate data across geographically distant data centers to reduce latency.

Cross-cluster replication is available on domains running Elasticsearch 7.10 or OpenSearch 1.1 or later. Full documentation for cross-cluster replication is available in the OpenSearch documentation.

If you are using any versions prior to Elasticsearch 7.10 or OpenSearch 1.1, refer to part two of our blog series for guidance on using APIs for cross-Region replication.

5. Amazon RDS for PostgreSQL: One of the managed service offerings of Amazon Relational Database Service (Amazon RDS) for PostgreSQL is cross-Region read replicas. Cross-Region read replicas enable you to have a DR solution scaling read database workloads, and cross-Region migration.

Amazon RDS for PostgreSQL supports the ability to create read replicas of a source database (DB). Amazon RDS uses an asynchronous replication method of the DB engine to update the read replica whenever there is a change made on the source DB instance. Although read replicas operate as a DB instance that allows only read-only connections, they can be used to implement a DR solution for your production DB environment. If the source DB instance fails, you can promote your Read Replica to a standalone source server.

Using a cross-Region read replica helps ensure that you get back up and running if you experience a Regional availability issue. For more information on PostgreSQL cross-Region read replicas, visit the Best Practices for Amazon RDS for PostgreSQL Cross-Region Read Replicas blog post.

6. Amazon ElastiCache: AWS provides a native solution called Global Datastore that enables cross-Region replication. By using the Global Datastore for Redis feature, you can work with fully managed, fast, reliable, and secure replication across AWS Regions. This feature helps create cross-Region read replica clusters for ElastiCache for Redis to enable low-latency reads and DR across AWS Regions. Each global datastore is a collection of one or more clusters that replicate to one another. When you create a global datastore in Amazon ElastiCache, ElastiCache for Redis automatically replicates your data from the primary cluster to the secondary cluster. ElastiCache then sets up and manages automatic, asynchronous replication of data between the two clusters.

7. Amazon Redshift: With Amazon Redshift, there are only two ways of deploying a true DR approach: backup and restore, and an (A/A) solution. We’ll use the A/A solution as this provides a better recovery time objective (RTO) for the overall approach. The recovery point objective (RPO) is dependent upon the configured schedule of AWS Lambda functions. The application within the primary Region sends data to both Amazon Simple Notification Service (Amazon SNS) and Amazon S3, and the data is distributed to the Redshift clusters in both Regions through Lambda functions.

Amazon EKS uploads data to an Amazon S3 bucket and publishes a message to an Amazon SNS topic with a reference to the stored S3 object. S3 acts as an intermediate data store for messages beyond the maximum output limit of Amazon SNS. Amazon SNS is configured with primary and secondary Region Amazon Simple Queue Service (Amazon SQS) endpoint subscriptions. Amazon SNS supports the cross-Region delivery of notifications to Amazon SQS queues. Lambda functions deployed in the primary and secondary Region are used to poll the Amazon SQS queue in respective Regions to read the message. The Lambda functions then use the Amazon SQS Extended Client Library for Java to retrieve the Amazon S3 object referenced in the message. Once the Amazon S3 object is retrieved, the Lambda functions upload the data into Amazon Redshift.

For more on how to coordinate large messages across accounts and Regions with Amazon SNS and Amazon SQS, explore the Coordinating Large Messages Across Accounts and Regions with Amazon SNS and SQS blog post.

Conclusion

This active/passive approach covers how you can build a creative DR solution using a mix of native and non-native cross-Region replication methods. By using managed services, this strategy becomes simpler through automation of service updates, deployment using Infrastructure as a Code (IaaC), and general management of the two environments.

Related information

Want to learn more? Explore the following resources within this series and beyond!

AWS Week in Review – February 27, 2023

Post Syndicated from Antje Barth original https://aws.amazon.com/blogs/aws/aws-week-in-review-february-27-2023/

A couple days ago, I had the honor of doing a live stream on generative AI, discussing recent innovations and concepts behind the current generation of large language and vision models and how we got there. In today’s roundup of news and announcements, I will share some additional information—including an expanded partnership to make generative AI more accessible, a blog post about diffusion models, and our weekly Twitch show on Generative AI. Let’s dive right into it!

Last Week’s Launches
Here are some launches that got my attention during the previous week:

Integrated Private Wireless on AWS – The Integrated Private Wireless on AWS program is designed to provide enterprises with managed and validated private wireless offerings from leading communications service providers (CSPs). The offerings integrate CSPs’ private 5G and 4G LTE wireless networks with AWS services across AWS Regions, AWS Local Zones, AWS Outposts, and AWS Snow Family. For more details, read this Industries Blog post and check out this eBook. And, if you’re attending the Mobile World Congress Barcelona this week, stop by the AWS booth at the Upper Walkway, South Entrance, at the Fira Barcelona Gran Via, to learn more.

AWS Glue Crawlers – Now integrate with Lake Formation. AWS Glue Crawlers are used to discover datasets, extract schema information, and populate the AWS Glue Data Catalog. With this Glue Crawler and Lake Formation integration, you can configure a crawler to use Lake Formation permissions to access an S3 data store or a Data Catalog table with an underlying S3 location within the same AWS account or another AWS account. You can configure an existing Data Catalog table as a crawler’s target if the crawler and the Data Catalog table reside in the same account. To learn more, check out this Big Data Blog post.

AWS Glue Crawlers now support integration with AWS Lake Formation

Amazon SageMaker Model Monitor – You can now launch and configure Amazon SageMaker Model Monitor from the SageMaker Model Dashboard using a code-free point-and-click setup experience. SageMaker Model Dashboard gives you unified monitoring across all your models by providing insights into deviations from expected behavior, automated alerts, and troubleshooting to improve model performance. Model Monitor can detect drift in data quality, model quality, bias, and feature attribution and alert you to take remedial actions when such changes occur.

Amazon EKS – Now supports Kubernetes version 1.25. Kubernetes 1.25 introduced several new features and bug fixes, and you can now use Amazon EKS and Amazon EKS Distro to run Kubernetes version 1.25. You can create new 1.25 clusters or upgrade your existing clusters to 1.25 using the Amazon EKS console, the eksctl command line interface, or through an infrastructure-as-code tool. To learn more about this release named “Combiner,” check out this Containers Blog post.

Amazon Detective – New self-paced workshop available. You can now learn to use Amazon Detective with a new self-paced workshop in AWS Workshop Studio. AWS Workshop Studio is a collection of self-paced tutorials designed to teach practical skills and techniques to solve business problems. The Amazon Detective workshop is designed to teach you how to use the primary features of Detective through a series of interactive modules that cover topics such as security alert triage, security incident investigation, and threat hunting. Get started with the Amazon Detective Workshop.

For a full list of AWS announcements, be sure to keep an eye on the What’s New at AWS page.

Other AWS News
Here are some additional news items and blog posts that you may find interesting:

🤗❤☁ AWS and Hugging Face collaborate to make generative AI more accessible and cost-efficient – This previous week, we announced an expanded collaboration between AWS and Hugging Face to accelerate the training, fine-tuning, and deployment of large language and vision models used to create generative AI applications. Generative AI applications can perform a variety of tasks, including text summarization, answering questions, code generation, image creation, and writing essays and articles. For more details, read this Machine Learning Blog post.

If you are interested in generative AI, I also recommend reading this blog post on how to Fine-tune text-to-image Stable Diffusion models with Amazon SageMaker JumpStart. Stable Diffusion is a deep learning model that allows you to generate realistic, high-quality images and stunning art in just a few seconds. This blog post discusses how to make design choices, including dataset quality, size of training dataset, choice of hyperparameter values, and applicability to multiple datasets.

AWS open-source news and updates – My colleague Ricardo writes this weekly open-source newsletter in which he highlights new open-source projects, tools, and demos from the AWS Community. Read edition #146 here.

Upcoming AWS Events
Check your calendars and sign up for these AWS events:

Build On AWS - Generative AI#BuildOn Generative AI – Join our weekly live Build On Generative AI Twitch show. Every Monday morning, 9:00 US PT, my colleagues Emily and Darko take a look at aspects of generative AI. They host developers, scientists, startup founders, and AI leaders and discuss how to build generative AI applications on AWS.

In today’s episode, my colleague Chris walked us through an end-to-end ML pipeline from data ingestion to fine-tuning and deployment of generative AI models. You can watch the video here.

AWS Pi Day 2023 SmallAWS Pi Day – Join me on March 14 for the third annual AWS Pi Day live, virtual event hosted on the AWS On Air channel on Twitch as we celebrate the 17th birthday of Amazon S3 and the cloud.

We will discuss the latest innovations across AWS Data services, from storage to analytics and AI/ML. If you are curious about how AI can transform your business, register here and join my session.

AWS Innovate Data and AI/ML edition – AWS Innovate is a free online event to learn the latest from AWS experts and get step-by-step guidance on using AI/ML to drive fast, efficient, and measurable results. Register now for EMEA (March 9) and the Americas (March 14).

You can browse all upcoming AWS-led in-person, virtual events and developer focused events such as Community Days.

That’s all for this week. Check back next Monday for another Week in Review!

— Antje

This post is part of our Week in Review series. Check back each week for a quick roundup of interesting news and announcements from AWS!

AWS Week in Review – February 20, 2023

Post Syndicated from Channy Yun original https://aws.amazon.com/blogs/aws/aws-week-in-review-february-20-2023/

Since the devastating earthquake in Türkiye and Syria, Amazon has activated disaster relief services to quickly provide relief items to impacted areas. The company and Amazon customers have donated nearly 100,000 relief items so far, and donations continue to come in.

The AWS Disaster Preparedness and Response team is providing trained technical volunteers and solutions to Help.NGO, a United Nations standby partner assisting in the region.

We continue to support field requests for winter survival equipment, clothing, hygiene products, and other items. If you wish to donate, check out our blog post to find your local donation site and to learn more about how we’ve supported relief efforts so far. Thank you for your support!

Last Week’s Launches
As usual, let’s take a look at some launches from the last week that I want to remind you of:

New Amazon EC2 M7g and R7g instances – Since we launched C7g instances in May 2022, the General Purpose (M7g) and the Memory-Optimized (R7g) instances are generally available. Both types are powered by the latest generation AWS Graviton3 processors, and are designed to deliver up to 25 percent better performance than the equivalent sixth-generation (M6g and R6g) instances, making them the best performers in Amazon EC2.

Here is my infographic to highlight the principal performance and capacity improvements that we have made available with the new instances:

Enable AWS Systems Manager across all Amazon EC2 instances – All EC2 instances in your account become managed instances, with a single action using the Default Host Management Configuration (DHMC) Agent without changing existing instance profile roles. DHMC is ideal for all EC2 users, and offers a simple, scalable process to standardize the availability of System Manager tools for users who manage many instances. To learn more, see Default Host Management Configuration in the AWS documentation.

Programmatically manage opt-in AWS Regions – You can now view and manage enabled and disabled opt-in AWS Regions on your AWS accounts using AWS APIs. You can enable, disable, read, and list Region opt status by using the following AWS CLI commands in case of enabling Africa (Cape Town) Region:

$ aws account enable-region --region-name af-south-1
$ aws account get-region-opt-status --region-name af-south-1 
{ 
   "RegionName": "af-south-1", 
   "RegionOptStatus": "ENABLING" 
}

It will save you the time and effort of doing it through the AWS Management Console. To learn more, see Specifying which AWS Regions your account can use in the AWS documentation.

Pictured: A 3D rendering of the AWS Modular Data Center (MDC) unit.AWS Modular Data Center (AWS MDC) – AWS MDC is available as a self-contained modular data center unit: an environmentally controlled physical enclosure that can host racks of AWS Outposts or AWS Snow Family devices. AWS MDC lets defense customers run low-latency applications in infrastructure-limited environments for scenarios like large-scale military operations, crisis response, and security cooperation.

At this time, AWS MDC is now available in the AWS GovCloud Regions, and this service can only be purchased by the U.S. Department of Defense under the Joint Warfighting Cloud Capability (JWCC) contract. To learn more, read the AWS Public Sector Blog post.

A picture of a cute English bulldog on top of 3 AWS Snowball Edge device. Amazon EKS Anywhere on Snow – This is a new deployment option that helps you create and operate Kubernetes clusters on AWS Snowball Edge devices for provisioning and familiar operational visibility tooling of container applications deployed at the edge.

Amazon EKS Anywhere on Snow is ideal for customers who run their operations using secure and durable AWS Snow Family devices in unconditioned or mobile environments such as construction sites, ships, and rapidly deployed military forces. To learn more, read the AWS Container Blog post.

For a full list of AWS announcements, be sure to keep an eye on the What’s New at AWS page.

Other AWS News
Here are some other news items that you may find interesting in the last week:

Upcoming AWS Events
Check your calendars and sign up for these AWS-led events:

AWS at MWC 2023 – Join AWS at MWC23 in Barcelona, Spain, February 27 – March 2, and interact with upcoming innovative new service demonstrations, be inspired at one of our many sessions, or request a more personal meeting with us onsite.

AWS Innovate Data and AI/ML edition – AWS Innovate is a free online event to learn the latest from AWS experts and get step-by-step guidance on using AI/ML to drive fast, efficient, and measurable results. Register now for Asia Pacific & Japan (February 22, 2023), EMEA (March 9), and the Americas (March 14).

AWS Summits – AWS Global Summits are free events that bring the cloud computing community together to connect, collaborate, and learn about AWS. We kick off Paris and Sydney on April 4th and schedule most other Summits from April to June. Please stay tuned and watch for the dates and locations to be announced.

You can browse all upcoming AWS-led in-person, virtual events, and developer focused events such as Community Days.

That’s all for this week. Check back next Monday for another Week in Review!

— Channy

This post is part of our Week in Review series. Check back each week for a quick roundup of interesting news and announcements from AWS!

Journey to adopt Cloud-Native DevOps platform Series #2: Progressive delivery on Amazon EKS with Flagger and Gloo Edge Ingress Controller

Post Syndicated from Purna Sanyal original https://aws.amazon.com/blogs/devops/journey-to-adopt-cloud-native-devops-platform-series-2-progressive-delivery-on-amazon-eks-with-flagger-and-gloo-edge-ingress-controller/

In the last post, OfferUp modernized its DevOps platform with Amazon EKS and Flagger to accelerate time to market, we talked about hypergrowth and the technical challenges encountered by OfferUp in its existing DevOps platform. As a reminder, we presented how OfferUp modernized its DevOps platform with Amazon Elastic Kubernetes Service (Amazon EKS) and Flagger to gain developer’s velocity, automate faster deployment, and achieve lower cost of ownership.

In this post, we discuss the technical steps to build a DevOps platform that enables the progressive deployment of microservices on Amazon Managed Amazon EKS. Progressive delivery exposes a new version of the software incrementally to ingress traffic and continuously measures the success rate of the metrics before allowing all of the new traffics to a newer version of the software. Flagger is the Graduate project of Cloud Native Computing Foundations (CNCF) that enables progressive canary delivery, along with bule/green and A/B Testing, while measuring metrics like HTTP/gRPC request success rate and latency. Flagger shifts and routes traffic between app versions using a service mesh or an Ingress controller

We leverage Gloo Ingress Controller for traffic routing, Prometheus, Datadog, and Amazon CloudWatch for application metrics analysis and Slack to send notification. Flagger will post messages to slack when a deployment has been initialized, when a new revision has been detected, and if the canary analysis failed or succeeded.

Prerequisite steps to build the modern DevOps platform

You need an AWS Account and AWS Identity and Access Management (IAM) user to build the DevOps platform. If you don’t have an AWS account with Administrator access, then create one now by clicking here. Create an IAM user and assign admin role. You can build this platform in any AWS region however, I will you us-west-1 region throughout this post. You can use a laptop (Mac or Windows) or an Amazon Elastic Compute Cloud (AmazonEC2) instance as a client machine to install all of the necessary software to build the GitOps platform. For this post, I launched an Amazon EC2 instance (with Amazon Linux2 AMI) as the client and install all of the prerequisite software. You need the awscli, git, eksctl, kubectl, and helm applications to build the GitOps platform. Here are the prerequisite steps,

  1. Create a named profile(eks-devops)  with the config and credentials file:

aws configure --profile eks-devops

AWS Access Key ID [None]: xxxxxxxxxxxxxxxxxxxxxx

AWS Secret Access Key [None]: xxxxxxxxxxxxxxxxxx

Default region name [None]: us-west-1

Default output format [None]:

View and verify your current IAM profile:

export AWS_PROFILE=eks-devops

aws sts get-caller-identity

  1. If the Amazon EC2 instance doesn’t have git preinstalled, then install git in your Amazon EC2 instance:

sudo yum update -y

sudo yum install git -y

Check git version

git version

Git clone the repo and download all of the prerequisite software in the home directory.

git clone https://github.com/aws-samples/aws-gloo-flux.git

  1. Download all of the prerequisite software from install.sh which includes awscli, eksctl, kubectl, helm, and docker:

cd aws-gloo-flux/eks-flagger/

ls -lt

chmod 700 install.sh ecr-setup.sh

. install.sh

Check the version of the software installed:

aws --version

eksctl version

kubectl version -o json

helm version

docker --version

docker info

If the docker info shows an error like “permission denied”, then reboot the Amazon EC2 instance or re-log in to the instance again.

  1. Create an Amazon Elastic Container Repository (Amazon ECR) and push application images.

Amazon ECR is a fully-managed container registry that makes it easy for developers to share and deploy container images and artifacts. ecr setup.sh script will create a new Amazon ECR repository and also push the podinfo images (6.0.0, 6.0.1, 6.0.2, 6.1.0, 6.1.5 and 6.1.6) to the Amazon ECR. Run ecr-setup.sh script with the parameter, “ECR repository name” (e.g. ps-flagger-repository) and region (e.g. us-west-1)

./ecr-setup.sh <ps-flagger-repository> <us-west-1>

You’ll see output like the following (truncated).

###########################################################

Successfully created ECR repository and pushed podinfo images to ECR #

Please note down the ECR repository URI          

xxxxxx.dkr.ecr.us-west-1.amazonaws.com/ps-flagger-repository                                                   

Technical steps to build the modern DevOps platform

This post shows you how to use the Gloo Edge ingress controller and Flagger to automate canary releases for progressive deployment on the Amazon EKS cluster. Flagger requires a Kubernetes cluster v1.16 or newer and Gloo Edge ingress 1.6.0 or newer. This post will provide a step-by-step approach to install the Amazon EKS cluster with managed node group, Gloo Edge ingress controller, and Flagger for Gloo in the Amazon EKS cluster. Now that the cluster, metrics infrastructure, and Flagger are installed, we can install the sample application itself. We’ll use the standard Podinfo application used in the Flagger project and the accompanying loadtester tool. The Flagger “podinfo” backend service will be called by Gloo’s “VirtualService”, which is the root routing object for the Gloo Gateway. A virtual service describes the set of routes to match for a set of domains. We’ll automate the canary promotion, with the new image of the “podinfo” service, from version 6.0.0 to version 6.0.1. We’ll also create a scenario by injecting an error for automated canary rollback while deploying version 6.0.2.

  1. Use myeks-cluster.yaml to create your Amazon EKS cluster with managed nodegroup. myeks-cluster.yaml deployment file has “cluster name” value as ps-eks-66, region value as us-west-1, availabilityZones as [us-west-1a, us-west-1b], Kubernetes version as 1.24, and nodegroup Amazon EC2 instance type as m5.2xlarge. You can change this value if you want to build the cluster in a separate region or availability zone.

eksctl create cluster -f myeks-cluster.yaml

Check the Amazon EKS Cluster details:

kubectl cluster-info

kubectl version -o json

kubectl get nodes -o wide

kubectl get pods -A -o wide

Deploy the Metrics Server:

kubectl apply -f https://github.com/kubernetes-sigs/metrics-server/releases/latest/download/components.yaml

kubectl get deployment metrics-server -n kube-system

Update the kubeconfig file to interact with you cluster:

# aws eks update-kubeconfig --name <ekscluster-name> --region <AWS_REGION>

kubectl config view

cat $HOME/.kube/config

  1. Create a namespace “gloo-system” and Install Gloo with Helm Chart. Gloo Edge is an Envoy-based Kubernetes-native ingress controller to facilitate and secure application traffic.

helm repo add gloo https://storage.googleapis.com/solo-public-helm

kubectl create ns gloo-system

helm upgrade -i gloo gloo/gloo --namespace gloo-system

  1. Install Flagger and the Prometheus add-on in the same gloo-system namespace. Flagger is a Cloud Native Computing Foundation project and part of Flux family of GitOps tools.

helm repo add flagger https://flagger.app

helm upgrade -i flagger flagger/flagger \

--namespace gloo-system \

--set prometheus.install=true \

--set meshProvider=gloo

  1. [Optional] If you’re using Datadog as a monitoring tool, then deploy Datadog agents as a DaemonSet using the Datadog Helm chart. Replace RELEASE_NAME and DATADOG_API_KEY accordingly. If you aren’t using Datadog, then skip this step. For this post, we leverage the Prometheus open-source monitoring tool.

helm repo add datadog https://helm.datadoghq.com

helm repo update

helm install <RELEASE_NAME> \

    --set datadog.apiKey=<DATADOG_API_KEY> datadog/datadog

Integrate Amazon EKS/ K8s Cluster with the Datadog Dashboard – go to the Datadog Console and add the Kubernetes integration.

  1. [Optional] If you’re using Slack communication tool and have admin access, then Flagger can be configured to send alerts to the Slack chat platform by integrating the Slack alerting system with Flagger. If you don’t have admin access in Slack, then skip this step.

helm upgrade -i flagger flagger/flagger \

--set slack.url=https://hooks.slack.com/services/YOUR/SLACK/WEBHOOK \

--set slack.channel=general \

--set slack.user=flagger \

--set clusterName=<my-cluster>

  1. Create a namespace “apps”, and applications and load testing service will be deployed into this namespace.

kubectl create ns apps

Create a deployment and a horizontal pod autoscaler for your custom application or service for which canary deployment will be done.

kubectl -n apps apply -k app

kubectl get deployment -A

kubectl get hpa -n apps

Deploy the load testing service to generate traffic during the canary analysis.

kubectl -n apps apply -k tester

kubectl get deployment -A

kubectl get svc -n apps

  1. Use apps-vs.yaml to create a Gloo virtual service definition that references a route table that will be generated by Flagger.

kubectl apply -f ./apps-vs.yaml

kubectl get vs -n apps

[Optional] If you have your own domain name, then open apps-vs.yaml in vi editor and replace podinfo.example.com with your own domain name to run the app in that domain.

  1. Use canary.yaml to create a canary custom resource. Review the service, analysis, and metrics sections of the canary.yaml file.

kubectl apply -f ./canary.yaml

After a couple of seconds, Flagger will create the canary objects. When the bootstrap finishes, Flagger will set the canary status to “Initialized”.

kubectl -n apps get canary podinfo

NAME      STATUS        WEIGHT   LASTTRANSITIONTIME

podinfo   Initialized   0        2023-xx-xxTxx:xx:xxZ

Gloo automatically creates an ELB. Once the load balancer is provisioned and health checks pass, we can find the sample application at the load balancer’s public address. Note down the ELB’s Public address:

kubectl get svc -n gloo-system --field-selector 'metadata.name==gateway-proxy'   -o=jsonpath='{.items[0].status.loadBalancer.ingress[0].hostname}{"\n"}'

Validate if your application is running, and you’ll see an output with version 6.0.0.

curl <load balancer’s public address> -H "Host:podinfo.example.com"

Trigger progressive deployments and monitor the status

You can Trigger a canary deployment by updating the application container image from 6.0.0 to 6.01.

kubectl -n apps set image deployment/podinfo  podinfod=<ECR URI>:6.0.1

Flagger detects that the deployment revision changed and starts a new rollout.

kubectl -n apps describe canary/podinfo

Monitor all canaries, as the promoted status condition can have one of the following statuses: initialized, Waiting, Progressing, Promoting, Finalizing, Succeeded, and Failed.

watch kubectl get canaries --all-namespaces

curl < load balancer’s public address> -H "Host:podinfo.example.com"

Once canary is completed, validate your application. You can see that the version of the application is changed from 6.0.0 to 6.0.1.

{

  "hostname": "podinfo-primary-658c9f9695-4pqbl",

  "version": "6.0.1",

  "revision": "",

  "color": "#34577c",

  "logo": "https://raw.githubusercontent.com/stefanprodan/podinfo/gh-pages/cuddle_clap.gif",

  "message": "greetings from podinfo v6.0.1",

}

[Optional] Open podinfo application from the laptop browser

Find out both of the IP addresses associated with load balancer.

dig < load balancer’s public address >

Open /etc/hosts file in the laptop and add both of the IPs of load balancer in the host file.

sudo vi /etc/hosts

<Public IP address of LB Target node> podinfo.example.com

e.g.

xx.xx.xxx.xxx podinfo.example.com

xx.xx.xxx.xxx podinfo.example.com

Type “podinfo.example.com” in your browser and you’ll find the application in form similar to this:

Figure 1: Greetings from podinfo v6.0.1

Automated rollback

While doing the canary analysis, you’ll generate HTTP 500 errors and high latency to check if Flagger pauses and rolls back the faulted version. Flagger performs automatic Rollback in the case of failure.

Introduce another canary deployment with podinfo image version 6.0.2 and monitor the status of the canary.

kubectl -n apps set image deployment/podinfo podinfod=<ECR URI>:6.0.2

Run HTTP 500 errors or a high-latency error from a separate terminal window.

Generate HTTP 500 errors:

watch curl -H 'Host:podinfo.example.com' <load balancer’s public address>/status/500

Generate high latency:

watch curl -H 'Host:podinfo.example.com' < load balancer’s public address >/delay/2

When the number of failed checks reaches the canary analysis threshold, the traffic is routed back to the primary, the canary is scaled to zero, and the rollout is marked as failed.

kubectl get canaries --all-namespaces

kubectl -n apps describe canary/podinfo

Cleanup

When you’re done experimenting, you can delete all of the resources created during this series to avoid any additional charges. Let’s walk through deleting all of the resources used.

Delete Flagger resources and apps namespace
kubectl delete canary podinfo -n  apps

kubectl delete HorizontalPodAutoscaler podinfo -n apps

kubectl delete deployment podinfo -n   apps

helm -n gloo-system delete flagger

helm -n gloo-system delete gloo

kubectl delete namespace apps

Delete Amazon EKS Cluster
After you’ve finished with the cluster and nodes that you created for this tutorial, you should clean up by deleting the cluster and nodes with the following command:

eksctl delete cluster --name <cluster name> --region <region code>

Delete Amazon ECR

aws ecr delete-repository --repository-name ps-flagger-repository  --force

Conclusion

This post explained the process for setting up Amazon EKS cluster and how to leverage Flagger for progressive deployments along with Prometheus and Gloo Ingress Controller. You can enhance the deployments by integrating Flagger with Slack, Datadog, and webhook notifications for progressive deployments. Amazon EKS removes the undifferentiated heavy lifting of managing and updating the Kubernetes cluster. Managed node groups automate the provisioning and lifecycle management of worker nodes in an Amazon EKS cluster, which greatly simplifies operational activities such as new Kubernetes version deployments.

We encourage you to look into modernizing your DevOps platform from monolithic architecture to microservice-based architecture with Amazon EKS, and leverage Flagger with the right Ingress controller for secured and automated service releases.

Further Reading

Journey to adopt Cloud-Native DevOps platform Series #1: OfferUp modernized DevOps platform with Amazon EKS and Flagger to accelerate time to market

About the authors:

Purna Sanyal

Purna Sanyal is a technology enthusiast and an architect at AWS, helping digital native customers solve their business problems with successful adoption of cloud native architecture. He provides technical thought leadership, architecture guidance, and conducts PoCs to enable customers’ digital transformation. He is also passionate about building innovative solutions around Kubernetes, database, analytics, and machine learning.

Run fault tolerant and cost-optimized Spark clusters using Amazon EMR on EKS and Amazon EC2 Spot Instances

Post Syndicated from Kinnar Kumar Sen original https://aws.amazon.com/blogs/big-data/run-fault-tolerant-and-cost-optimized-spark-clusters-using-amazon-emr-on-eks-and-amazon-ec2-spot-instances/

Amazon EMR on EKS is a deployment option in Amazon EMR that allows you to run Spark jobs on Amazon Elastic Kubernetes Service (Amazon EKS). Amazon Elastic Compute Cloud (Amazon EC2) Spot Instances save you up to 90% over On-Demand Instances, and is a great way to cost optimize the Spark workloads running on Amazon EMR on EKS. Because Spot is an interruptible service, if we can move or reuse the intermediate shuffle files, it improves the overall stability and SLA of the job. The latest versions of Amazon EMR on EKS have integrated Spark features to enable this capability.

In this post, we discuss these features—Node Decommissioning and Persistent Volume Claim (PVC) reuse—and their impact on increasing the fault tolerance of Spark jobs on Amazon EMR on EKS when cost optimizing using EC2 Spot Instances.

Amazon EMR on EKS and Spot

EC2 Spot Instances are spare EC2 capacity provided at a steep discount of up to 90% over On-Demand prices. Spot Instances are a great choice for stateless and flexible workloads. The caveat with this discount and spare capacity is that Amazon EC2 can interrupt an instance with a proactive or reactive (2-minute) warning when it needs the capacity back. You can provision compute capacity in an EKS cluster using Spot Instances using a managed or self-managed node group and provide cost optimization for your workloads.

Amazon EMR on EKS uses Amazon EKS to run jobs with the EMR runtime for Apache Spark, which can be cost optimized by running the Spark executors on Spot. It provides up to 61% lower costs and up to 68% performance improvement for Spark workloads on Amazon EKS. The Spark application launches a driver and executors to run the computation. Spark is a semi-fault tolerant framework that is resilient to executor loss due to an interruption and therefore can run on EC2 Spot. On the other hand, when the driver is interrupted, the job fails. Hence, we recommend running drivers on on-demand instances. Some of the best practices for running Spark on Amazon EKS are applicable with Amazon EMR on EKS.

EC2 Spot instances also helps in cost optimization by improving the overall throughput of the job. This can be achieved by auto-scaling the cluster using Cluster Autoscaler (for managed nodegroups) or Karpenter.

Though Spark executors are resilient to Spot interruptions, the shuffle files and RDD data is lost when the executor gets killed. The lost shuffle files need to be recomputed, which increases the overall runtime of the job. Apache Spark has released two features (in versions 3.1 and 3.2) that addresses this issue. Amazon EMR on EKS released features such as node decommissioning (version 6.3) and PVC reuse (version 6.8) to simplify recovery and reuse shuffle files, which increases the overall resiliency of your application.

Node decommissioning

The node decommissioning feature works by preventing scheduling of new jobs on the nodes that are to be decommissioned. It also moves any shuffle files or cache present in those nodes to other executors (peers). If there are no other available executors, the shuffle files and cache are moved to a remote fallback storage.

Node Decommissioning

Fig 1 : Node Decommissioning

Let’s look at the decommission steps in more detail.

If one of the nodes that is running executors is interrupted, the executor starts the process of decommissioning and sends the message to the driver:

21/05/05 17:41:41 WARN KubernetesClusterSchedulerBackend$KubernetesDriverEndpoint: Received executor 7 decommissioned message
21/05/05 17:41:41 DEBUG TaskSetManager: Valid locality levels for TaskSet 2.0: NO_PREF, ANY
21/05/05 17:41:41 INFO KubernetesClusterSchedulerBackend: Decommission executors: 7
21/05/05 17:41:41 DEBUG TaskSchedulerImpl: parentName: , name: TaskSet_2.0, runningTasks: 10
21/05/05 17:41:41 INFO BlockManagerMasterEndpoint: Mark BlockManagers (BlockManagerId(7, 192.168.82.107, 39007, None)) as being decommissioning.
21/05/05 20:22:17 INFO CoarseGrainedExecutorBackend: Decommission executor 1.
21/05/05 20:22:17 INFO CoarseGrainedExecutorBackend: Will exit when finished decommissioning
21/05/05 20:22:17 INFO BlockManager: Starting block manager decommissioning process...
21/05/05 20:22:17 DEBUG FileSystem: Looking for FS supporting s3a

The executor looks for RDD or shuffle files and tries to replicate or migrate those files. It first tries to find a peer executor. If successful, it will move the files to the peer executor:

22/06/07 20:41:38 INFO ShuffleStatus: Updating map output for 46 to BlockManagerId(4, 192.168.13.235, 34737, None)
22/06/07 20:41:38 DEBUG BlockManagerMasterEndpoint: Received shuffle data block update for 0 46, ignore.
22/06/07 20:41:38 DEBUG BlockManagerMasterEndpoint: Received shuffle index block update for 0 46, updating.

However, if It is not able to find a peer executor, it will try to move the files to a fallback storage if available.

Fallback Storage

Fig 2: Fallback Storage

The executor is then decommissioned. When a new executor comes up, the shuffle files are reused:

22/06/07 20:42:50 INFO BasicExecutorFeatureStep: Adding decommission script to lifecycle
22/06/07 20:42:50 DEBUG ExecutorPodsAllocator: Requested executor with id 19 from Kubernetes.
22/06/07 20:42:50 DEBUG ExecutorPodsWatchSnapshotSource: Received executor pod update for pod named amazon-reviews-word-count-bfd0a5813fd1b80f-exec-19, action ADDED
22/06/07 20:42:50 DEBUG BlockManagerMasterEndpoint: Received shuffle index block update for 0 52, updating.
22/06/07 20:42:50 INFO ShuffleStatus: Recover 52 BlockManagerId(fallback, remote, 7337, None)

The key advantage of this process is that it enables migrates blocks and shuffle data, thereby reducing recomputation, which adds to the overall resiliency of the system and reduces runtime. This process can be triggered by a Spot interruption signal (Sigterm) and node draining. Node draining  may happen due to high-priority task scheduling or independently.

When you use Amazon EMR on EKS with managed node groups/Karpenter, the Spot interruption handling is automated, wherein Amazon EKS gracefully drains and rebalances the Spot nodes to minimize application disruption when a Spot node is at elevated risk of interruption. If you’re using managed node groups/Karpenter, the decommission gets triggered when the nodes are getting drained and because it’s proactive, it gives you more time (at least 2 minutes) to move the files. In the case of self-managed node groups, we recommend installing the AWS Node Termination Handler to handle the interruption, and the decommission is triggered when the reactive (2-minute) notification is received. We recommend to use Karpenter with Spot Instances as it has faster node scheduling with early pod binding and binpacking to optimize the resource utilization.

The following code enables this configuration; more details are available on GitHub:

"spark.decommission.enabled": "true"
"spark.storage.decommission.rddBlocks.enabled": "true"
"spark.storage.decommission.shuffleBlocks.enabled" : "true"
"spark.storage.decommission.enabled": "true"
"spark.storage.decommission.fallbackStorage.path": "s3://<<bucket>>"

PVC reuse

Apache Spark enabled dynamic PVC in version 3.1, which is useful with dynamic allocation because we don’t have to pre-create the claims or volumes for the executors and delete them after completion. PVC enables true decoupling of data and processing when we’re running Spark jobs on Kubernetes, because we can use it as a local storage to spill in-process files too. The latest version of Amazon EMR 6.8 has integrated the PVC reuse feature of Spark, wherein if an executor is terminated due to EC2 Spot interruption or any other reason (JVM), then the PVC is not deleted but persisted and reattached to another executor. If there are shuffle files in that volume, then they are reused.

As with node decommission, this reduces the overall runtime because we don’t have to recompute the shuffle files. We also save the time required to request a new volume for an executor, and shuffle files can be reused without moving the files round.

The following diagram illustrates this workflow.

PVC Reuse

Fig 3: PVC Reuse

Let’s look at the steps in more detail.

If one or more of the nodes that are running executors is interrupted, the underlying pods get terminated and the driver gets the update. Note that the driver is the owner of the PVC of the executors, and they are not terminated. See the following code:

22/06/15 23:25:07 DEBUG ExecutorPodsWatchSnapshotSource: Received executor pod update for pod named amazon-reviews-word-count-9ee82b8169a75183-exec-3, action DELETED
22/06/15 23:25:07 DEBUG ExecutorPodsWatchSnapshotSource: Received executor pod update for pod named amazon-reviews-word-count-9ee82b8169a75183-exec-6, action MODIFIED
22/06/15 23:25:07 DEBUG ExecutorPodsWatchSnapshotSource: Received executor pod update for pod named amazon-reviews-word-count-9ee82b8169a75183-exec-6, action DELETED
22/06/15 23:25:07 DEBUG ExecutorPodsWatchSnapshotSource: Received executor pod update for pod named amazon-reviews-word-count-9ee82b8169a75183-exec-3, action MODIFIED

The ExecutorPodsAllocator tries to allocate new executor pods to replace the ones terminated due to interruption. During the allocation, it figures out how many of the existing PVCs have files and can be reused:

22/06/15 23:25:23 INFO ExecutorPodsAllocator: Found 2 reusable PVCs from 10 PVCs

The ExecutorPodsAllocator requests for a pod and when it launches it, the PVC is reused. In the following example, the PVC from executor 6 is reused for new executor pod 11:

22/06/15 23:25:23 DEBUG ExecutorPodsAllocator: Requested executor with id 11 from Kubernetes.
22/06/15 23:25:24 DEBUG ExecutorPodsWatchSnapshotSource: Received executor pod update for pod named amazon-reviews-word-count-9ee82b8169a75183-exec-11, action ADDED
22/06/15 23:25:24 INFO KubernetesClientUtils: Spark configuration files loaded from Some(/usr/lib/spark/conf) : log4j.properties,spark-env.sh,hive-site.xml,metrics.properties
22/06/15 23:25:24 INFO BasicExecutorFeatureStep: Decommissioning not enabled, skipping shutdown script
22/06/15 23:25:24 DEBUG ExecutorPodsWatchSnapshotSource: Received executor pod update for pod named amazon-reviews-word-count-9ee82b8169a75183-exec-11, action MODIFIED
22/06/15 23:25:24 INFO ExecutorPodsAllocator: Reuse PersistentVolumeClaim amazon-reviews-word-count-9ee82b8169a75183-exec-6-pvc-0

The shuffle files, if present in the PVC are reused.

The key advantage of this technique is that it allows us to reuse pre-computed shuffle files in their original location, thereby reducing the time of the overall job run.

This works for both static and dynamic PVCs. Amazon EKS offers three different storage offerings, which can be encrypted too: Amazon Elastic Block Store (Amazon EBS), Amazon Elastic File System (Amazon EFS), and Amazon FSx for Lustre. We recommend using dynamic PVCs with Amazon EBS because with static PVCs, you would need to create multiple PVCs.

The following code enables this configuration; more details are available on GitHub:

"spark.kubernetes.driver.ownPersistentVolumeClaim": "true"
"spark.kubernetes.driver.reusePersistentVolumeClaim": "true"

For this to work, we need to enable PVC with Amazon EKS and mention the details in the Spark runtime configuration. For instructions, refer to How do I use persistent storage in Amazon EKS? The following code contains the Spark configuration details for using PVC as local storage; other details are available on GitHub:

"spark.kubernetes.executor.volumes.persistentVolumeClaim.spark-local-dir-1.mount.readOnly": "false"
"spark.kubernetes.executor.volumes.persistentVolumeClaim.spark-local-dir-1.options.claimName": "OnDemand"
"spark.kubernetes.executor.volumes.persistentVolumeClaim.spark-local-dir-1.options.storageClass": "spark-sc"
"spark.kubernetes.executor.volumes.persistentVolumeClaim.spark-local-dir-1.options.sizeLimit": "10Gi"
"spark.kubernetes.executor.volumes.persistentVolumeClaim.spark-local-dir-1.mount.path": "/var/data/spill"

Conclusion

With Amazon EMR on EKS (6.9) and the features discussed in this post, you can further reduce the overall runtime for Spark jobs when running with Spot Instances. This also improves the overall resiliency and flexibility of the job while cost optimizing the workload on EC2 Spot.

Try out the EMR on EKS workshop for improved performance when running Spark workloads on Kubernetes and cost optimize using EC2 Spot Instances.


About the Author

Kinnar Kumar Sen is a Sr. Solutions Architect at Amazon Web Services (AWS) focusing on Flexible Compute. As a part of the EC2 Flexible Compute team, he works with customers to guide them to the most elastic and efficient compute options that are suitable for their workload running on AWS. Kinnar has more than 15 years of industry experience working in research, consultancy, engineering, and architecture.

Amazon CloudWatch Insights for Amazon EKS on EC2 using AWS Distro for OpenTelemetry Helm charts

Post Syndicated from Vimala Pydi original https://aws.amazon.com/blogs/architecture/amazon-cloudwatch-insights-for-amazon-eks-on-ec2-using-aws-distro-for-opentelemetry-helm-charts/

This blog provides a simplified three-step solution to collect metrics and logs from an Amazon Elastic Kubernetes Service (Amazon EKS) cluster on Amazon Elastic Compute Cloud (Amazon EC2) using the AWS Distro for OpenTelemetry (ADOT) Helm charts repository and send them to Amazon CloudWatch Logs and Amazon CloudWatch Container Insights. The ADOT Helm charts repository contains Helm charts to provide easy mechanisms to set up the ADOT Collector and other collection agents like fluentbit to collect telemetry data such as metrics, logs and traces to send to AWS monitoring services.

Amazon EKS is a managed Kubernetes service that makes it easy for organizations to run Kubernetes on AWS Cloud and on premises. Organizations use Amazon EKS to automatically manage the availability and scalability of the Kubernetes control plane nodes responsible for scheduling containers, managing application availability, storing cluster data, and performing other key tasks. ADOT is a secure, production-ready, AWS-supported distribution of the OpenTelemetry project. Applications can set up ADOT Collector and other collector agents only once to send correlated metrics and traces to multiple AWS and Partner monitoring solutions. Fluent Bit is an open-source log processor and forwarder that you can use to collect data such as metrics and logs from different sources. Helm deploys packaged applications to Kubernetes and structures them into Helm charts.

Solution overview

A high-level architecture diagram depicted in Figure 1 shows a simple solution for collecting metrics and logs to send to Amazon CloudWatch Container Insights by installing an ADOT Helm chart on your existing or new Amazon EKS cluster.

Here are the steps to set up an ADOT and fluentbit collector:

  1. Set up your environment and install the necessary tools to connect to an existing or newly created Amazon EKS cluster.
  2. Configure the necessary roles for AWS Identity and Access Management (IAM) roles for service accounts and install Helm charts for ADOT, enabling fluentbit.
  3. Monitor logs, metrics, and traces from Amazon CloudWatch Logs and Container Insights.
Architecture diagram for Helm chart installation of ADOT and fluentbit to an existing Amazon EKS cluster

Figure 1. Architecture diagram for Helm chart installation of ADOT and fluentbit to an existing Amazon EKS cluster

Prerequisites

  • Existing AWS account with access to AWS Management Console
  • Intermediate-level knowledge and understanding of Amazon EKS
  • An existing or new Amazon EKS cluster

Install the tools

In this blog, AWS Cloud9 is used as an environment to connect to the Amazon EKS cluster and install Helm charts. If you choose to use AWS Cloud9, follow the step-by-step instructions provided in Creating an EC2 Environment. Refer to Getting started with Amazon EKS for additional instructions to install eksctl, create EKS clusters, and set up required IAM permissions for connecting to an EKS cluster.

  1. Log in to your Amazon EKS cluster and inspect the cluster. Select an EKS cluster in AWS Management Console. On the Resources tab, check the DaemonSets, as in Figure 2a.

    EKS cluster DaemonSets

    Figure 2a. EKS cluster DaemonSets

  2. Open Amazon CloudWatch and inspect the Log groups and Amazon CloudWatch Container Insights. Note that the Log groups and Amazon CloudWatch Container Insights in Figure 2b do not show any EKS cluster-specific logs.

    Container Insights before ADOT and fluentbit collector installation

    Figure 2b. Container Insights before ADOT and fluentbit collector installation

Install Helm and configure IAM roles

  1. Run the following command to install Helm, verify the version, and configure Bash completion for the Helm command:
    curl -ssl https://raw.githubusercontent.com/helm/helm/master/scripts/get-helm-3 | bash
    helm version --short
    
    helm completion bash >> ~/.bash_completion
    . /etc/profile.d/bash_completion.sh
    . ~/.bash_completion
    source <(helm completion bash)
  2. Set up IAM roles for service accounts.
    Replace XXX in the following commands with your EKS Cluster name.

    eksctl create iamserviceaccount \
    --name fluent-bit \
    --role-name EKS-ADOT-CWCI-Helm-Chart-Role-CW \
    --namespace amazon-cloudwatch \
    --cluster XXX \
    --attach-policy-arn arn:aws:iam::aws:policy/CloudWatchAgentServerPolicy \
    --role-only \
    --approve
    
    eksctl create iamserviceaccount \
    --name adot-collector-sa \
    --role-name EKS-ADOT-CWCI-Helm-Chart-Role-METRICS \
    --namespace amazon-metrics \
    --cluster XXX \
    --attach-policy-arn arn:aws:iam::aws:policy/CloudWatchAgentServerPolicy \
    --role-only \
    --approve
    
  3. Deploy the ADOT Helm chart.
    Replace XXX in the following code with your EKS Cluster name.

    CWCI_ADOT_HELM_ROLE_ARN_CW=$(aws iam get-role --role-name EKS-ADOT-CWCI-Helm-Chart-Role-CW | jq .Role.Arn -r)
    CWCI_ADOT_HELM_ROLE_ARN_METRICS=$(aws iam get-role --role-name EKS-ADOT-CWCI-Helm-Chart-Role-METRICS | jq .Role.Arn -r)
    helm repo add adot-helm-repo https://aws-observability.github.io/aws-otel-helm-charts
    helm install adot-release adot-helm-repo/adot-exporter-for-eks-on-ec2  \
    --set clusterName=XXX --set awsRegion=us-east-1 --set fluentbit.enabled=true \
    --set adotCollector.daemonSet.service.metrics.receivers={awscontainerinsightreceiver} \
    --set adotCollector.daemonSet.service.metrics.exporters={awsemf} \
    --set adotCollector.daemonSet.cwexporters.logStreamName=EKSNode \
    
  4. Run the following commands to validate the successful deployment.
    • Verify that two new namespaces have been created.
      kubectl get ns
      The result should be:

      $ kubectl get ns
      NAME                STATUS           AGE
      amazon-cloudwatch   Active           2d20h
      amazon-metrics      Active           2d20h
    • Verify that a fluentbit pod was enabled as part of the ADOT Helm Chart under the amazon-cloudwatch namespace.
      kubectl get all -n amazon-cloudwatch
      The result should be:

      kubectl get all -n amazon-cloudwatch
      NAME                   READY   STATUS    RESTARTS   AGE
      pod/fluent-bit-9lrnt   1/1     Running   0          2d20h
      pod/fluent-bit-h9lvt   1/1     Running   0          2d20h
      pod/fluent-bit-nbqjm   1/1     Running   0          2d20h
      
      NAME                        DESIRED   CURRENT   READY   UP-TO-DATE   AVAILABLE   NODE SELECTOR   AGE
    • Verify the adot-collector-pod under the amazon-metrics namespace.
      kubectl get all -n amazon-metrics
      The result should be:

      $ kubectl get all -n amazon-metrics
      NAME                                 READY   STATUS    RESTARTS   AGE
      pod/adot-collector-daemonset-6qcsd   1/1     Running   0          2d20h
      pod/adot-collector-daemonset-f92fr   1/1     Running   0          2d20h
      pod/adot-collector-daemonset-gmhbx   1/1     Running   0          2d20h
      
      NAME                                      DESIRED   CURRENT   READY   UP-TO-DATE   AVAILABLE   NODE SELECTOR   AGE
      daemonset.apps/adot-collector-daemonset   3         3         3       3            3           <none>          2d20h
  5. Validate the installation through the Amazon EKS cluster.
    Go to the Amazon EKS cluster and select the Resources tab. Under Workloads, select DaemonSets, and find the fluent-bit and adot-collector-daemonsets as demonstrated in Figure 3.

    DaemonSet under Amazon EKS cluster resources

    Figure 3. DaemonSet under Amazon EKS cluster resources

Monitor logs, metrics, and traces

Monitor the CloudWatch Logs and CloudWatch Insights.

  • In the Logs section, choose Log groups to view Amazon EKS cluster log groups with a prefix of /aws/containerinsights, as in Figure 4a.

    EKS cluster log groups

    Figure 4a. EKS cluster log groups

  • In the Insights section, choose Container Insights to view all the resources within your Amazon EKS cluster, as in Figure 4b.

    EKS cluster's Container Insights resources

    Figure 4b. EKS cluster’s Container Insights resources

  • On the Container Insights page, select Container map from the dropdown to check the container map for Amazon EKS clusters, as demonstrated in Figure 4c.

    EKS cluster's Container Insights container map

    Figure 4c. EKS cluster’s Container Insights container map

  • On the Container Insights page, select Performance monitoring from the dropdown to view various performance metrics for Amazon EKS cluster, as demonstrated in Figure 4d.

    EKS cluster's Container Insights performance monitoring

    Figure 4d. EKS cluster’s Container Insights performance monitoring

Cleanup

If you are no longer using the resources discussed in this blog, remove the excess AWS resources to avoid incurring charges. After you finish setting up ADOT and fluentbit collectors to send logs and metrics to Amazon CloudWatch Logs and Container Insights, clean up resources by uninstalling the ADOT Helm chart, deleting IAM Roles created for the services, deleting CloudWatch Logs, and deleting Container Insights.

Conclusion

In this blog we walked through a simple three-step solution to set up Amazon EKS cluster logs and Container Insights using Helm charts. The Helm chart installs ADOT and fluentbit as a DaemonSet in the existing EKS cluster to collect and port logs, metrics, and traces to Amazon CloudWatch Logs and Container Insights. The Amazon CloudWatch Container Insights provide insights into resources, monitor performance, and container map of all the resources within the Amazon EKS cluster.