All posts by Jeff Hostetler

Measuring Git performance with OpenTelemetry

Post Syndicated from Jeff Hostetler original https://github.blog/2023-10-16-measuring-git-performance-with-opentelemetry/

When I think about large codebases, the repositories for Microsoft Windows and Office are top of mind. When Microsoft began migrating these codebases to Git in 2017, they contained 3.5M files and a full clone was more than 300GB. The scale of that repository was so much bigger than anything that had been tried with Git to date. As a principal software engineer on the Git client team, I knew how painful and frustrating it could be to work in these gigantic repositories, so our team set out to make it easier. Our first task: understanding and improving the performance of Git at scale.

Collecting performance data was an essential part of that effort. Having this kind of performance data helped guide our engineering efforts and let us track our progress, as we improved Git performance and made it easier to work in these very large repositories. That’s why I added the Trace2 feature to core Git in 2019—so that others could do similar analysis of Git performance on their repositories.

Trace2 is an open source performance logging/tracing framework built into Git that emits messages at key points in each command, such as process exit and expensive loops. You can learn more about it here.

Whether they’re Windows-sized or not, organizations can benefit from understanding the work their engineers do and the types of tools that help them succeed. Today, we see enterprise customers creating ever-larger monorepos and placing heavy demands on Git to perform at scale. At the same time, users expect Git to remain interactive and responsive no matter the size or shape of the repository. So it’s more important than ever to have performance monitoring tools to help us understand how Git is performing for them.

Unfortunately, it’s not sufficient to just run Git in a debugger/profiler on test data or a simulated load. Meaningful results come from seeing how Git performs on real monorepos under daily use by real users, both in isolation and in aggregate. Making sense of the data and finding insights also requires tools to visualize the results.

Trace2 writes very detailed performance data, but it may be a little difficult to consume without some help. So today, we’re introducing an open source tool to post-process the data and move it into the OpenTelemetry ecosystem. With OpenTelemetry visualization tools, you’ll be able to easily study your Git performance data.

This tool can be configured by users to identify where data shapes cause performance deterioration, to notice problematic trends early on, and to realize where Git’s own performance needs to be improved. Whether you’re simply interested in your own statistics or are part of an engineering systems/developer experience team, we believe in democratizing the power of this kind of analysis. Here’s how to use it.

Open sourcing trace2receiver

The emerging standard for analyzing software’s performance at scale is OpenTelemetry.

An article from the Cloud Native Computing Foundation (CNCF) gives an overview of the OpenTelemetry technologies.

The centerpiece in their model is a collector service daemon. You can customize it with various receiver, pipeline, and exporter component modules to suit your needs. You can also collect data from different telemetry sources or in different formats, normalize and/or filter it, and then send it to different data sinks for analysis and visualization.

We wanted a way to let users capture their Trace2 data and send it to an OpenTelemetry-compatible data sink, so we created an open source trace2receiver receiver component that you can add to your custom collector. With this new receiver component your collector can listen for Trace2 data from Git commands, translate it into a common format (such as OTLP), and relay it to a local or cloud-based visualization tool.

Want to jump in and build and run your own custom collector using trace2receiver? See the project documentation for all the tool installation and platform-specific setup you’ll need to do.

Open sourcing a sample collector

If you want a very quick start, I’ve created an open source sample collector that uses the trace2receiver component. It contains a ready-to-go sample collector, complete with basic configuration and platform installers. This will let you kick the tires with minimal effort. Just plug in your favorite data sink/cloud provider, build it, run one of the platform installers, and start collecting data. See the README for more details.

See trace2receiver in action

We can use trace2receiver to collect Git telemetry data for two orthogonal purposes. First, we can dive into an individual command from start to finish and see where time is spent. This is especially important when a Git command spawns a (possibly nested) series of child commands, which OpenTelemetry calls a “distributed trace.” Second, we can aggregate data over time from different users and machines, compute summary metrics such as average command times, and get a high level picture of how Git is performing at scale, plus perceived user frustration and opportunities for improvement. We’ll look at each of these cases in the following sections.

Distributed tracing

Let’s start with distributed tracing. The CNCF defines distributed tracing as a way to track a request through a distributed system. That’s a broader definition than we need here, but the concepts are the same: We want to track the flow within an individual command and/or the flow across a series of nested Git commands.

I previously wrote about Trace2, how it works, and how we can use it to interactively study the performance of an individual command, like git status, or a series of nested commands, like git push which might spawn six or seven helper commands behind the scenes. When Trace2 was set to log directly to the console, we could watch in real-time as commands were executed and see where the time was spent.

This is essentially equivalent to an OpenTelemetry distributed trace. What the trace2receiver does for us here is map the Trace2 event stream into a series of OpenTelemetry “spans” with the proper parent-child relationships. The transformed data can then be forwarded to a visualization tool or database with a compatible OpenTelemetry exporter.

Let’s see what happens when we do this on an instance of the torvalds/linux.git repository.

Git fetch example

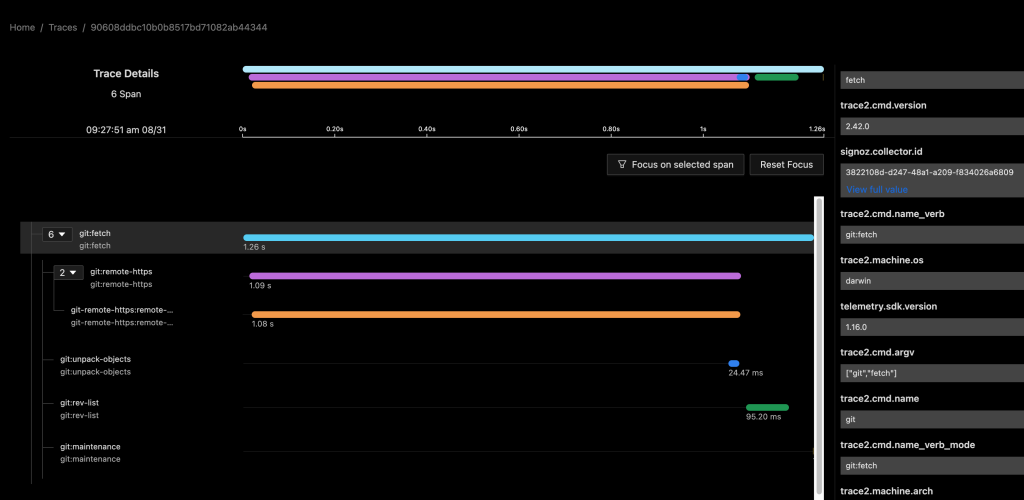
The following image shows data for a git fetch command using a local instance of the SigNoz observability tools. My custom collector contained a pipeline to route data from the trace2receiver component to an exporter component that sent data to SigNoz.

Summary graph of git fetch in SigNoz

I configured my custom collector to send data to two exporters, so we can see the same data in an Application Insights database. This is possible and simple because of the open standards supported by OpenTelemetry.

Summary graph of git fetch in App Insights

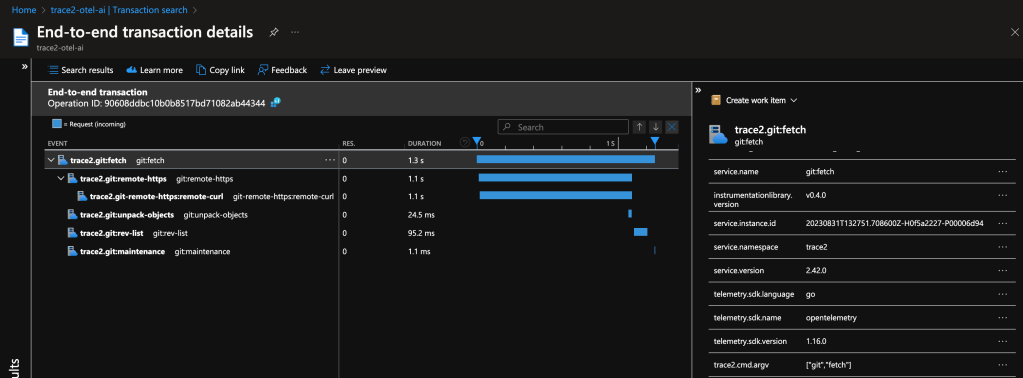
Both examples show a distributed trace of git fetch. Notice the duration of the top-level command and of each of the various helper commands that were spawned by Git.

This graph tells me that, for most of the time, git fetch was waiting on git-remote-https (the grandchild) to receive the newest objects. It also suggests that the repository is well-structured, since git maintenance runs very quickly. We likely can’t do very much to improve this particular command invocation, since it seems fairly optimal already.

As a long-time Git expert, I can further infer that the received packfile was small, because Git unpacked it (and wrote individual loose objects) rather than writing and indexing a new packfile. Even if your team doesn’t yet have the domain experts to draw detailed insights from the collected data, these insights could help support engineers or outside Git experts to better interpret your environment.

In this example, the custom collector was set to report dl:summary level telemetry, so we only see elapsed process times for each command. In the next example, we’ll crank up the verbosity to see what else we can learn.

Git status example

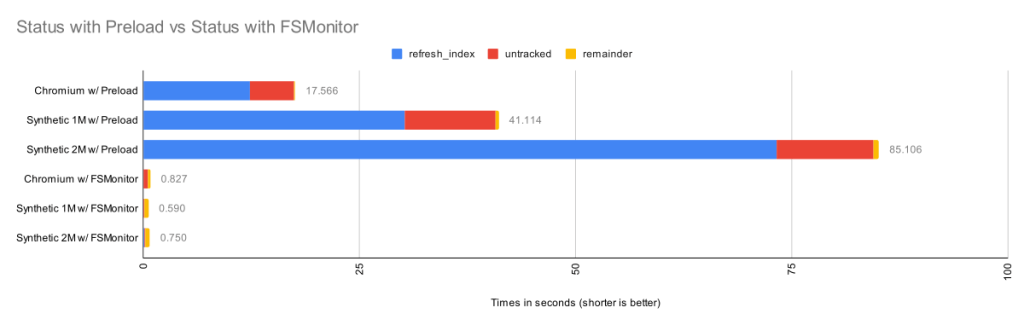
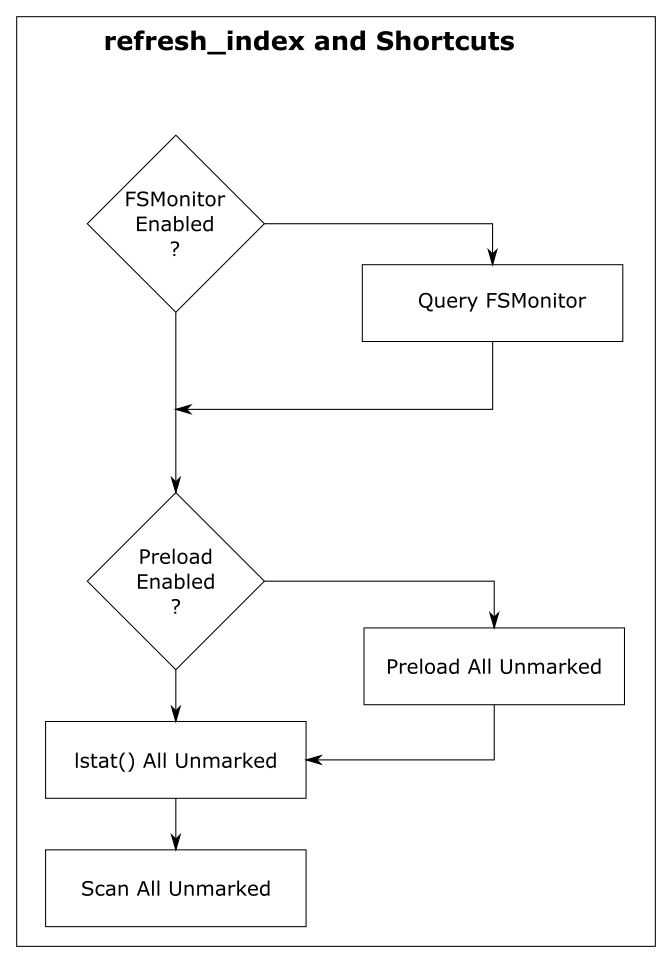
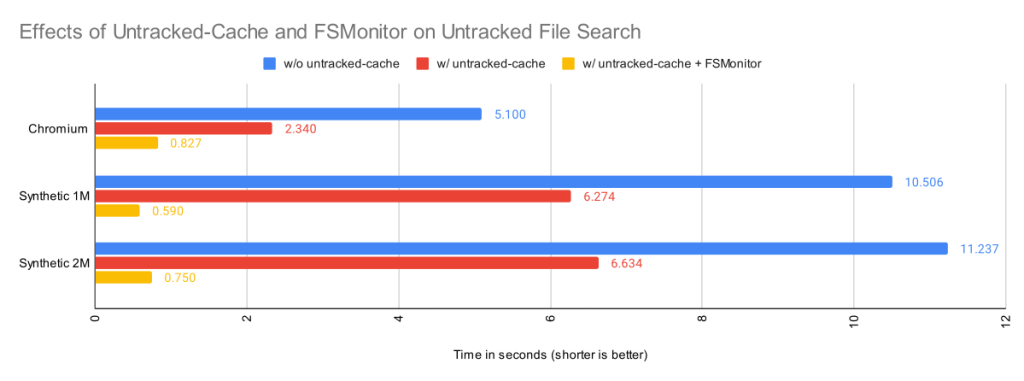
The following images show data for git status in SigNoz. In the first image, the FSMonitor and Untracked Cache features are turned off. In the second image, I’ve turned on FSMonitor. In the third, I’ve turned on both. Let’s see how they affect Git performance. Note that the horizontal axis is different in each image. We can see how command times decreased from 970 to 204 to 40 ms as these features were turned on.

In these graphs, the detail level was set to dl:verbose, so the collector also sent region-level details.

The git:status span (row) shows the total command time. The region(...) spans show the major regions and nested sub-regions within the command. Basically, this gives us a fuller accounting of where time was spent in the computation.

Verbose graph of git status in SigNoz fsm=0 uc=0

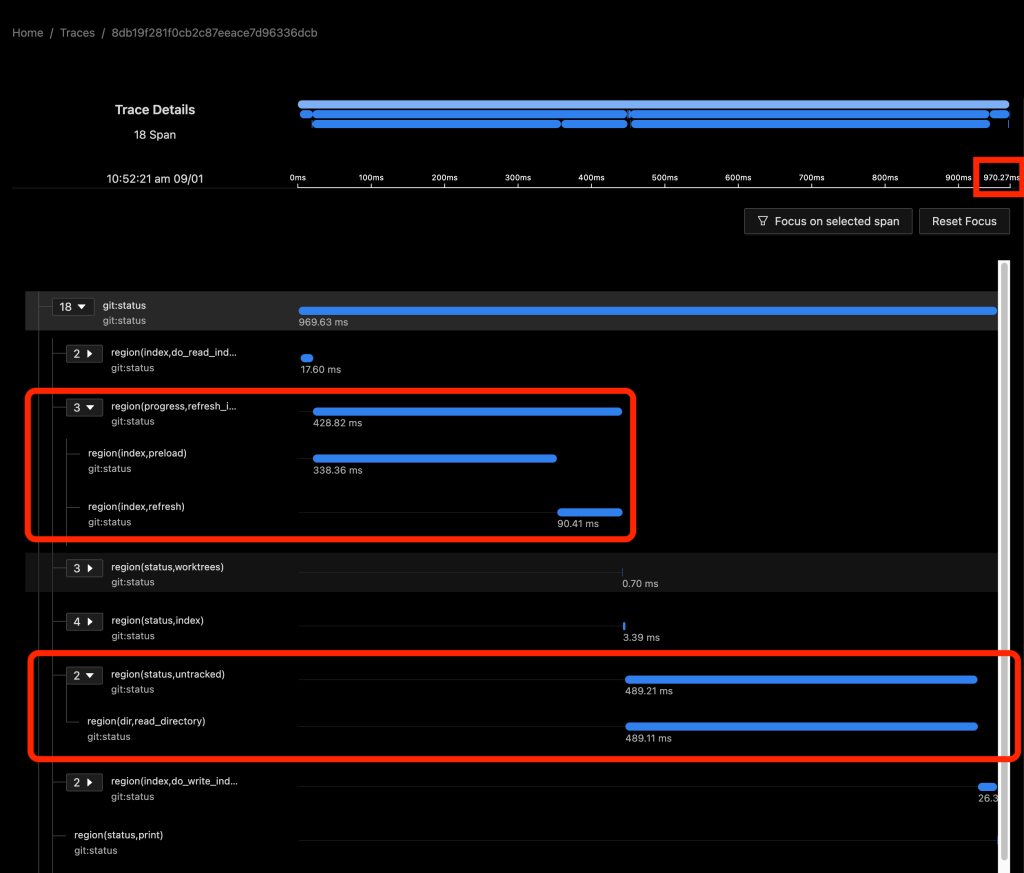
The total command time here was 970 ms.

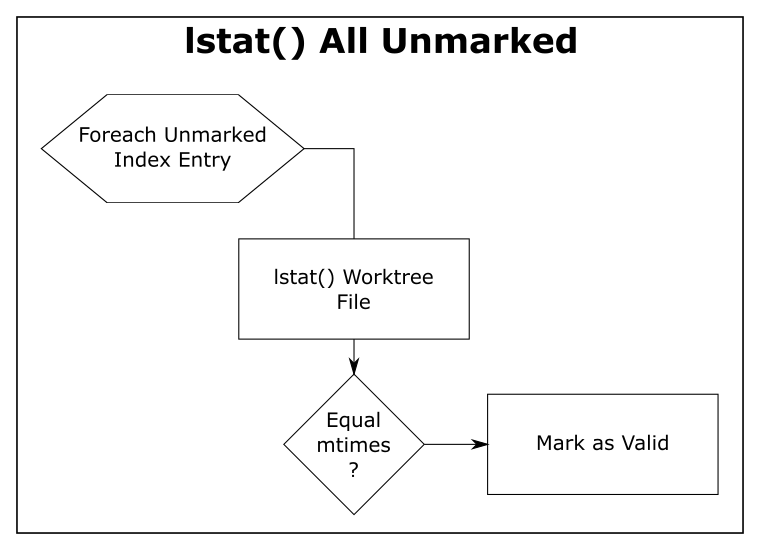
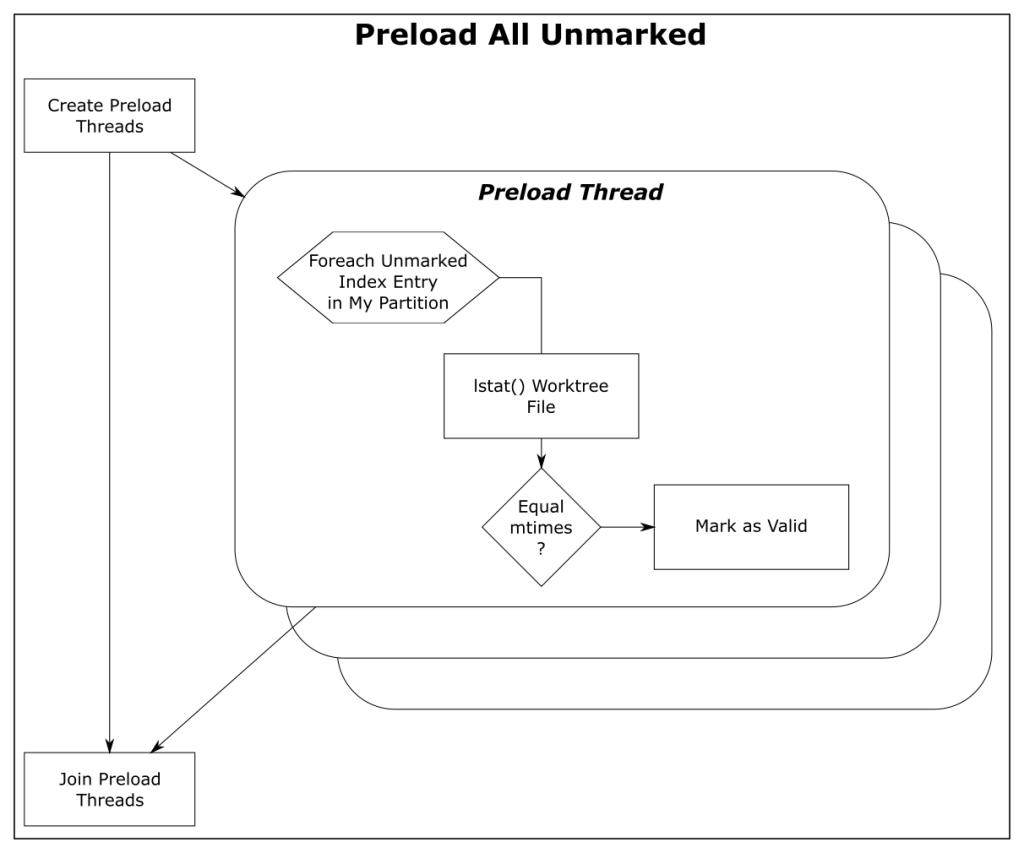
In the above image, about half of the time (429 ms) was spent in region(progress,refresh_index) (and the sub-regions within it) scanning the worktree for recently modified files. This information will be used later in region(status,worktree) to compute the set of modified tracked files.

The other half (489 ms) was in region(status,untracked) where Git scans the worktree for the existence of untracked files.

As we can see, on large repositories, these scans are very expensive.

Verbose graph of git status in SigNoz fsm=1 uc=0

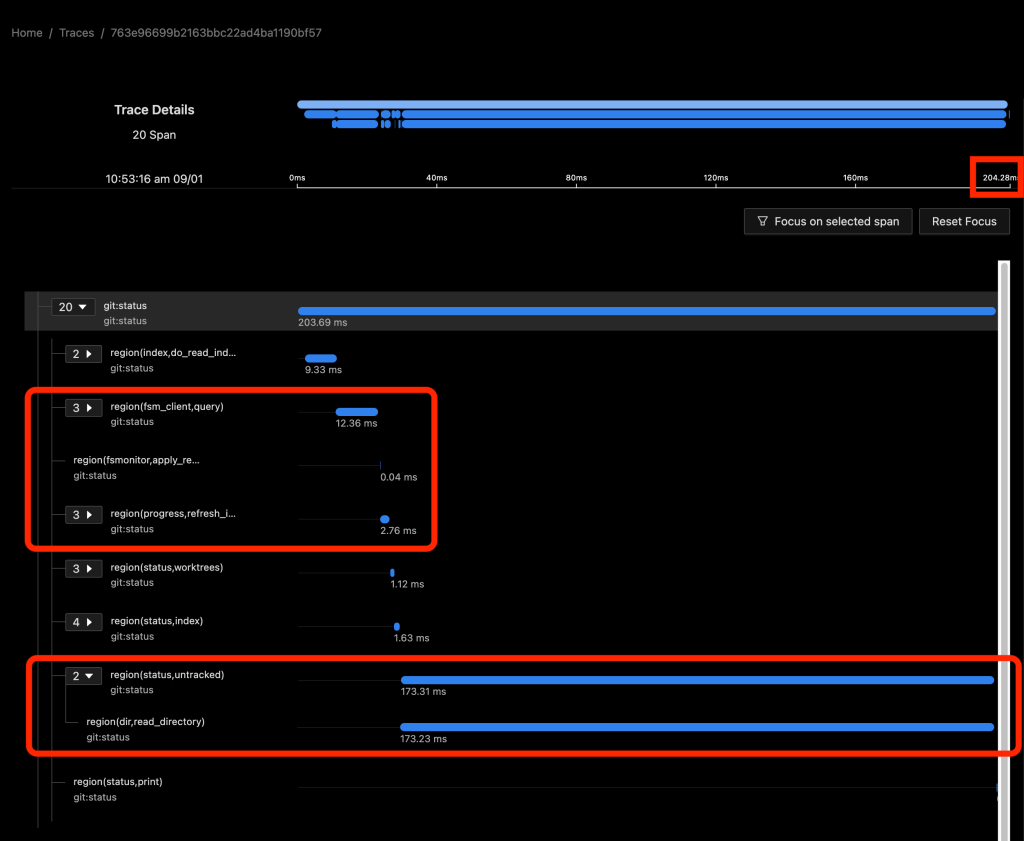
In the above image, FSMonitor was enabled. The total command time here was reduced from 970 to 204 ms.

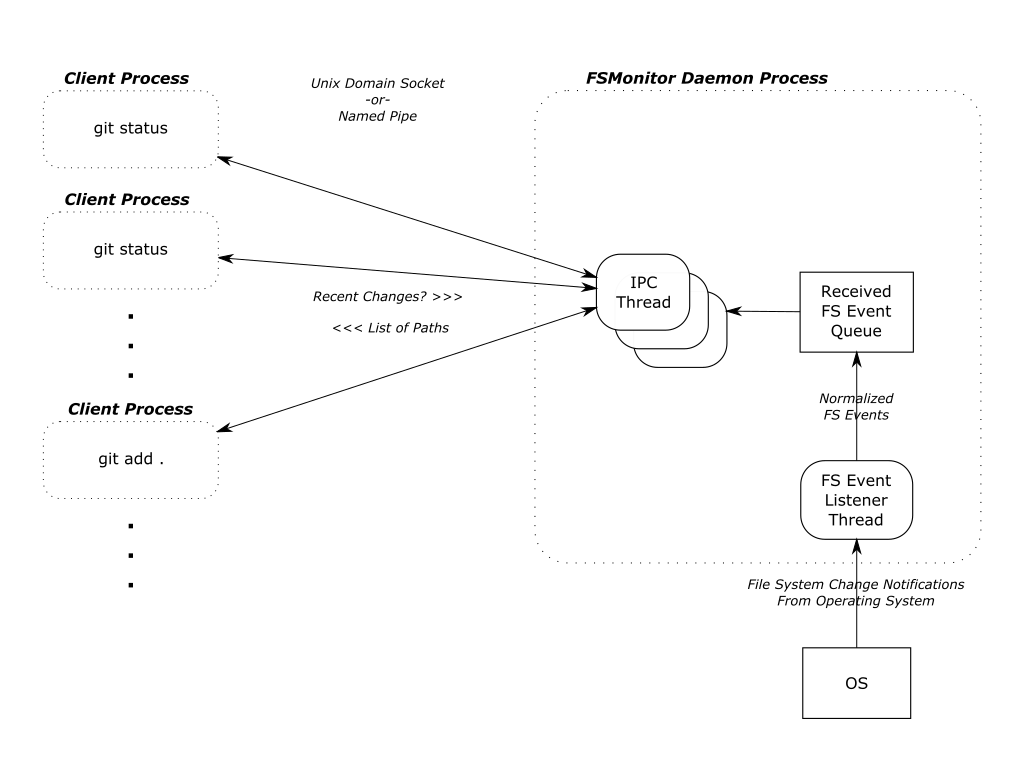
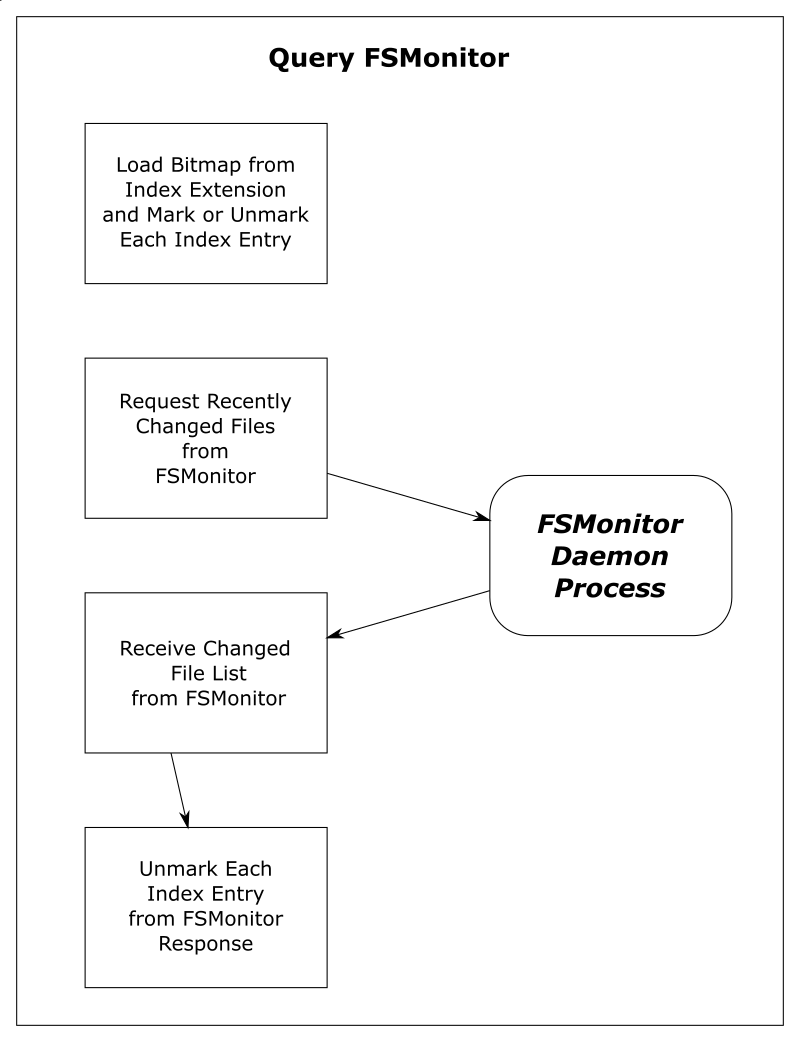
With FSMonitor, Git doesn’t need to scan the disk to identify the recently modified files; it can just ask the FSMonitor daemon, since it already knows the answer.

Here we see a new region(fsm_client,query) where Git asks the daemon and a new region(fsmonitor,apply_results) where Git uses the answer to update its in-memory data structures. The original region(progress,refresh_index) is still present, but it doesn’t need to do anything. The time for this phase has been reduced from 429 to just 15 ms.

FSMonitor also helped reduce the time spent in region(status,untracked) from 489 to 173 ms, but it is still expensive. Let’s see what happens when we enable both and let FSMonitor and the untracked cache work together.

Verbose graph of git status in SigNoz fsm=1 uc=1](images/signoz-status-fsm1-uc1.png

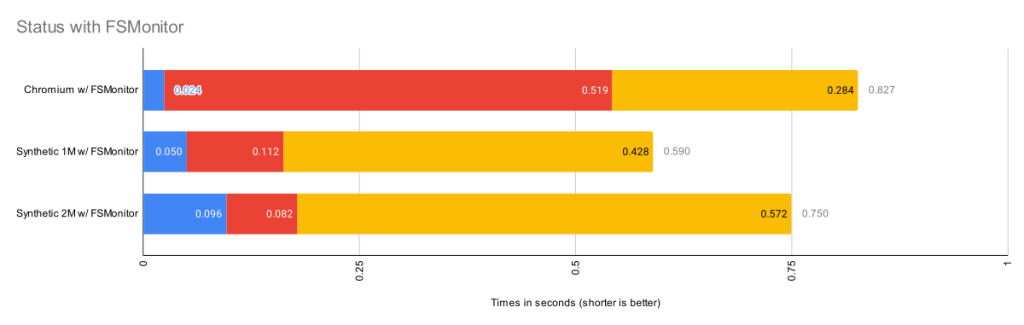
In the above image, FSMonitor and the Untracked Cache were both turned on. The total command time was reduced to just 40 ms.

This gives the best result for large repositories. In addition to the FSMonitor savings, the time in region(status,untracked) drops from 173 to 12 ms.

This is a massive savings on a very frequently run command.

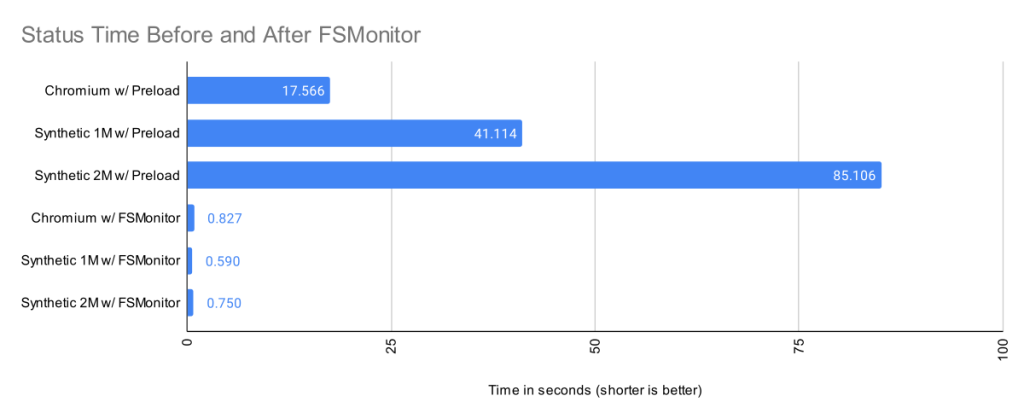
For more information on FSMonitor and Untracked Cache and an explanation of these major regions, see my earlier FSMonitor article.

Data aggregation

Looking at individual commands is valuable, but it’s only half the story. Sometimes we need to aggregate data from many command invocations across many users, machines, operating systems, and repositories to understand which commands are important, frequently used, or are causing users frustration.

This analysis can be used to guide future investments. Where is performance trending in the monorepo? How fast is it getting there? Do we need to take preemptive steps to stave off a bigger problem? Is it better to try to speed up a very slow command that is used maybe once a year or to try to shave a few milliseconds off of a command used millions of times a day? We need data to help us answer these questions.

When using Git on large monorepos, users may experience slow commands (or rather, commands that run more slowly than they were expecting). But slowness can be very subjective. So we need to be able to measure the performance that they are seeing, compare it with their peers, and inform the priority of a fix. We also need enough context so that we can investigate it and answer questions like: Was that a regular occurrence or a fluke? Was it a random network problem? Or was it a fetch from a data center on the other side of the planet? Is that slowness to be expected on that class of machine (laptop vs server)? By collecting and aggregating over time, we were able to confidently answer these kinds of questions.

The raw data

Let’s take a look at what the raw telemetry looks like when it gets to a data sink and see what we can learn from the data.

We saw earlier that my custom collector was sending data to both Azure and SigNoz, so we should be able to look at the data in either. Let’s switch gears and use my Azure Application Insights (AppIns) database here. There are many different data sink and visualization tools, so the database schema may vary, but the concepts should transcend.

Earlier, I showed the distributed trace of a git fetch command in the Azure Portal. My custom collector is configured to send telemetry data to an Application Insights (AppIns) database and we can use the Azure Portal to query the data. However, I find the Azure Data Explorer a little easier to use than the portal, so let’s connect Data Explorer to my AppIns database. From Data Explorer, I’ll run my queries and let it automatically pull data from my AppIns database.

show 10 data rows

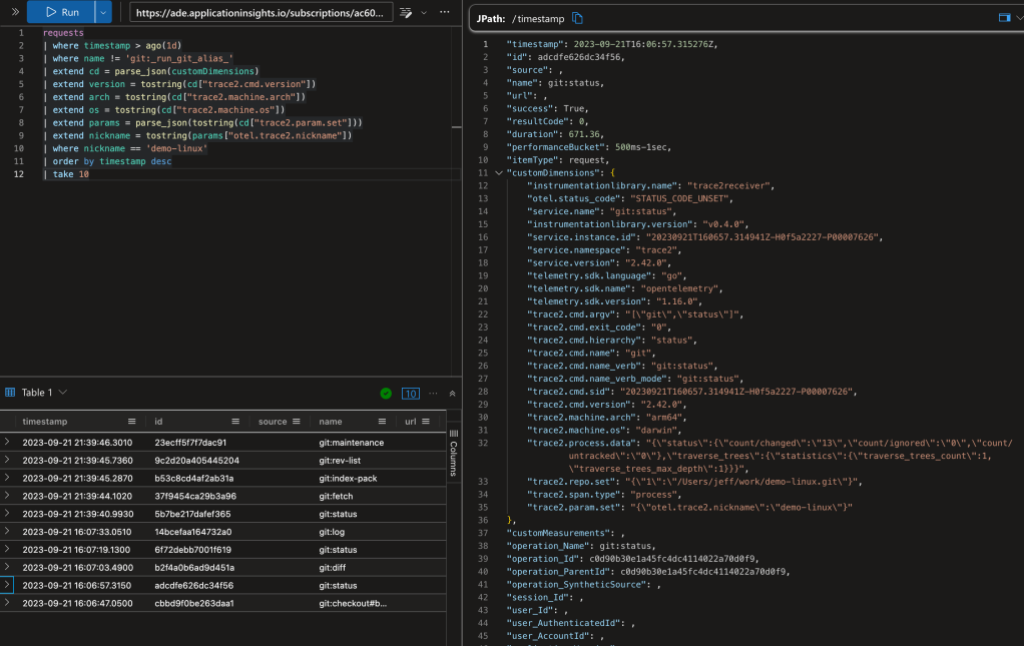
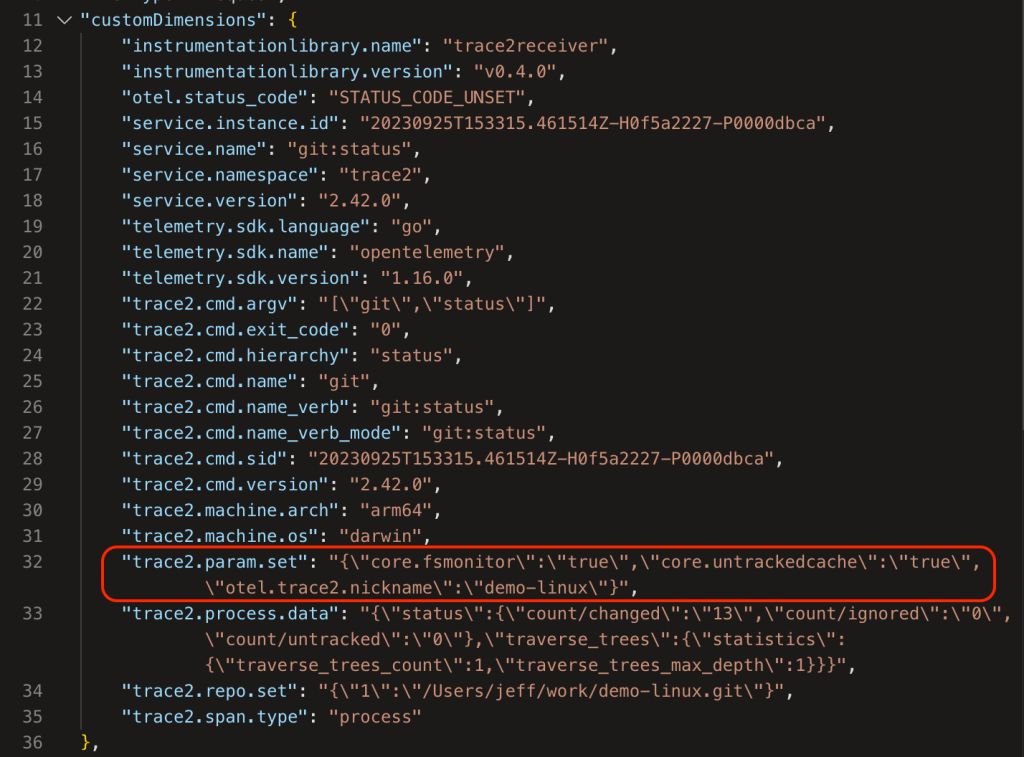
The above image shows a Kusto query on the data. In the top-left panel I’ve asked for the 10 most-recent commands on any repository with the “demo-linux” nickname (I’ll explain nicknames later in this post). The bottom-left panel shows (a clipped view of) the 10 matching database rows. The panel on the right shows an expanded view of the ninth row.

The AppIns database has a legacy schema that predates OpenTelemetry, so some of OpenTelemetry fields are mapped into top-level AppIns fields and some are mapped into the customDimensions JSON object/dictionary. Additionally, some types of data records are kept in different database tables. I’m going to gloss over all of that here and point out a few things in the data.

The record in the expanded view shows a git status command. Let’s look at a few rows here. In the top-level fields:

  • The normalized command name is git:status.
  • The command duration was 671 ms. (AppIns tends to use milliseconds.)

In the customDimensions fields:

  • The original command line is shown (as a nested JSON record in "trace2.cmd.argv").
  • The "trace2.machine.arch" and "trace2.machine.os" fields show that it ran on an arm64 mac.
  • The user was running Git version 2.42.0.
  • "trace2.process.data"["status"]["count/changed"] shows that it found 13 modified files in the working directory.

Command frequency example

show Linux command count and duration

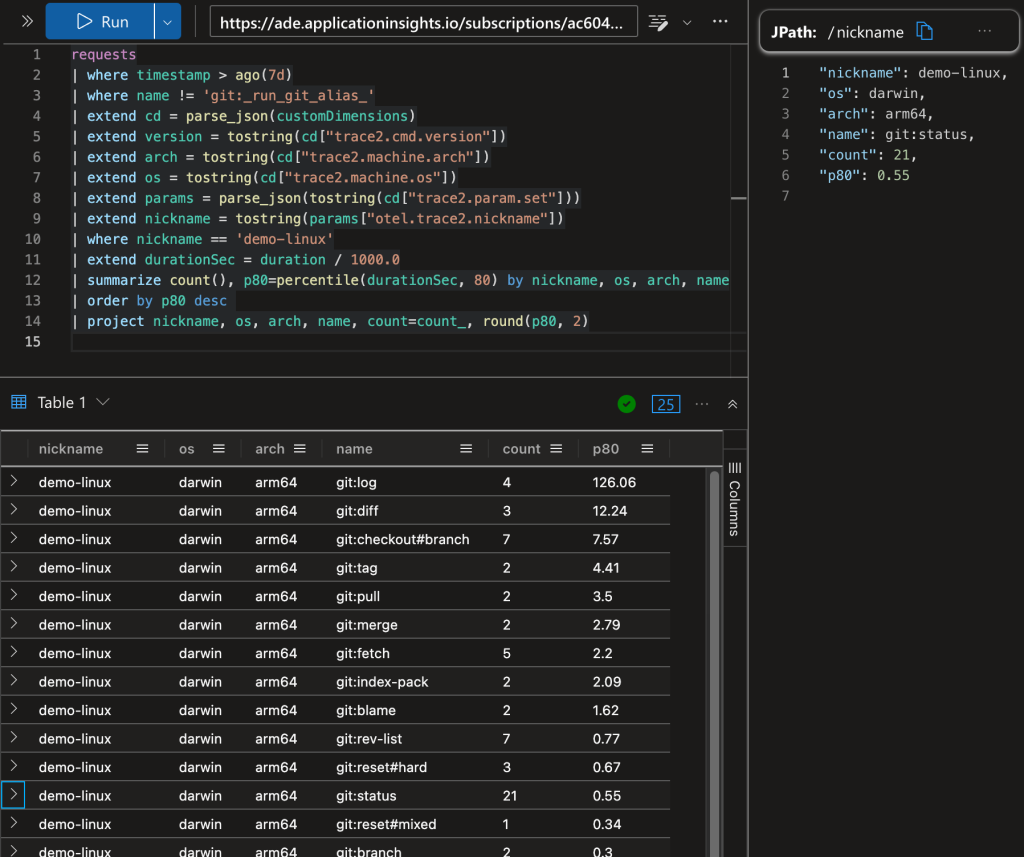
The above image shows a Kusto query with command counts and the P80 command duration grouped by repository, operating system, and processor. For example, there were 21 instances of git status on “demo-linux” and 80% of them took less than 0.55 seconds.

Grouping status by nickname example

show Chromium vs Linux status count and duration

The above image shows a comparison of git status times between “demo-linux” and my “demo-chromium” clone of chromium/chromium.git.

Without going too deep into Kusto queries or Azure, the above examples are intended to demonstrate how you can focus on different aspects of the available data and motivate you to create your own investigations. The exact layout of the data may vary depending on the data sink that you select and its storage format, but the general techniques shown here can be used to build a better understanding of Git regardless of the details of your setup.

Data partition suggestions

Your custom collector will send all of your Git telemetry data to your data sink. That is a good first step. However, you may want to partition the data by various criteria, rather than reporting composite metrics. As we saw above, the performance of git status on the “demo-linux” repository is not really comparable with the performance on the “demo-chromium” repository, since the Chromium repository and working directory is so much larger than the Linux repository. So a single composite P80 value for git:status across all repositories might not be that useful.

Let’s talk about some partitioning strategies to help you get more from the data.

Partition on repo nicknames

Earlier, we used a repo nickname to distinguish between our two demo repositories. We can tell Git to send a nickname with the data for every command and we can use that in our queries.

The way I configured each client machine in the previous example was to:

  1. Tell the collector that otel.trace2.nickname is the name of the Git config key in the collector’s filter.yml file.
  2. Globally set trace2.configParams to tell Git to send all Git config values with the otel.trace2.* prefix to the telemetry stream.
  3. Locally set otel.trace2.nickname to the appropriate nickname (like “demo-linux” or “demo-chromium” in the earlier example) in each working directory.

Telemetry will arrive at the data sink with trace2.param.set["otel.trace2.nickname"] in the meta data. We can then use the nickname to partition our Kusto queries.

Partition on other config values

There’s nothing magic about the otel.trace2.* prefix. You can also use existing Git config values or create some custom ones.

For example, you could globally set trace2.configParams to 'otel.trace2.*,core.fsmonitor,core.untrackedcache' and let Git send the repo nickname and whether the FSMonitor and untracked cache features were enabled.

show other config values

You could also set a global config value to define user cohorts for some A/B testing or a machine type to distinguish laptops from build servers.

These are just a few examples of how you might add fields to the telemetry stream to partition the data and help you better understand Git performance.

Caveats

When exploring your own Git data, it’s important to be aware of several limitations and caveats that may skew your analysis of the performance or behaviors of certain commands. I’ve listed a few common issues below.

Laptops can sleep while Git commands are running

Laptops can go to sleep or hibernate without notice. If a Git command is running when the laptop goes to sleep and finishes after the laptop is resumed, Git will accidentally include the time spent sleeping in the Trace2 event data because Git always reports the current time in each event. So you may see an arbitrary span with an unexpected and very large delay.1

So if you occasionally find a command that runs for several days, see if it started late on a Friday afternoon and finished first thing Monday morning before sounding any alarms.

Git hooks

Git lets you define hooks to be run at various points in the lifespan of a Git command. Hooks are typically shell scripts, usually used to test a pre-condition before allowing a Git command to proceed or to ensure that some system state is updated before the command completes. They do not emit Trace2 telemetry events, so we will not have any visibility into them.

Since Git blocks while the hook is running, the time spent in the hook will be attributed to the process span (and a child span, if enabled).

If a hook shell script runs helper Git commands, those Git child processes will inherit the span context for the parent Git command, so they will appear as immediate children of the outer Git command rather than the missing hook script process. This may help explain where time was spent, but it may cause a little confusion when you try to line things up.

Interactive commands

Some Git commands have a (sometimes unexpected) interactive component:

  1. Commands like git commit will start and wait for your editor to close before continuing.
  2. Commands like git fetch or git push might require a password from the terminal or an interactive credential helper.
  3. Commands like git log or git blame can automatically spawn a pager and may cause the foreground Git command to block on I/O to the pager process or otherwise just block until the pager exits.

In all of these cases, it can look like it took hours for a Git command to complete because it was waiting on you to respond.

Hidden child processes

We can use the dl:process or dl:verbose detail levels to gain insight into hidden hooks, your editor, or other interactive processes.

The trace2receiver creates child(...) spans from Trace2 child_start and child_exit event pairs. These spans capture the time that Git spent waiting for each child process. This works whether the child is a shell script or a helper Git command. In the case of a helper command, there will also be a process span for the Git helper process (that will be slightly shorter because of process startup overhead), but in the case of a shell script, this is usually the only hint that an external process was involved.

Graph of commit with child spans

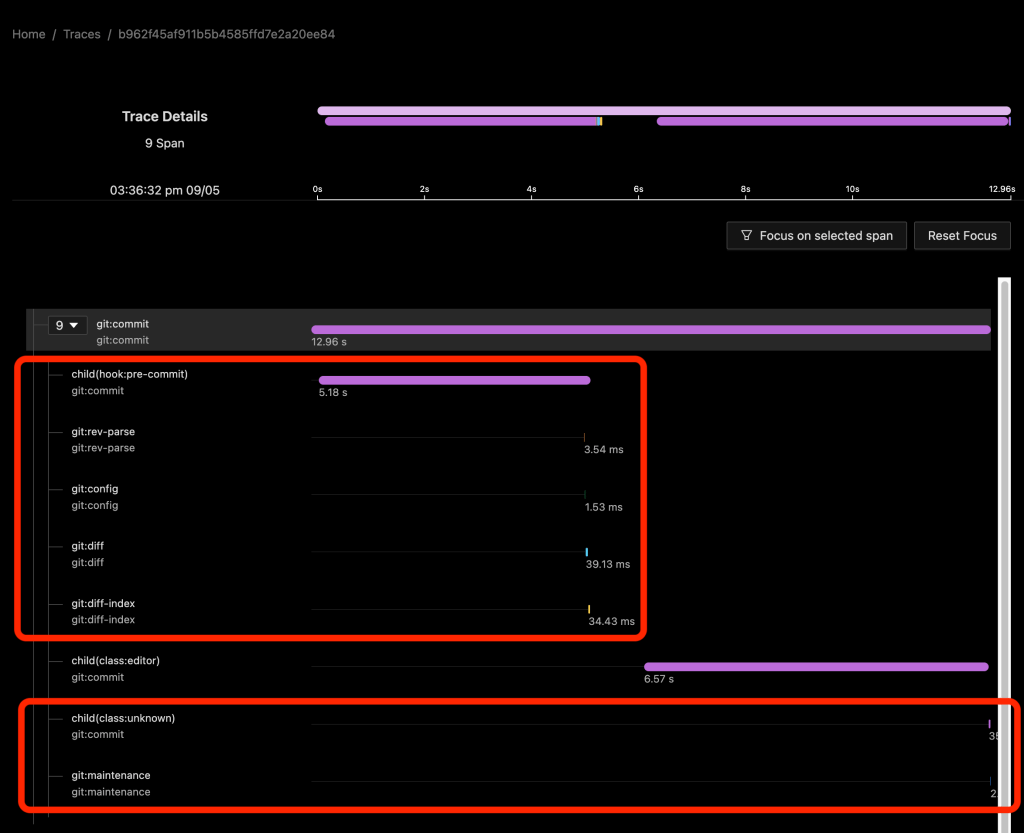
In the above image we see a git commit command on a repository with a pre-commit` hook installed. The child(hook:pre-commit) span shows the time spent waiting for the hook to run. Since Git blocks on the hook, we can infer that the hook itself did something (sleep) for about five seconds and then ran four helper commands. The process spans for the helper commands appear to be direct children of the git:commit process span rather than of a synthetic shell script process span or of the child span.

From the child(class:editor) span we can also see that an editor was started and it took almost seven seconds for it to appear on the screen and for me to close it. We don’t have any other information about the activity of the editor besides the command line arguments that we used to start it.

Finally, I should mention that when we enable dl:process or dl:verbose detail levels, we will also get some child spans that may not be that helpful. Here the child(class:unknown) span refers to the git maintenance process immediately below it.2

What’s next

Once you have some telemetry data you can:

  1. Create various dashboards to summarize the data and track it over time.
  2. Consider the use of various Git performance features, such as: Scalar, Sparse Checkout, Sparse Index, Partial Clone, FSMonitor, and Commit Graph.
  3. Consider adding a Git Bundle Server to your network.
  4. Use git maintenance to keep your repositories healthy and efficient.
  5. Consider enabling parallel checkout on your large repositories.

You might also see what other large organizations are saying:

Conclusion

My goal in this article was to help you start collecting Git performance data and present some examples of how someone might use that data. Git performance is often very dependent upon the data-shape of your repository, so I can’t make a single, sweeping recommendation that will help everyone. (Try Scalar)

But with the new trace2receiver component and an OpenTelemetry custom collector, you should now be able to collect performance data for your repositories and begin to analyze and find your organization’s Git pain points. Let that guide you to making improvements — whether that is upstreaming a new feature into Git, adding a network cache server to reduce latency, or making better use of some of the existing performance features that we’ve created.

The trace2receiver component is open source and covered by the MIT License, so grab the code and try it out.

See the contribution guide for details on how to contribute.

Notes


  1. It is possible on some platforms to detect system suspend/resume events and modify or annotate the telemetry data stream, but the current release of the trace2receiver does not support that. 
  2. The term “unknown” is misleading here, but it is how the child_start event is labeled in the Trace2 data stream. Think of it as “unclassified”. Git tries to classify child processes when it creates them, for example “hook” or “editor”, but some call-sites in Git have not been updated to pass that information down, so they are labeled as unknown. 

The post Measuring Git performance with OpenTelemetry appeared first on The GitHub Blog.

Improve Git monorepo performance with a file system monitor

Post Syndicated from Jeff Hostetler original https://github.blog/2022-06-29-improve-git-monorepo-performance-with-a-file-system-monitor/

If you have a monorepo, you’ve probably already felt the pain of slow Git commands, such as git status and git add. These commands are slow because they need to search the entire worktree looking for changes. When the worktree is very large, Git needs to do a lot of work.

The Git file system monitor (FSMonitor) feature can speed up these commands by reducing the size of the search, and this can greatly reduce the pain of working in large worktrees. For example, this chart shows status times dropping to under a second on three different large worktrees when FSMonitor is enabled!

In this article, I want to talk about the new builtin FSMonitor git fsmonitor--daemon added in Git version 2.37.0. This is easy to set up and use since it is “in the box” and does not require any third-party tooling nor additional software. It only requires a config change to enable it. It is currently available on macOS and Windows.

To enable the new builtin FSMonitor, just set core.fsmonitor to true. A daemon will be started automatically in the background by the next Git command.

FSMonitor works well with core.untrackedcache, so we’ll also turn it on for the FSMonitor test runs. We’ll talk more about the untracked-cache later.

$ time git status
On branch main
Your branch is up to date with 'origin/main'.

It took 5.25 seconds to enumerate untracked files. 'status -uno'
may speed it up, but you have to be careful not to forget to add
new files yourself (see 'git help status').
nothing to commit, working tree clean

real    0m17.941s
user    0m0.031s
sys     0m0.046s

$ git config core.fsmonitor true
$ git config core.untrackedcache true

$ time git status
On branch main
Your branch is up to date with 'origin/main'.

It took 6.37 seconds to enumerate untracked files. 'status -uno'
may speed it up, but you have to be careful not to forget to add
new files yourself (see 'git help status').
nothing to commit, working tree clean

real    0m19.767s
user    0m0.000s
sys     0m0.078s

$ time git status
On branch main
Your branch is up to date with 'origin/main'.

nothing to commit, working tree clean

real    0m1.063s
user    0m0.000s
sys     0m0.093s

$ git fsmonitor--daemon status
fsmonitor-daemon is watching 'C:/work/chromium'

_Note that when the daemon first starts up, it needs to synchronize with the state of the index, so the next git status command may be just as slow (or slightly slower) than before, but subsequent commands should be much faster.

In this article, I’ll introduce the new builtin FSMonitor feature and explain how it improves performance on very large worktrees.

How FSMonitor improves performance

Git has a “What changed while I wasn’t looking?” problem. That is, when you run a command that operates on the worktree, such as git status, it has to discover what has changed relative to the index. It does this by searching the entire worktree. Whether you immediately run it again or run it again tomorrow, it has to rediscover all of that same information by searching again. Whether you edit zero, one, or a million files in the mean time, the next git status command has to do the same amount of work to rediscover what (if anything) has changed.

The cost of this search is relatively fixed and is based upon the number of files (and directories) present in the worktree. In a monorepo, there might be millions of files in the worktree, so this search can be very expensive.

What we really need is a way to focus on the changed files without searching the entire worktree.

How FSMonitor works

FSMonitor is a long-running daemon or service process.

  • It registers with the operating system to receive change notification events on files and directories.
  • It adds the pathnames of those files and directories to an in-memory, time-sorted queue.
  • It listens for IPC connections from client processes, such as git status.
  • It responds to client requests for a list of files and directories that have been modified recently.

FSMonitor must continuously watch the worktree to have a complete view of all file system changes, especially ones that happen between Git commands. So it must be a long-running daemon or service process and not associated with an individual Git command instance. And thus, it cannot be a traditional Git hook (child) process. This design does allow it to service multiple (possibly concurrent) Git commands.

FSMonitor Synchronization

FSMonitor has the concept of a “token”:

  • A token is an opaque string defined by FSMonitor and can be thought of as a globally unique sequence number or timestamp.
  • FSMonitor creates a new token whenever file system events happen.
  • FSMonitor groups file system changes into sets by these ordered tokens.
  • A Git client command sends a (previously generated) token to FSMonitor to request the list of pathnames that have changed, since FSMonitor created that token.
  • FSMonitor includes the current token in every response. The response contains the list of pathnames that changed between the sent and received tokens.

git status writes the received token into the index with other FSMonitor data before it exits. The next git status command reads the previous token (along with the other FSMonitor data) and asks FSMonitor what changed since the previous token.

Earlier, I said a token is like a timestamp, but it also includes other fields to prevent incomplete responses:

  • The FSMonitor process id (PID): This identifies the daemon instance that created the token. If the PID in a client’s request token does not match the currently running daemon, we must assume that the client is asking for data on file system events generated before the current daemon instance was started.
  • A file system synchronization id (SID): This identifies the most recent synchronization with the file system. The operating system may drop file system notification events during heavy load. The daemon itself may get overloaded, fall behind, and drop events. Either way, events were dropped, and there is a gap in our event data. When this happens, the daemon must “declare bankruptcy” and (conceptually) restart with a new SID. If the SID in a client’s request token does not match the daemon’s curent SID, we must assume that the client is asking for data spanning such a resync.

In both cases, a normal response from the daemon would be incomplete because of gaps in the data. Instead, the daemon responds with a trivial (“assume everything was changed”) response and a new token. This will cause the current Git client command to do a regular scan of the worktree (as if FSMonitor were not enabled), but let future client commands be fast again.

Types of files in your worktree

When git status examines the worktree, it looks for tracked, untracked, and ignored files.

Tracked files are files under version control. These are files that Git knows about. These are files that Git will create in your worktree when you do a git checkout. The file in the worktree may or may not match the version listed in the index. When different, we say that there is an unstaged change. (This is independent of whether the staged version matches the version referenced in the HEAD commit.)

Untracked files are just that: untracked. They are not under version control. Git does not know about them. They may be temporary files or new source files that you have not yet told Git to care about (using git add).

Ignored files are a special class of untracked files. These are usually temporary files or compiler-generated files. While Git will ignore them in commands like git add, Git will see them while searching the worktree and possibly slow it down.

Normally, git status does not print ignored files, but we’ll turn it on for this example so that we can see all four types of files.

$ git status --ignored
On branch master
Changes to be committed:
  (use "git restore --staged <file>..." to unstage)
    modified:   README

Changes not staged for commit:
  (use "git add <file>..." to update what will be committed)
  (use "git restore <file>..." to discard changes in working directory)
    modified:   README
    modified:   main.c

Untracked files:
  (use "git add <file>..." to include in what will be committed)
    new-file.c

Ignored files:
  (use "git add -f <file>..." to include in what will be committed)
    new-file.obj

The expensive worktree searches

During the worktree search, Git treats tracked and untracked files in two distinct phases. I’ll talk about each phase in detail in later sections.

  1. In “refresh_index,” Git looks for unstaged changes. That is, changes to tracked files that have not been staged (added) to the index. This potentially requires looking at each tracked file in the worktree and comparing its contents with the index version.
  2. In “untracked,” Git searches the worktree for untracked files and filters out tracked and ignored files. This potentially requires completely searching each subdirectory in the worktree.

There is a third phase where Git compares the index and the HEAD commit to look for staged changes, but this phase is very fast, because it is inspecting internal data structures that are designed for this comparision. It avoids the significant number of system calls that are required to inspect the worktree, so we won’t worry about it here.

A detailed example

The chart in the introduction showed status times before and after FSMonitor was enabled. Let’s revisit that chart and fill in some details.

I collected performance data for git status on worktrees from three large repositories. There were no modified files, and git status was clean.

  1. The Chromium repository contains about 400K files and 33K directories.
  2. A synthetic repository containing 1M files and 111K directories.
  3. A synthetic repository containing 2M files and 111K directories.

Here we can see that when FSMonitor is not present, the commands took from 17 to 85 seconds. However, when FSMonitor was enabled the commands took less than 1 second.

Each bar shows the total run time of the git status commands. Within each bar, the total time is divided into parts based on performance data gathered by Git’s trace2 library to highlight the important or expensive steps within the commands.

Worktree Files refresh_index

with Preload

Untracked

without Untracked-Cache

Remainder Total
Chromium 393K 12.3s 5.1s 0.16s 17.6s
Synthetic 1M 1M 30.2s 10.5s 0.36s 41.1s
Synthetic 2M 2M 73.2s 11.2s 0.64s 85.1s

The top three bars are without FSMonitor. We can see that most of the time was spent in the refresh_index and untracked columns. I’ll explain what these are in a minute. In the remainder column, I’ve subtracted those two from the total run time. This portion barely shows up on these bars, so the key to speeding up git status is to attack those two phases.

The bottom three bars on the above chart have FSMonitor and the untracked-cache enabled. They show a dramatic performance improvement. On this chart these bars are barely visible, so let’s zoom in on them.

This chart rescales the FSMonitor bars by 100X. The refresh_index and untracked columns are still present but greatly reduced thanks to FSMonitor.

Worktree Files refresh_index

with FSMonitor

Untracked

with FSMonitor

and Untracked-Cache

Remainder Total
Chromium 393K 0.024s 0.519s 0.284s 0.827s
Synthetic 1M 1M 0.050s 0.112s 0.428s 0.590s
Synthetic 2M 2M 0.096s 0.082s 0.572s 0.750s

This is bigger than just status

So far I’ve only talked about git status, since it is the command that we probably use the most and are always thinking about when talking about performance relative to the state and size of the worktree. But it is just one of many affected commands:

  • git diff does the same search, but uses the changed files it finds to print a difference in the worktree and your index.
  • git add . does the same search, but it stages each changed file it finds.
  • git restore and git checkout do the same search to decide the files to be replaced.

So, for simplicity, I’ll just talk about git status, but keep in mind that this approach benefits many other commands, since the cost of actually staging, overwriting, or reporting the change is relatively trivial by comparison — the real performance cost in these commands (as the above charts show) is the time it takes to simply find the changed files in the worktree.

Phase 1: refresh_index

The index contains an “index entry” with information for each tracked file. The git ls-files command can show us what that list looks like. I’ll truncate the output to only show a couple of files. In a monorepo, this list might contain millions of entries.

$ git ls-files --stage --debug
[...]
100644 7ce4f05bae8120d9fa258e854a8669f6ea9cb7b1 0   README.md
  ctime: 1646085519:36302551
  mtime: 1646085519:36302551
  dev: 16777220 ino: 180738404
  uid: 502  gid: 20
  size: 3639    flags: 0
[...]
100644 5f1623baadde79a0771e7601dcea3c8f2b989ed9 0   Makefile
  ctime: 1648154224:994917866
  mtime: 1648154224:994917866
  dev: 16777221 ino: 182328550
  uid: 502  gid: 20
  size: 110149  flags: 0
[...]

Scanning tracked files for unstaged changes

Let’s assume at the beginning of refresh_index that all index entries are “unmarked” — meaning that we don’t know yet whether or not the worktree file contains an unstaged change. And we “mark” an index entry when we know the answer (either way).

To determine if an individual tracked file has an unstaged change, it must be “scanned”. That is, Git must read, clean, hash the current contents of the file, and compare the computed hash value with the hash value stored in the index. If the hashes are the same, we mark the index entry as “valid”. If they are different, we mark it as an unstaged change.

In theory, refresh_index must repeat this for each tracked file in the index.

As you can see, each individual file that we have to scan will take time and if we have to do a “full scan”, it will be very slow, especially if we have to do it for millions of files. For example, on the Chromium worktree, when I forced a full scan it took almost an hour.

Worktree Files Full Scan
Chromium 393K 3072s

refresh_index shortcuts

Since doing a full scan of the worktree is so expensive, Git has developed various shortcuts to avoid scanning whenever possible to increase the performance of refresh_index.

For discussion purposes, I’m going to describe them here as independent steps rather than somewhat intertwined steps. And I’m going to start from the bottom, because the goal of each shortcut is to look at unmarked index entries, mark them if they can, and make less work for the next (more expensive) step. So in a perfect world, the final “full scan” would have nothing to do, because all of the index entries have already been marked, and there are no unmarked entries remaining.

In the above chart, we can see the cummulative effects of these shortcuts.

Shortcut: refresh_index with lstat()

The “lstat() shortcut” was created very early in the Git project.

To avoid actually scanning every tracked file on every git status command, Git relies on a file’s last modification time (mtime) to tell when a file was last changed. File mtimes are updated when files are created or edited. We can read the mtime using the lstat() system call.

When Git does a git checkout or git add, it writes each worktree file’s current mtime into its index entry. These serve as the reference mtimes for future git status commands.

Then, during a later git status, Git checks the current mtime against the reference mtime (for each unmarked file). If they are identical, Git knows that the file content hasn’t changed and marks the index entry valid (so that the next step will avoid it). If the mtimes are different, this step leaves the index entry unmarked for the next step.

Worktree Files refresh_index with lstat()
Chromium 393K 26.9s
Synthetic 1M 1M 66.9s
Synthetic 2M 2M 136.6s

The above table shows the time in seconds taken to call lstat() on every file in the worktree. For the Chromium worktree, we’ve cut the time of refresh_index from 50 minutes to 27 seconds.

Using mtimes is much faster than always scanning each file, but Git still has to lstat() every tracked file during the search, and that can still be very slow when there are millions of files.

In this experiment, there were no modifications in the worktree, and the index was up to date, so this step marked all of the index entries as valid and the “scan all unmarked” step had nothing to do. So the time reported here is essentially just the time to call lstat() in a loop.

This is better than before, but even though we are only doing an lstat(), git status is still spending more than 26 seconds in this step. We can do better.

Shortcut: refresh_index with preload

The core.preloadindex config option is an optional feature in Git. The option was introduced in version 1.6 and was enabled by default in 2.1.0 on platforms that support threading.

This step partitions the index into equal-sized chunks and distributes it to multiple threads. Each thread does the lstat() shortcut on their partition. And like before, index entries with different mtimes are left unmarked for the next step in the process.

The preload step does not change the amount of file scanning that we need to do in the final step, it just distributes the lstat() calls across all of your cores.

Worktree Files refresh_index with Preload
Chromium 393K 12.3s
Synthetic 1M 1M 30.2s
Synthetic 2M 2M 73.2s

With the preload shortcut git status is about twice as fast on my 4-core Windows laptop, but it is still expensive.

Shortcut: refresh_index with FSMonitor

When FSMonitor is enabled:

  1. The git fsmonitor--daemon is started in the background and listens for file system change notification events from the operating system for files within the worktree. This includes file creations, deletions, and modifications. If the daemon gets an event for a file, that file probably has an updated mtime. Said another way, if a file mtime changes, the daemon will get an event for it.
  2. The FSMonitor index extension is added to the index to keep track of FSMonitor and git status data between git status commands. The extension contains an FSMonitor token and a bitmap listing the files that were marked valid by the previous git status command (and relative to that token).
  3. The next git status command will use this bitmap to initialize the marked state of the index entries. That is, the previous Git command saved the marked state of the index entries in the bitmap and this command restores them — rather than initializing them all as unmarked.
  4. It will then ask the daemon for a list of files that have had file system events since the token and unmark each of them. FSMonitor tells us the exact set of files that have been modified in some way since the last command, so those are the only files that we should need to visit.

At this point, all of the unchanged files should be marked valid. Only files that may have changed should be unmarked. This sets up the next shortcut step to have very little to do.

Worktree Files Query FSMonitor refresh_index with FSMonitor
Chromium 393K 0.017s 0.024s
Synthetic 1M 1M 0.002s 0.050s
Synthetic 2M 2M 0.002s 0.096s

This table shows that refresh_index is now very fast since we don’t need to any searching. And the time to request the list of files over IPC is well worth the complex setup.

Phase 2: untracked

The “untracked” phase is a search for anything in the worktree that Git does not know about. These are files and directories that are not under version control. This requires a full search of the worktree.

Conceptually, this looks like:

  1. A full recursive enumeration of every directory in the worktree.
  2. Build a complete list of the pathnames of every file and directory within the worktree.
  3. Take each found pathname and do a binary search in the index for a corresponding index entry. If one is found, the pathname can be omitted from the list, because it refers to a tracked file.
    1. On case insensitive systems, such as Windows and macOS, a case insensitive hash table must be constructed from the case sensitive index entries and used to lookup the pathnames instead of the binary search.
  4. Take each remaining pathname and apply .gitignore pattern matching rules. If a match is found, then the pathname is an ignored file and is omitted from the list. This pattern matching can be very expensive if there are lots of rules.
  5. The final resulting list is the set of untracked files.

This search can be very expensive on monorepos and frequently leads to the following advice message:

$ git status
On branch main
Your branch is up to date with 'origin/main'.

It took 5.12 seconds to enumerate untracked files. 'status -uno'
may speed it up, but you have to be careful not to forget to add
new files yourself (see 'git help status').
nothing to commit, working tree clean

Normally, the complete discovery of the set of untracked files must be repeated for each command unless the [core.untrackedcache](https://git-scm.com/docs/git-config#Documentation/git-config.txt-coreuntrackedCache) feature is enabled.

The untracked-cache

The untracked-cache feature adds an extension to the index that remembers the results of the untracked search. This includes a record for each subdirectory, its mtime, and a list of the untracked files within it.

With the untracked-cache enabled, Git still needs to lstat() every directory in the worktree to confirm that the cached record is still valid.

If the mtimes match:

  • Git avoids calling opendir() and readdir() to enumerate the files within the directory,
  • and just uses the existing list of untracked files from the cache record.

If the mtimes don’t match:

  • Git needs to invalidate the untracked-cache entry.
  • Actually open and read the directory contents.
  • Call lstat() on each file or subdirectory within the directory to determine if it is a file or directory and possibly invalidate untracked-cache entries for any subdirectories.
  • Use the file pathname to do tracked file filtering.
  • Use the file pathname to do ignored file filtering
  • Update the list of untracked files in the untracked-cache entry.

How FSMonitor helps the untracked-cache

When FSMonitor is also enabled, we can avoid the lstat() calls, because FSMonitor tells us the set of directories that may have an updated mtime, so we don’t need to search for them.

Worktree Files Untracked

without Untracked-Cache

Untracked

with Untracked-Cache

Untracked

with Untracked-Cache

and FSMonitor

Chromium 393K 5.1s 2.3s 0.83s
Synthetic 1M 1M 10.5s 6.3s 0.59s
Synthetic 2M 2M 11.2s 6.6s 0.75s

By itself, the untracked-cache feature gives roughly a 2X speed up in the search for untracked files. Use both the untracked-cache and FSMonitor, and we see a 10X speedup.

A note about ignored files

You can improve Git performance by not storing temporary files, such as compiler intermediate files, inside your worktree.

During the untracked search, Git first eliminates the tracked files from the candidate untracked list using the index. Git then uses the .gitignore pattern matching rules to eliminate the ignored files. Git’s performance will suffer if there are many rules and/or many temporary files.

For example, if there is a *.o for every source file and they are stored next to their source files, then every build will delete and recreate one or more object files and cause the mtime on their parent directories to change. Those mtime changes will cause git status to invalidate the corresponding untracked-cache entries and have to re-read and re-filter those directories — even if no source files actually changed. A large number of such temporary and uninteresting files can greatly affect the performance of these Git commands.

Keeping build artifacts out of your worktree is part of the philosophy of the Scalar Project. Scalar introduced Git tooling to help you keep your worktree in <repo-name>/src/ to make it easier for you to put these other files in <repo-name>/bin/ or <repo-name>/packages/, for example.

A note about sparse checkout

So far, we’ve talked about optimizations to make Git work smarter and faster on worktree-related operations by caching data in the index and in various index extensions. Future commands are faster, because they don’t have to rediscover everything and therefore can avoid repeating unnecessary or redundant work. But we can only push that so far.

The Git sparse checkout feature approaches worktree performance from another angle. With it, you can ask Git to only populate the files that you need. The parts that you don’t need are simply not present. For example, if you only need 10% of the worktree to do your work, why populate the other 90% and force Git to search through them on every command?

Sparse checkout speeds the search for unstaged changes in refresh_index because:

  1. Since the unneeded files are not actually present on disk, they cannot have unstaged changes. So refresh_index can completely ignore them.
  2. The index entries for unneeded files are pre-marked during git checkout with the skip-worktree bit, so they are never in an “unmarked” state. So those index entries are excluded from all of the refresh_index loops.

Sparse checkout speeds the search for untracked files because:

  1. Since Git doesn’t know whether a directory contains untracked files until it searches it, the search for untracked files must visit every directory present in the worktree. Sparse checkout lets us avoid creating entire sub-trees or “cones” from the worktree. So there are fewer directories to visit.
  2. The untracked-cache does not need to create, save, and restore untracked-cache entries for the unpopulated directories. So reading and writing the untracked-cache extension in the index is faster.

External file system monitors

So far we have only talked about Git’s builtin FSMonitor feature. Clients use the simple IPC interface to communicate directly with git fsmonitor--daemon over a Unix domain socket or named pipe.

However, Git added support for an external file system monitor in version 2.16.0 using the core.fsmonitor hook. Here, clients communicate with a proxy child helper process through the hook interface, and it communicates with an external file system monitor process.

Conceptually, both types of file system monitors are identical. They include a long-running process that listens to the file system for changes and are able to respond to client requests for a list of recently changed files and directories. The response from both are used identically to update and modify the refresh_index and untracked searches. The only difference is in how the client talks to the service or daemon.

The original hook interface was useful, because it allowed Git to work with existing off-the-shelf tools and allowed the basic concepts within Git to be proven relatively quickly, confirm correct operation, and get a quick speed up.

Hook protocol versions

The original 2.16.0 version of the hook API used protocol version 1. It was a timestamp-based query. The client would send a timestamp value, expressed as nanoseconds since January 1, 1970, and expect a list of the files that had changed since that timestamp.

Protocol version 1 has several race conditions and should not be used anymore. Protocol version 2 was added in 2.26.0 to address these problems.

Protocol version 2 is based upon opaque tokens provided by the external file system monitor process. Clients make token-based queries that are relative to a previously issued token. Instead of making absolute requests, clients ask what has changed since their last request. The format and content of the token is defined by the external file system monitor, such as Watchman, and is treated as an opaque string by Git client commands.

The hook protocol is not used by the builtin FSMonitor.

Using Watchman and the sample hook script

Watchman is a popular external file system monitor tool and a Watchman-compatible hook script is included with Git and copied into new worktrees during git init.

To enable it:

  1. Install Watchman on your system.
  2. Tell Watchman to watch your worktree:
$ watchman watch .
{
    "version": "2022.01.31.00",
    "watch": "/Users/jeffhost/work/chromium",
    "watcher": "fsevents"
}

  1. Install the sample hook script to teach Git how to talk to Watchman:
$ cp .git/hooks/fsmonitor-watchman.sample .git/hooks/query-watchman

  1. Tell Git to use the hook:
$ git config core.fsmonitor .git/hooks/query-watchman

Using Watchman with a custom hook

The hook interface is not limited to running shell or Perl scripts. The included sample hook script is just an example implementation. Engineers at Dropbox described how they were able to speed up Git with a custom hook executable.

Final Remarks

In this article, we have seen how a file system monitor can speed up commands like git status by solving the “discovery” problem and eliminating the need to search the worktree for changes in every command. This greatly reduces the pain of working with monorepos.

This feature was created in two efforts:

  1. First, Git was taught to work with existing off-the-shelf tools, like Watchman. This allowed the basic concepts to be proven relatively quickly. And for users who already use Watchman for other purposes, it allows Git to efficiently interoperate with them.
  2. Second, we brought the feature “in the box” to reduce the setup complexity and third-party dependencies, which some users may find useful. It also lets us consider adding Git-specific features that a generic monitoring tool might not want, such as understanding ignored files and omitting them from the service’s response.

Having both options available lets users choose the best solution for their needs.

Regardless of which type of file system monitor you use, it will help make your monorepos more usable.