Post Syndicated from Joshua Nelson original https://blog.cloudflare.com/profiling-your-workers-with-wrangler/


In the year since Cloudflare’s launch of Workers Unbound, developers have unlocked the ability to run computationally intensive workloads on the Cloudflare edge network — like image processing, game logic, and other complex algorithms. With all that additional computing power comes a host of questions around performance. Our customers often ask us how they can profile or monitor their Workers to see where they spend the most CPU time, or to see whether their changes improve performance.
Here at Cloudflare, we not only want to build the fastest, most affordable, and most flexible compute platform at the edge; we also want to make the lives of our developers easier in building their applications. To do this, Cloudflare has begun to integrate with existing tools — places our developers feel comfortable and efficient in their day-to-day work. To help measure performance of our customers’ Workers, we’re beginning to integrate with the Chrome DevTools protocol. Just like you can use chrome://inspect to debug your Node backend, you can also use it to profile your Cloudflare Workers.
Introducing Chrome DevTools Integration (Beta)
We’re starting off this integration with beta support for local CPU profiling, using Wrangler. To show off how to use this feature, I’m going to be optimizing a simple JavaScript program which outputs the first thousand integers separated by a space. Let’s start by installing the latest version of Wrangler. We’ll also need a Worker cloned down to your local machine. I’ll be using Workers Profiling Example, but feel free to use any CPU intensive Worker for this tutorial.
For reference, my sample code is below. You’ll notice this code is intentionally performing a computation that will slow down our Worker.
addEventListener("fetch", event => {
  event.respondWith(handleRequest(event.request));
});

async function handleRequest(request) {
  let body = '';
  for (let i = 0; i < 1000; ++i) {
    body = body + ' ' + i;
  }

  return new Response(body, {
    headers: { 'content-type': 'text/plain' },
  });
}
To confirm this, we’ll run Chrome DevTools and profile our Worker locally. In the directory of your sample project, run wrangler dev --inspect. To launch the DevTools, open chrome://inspect in Chrome or Chromium. You’ll see Chrome’s DevTools homepage pop up:

Click ‘Configure’ and add localhost://9230 as one of the targets. You should see wrangler[{Worker name}] appear under “Remote Targets”, where {Worker name} is the name of your project.
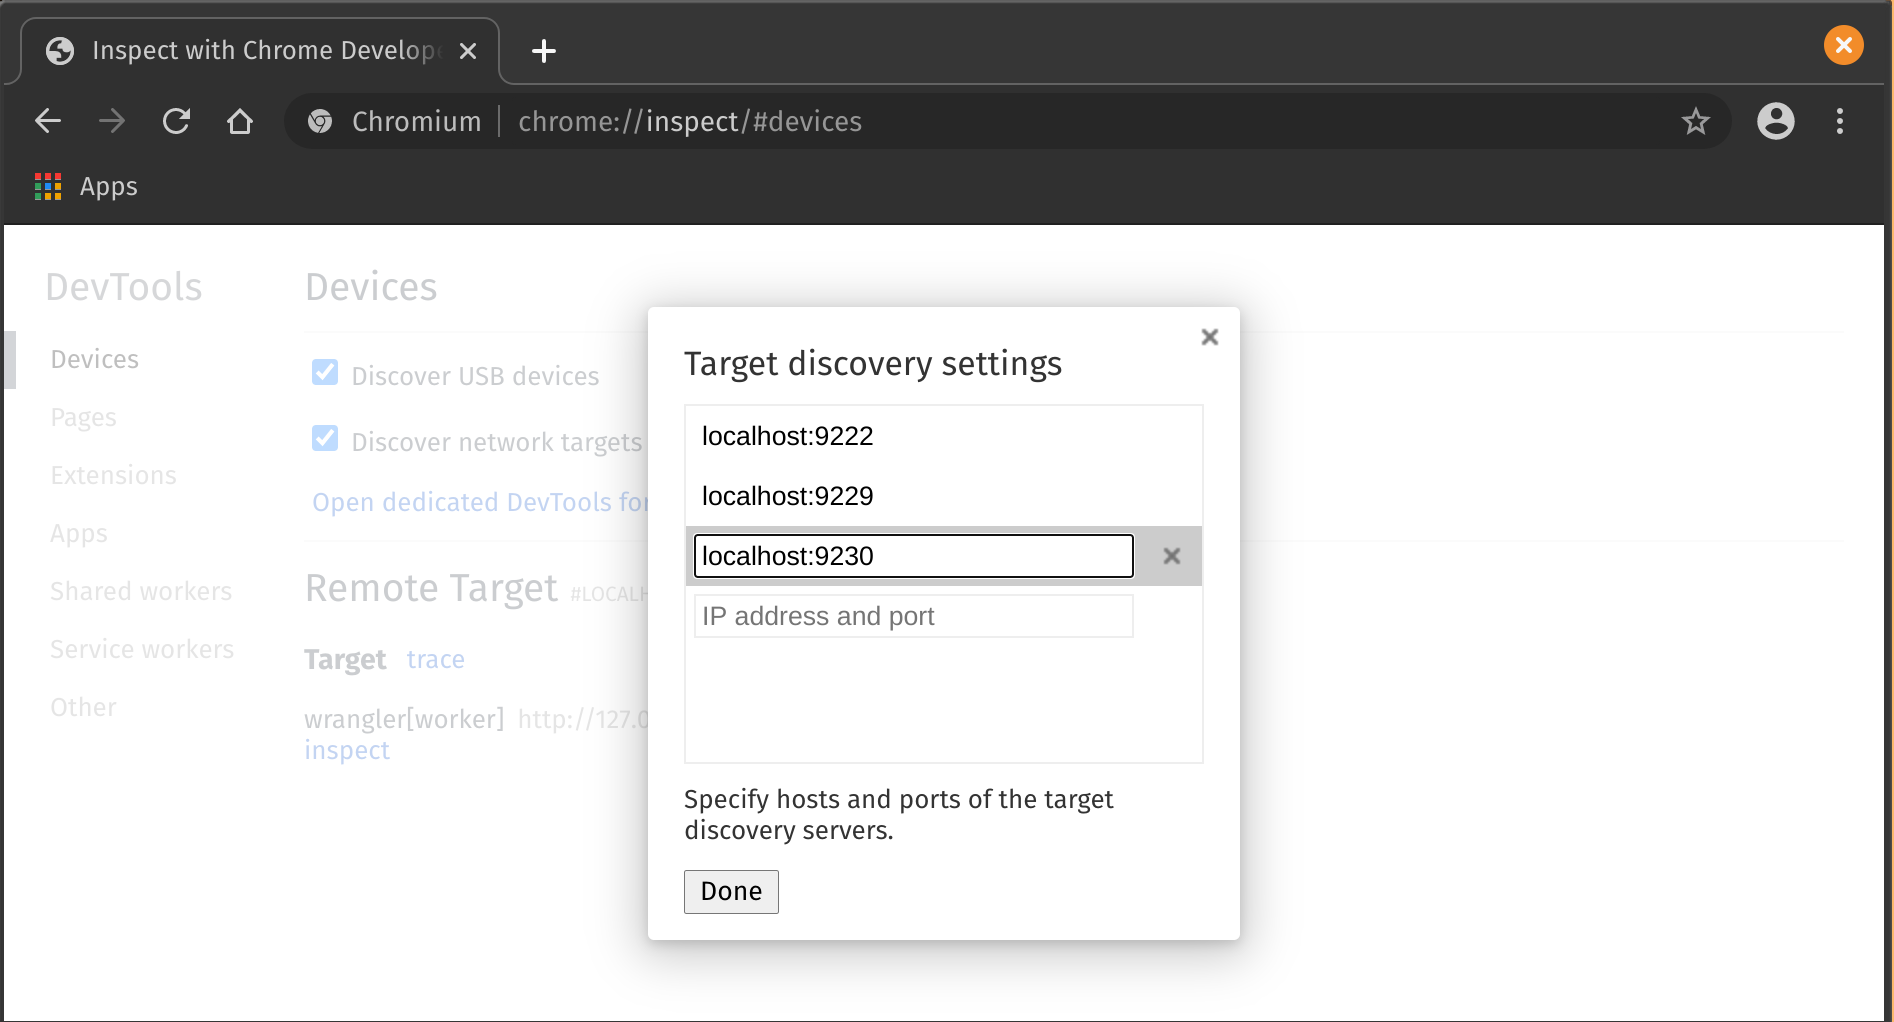
Click ‘inspect’, then in the popup, ‘Profiler’.
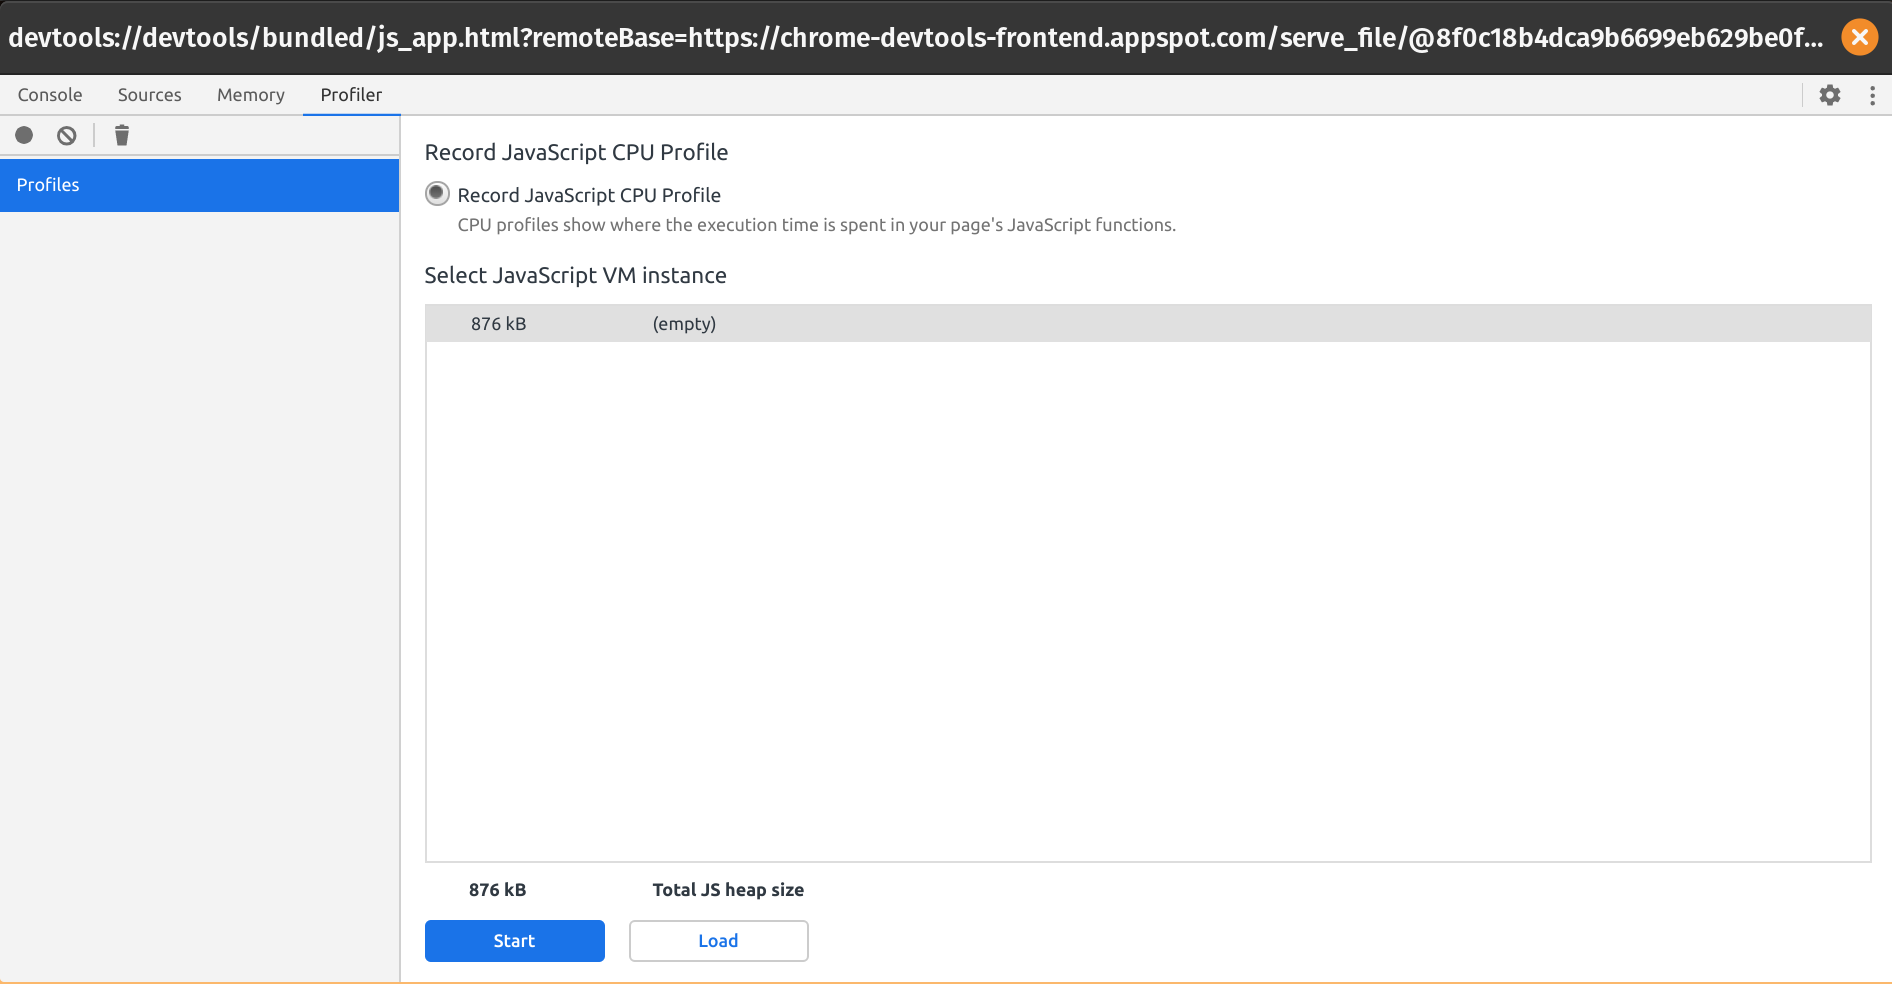
Click ‘Start’ and, in a different browser tab, make a few requests to your site, then click ‘Stop’. It should be available locally on localhost:8787.
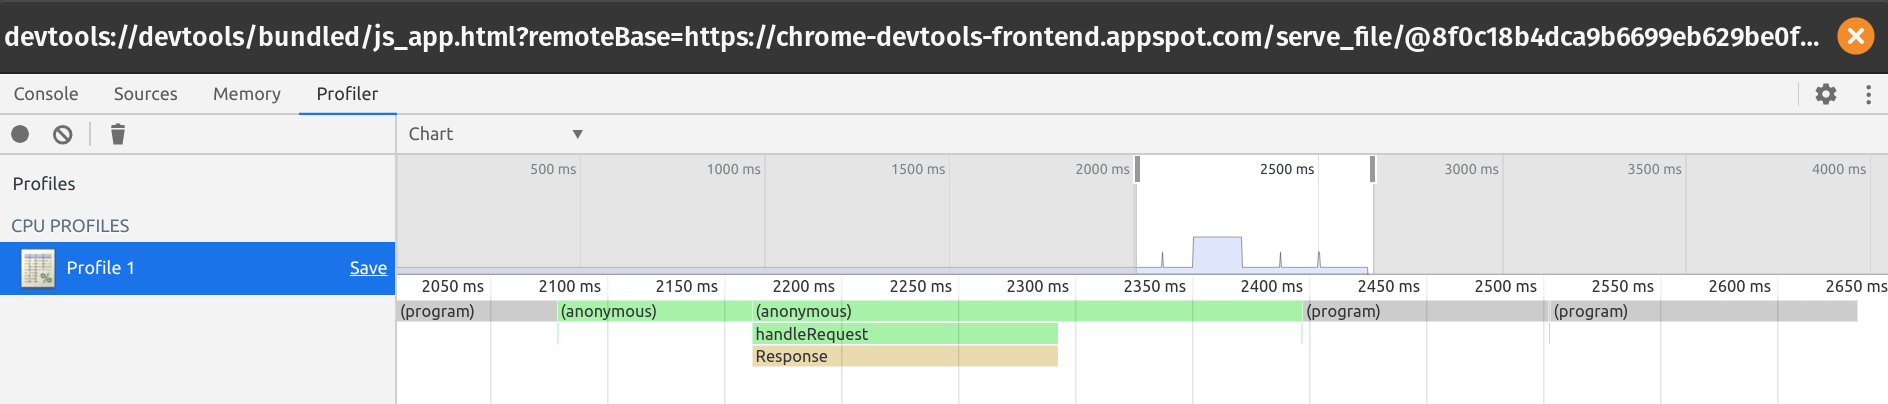
Analyze the flame graph. For my Slow Worker, I see the following graph:
When I click on handleRequest, I see the following annotated source of my Worker:
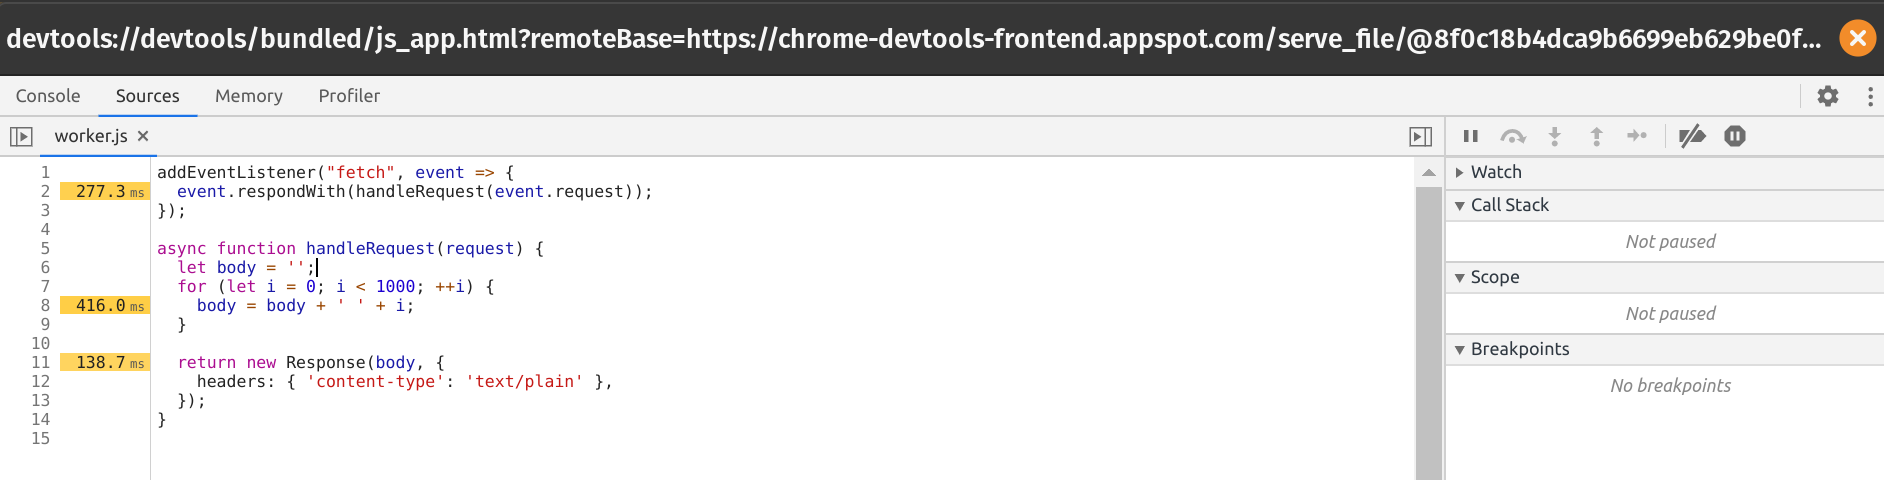
In particular, it shows that, unsurprisingly, most of the time is being spent on memory allocations in the body of the loop. Note that the profiler is not always accurate with regard to exact timing, but does paint a picture of your largest bottlenecks.
Understanding the Profile
The profiler works by gathering a stack trace of your program at a sampled rate, so remember that the profile is an approximation of where your code tends to spend the majority of its execution time, and is not meant to be perfectly accurate. In fact, functions that execute in less than 100 microseconds have a chance to not appear in the profile at all.
What’s Next?
With the Workers platform, we’re striving to build in the observability our users expect out of a robust compute platform. We’d love to hear more from the community about ways we can improve visibility into the code you’re writing on the edge. If you haven’t already, please join the Cloudflare Workers Discord community at https://discord.gg/PX8s2TmJ7s. Happy building!