Post Syndicated from Sam Marsh original http://blog.cloudflare.com/recapping-speed-week-2023/

Speed Week 2023 is officially a wrap.
In our Welcome to Speed Week 2023 blog post, we set a clear goal:
“This week we will help you measure what matters. We’ll help you gain insight into your performance, from Zero Trust and API’s to websites and applications. And finally we’ll help you get faster. Quickly.”.
This week we published five posts on how to measure performance, explaining which metrics and approaches make sense and why. We had a deep dive on the latest Core Web Vital, “Interaction to Next Paint”, what it means and how we can help. There was a post on Time To First Byte (TTFB) and why it isn't a good way to measure good web performance. We also wrote about how to measure Zero Trust performance, and announced the Internet Quality page of Cloudflare Radar – giving everyone the ability to compare Internet connection quality across Internet Service Providers, countries, and more.
We launched new products such as Observatory, Digital Experiencing Monitoring and Timing Insights. These products give an incredible window into how your applications and websites are performing through the eyes of website visitors and your employees.
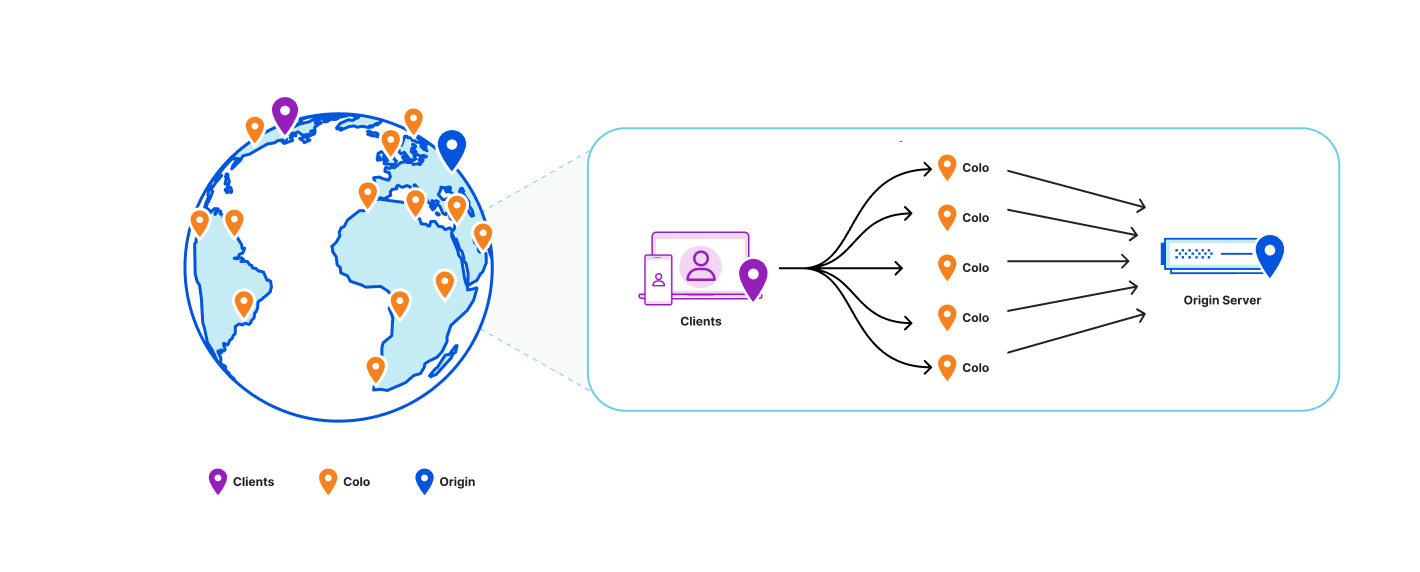
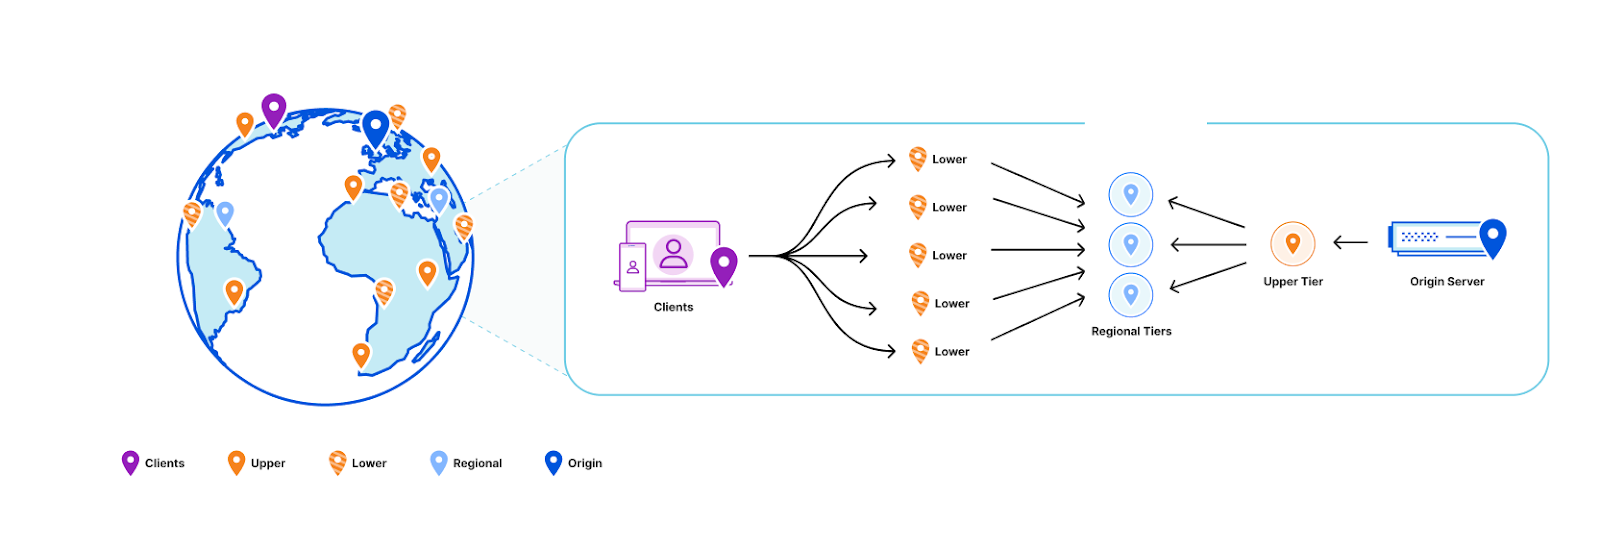
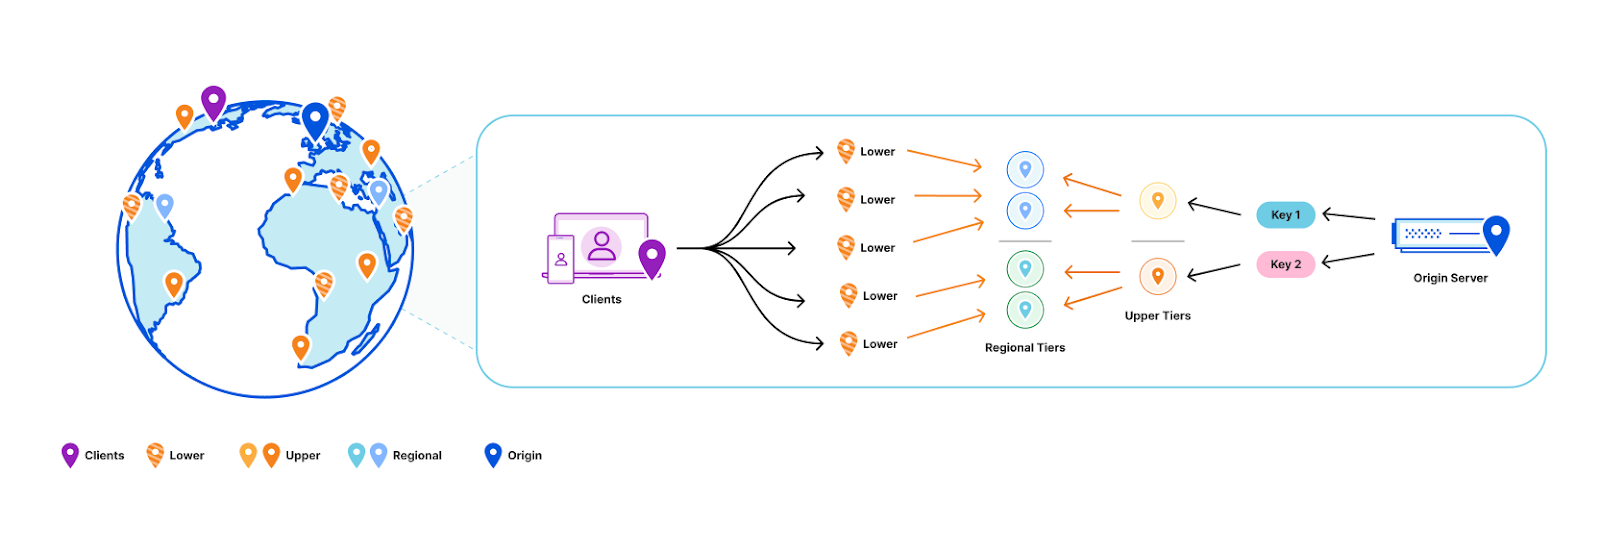
Next, we showed how we continue to be the fastest, with fresh posts on how we have the fastest network, fastest Secure Web Gateway, fastest Zero Trust Network Access and fastest Remote Browser Isolation solutions. There was even an update on how our global network grew to 300 cities. The Cloudflare network is at the center of everything we do, and every product we build benefits from the speed and scale it provides and the proximity to the user.
There were also a number of great product announcements which make speed simple, single button performance boosts to accelerate your traffic. Smart Hints, HTTP/3 Prioritization, Argo for UDP, Brotli end-to-end, LL-HLS for Stream and Ricochet for API Gateway all make speed simple – giving you an immediate speed boost on your traffic for very minimal, if any configuration.
We also showed how AI / ML continue to play a big part at Cloudflare, with posts discussing why running AI inference on Cloudflare's network makes performance sense, and how we both scale and run machine learning at the microseconds level.
Finally, we wrote about how we are making it easier than ever for customers to migrate to Cloudflare from legacy vendors via our Turpentine and Descaler programs.
We’re on a mission to be the fastest at everything we do, and to make it simple for our customers to get the best performance.
In case you missed any of the announcements, take a look at the summary and navigation guide below.
AI / Machine Learning
| Announcement | Summary |
|---|---|
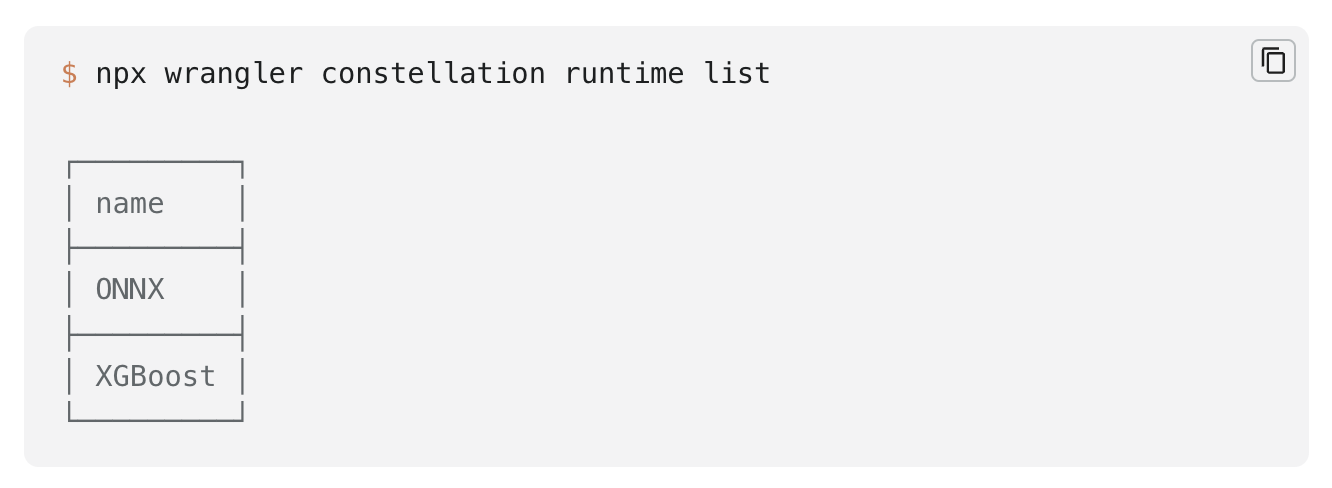
| Globally distributed AI and a Constellation update | Announcing new Constellation features, explaining why it’s the first globally distributed AI platform and why deploying your machine learning tasks in our global network is advantageous. |
| Every request, every second: scalable machine learning at Cloudflare | Describing the technical strategies that have enabled us to expand the number of machine learning features and models, all while substantially reducing the processing time for each HTTP request on our network. |
| How Orpheus automatically routes around bad Internet weather | A little less than two years ago, Cloudflare made Orpheus automatically available to all customers for free. Since then, Orpheus has saved 132 billion Internet requests from failing by intelligently routing them around connectivity outages, prevented 50+ Internet incidents from impacting our customers, and made our customer’s origins more reachable to everyone on the Internet. Let’s dive into how Orpheus accomplished these feats over the last year. |
| How Cloudflare runs machine learning inference in microseconds | How we optimized bot management’s machine learning model execution. To reduce processing latency, we've undertaken a project to rewrite our bot management technology, porting it from Lua to Rust, and applying a number of performance optimizations. This post focuses on optimizations applied to the machine-learning detections within the bot management module, which account for approximately 15% of the latency added by bot detection. By switching away from a garbage collected language, removing memory allocations, and optimizing our parsers, we reduce the P50 latency of the bot management module by 79μs – a 20% reduction. |
Zero Trust
| Announcement | Summary |
|---|---|
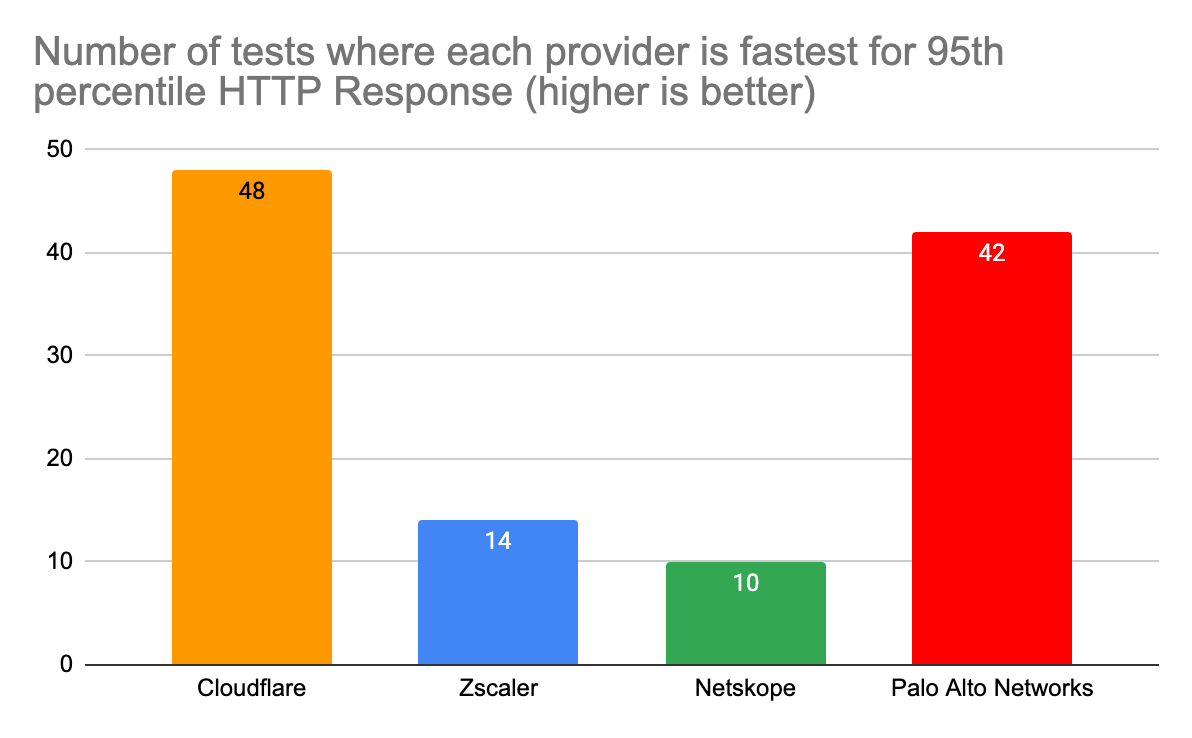
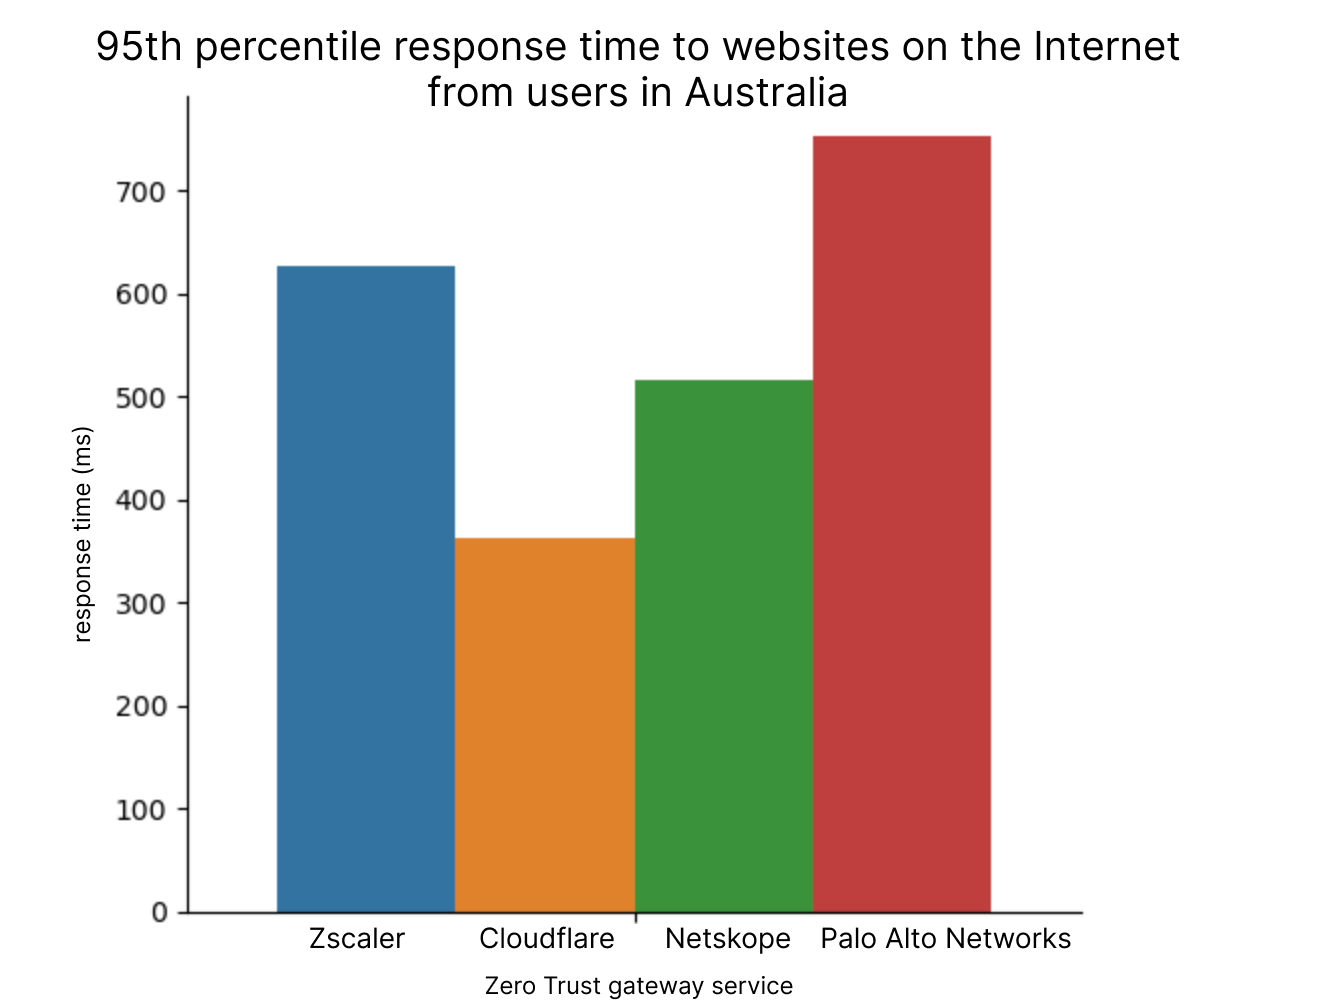
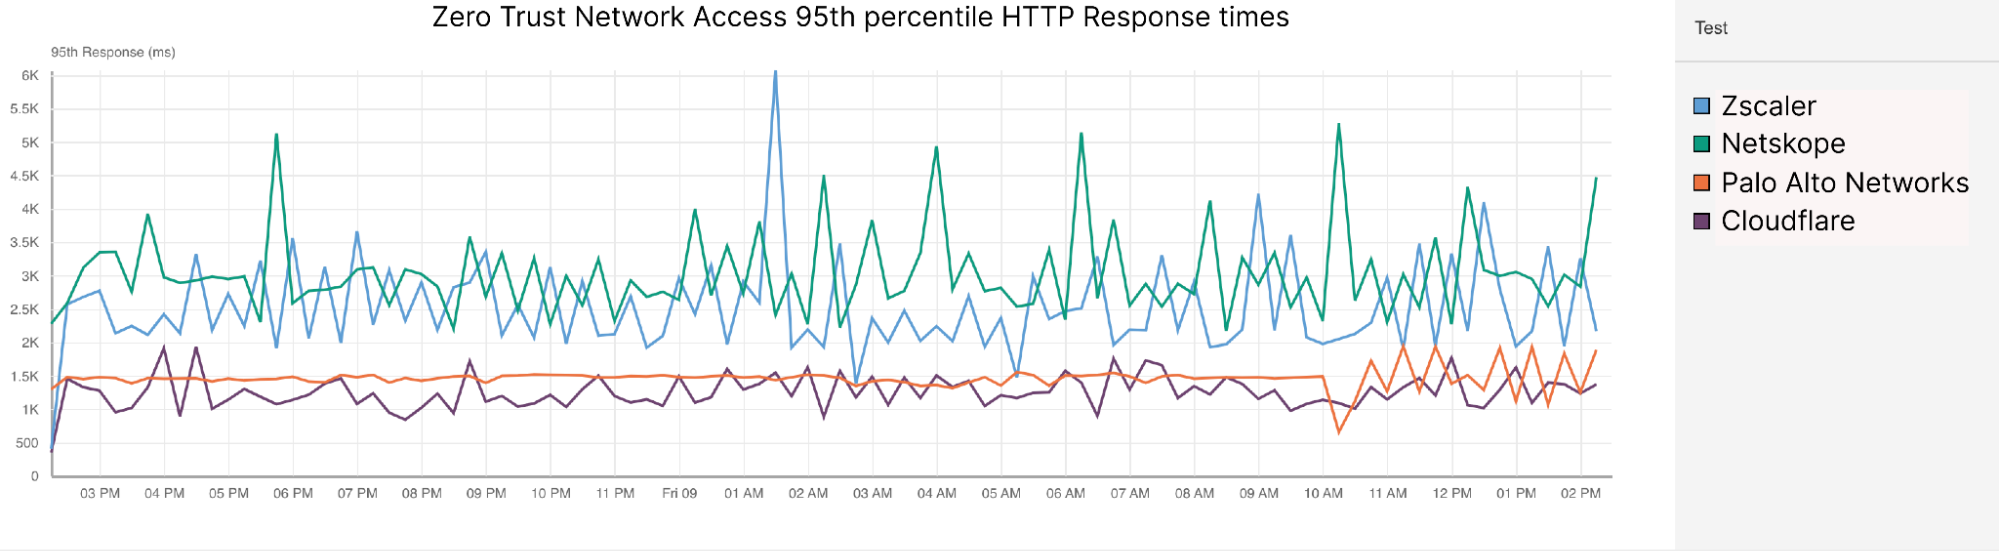
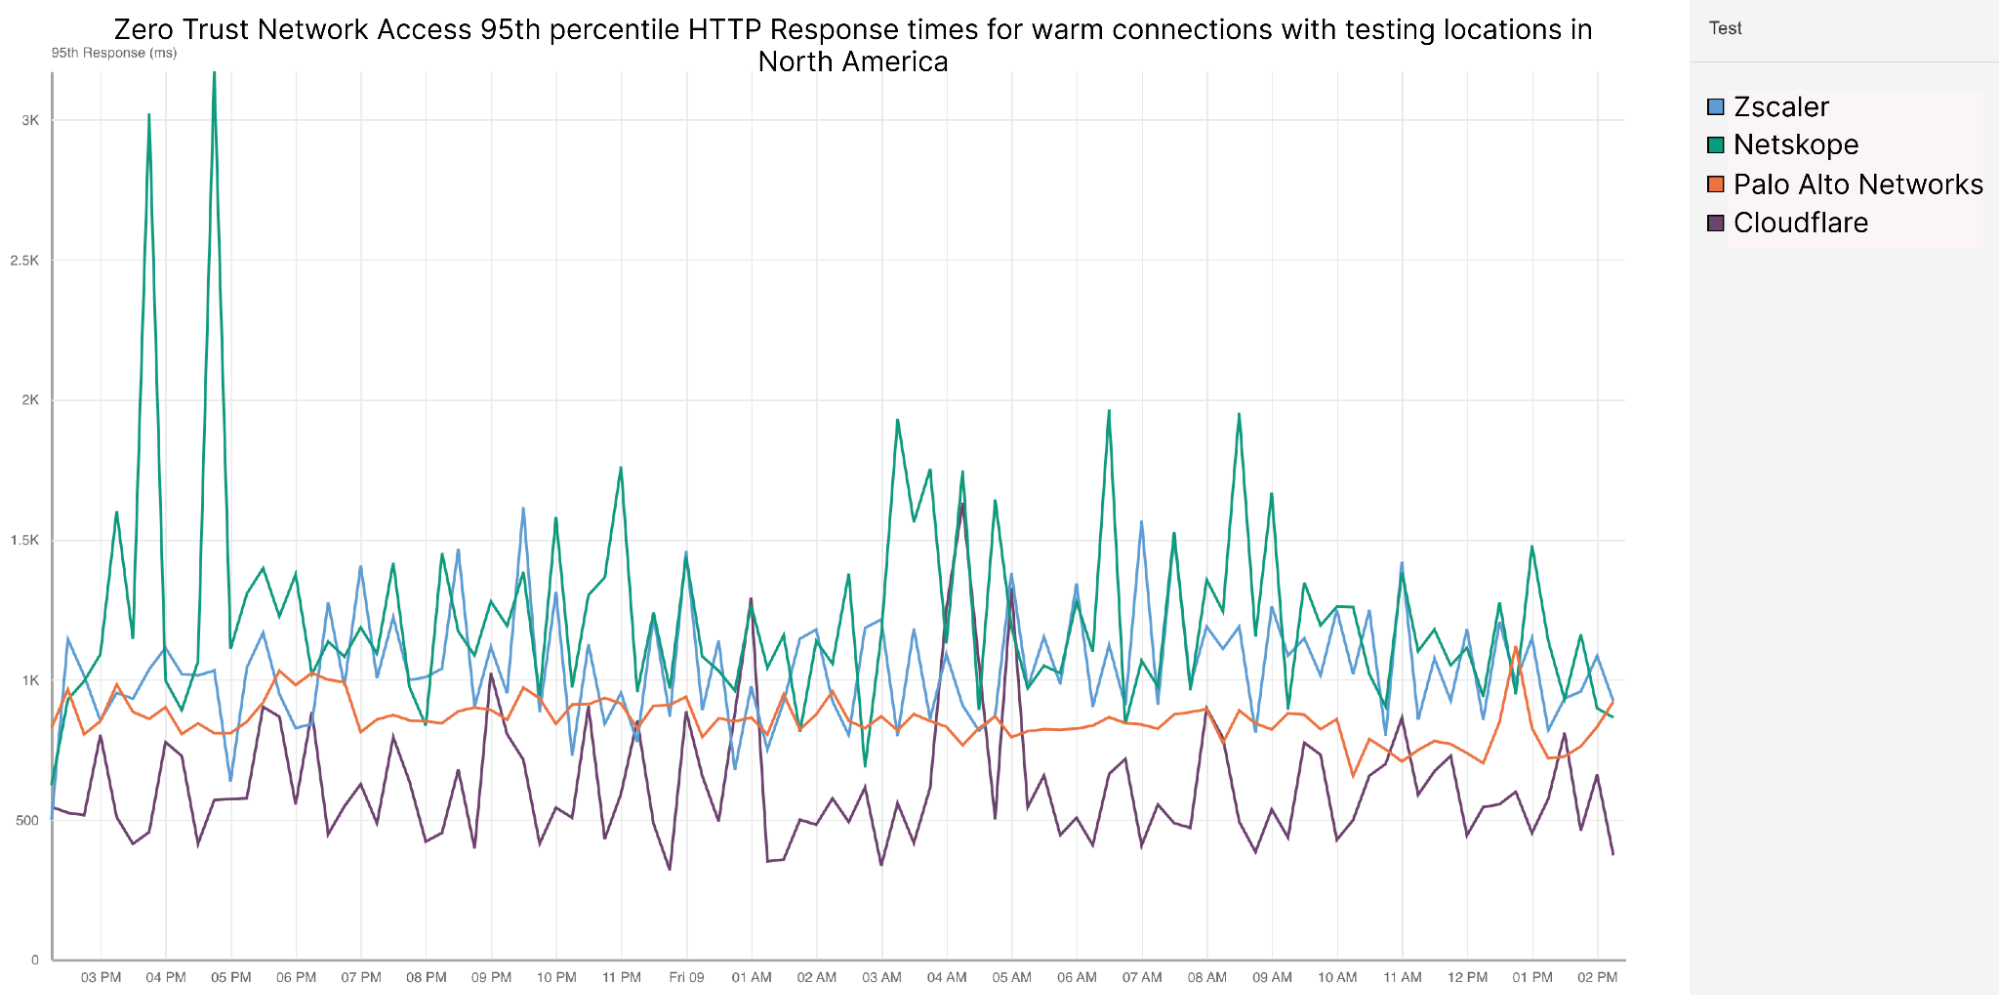
| Spotlight on Zero Trust: we're fastest and here's the proof | Cloudflare is the fastest Secure Web Gateway in 42% of testing scenarios, the most of any provider. Cloudflare is 46% faster than Zscaler, 56% faster than Netskope, and 10% faster than Palo Alto for ZTNA, and 64% faster than Zscaler for RBI scenarios. |
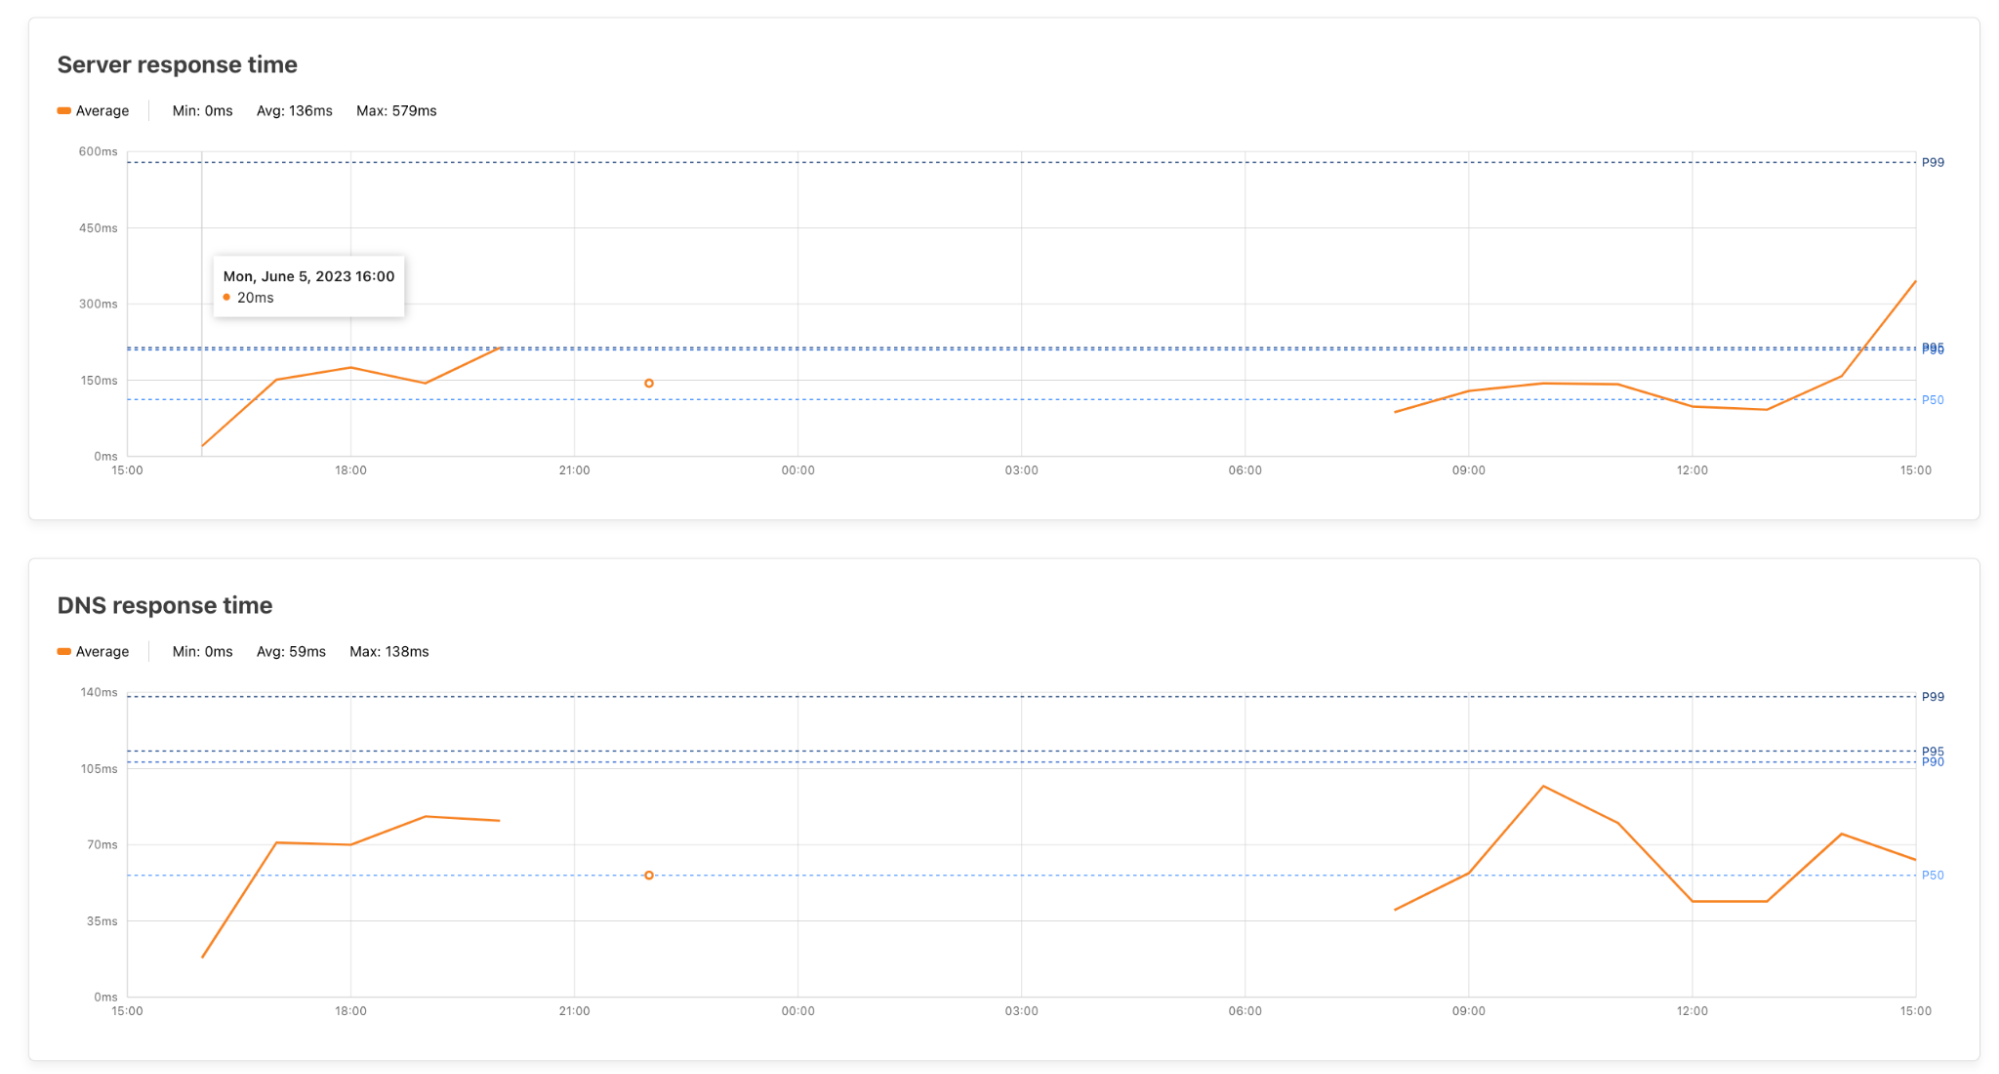
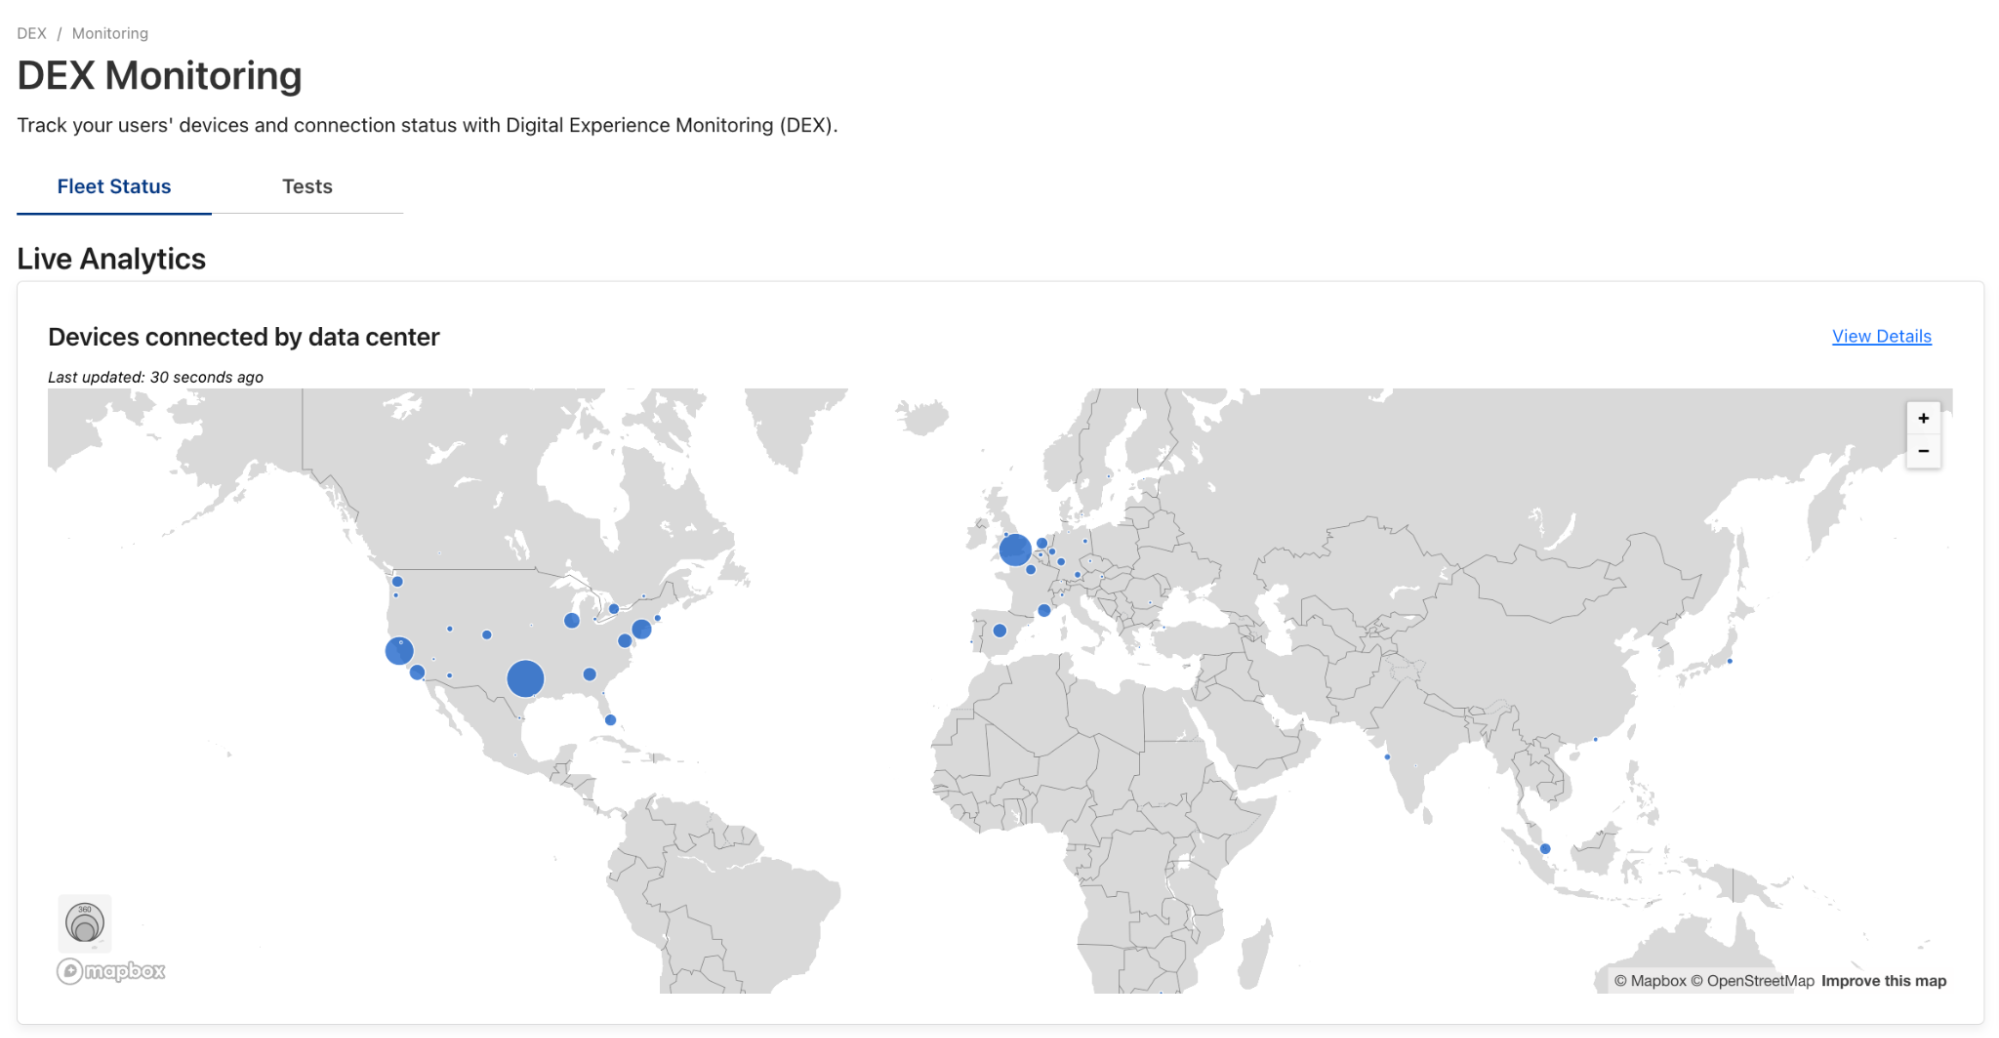
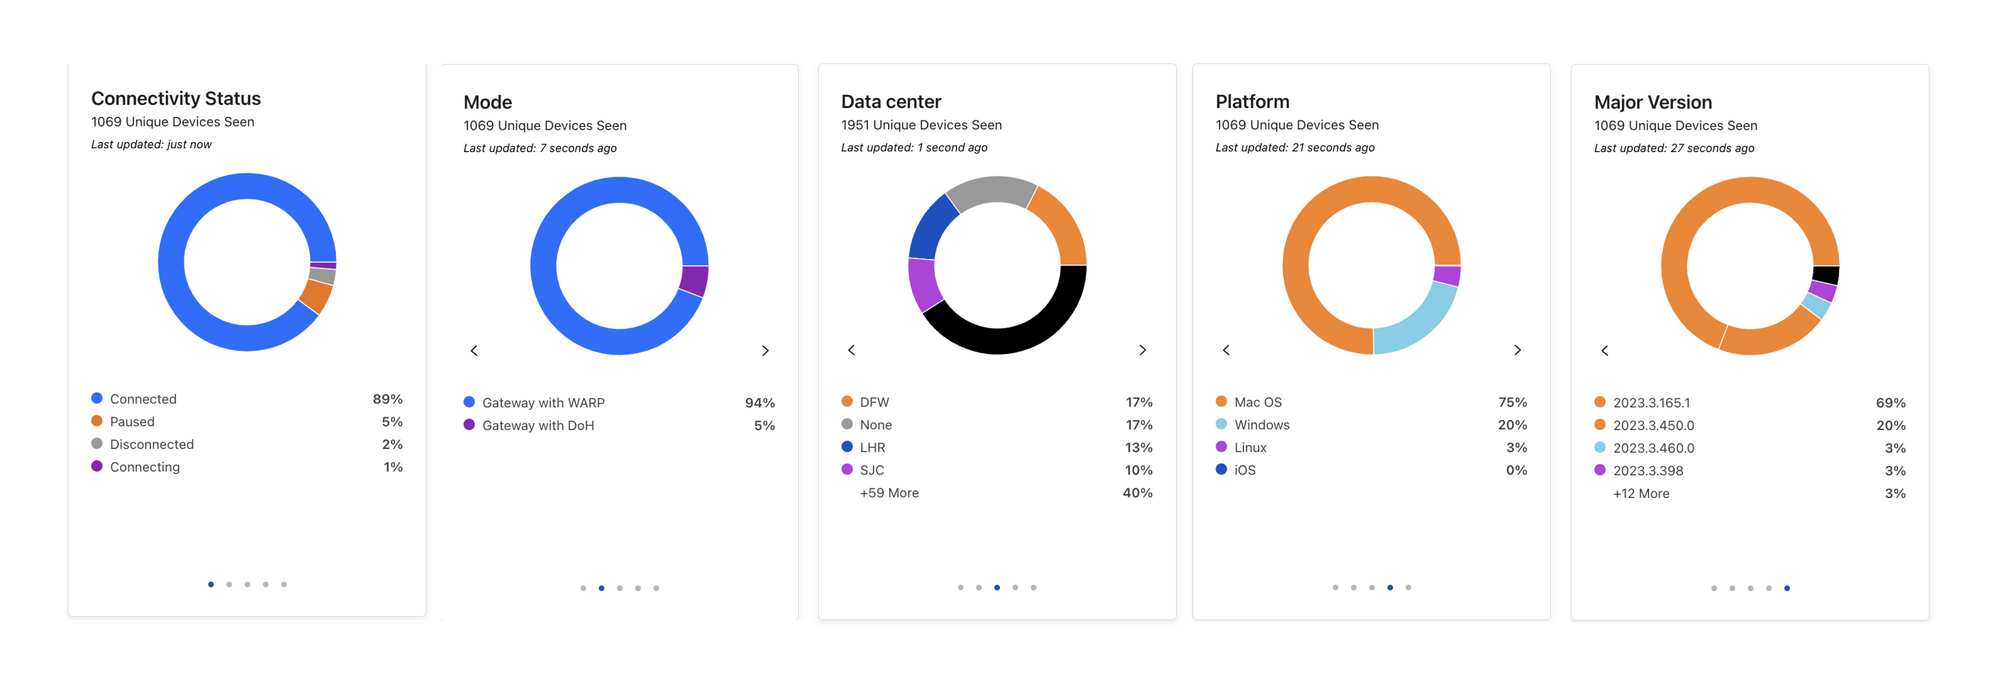
| Understanding end user-connectivity and performance with Digital Experience Monitoring, now available in beta | DEX allows administrators to monitor their WARP Deployment and create predefined application tests. Features include live team & device analytics, server and traceroute tests, Synthetic Application Monitoring, and Fleet Status for real-time insights on WARP deployment. |
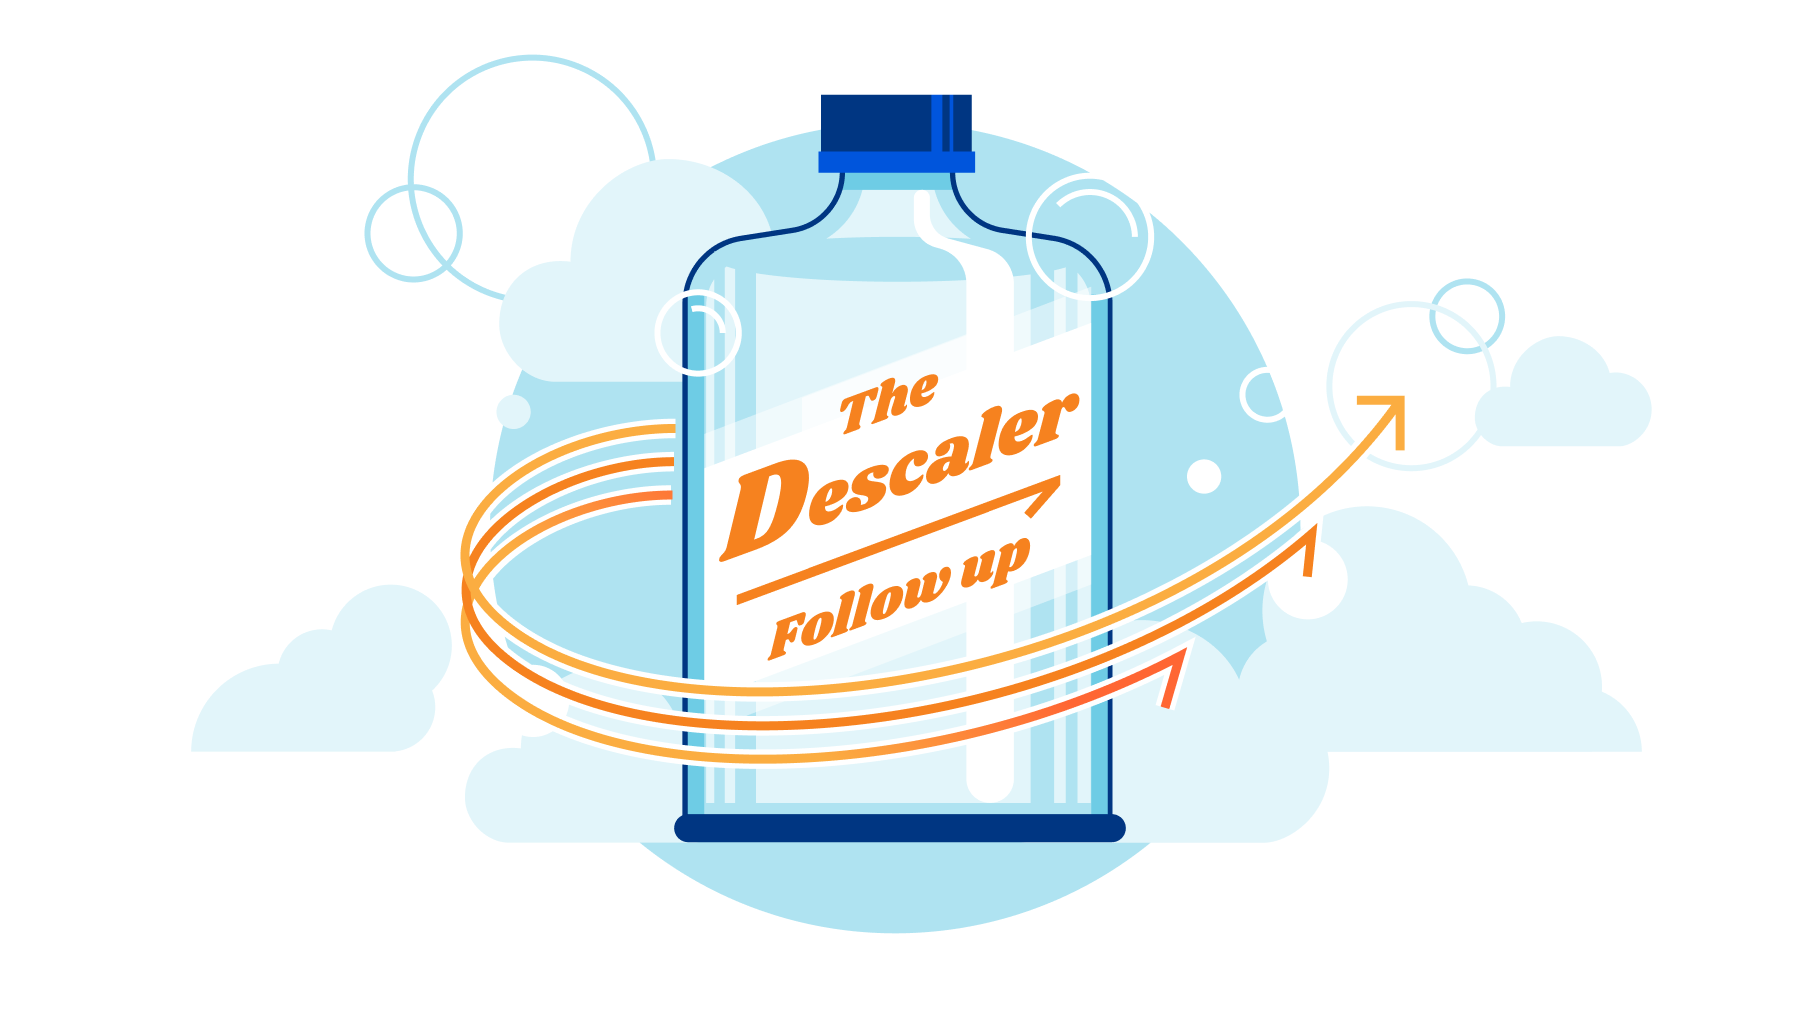
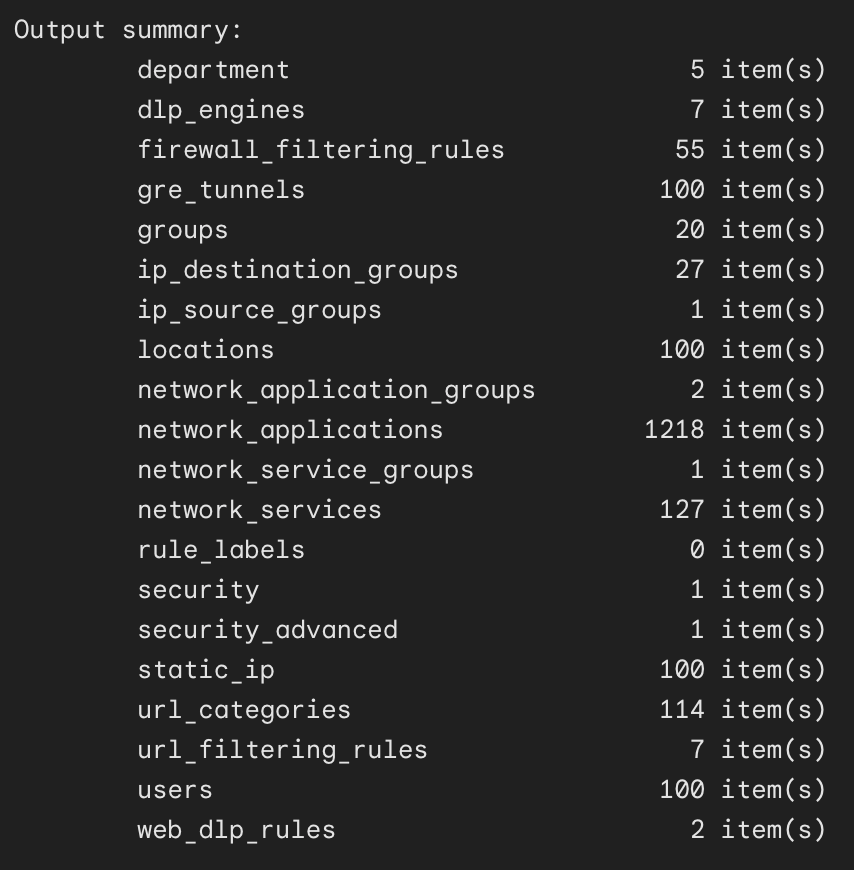
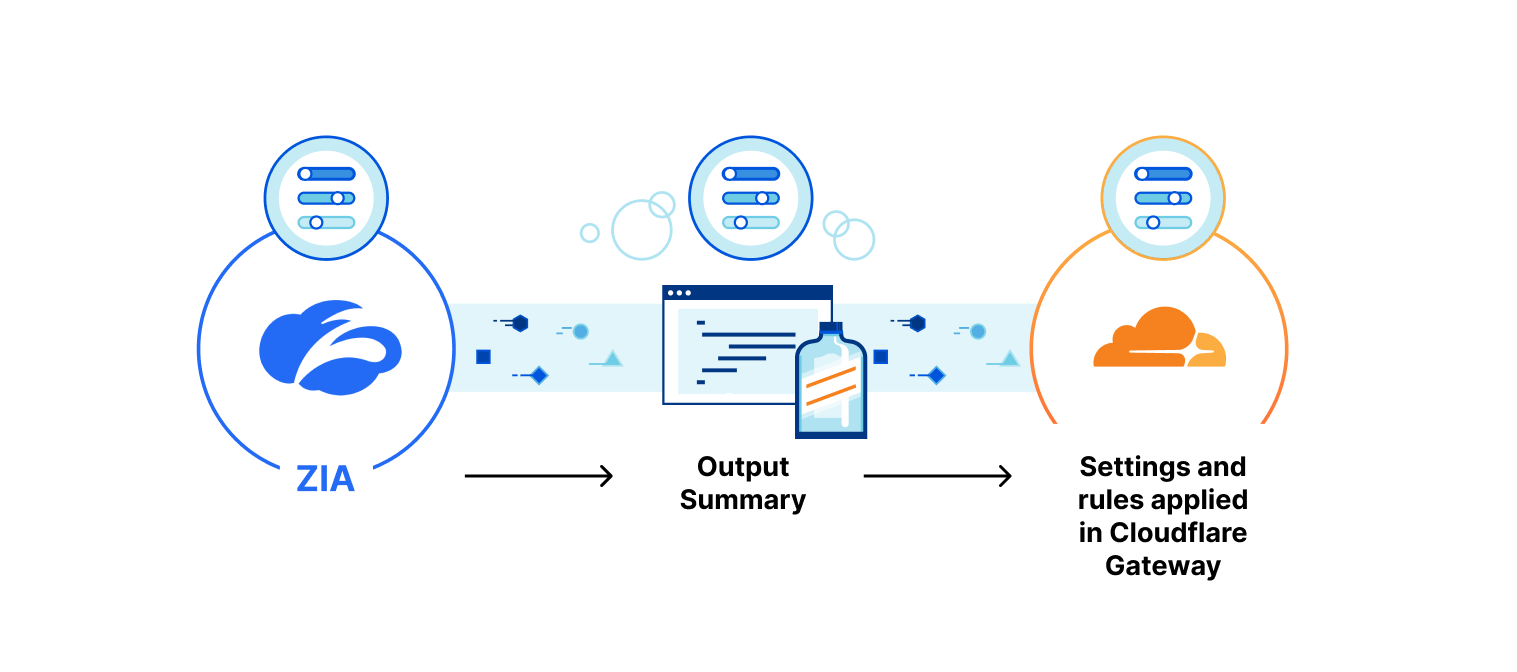
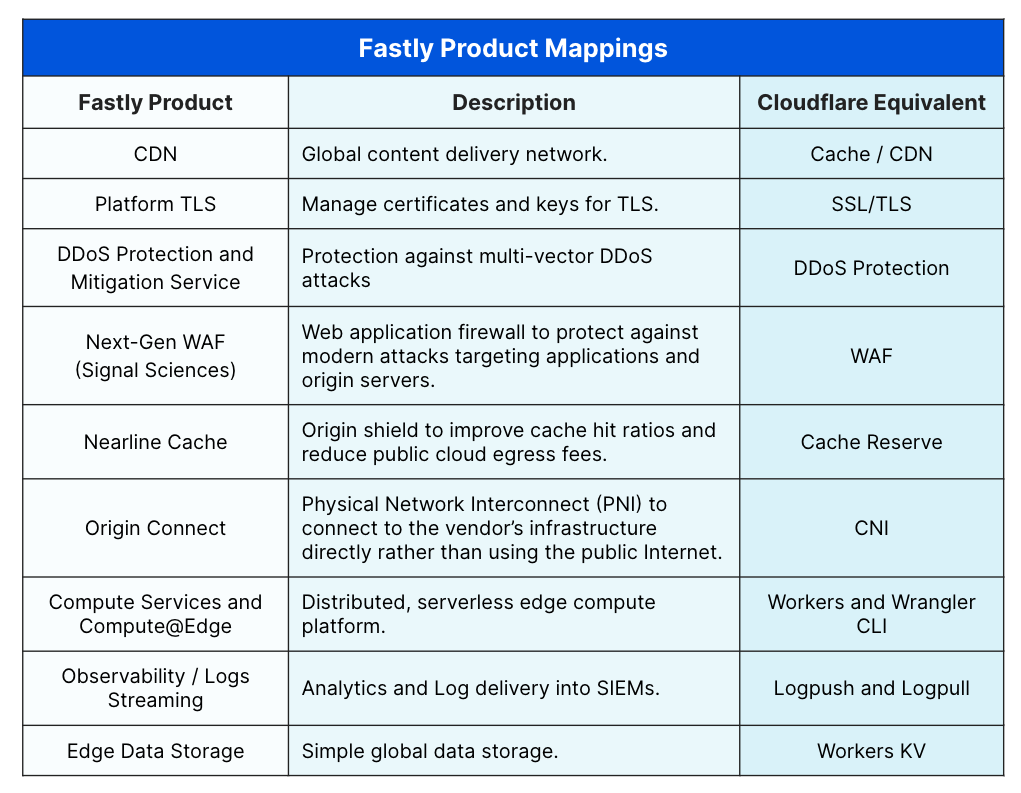
| Descale your network with Cloudflare’s enhanced Descaler Program | The speed at which customers are able to move from Zscaler ZIA to Cloudflare Gateway continually gets faster. It usually takes more time to set up a meeting with the right technical administrators than to migrate settings, configurations, lists, policies and more to Cloudflare. |
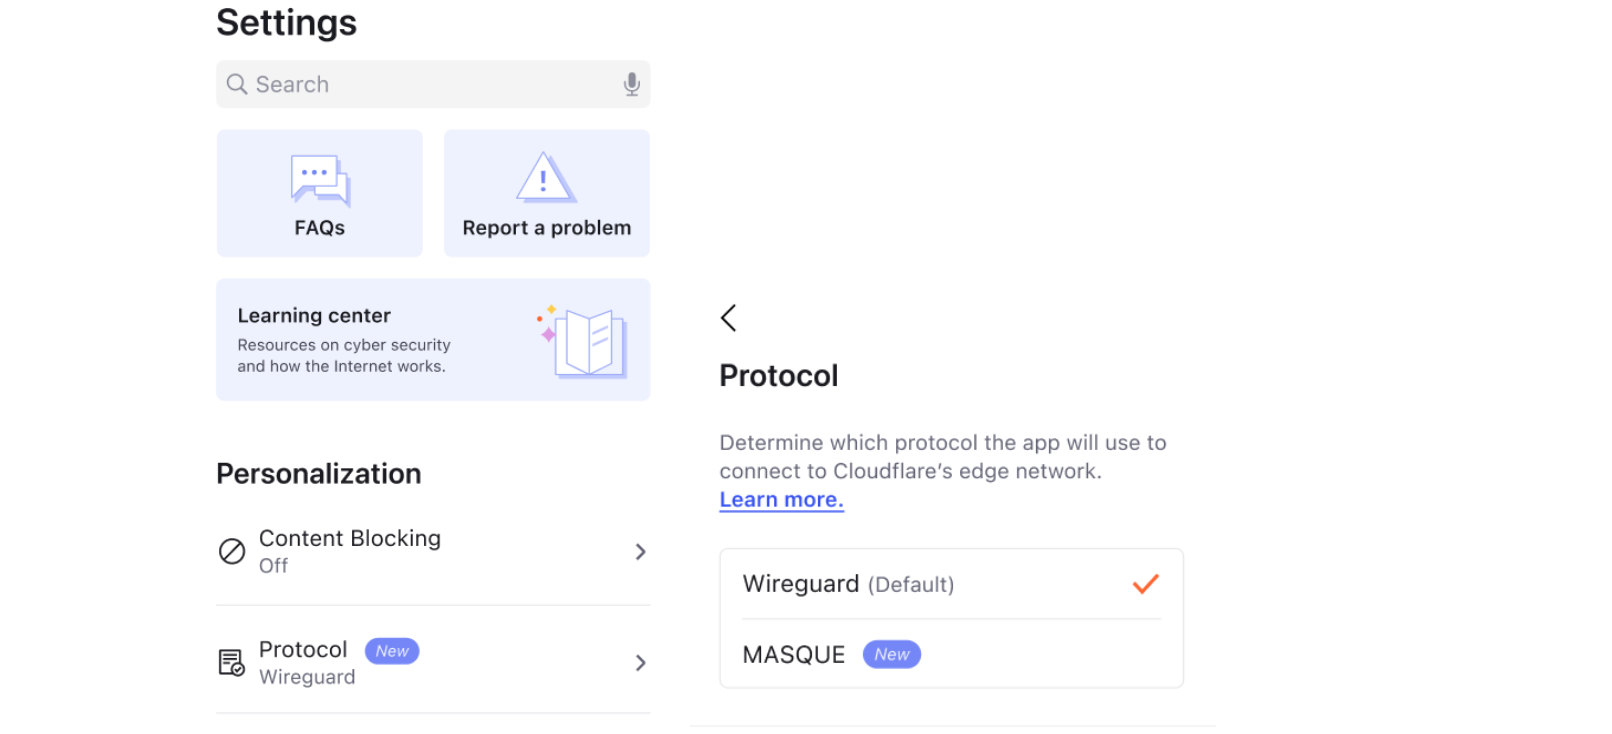
| Donning a MASQUE: building a new protocol into Cloudflare WARP | Announcing support for MASQUE, a cutting-edge new protocol for the beta version of our consumer WARP iOS app. |
| How we think about Zero Trust Performance | There are many ways to view network performance. However, at Cloudflare we believe the best way to measure performance is to use end-to-end HTTP response measurements. In this blog, we’re going to talk about why end-to-end performance is the most important thing to look at, why other methods like proxy latency and decrypted latency SLAs are insufficient for performance evaluations, and how you can measure your Zero Trust performance like we do. |
Measuring what matters
| Announcement | Summary |
|---|---|
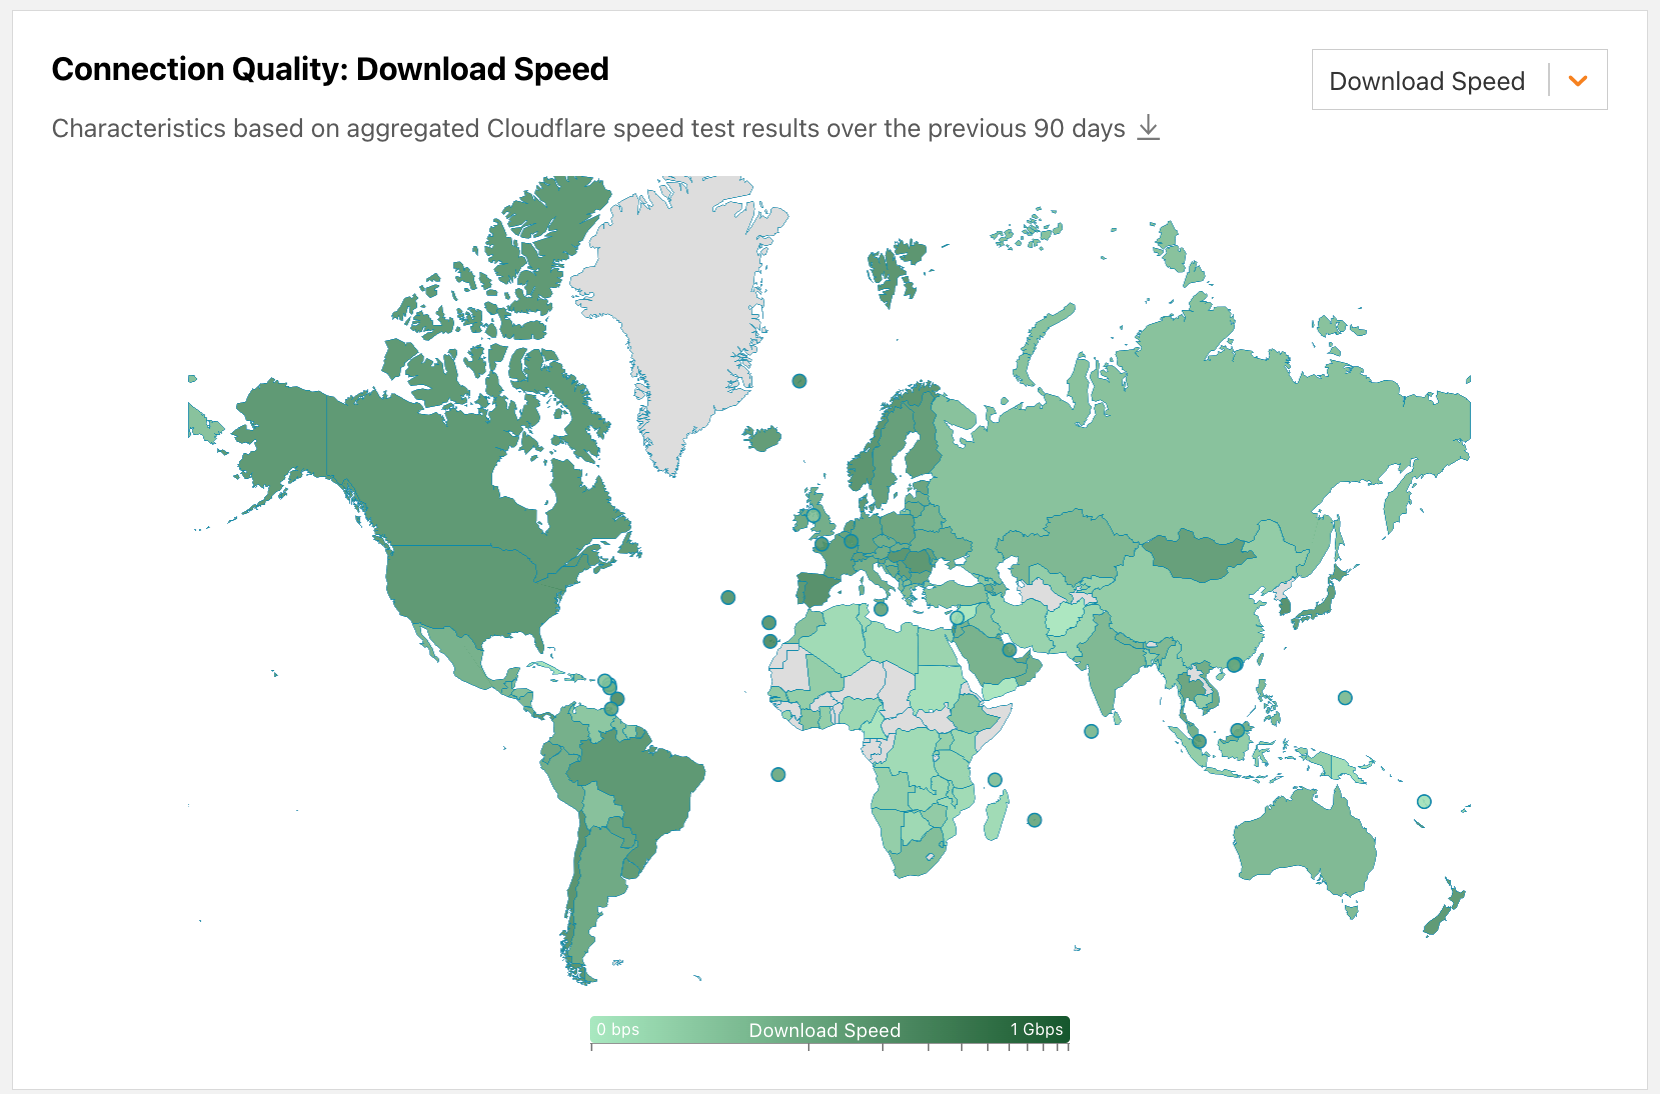
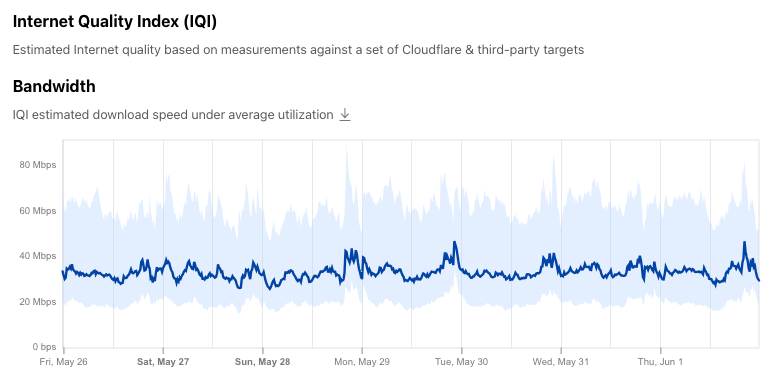
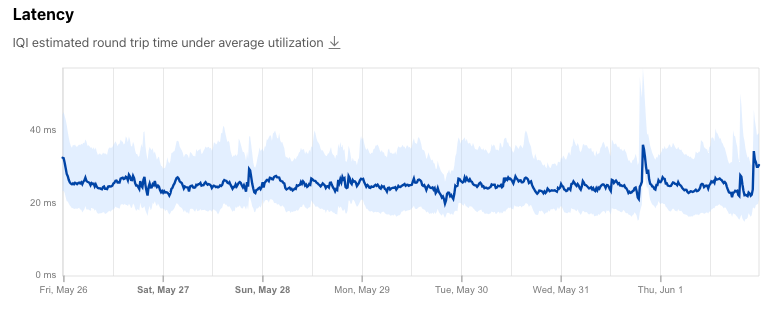
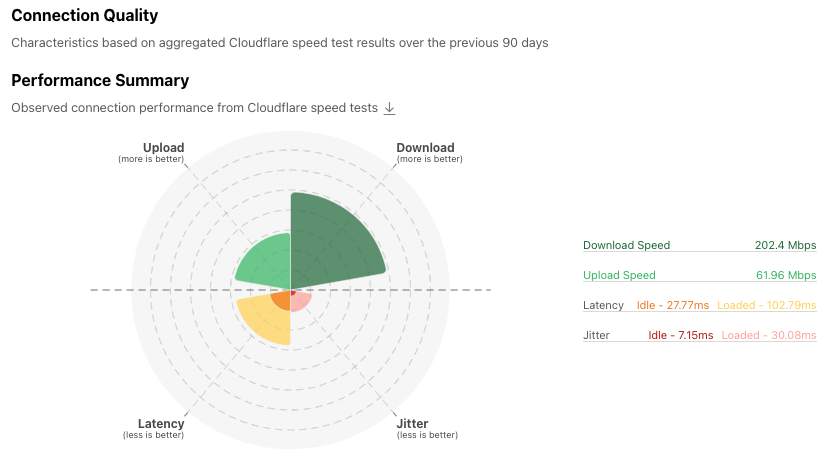
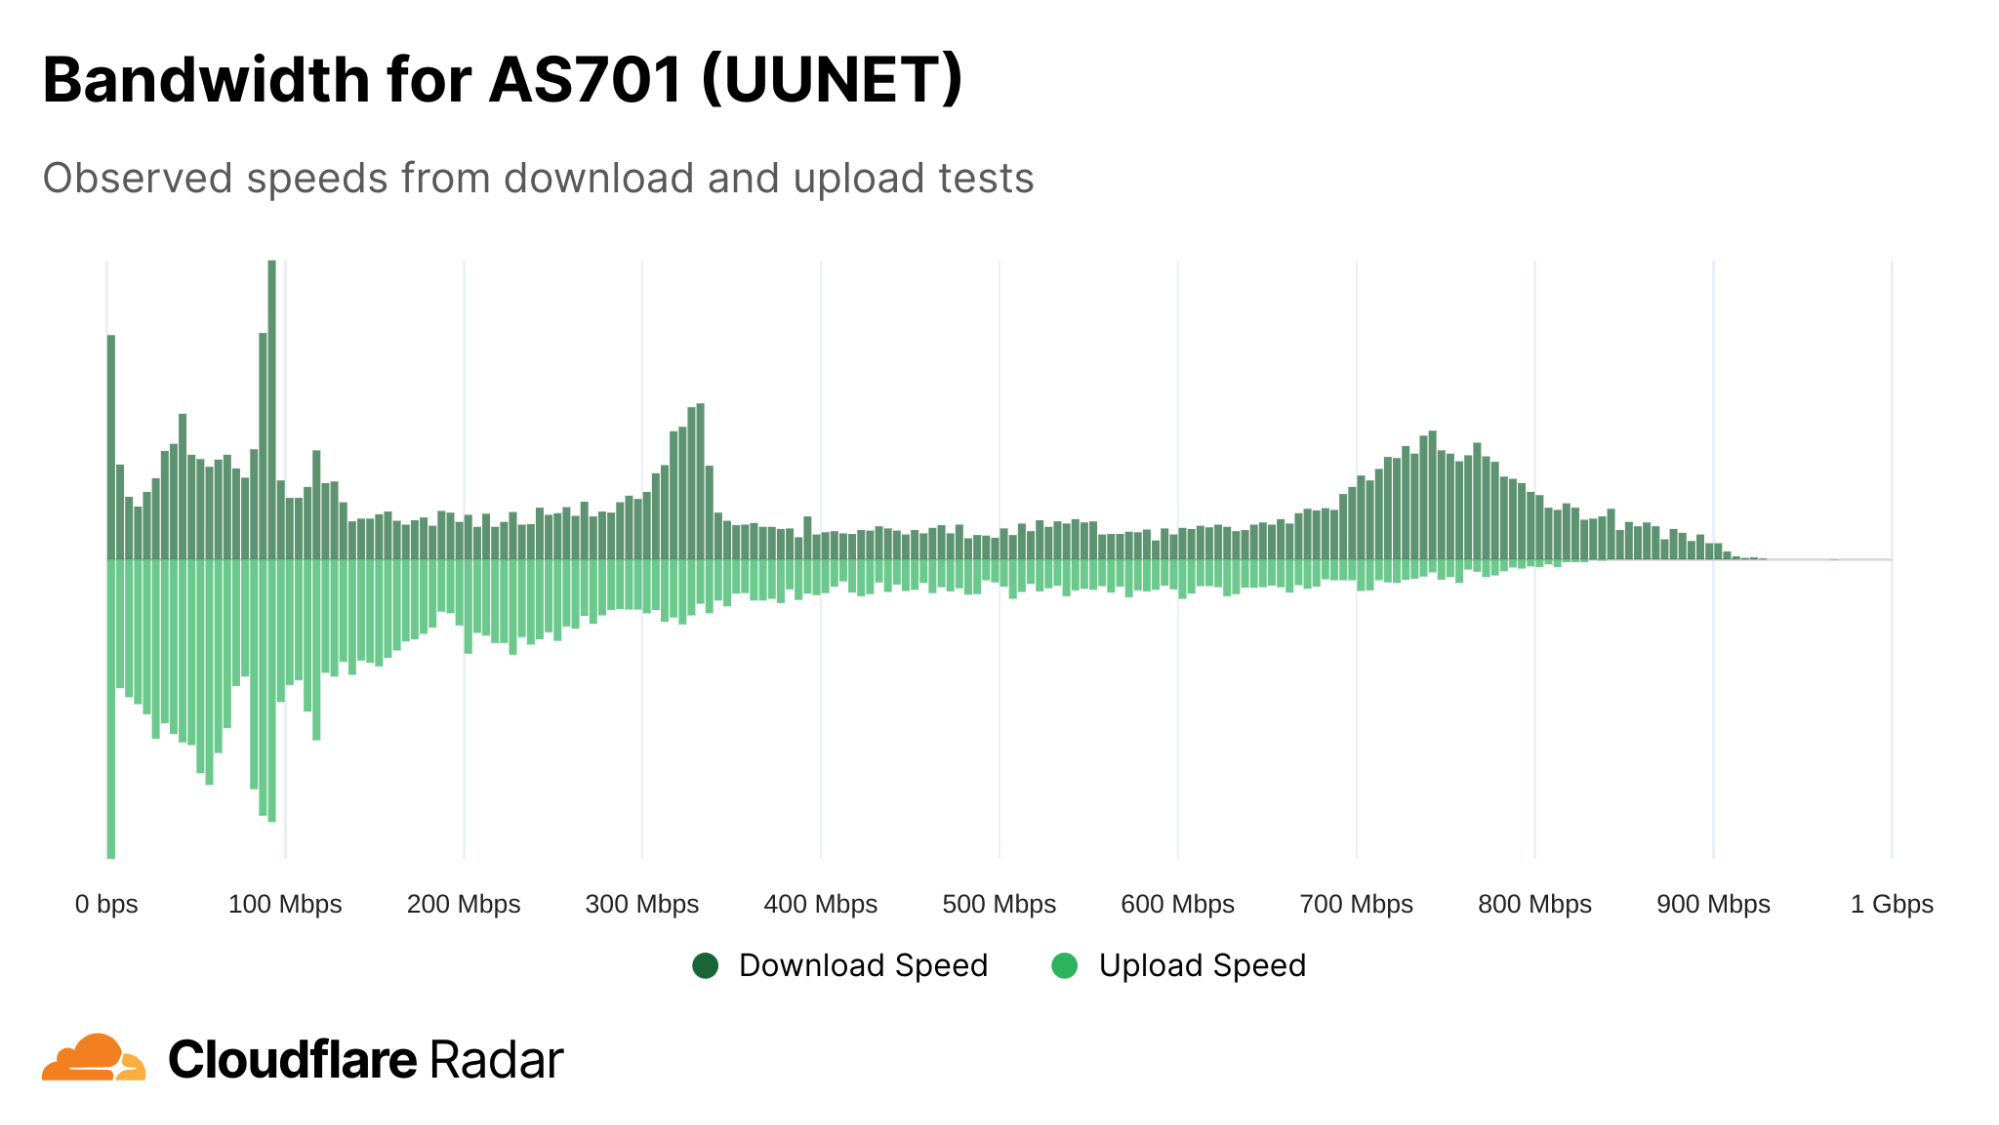
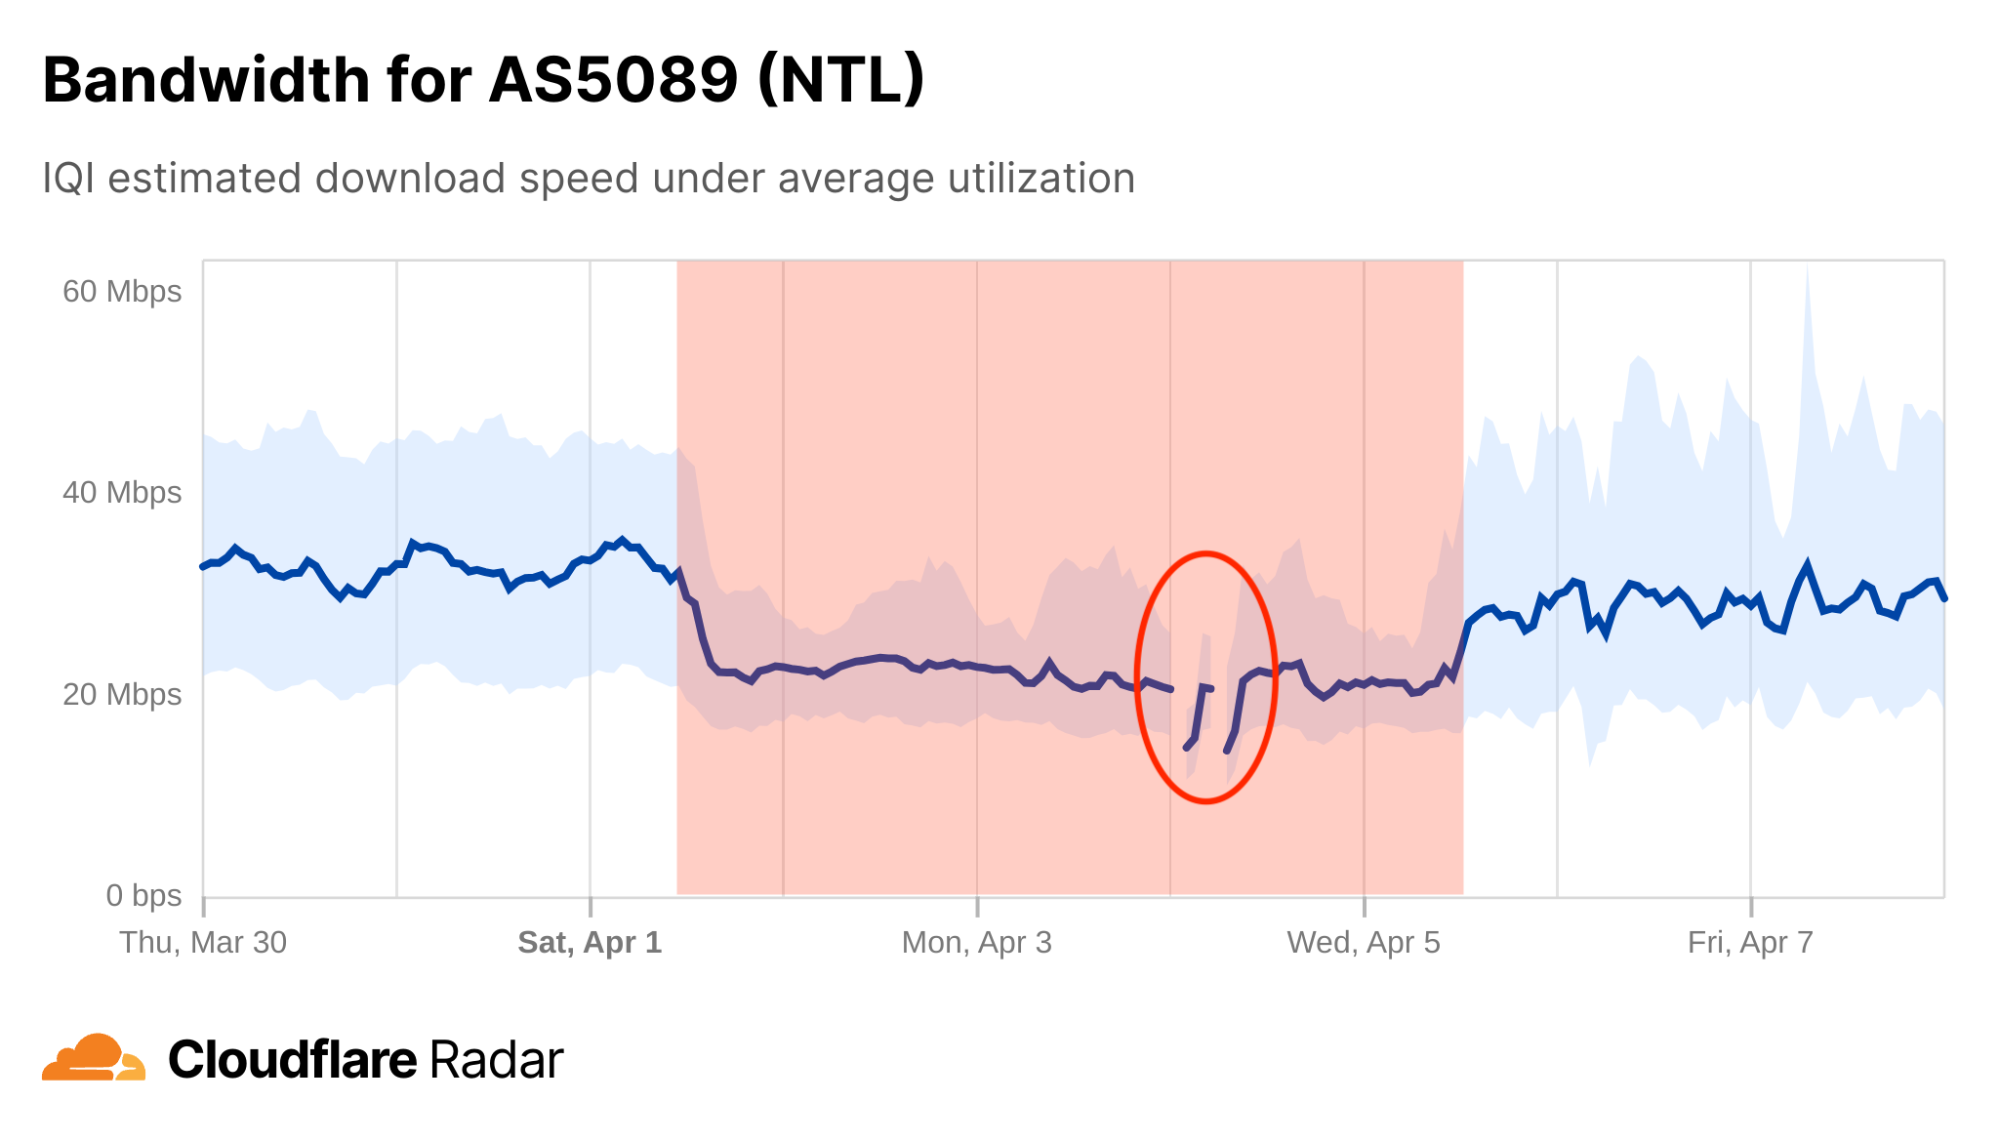
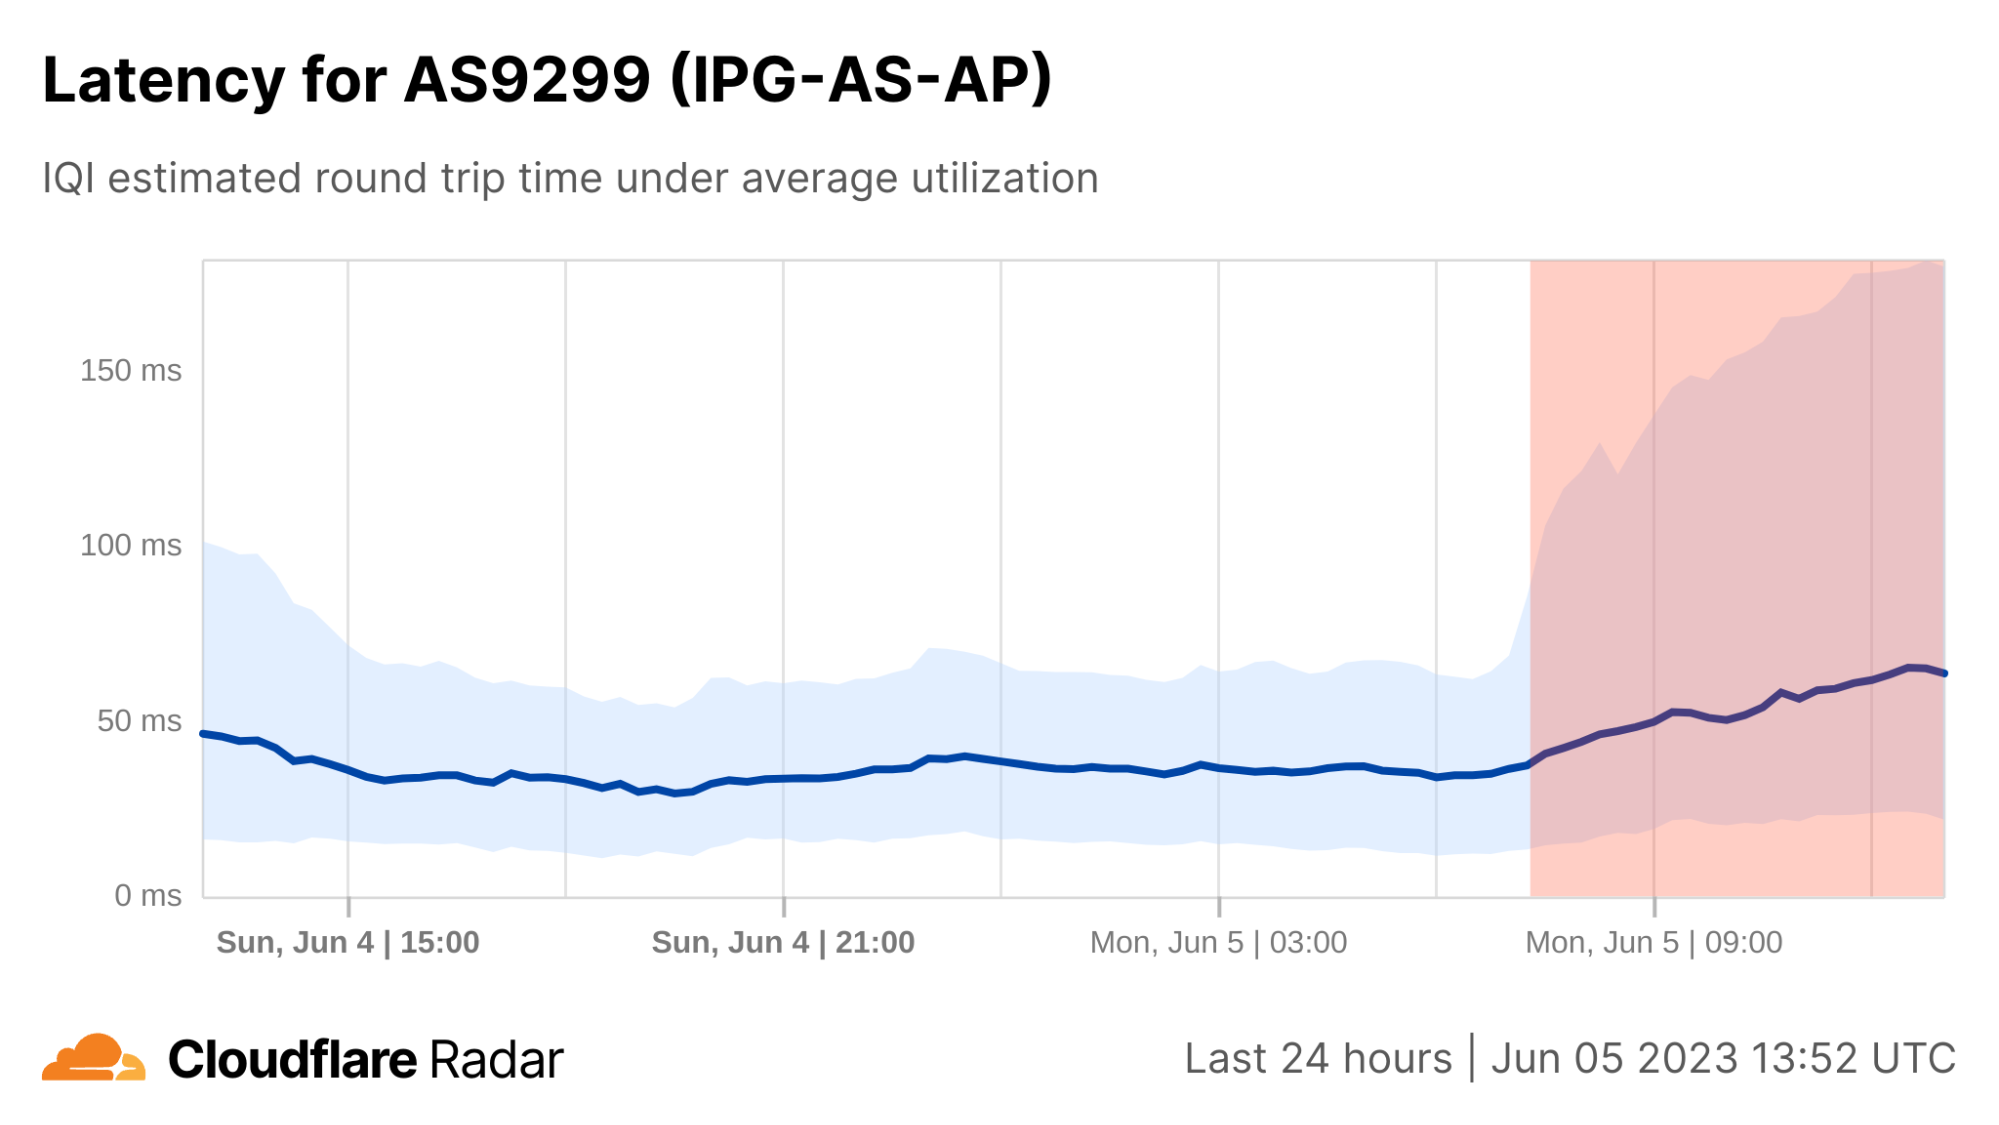
| Introducing the Cloudflare Radar Internet Quality Page | The new Internet Quality page on Cloudflare Radar provides both country and network (autonomous system) level insight into Internet connection performance (bandwidth) and quality (latency, jitter) over time based on benchmark test data as well as speed.cloudflare.com test results. |
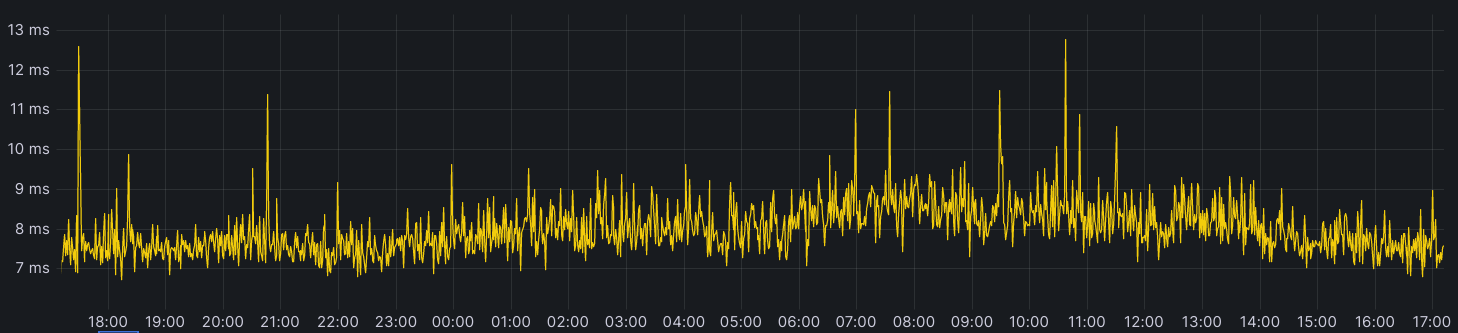
| Network performance update: Speed Week 2023 | A blog post that shares the most recent network performance updates, and tells you about our tools and processes that we use to monitor and improve our network performance. |
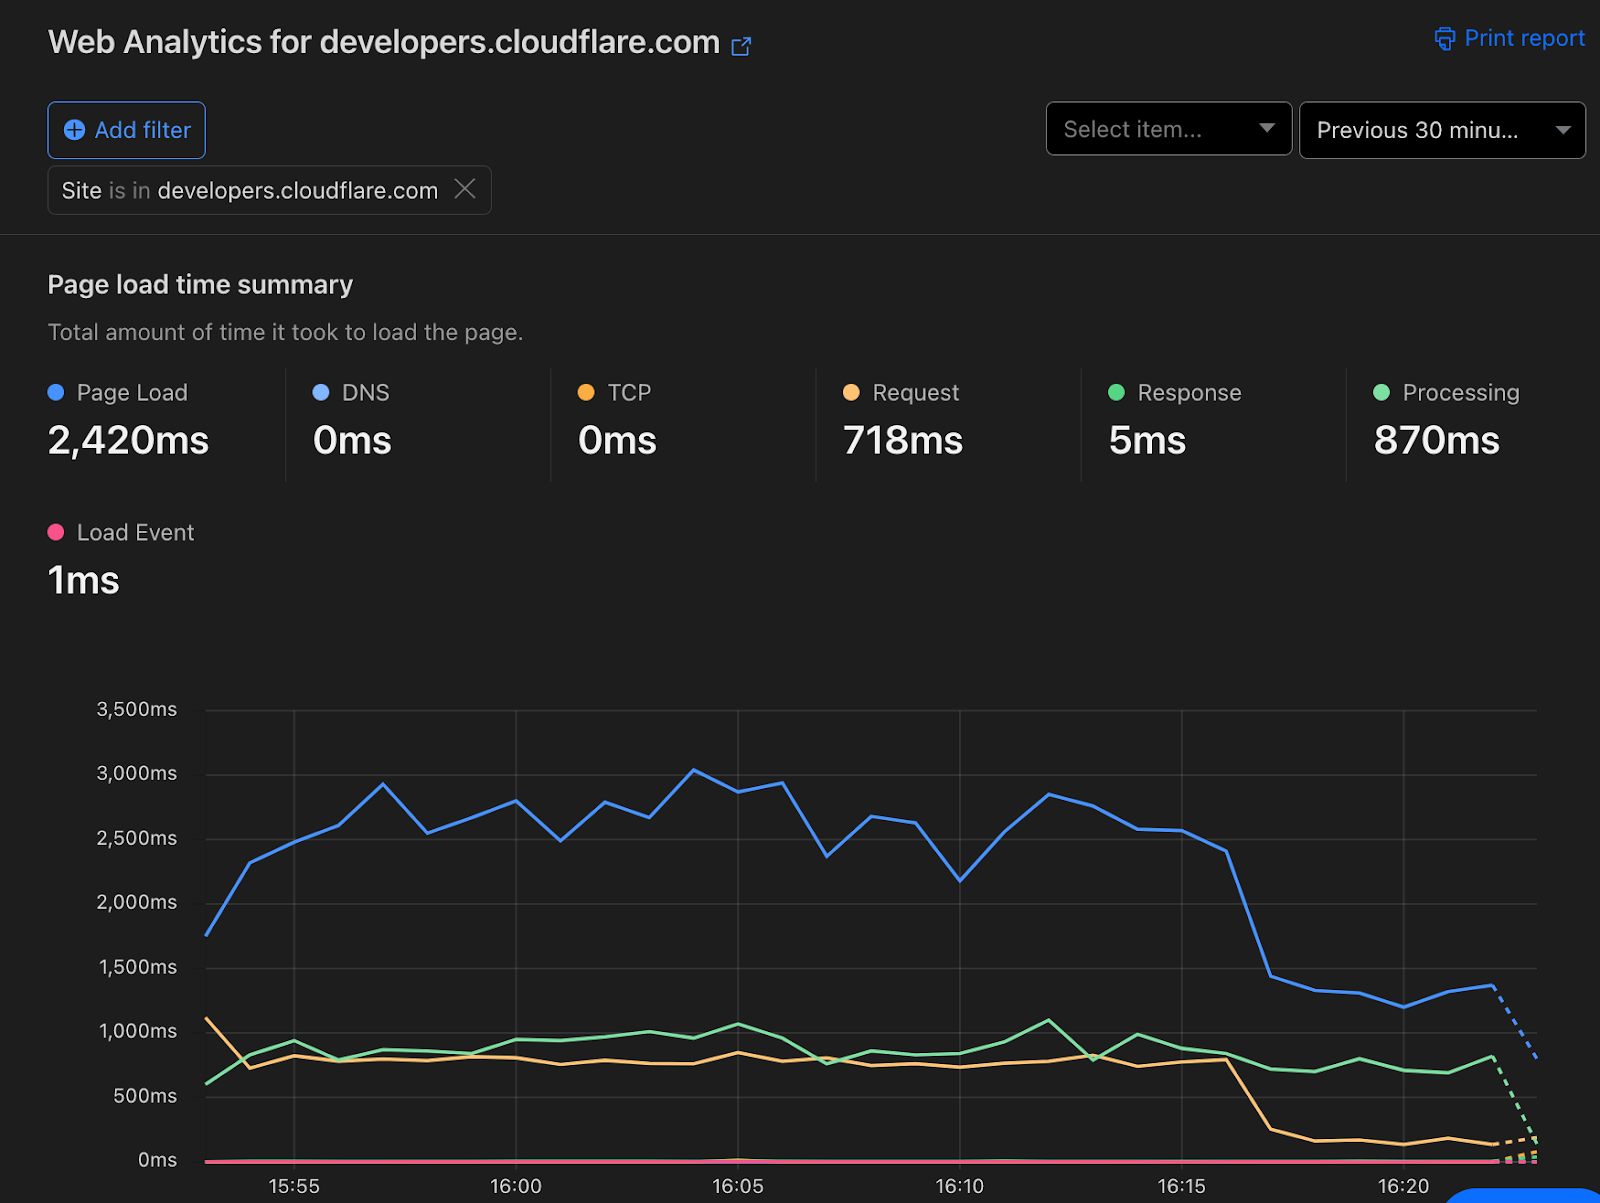
| Introducing Timing Insights: new performance metrics via our GraphQL API | If you care about the performance of your website or APIs, it’s critical to understand why things are slow. We're introducing new analytics tools to help you understand what is contributing to "Time to First Byte" (TTFB) of Cloudflare and your origin. But wait – maybe you've heard that you should stop worrying about TTFB? Isn't Cloudflare moving away from TTFB as a metric? Read on to understand why there are still situations where TTFB matters. |
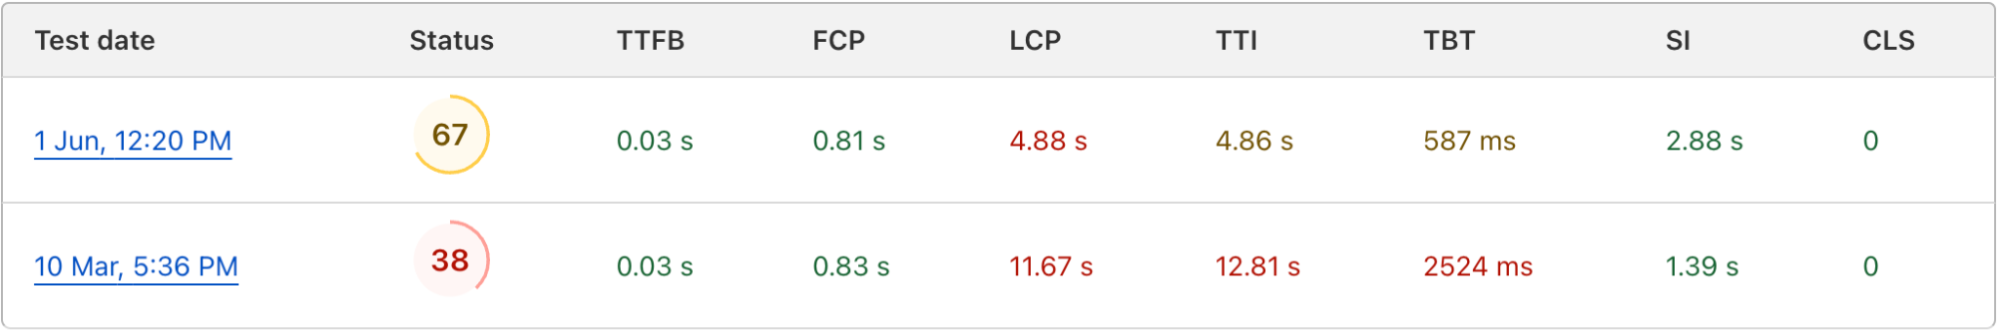
| Are you measuring what matters? A fresh look at Time To First Byte | Time To First Byte (TTFB) is not a good way to measure your websites performance. In this blog we’ll cover what TTFB is a good indicator of, what it's not great for, and what you should be using instead. |
| INP. Get ready for the new Core Web Vital | On May 10, 2023, Google announced that INP will replace FID in the Core Web Vitals in March 2024. The Core Web Vitals play a role in the Google Search algorithm. Website owners who care about Search Engine Optimization (SEO) should prepare for the change. In this post we outline what INP is, and how you can prepare. |
Speed made simple
| Announcement | Summary |
|---|---|
| Faster website, more customers: Cloudflare Observatory can help your business grow | Cloudflare users can now easily monitor website performance using Real User Monitoring (RUM) data along with scheduled tests from different regions in a single dashboard. This will identify any performance issues your website may have. Once we’ve identified any issues, Observatory will highlight customized recommendations to resolve these issues, all with a single click. |
| Smart Hints make code-free performance simple | We’re excited to announce we’re making Early Hints and Fetch Priorities automatic using the power of Cloudflare’s network. |
| Introducing HTTP/3 Prioritization | Announcing full support for HTTP/3 Extensible Priorities, a new standard that speeds the loading of webpages by up to 37%. |
| Argo Smart Routing for UDP: speeding up gaming, real-time communications and more | Announcing we’re bringing traffic acceleration to customer’s UDP traffic. Now, users can improve the latency of UDP-based applications like video games, voice calls, and video meetings by up to 17%. |
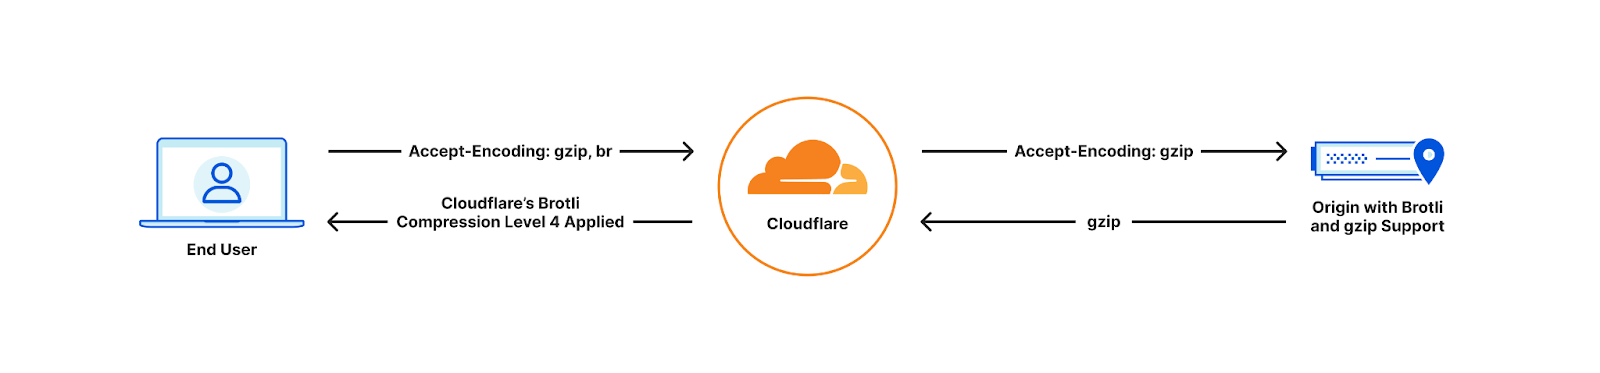
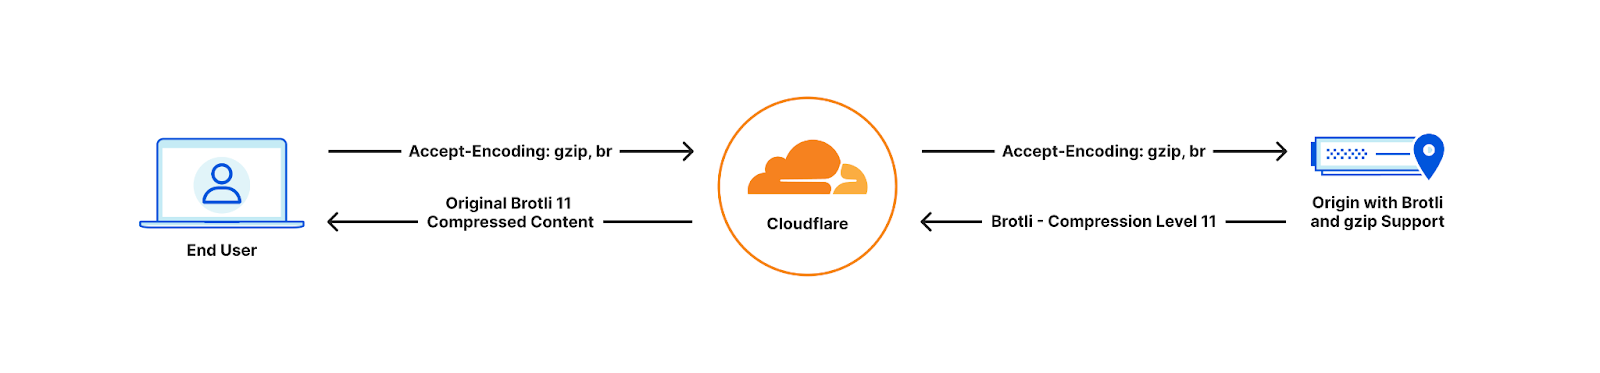
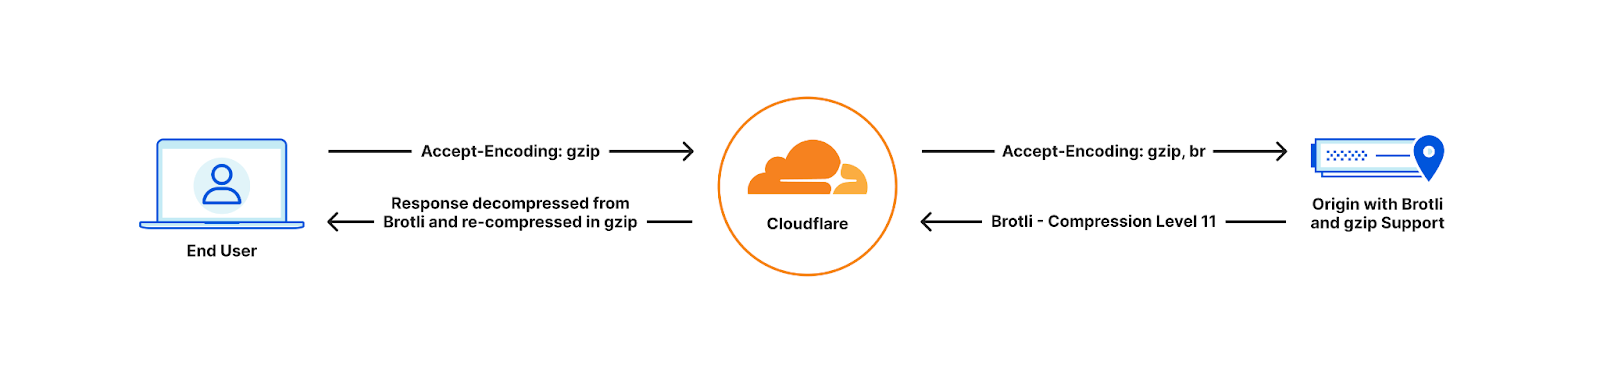
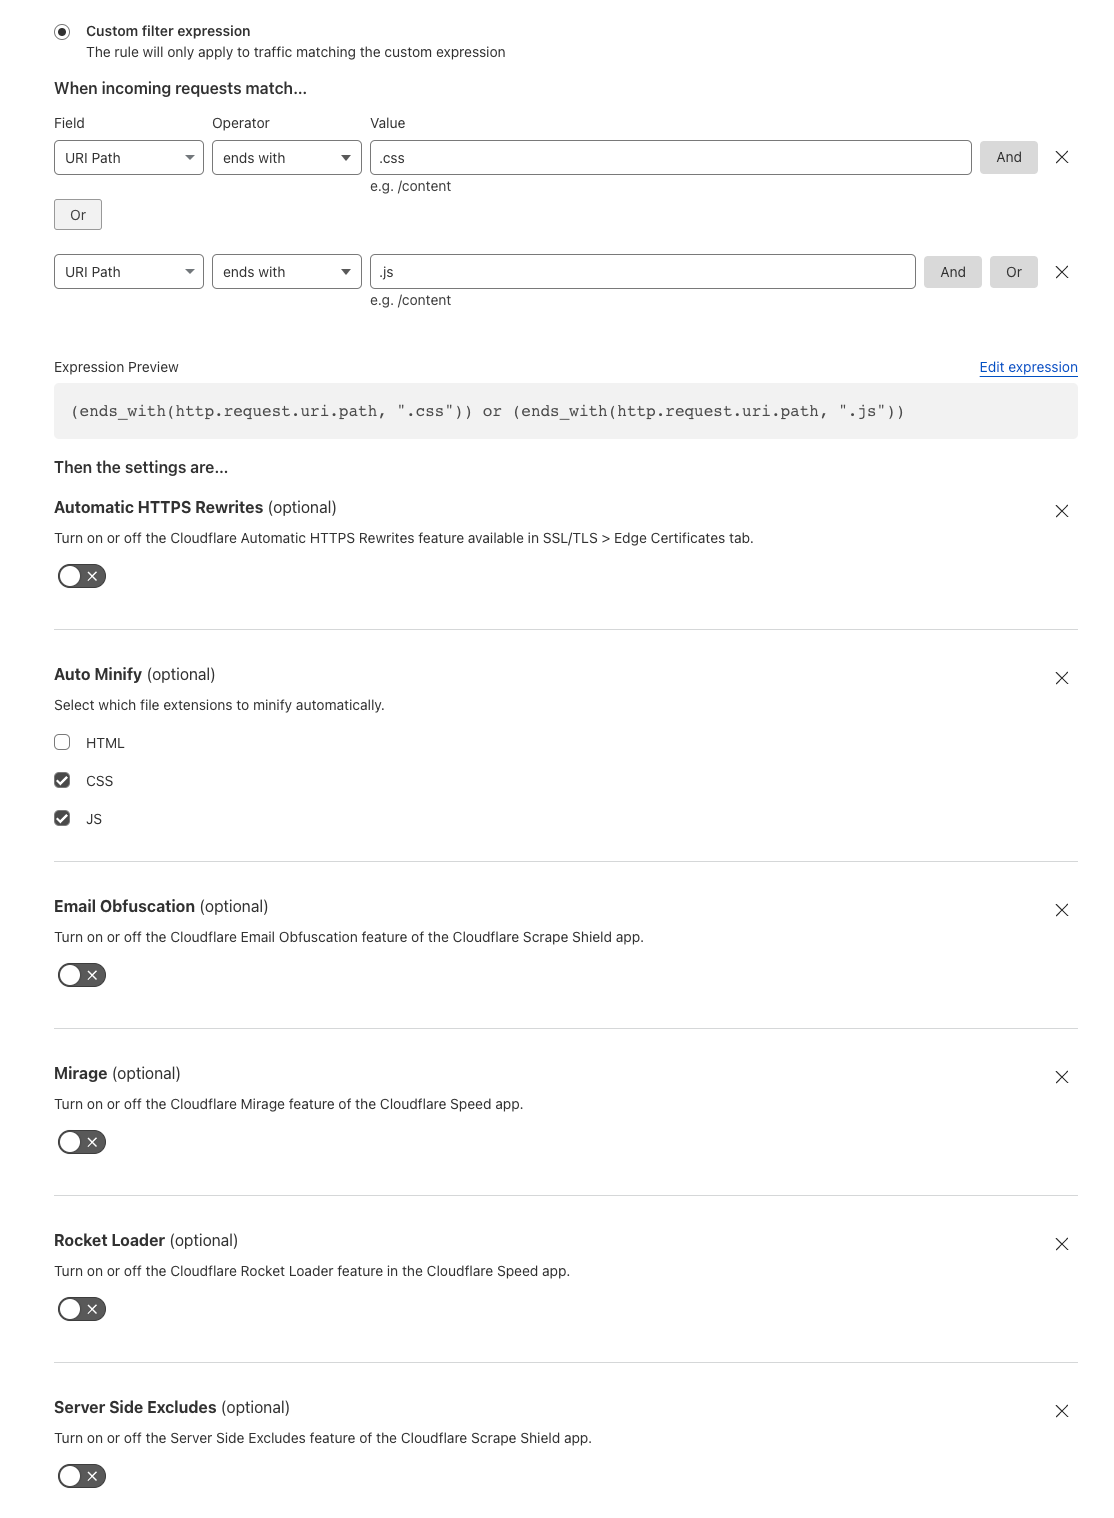
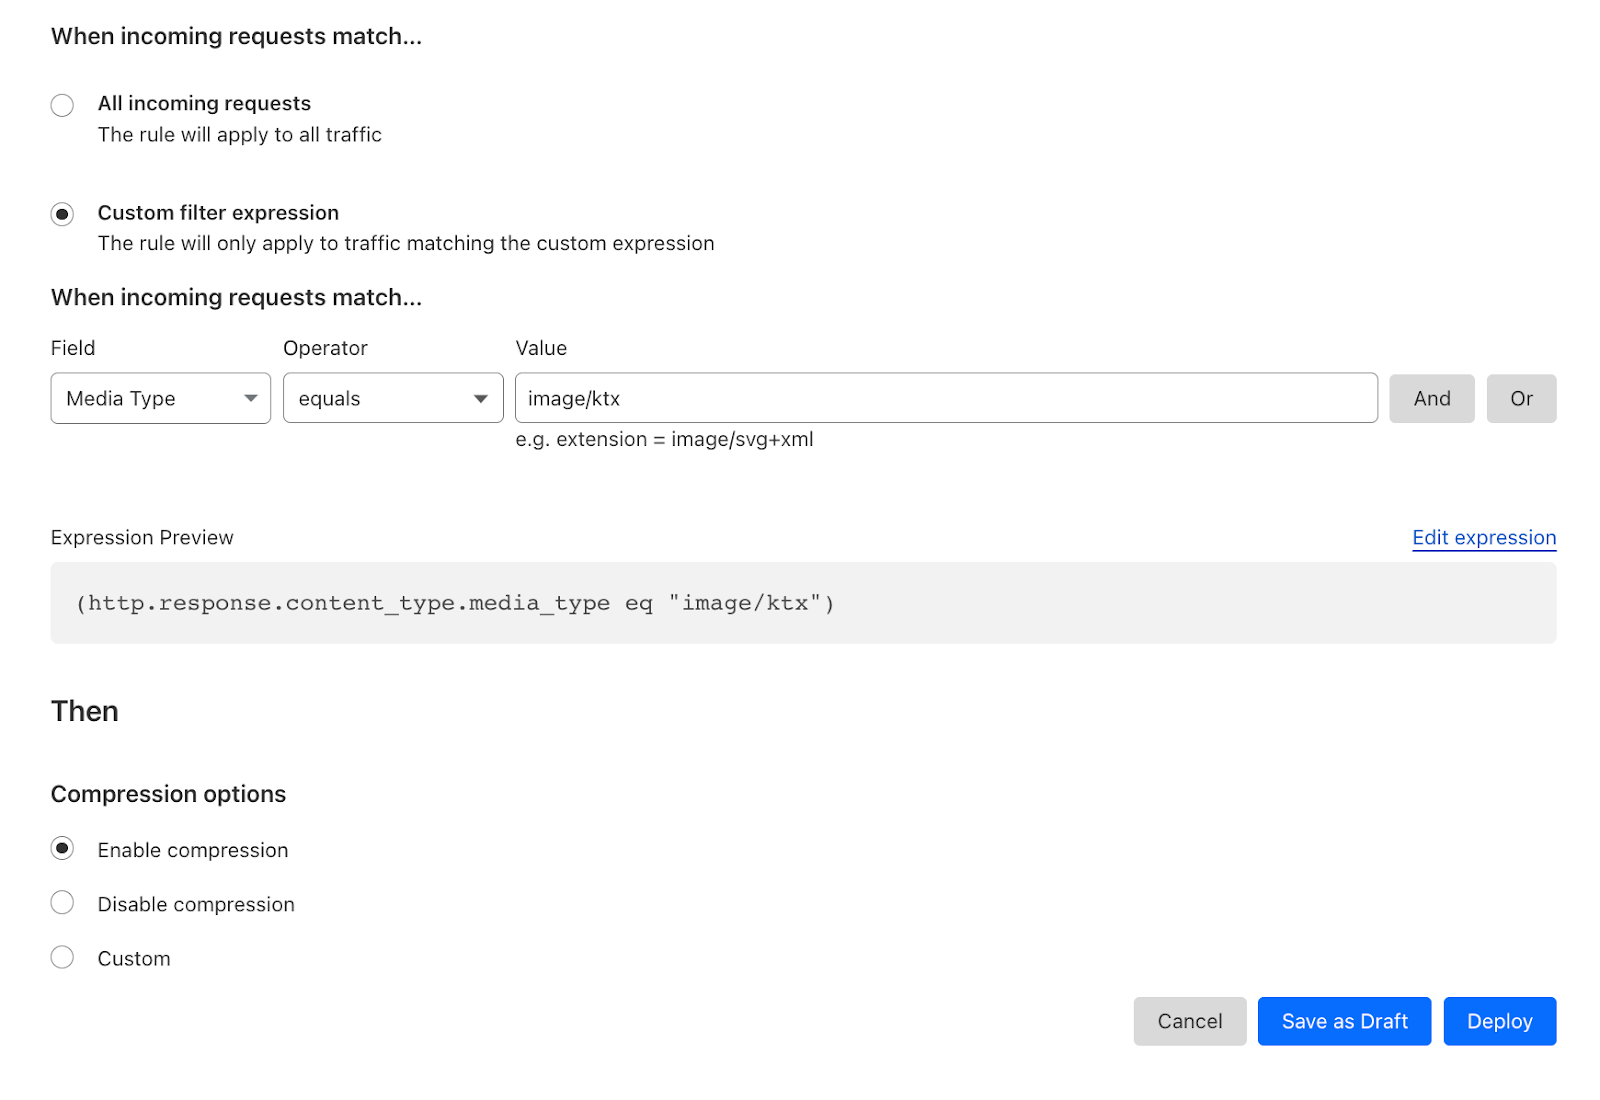
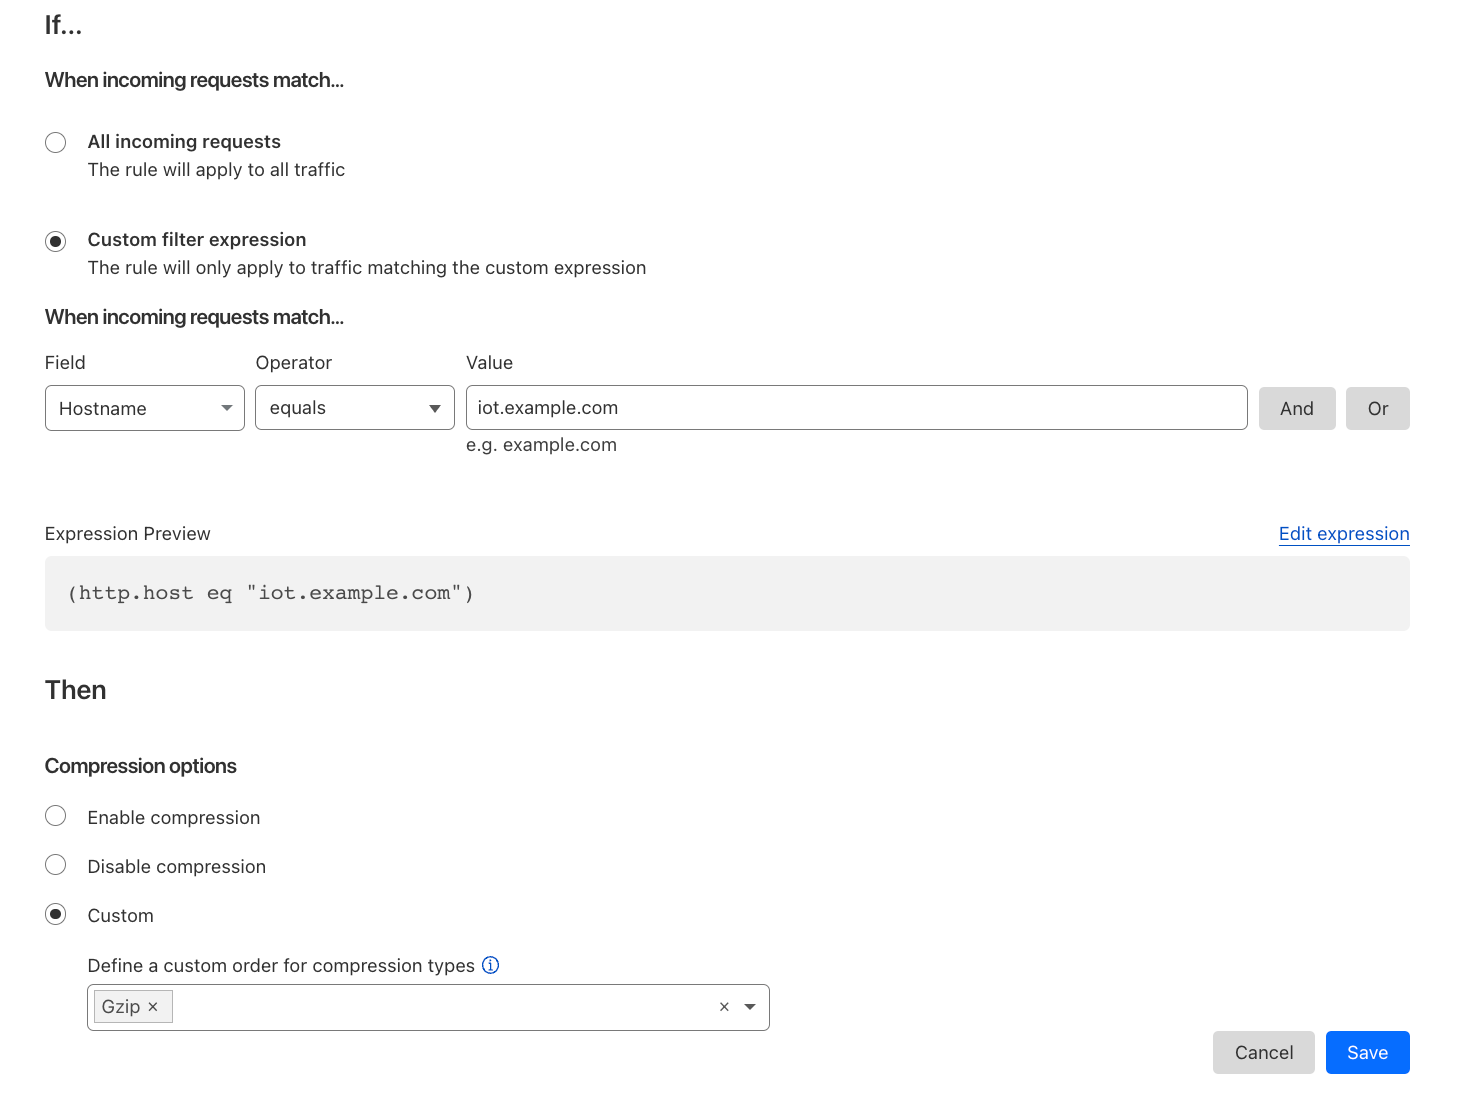
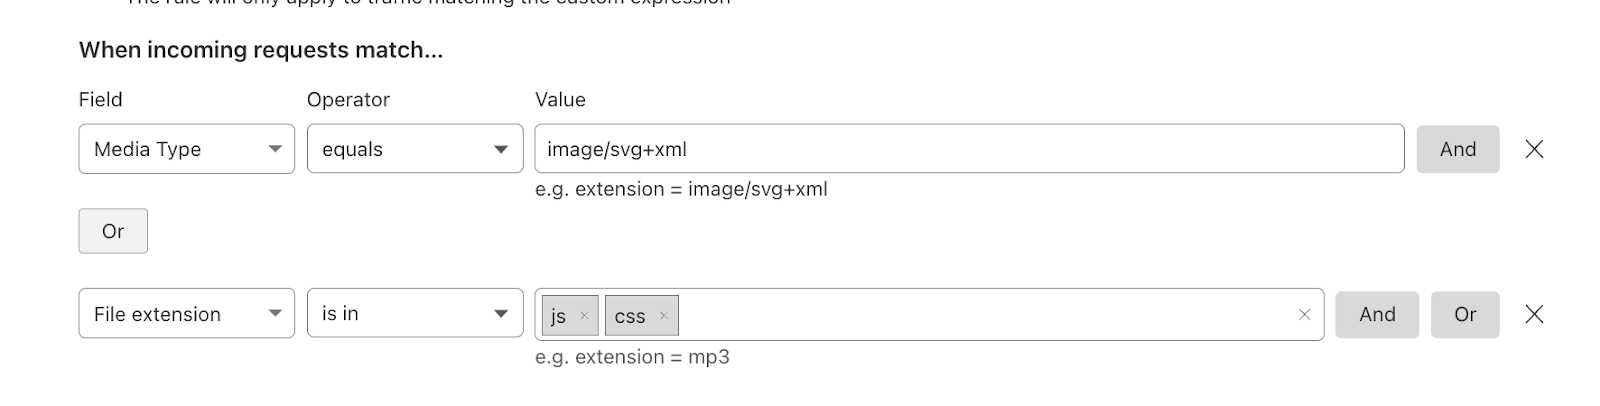
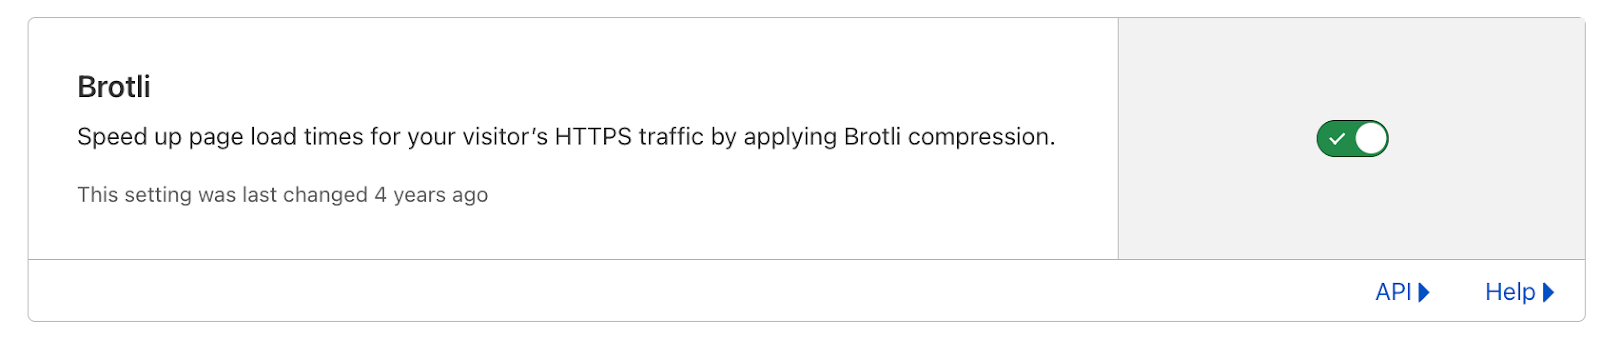
| All the way up to 11: Serve Brotli from origin and Introducing Compression Rules | Enhancing our support for Brotli compression, enabling end-to-end Brotli compression for web content. Compression plays a vital role in reducing bytes during transfers, ensuring quicker downloads and seamless browsing. |
| How to use Cloudflare Observatory for performance experiments | Introducing Cloudflare's Performance Experiments in Observatory: Safely test code, improve website speed, and minimize risk. |
| Introducing Low-Latency HLS Support for Cloudflare Stream | Broadcast live to websites and applications with less than 10 second latency with Low-Latency HTTP Live Streaming (LL-HLS), now in beta with Cloudflare Stream. |
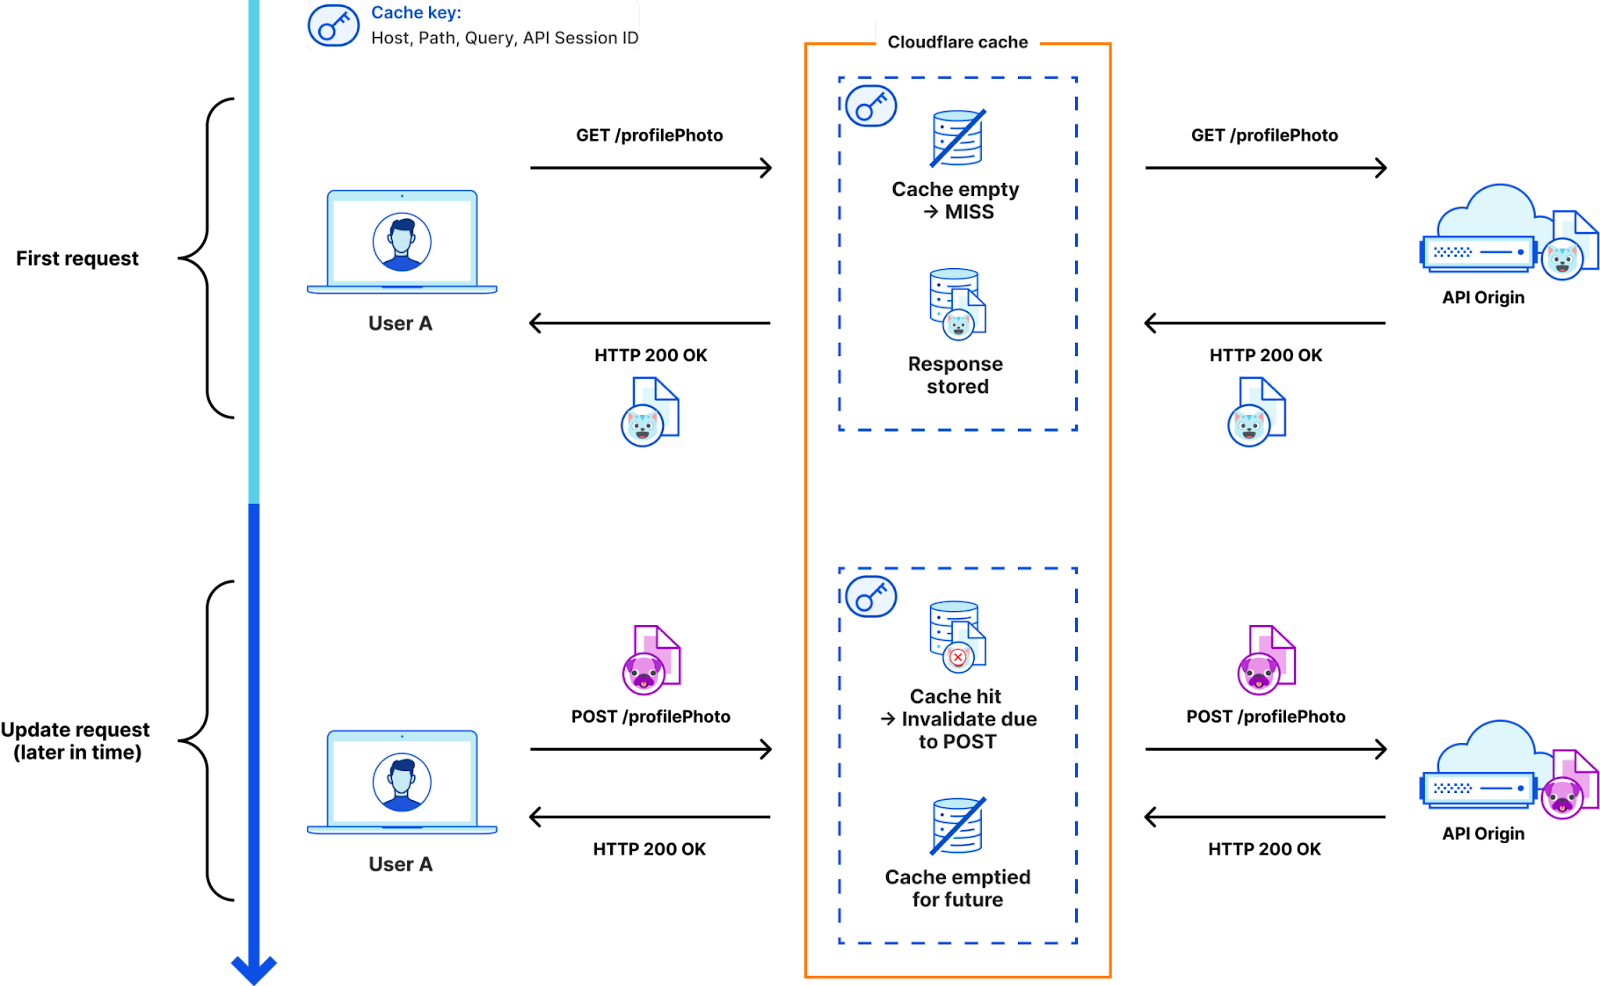
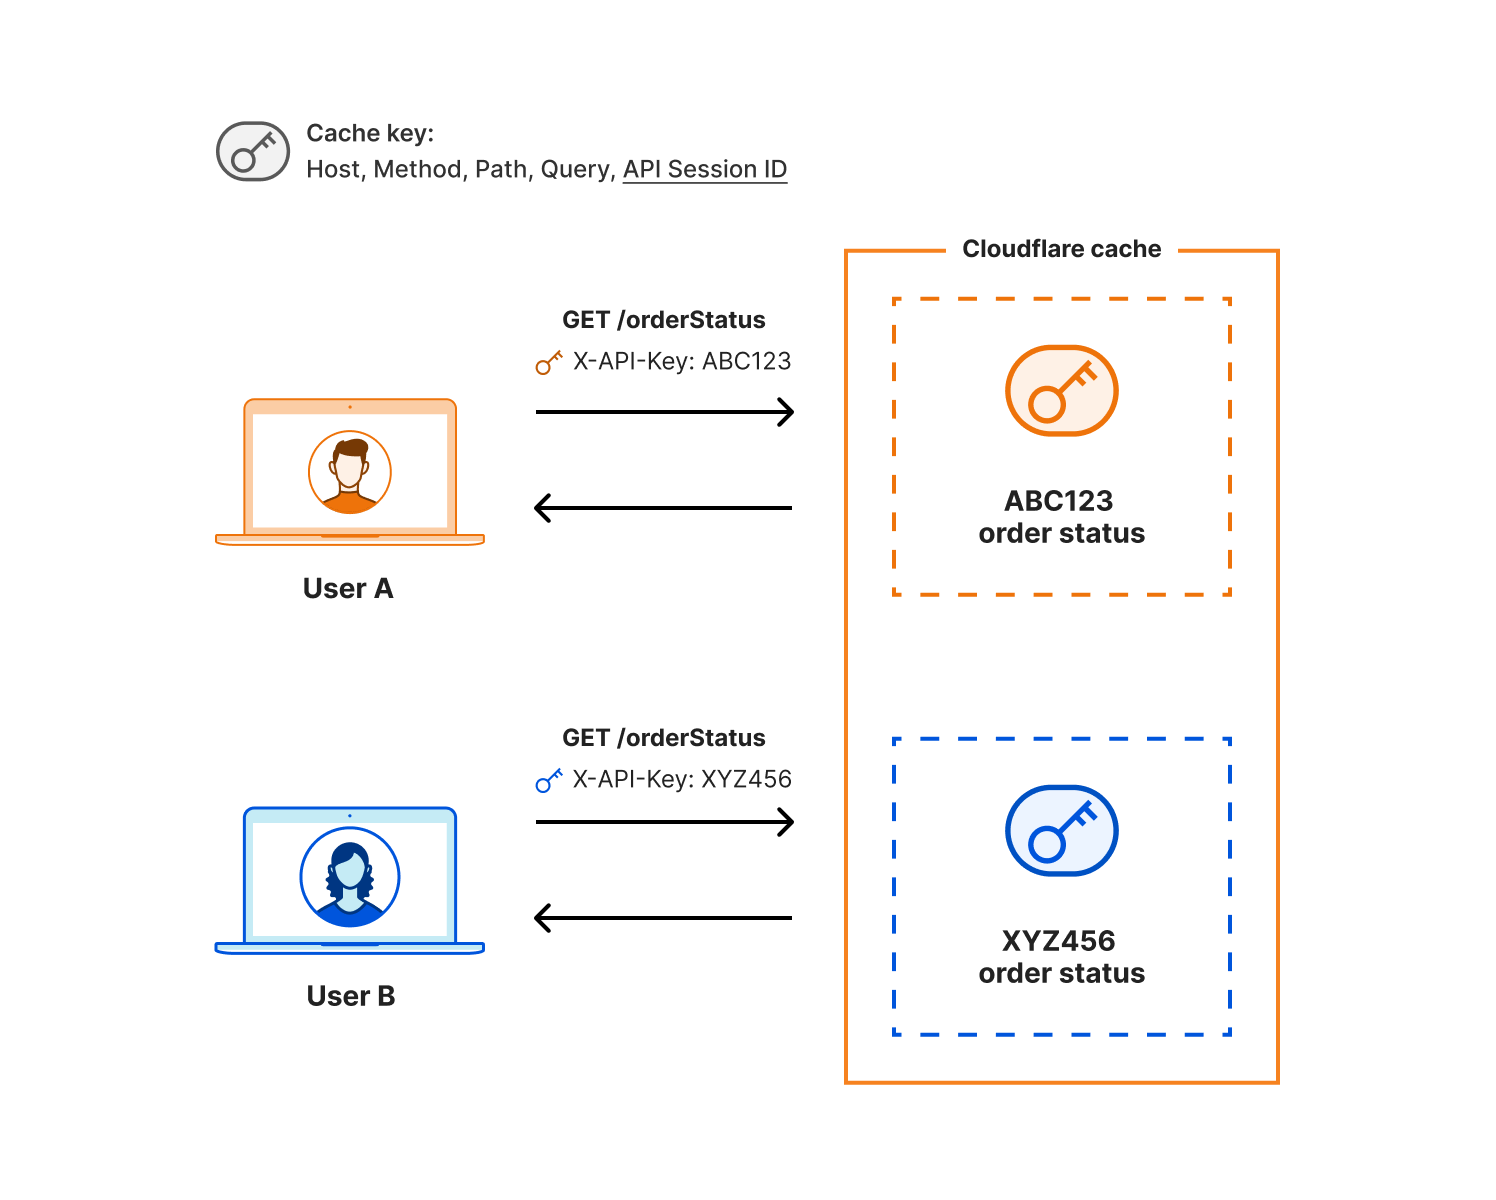
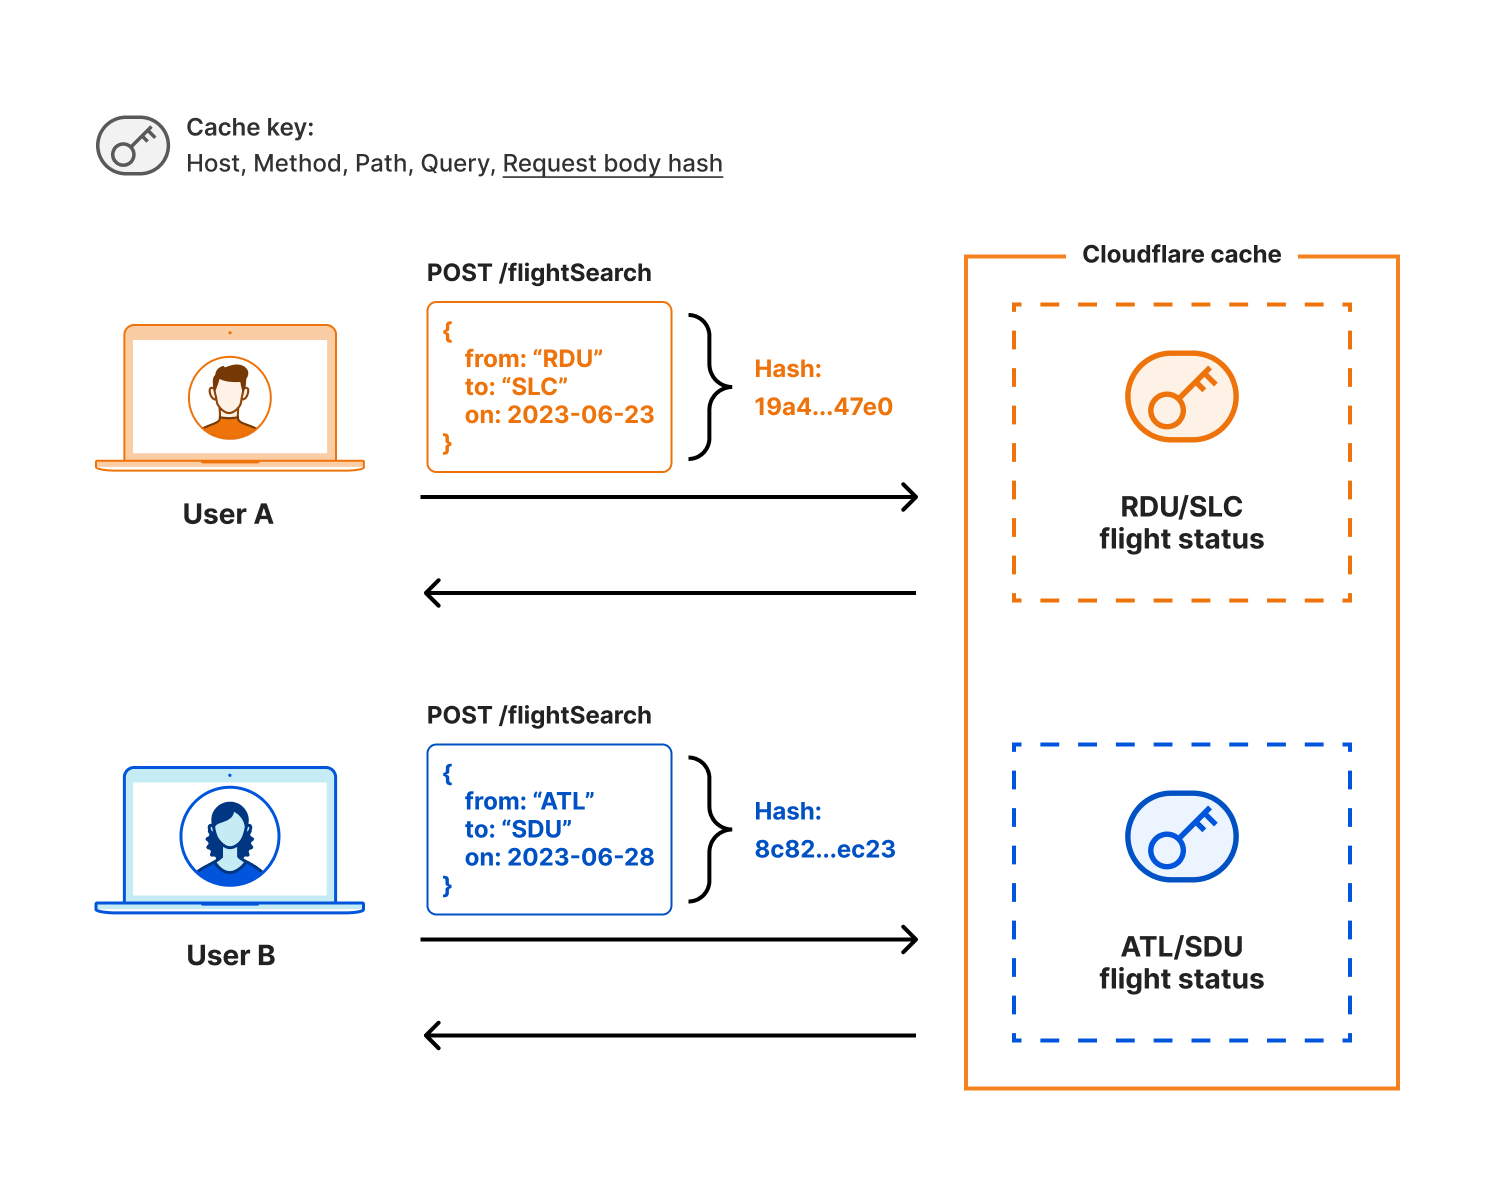
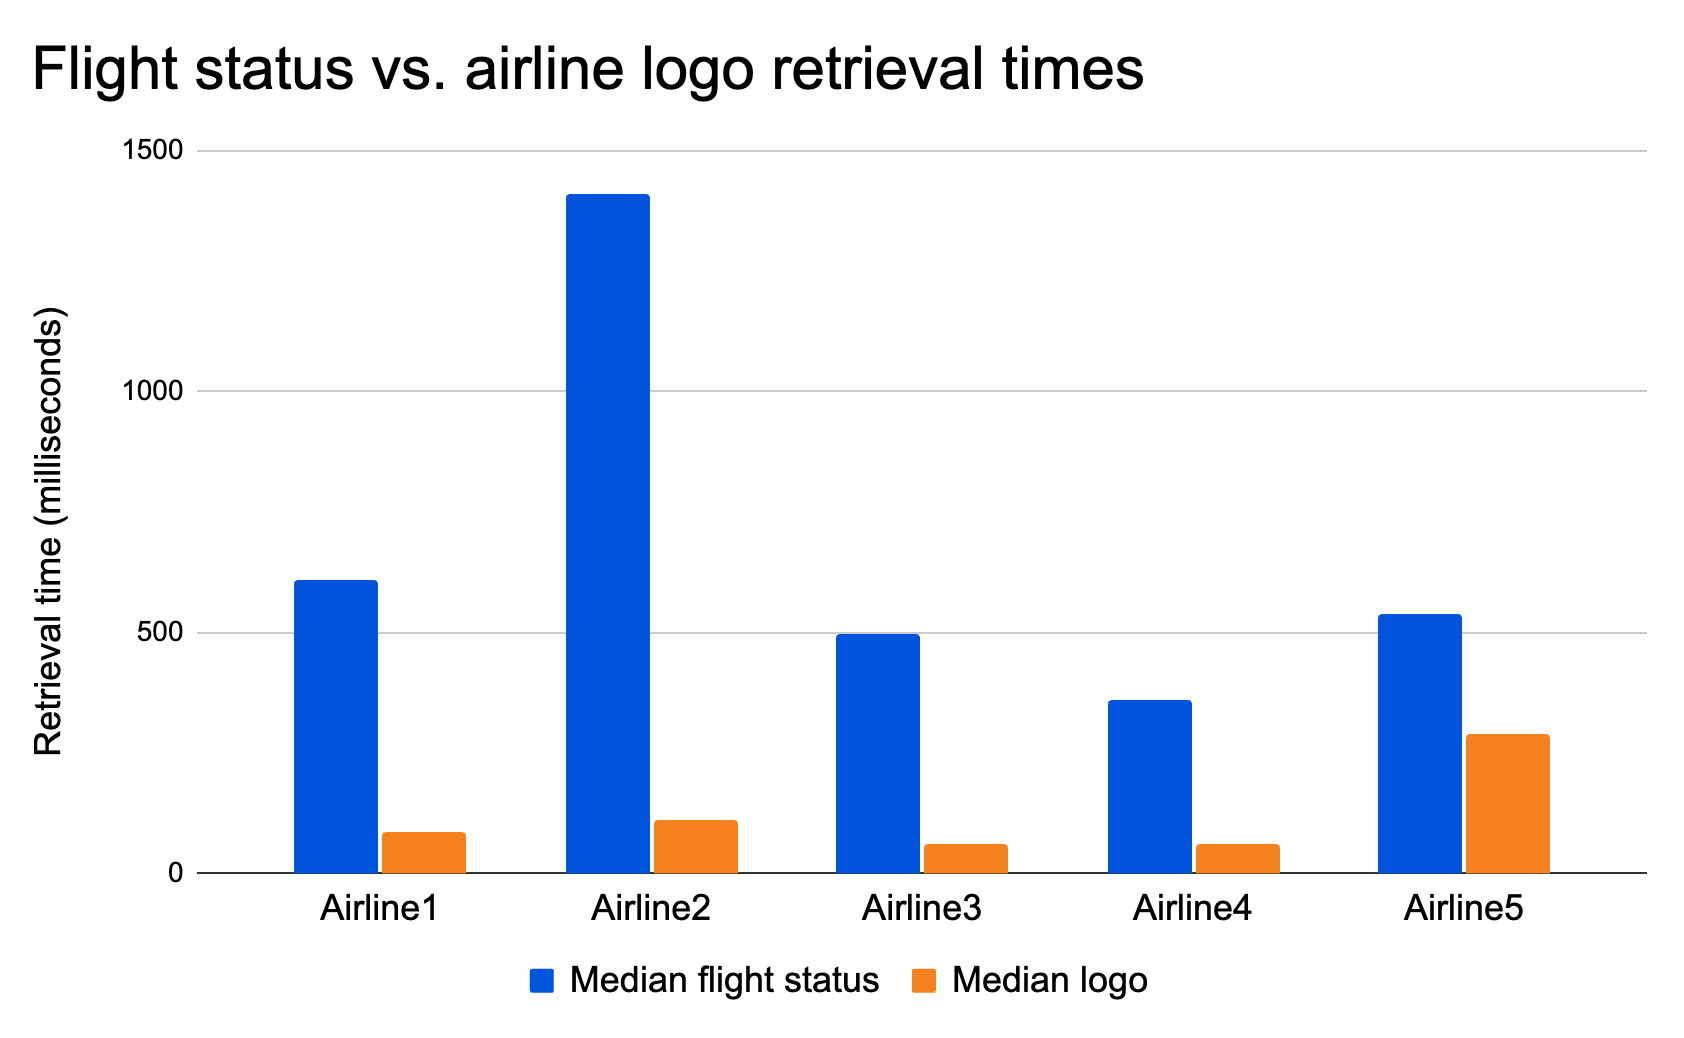
| Speeding up APIs with Ricochet for API Gateway | Announcing Ricochet for API Gateway, the easiest way for Cloudflare customers to achieve faster API responses through automatic, intelligent API response caching. |
But wait, there’s more
| Announcement | Summary |
|---|---|
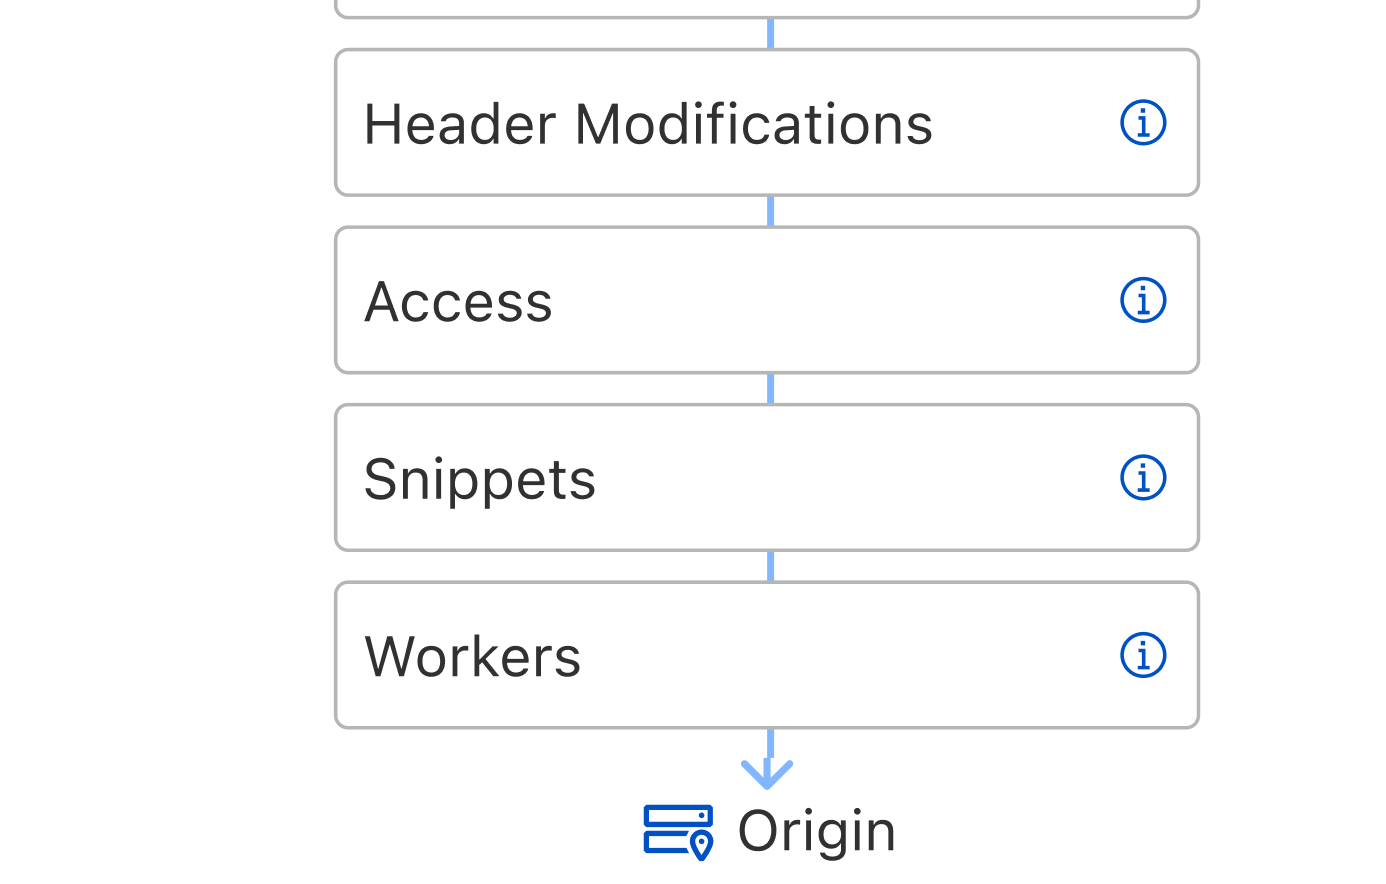
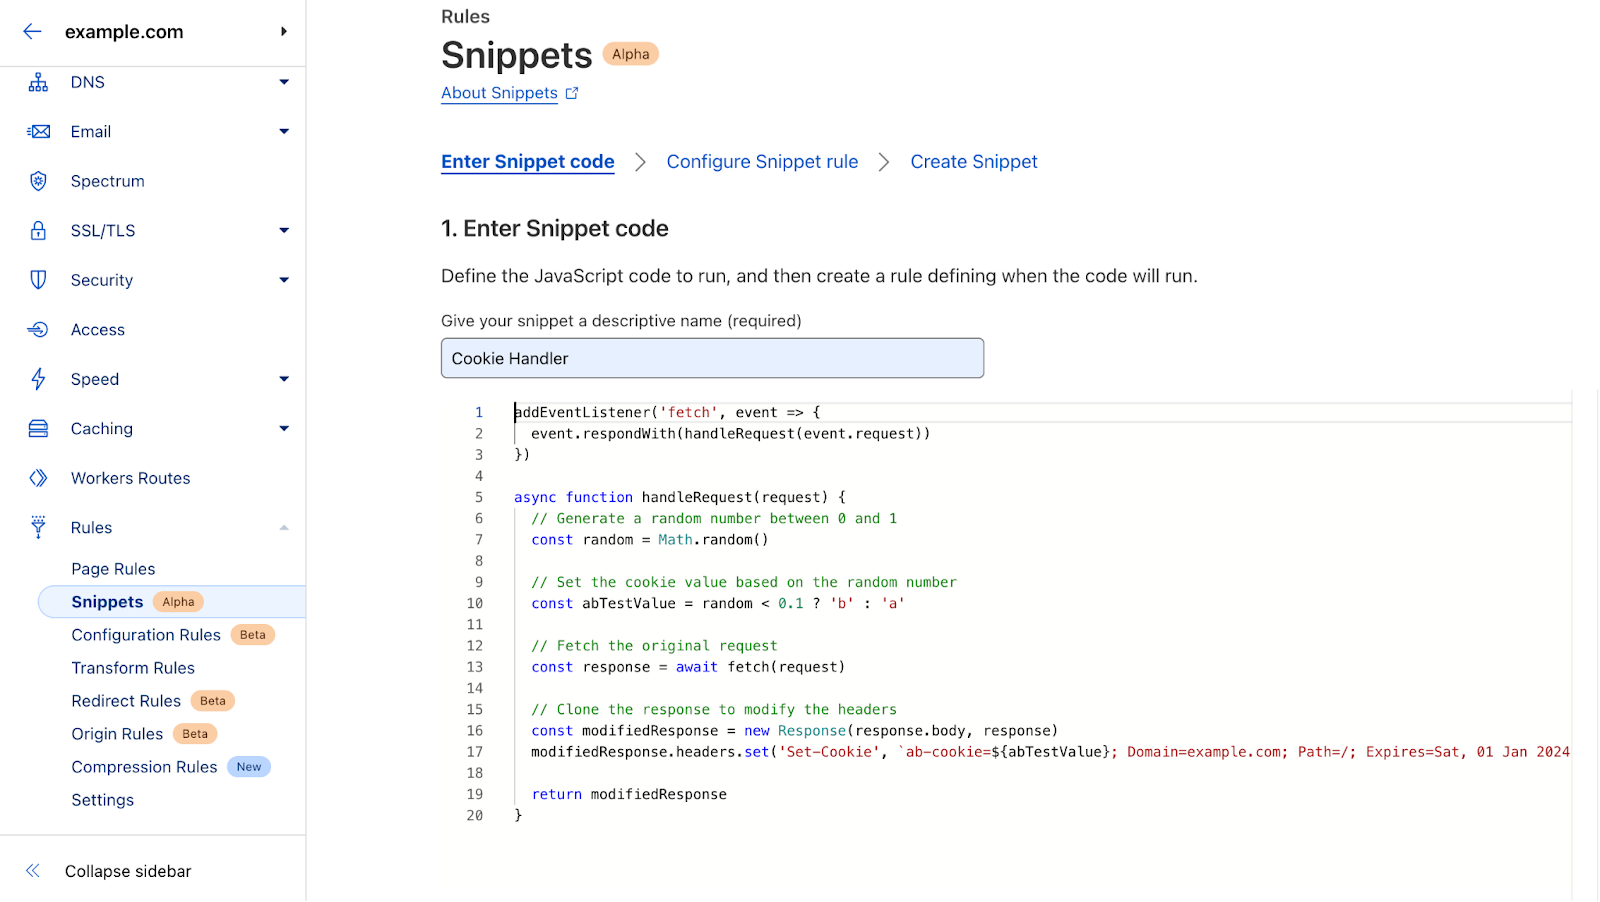
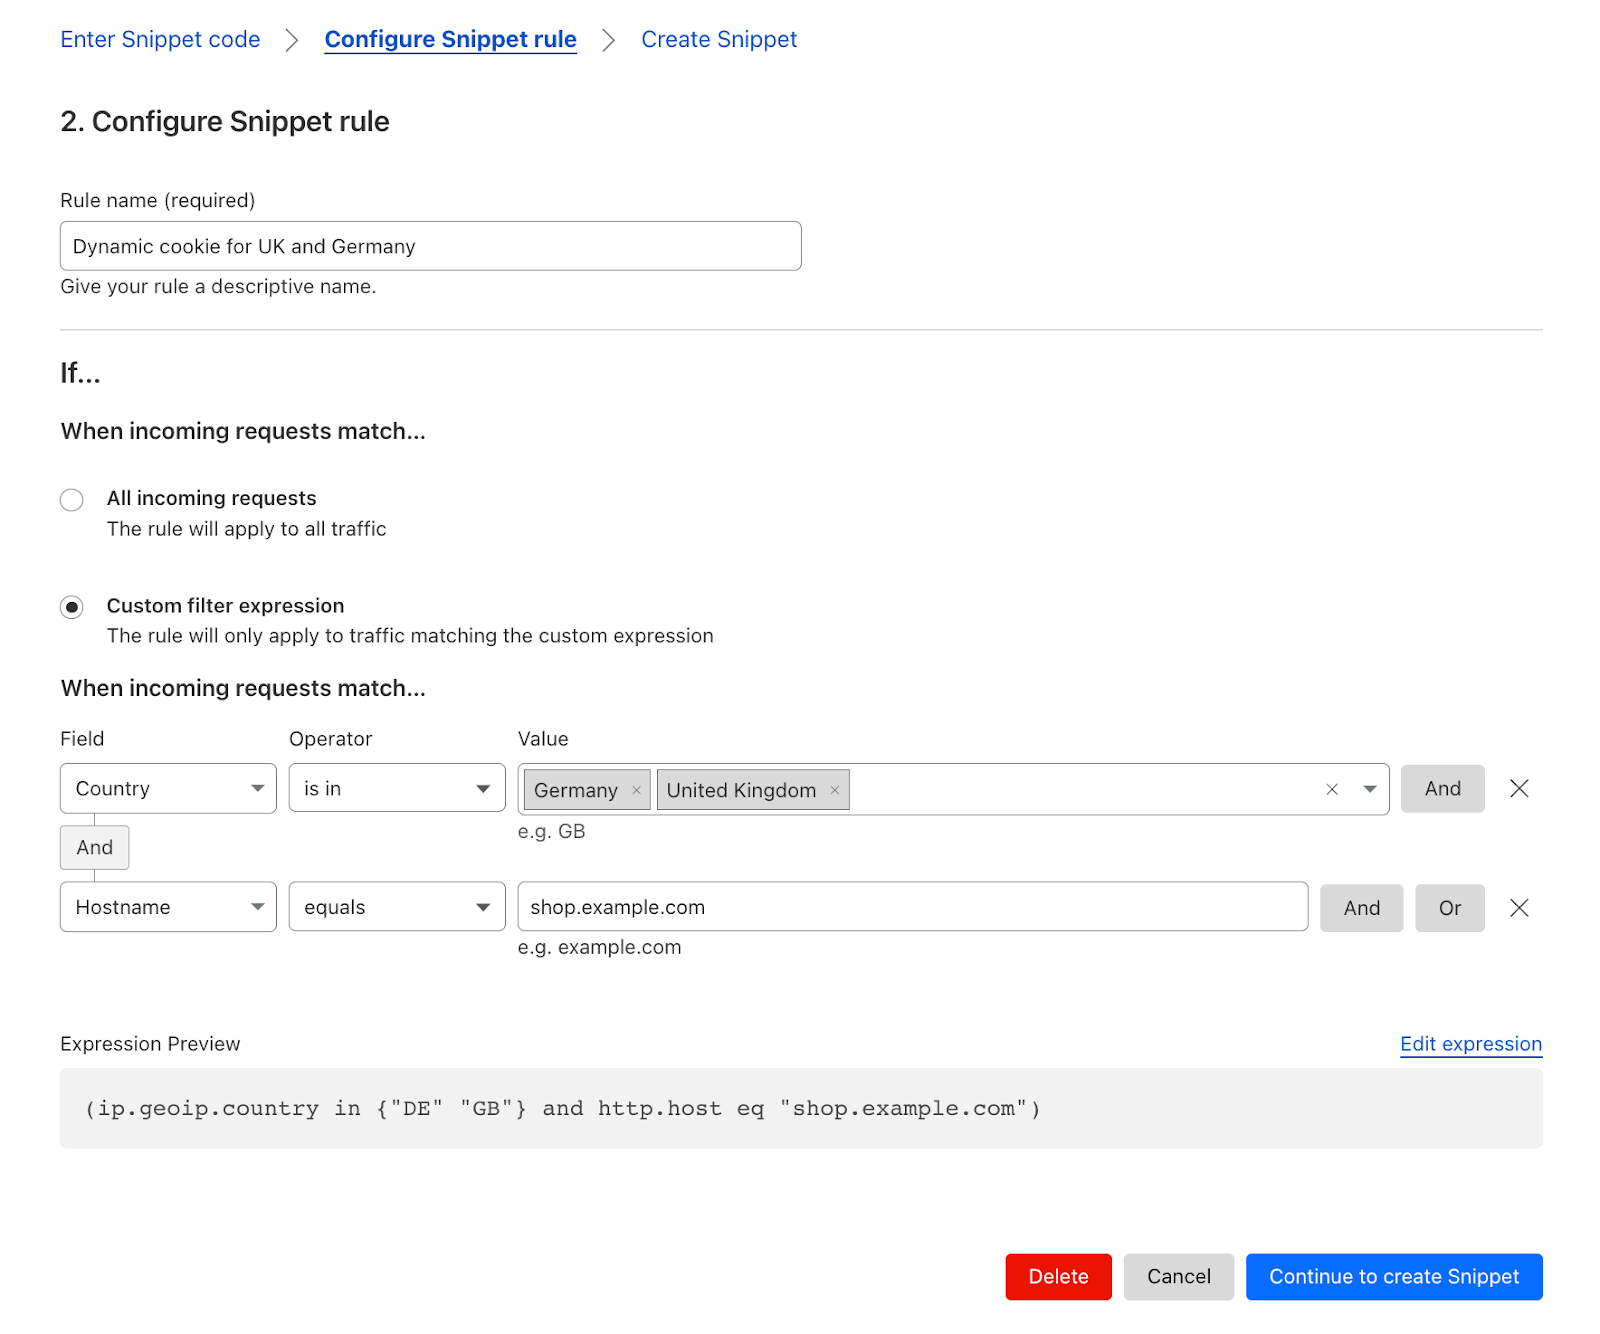
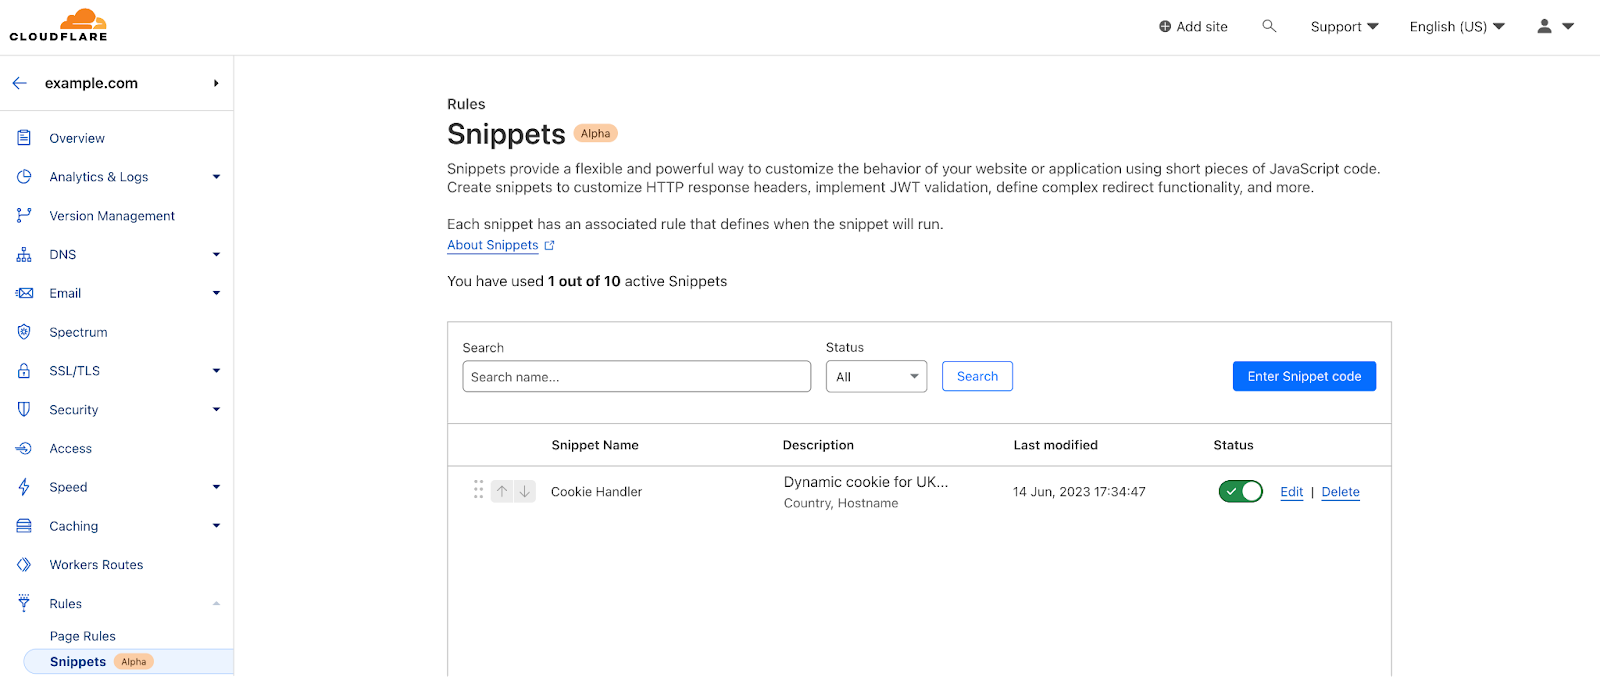
| Cloudflare Snippets is now available in alpha | Cloudflare Snippets are available in alpha. Snippets are a simple way of executing a small piece of Javascript on select HTTP requests, using the ruleset engine filtering logic. |
| Making Cloudflare Pages the fastest way to serve your sites | Pages is now the fastest way to serve your sites across Netlify, Vercel and many others. |
| Cloudflare's global network grows to 300 cities and ever closer to end users with connections to 12,000 networks | We are pleased to announce that Cloudflare is now connected to over 12,000 Internet networks in over 300 cities around the world. |
| It's never been easier to migrate thanks to Cloudflare's new Migration Hub | Relaunching Turpentine, a service for moving away from Varnish Control Language (VCL). Introducing Cloudflare's new Migration Hub. The Migration Hub serves as a one-stop-shop for all migration needs, featuring brand-new migration guides that bring transparency and simplicity to the process. |
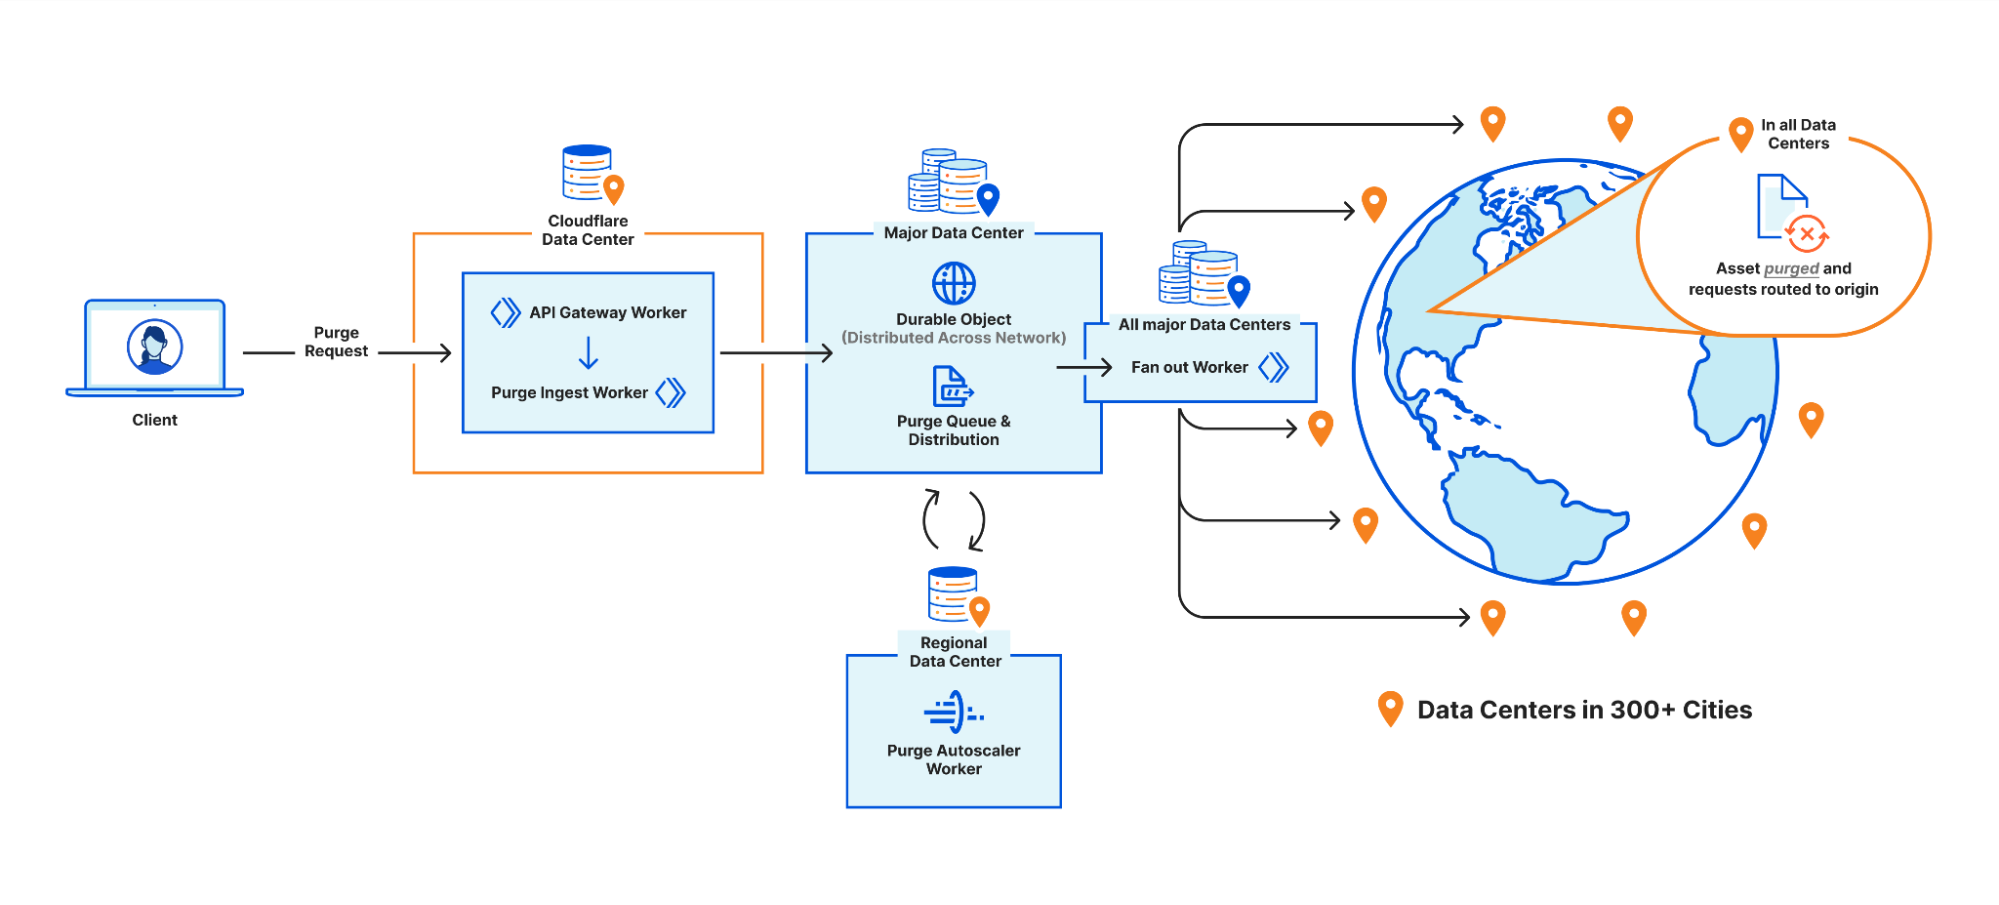
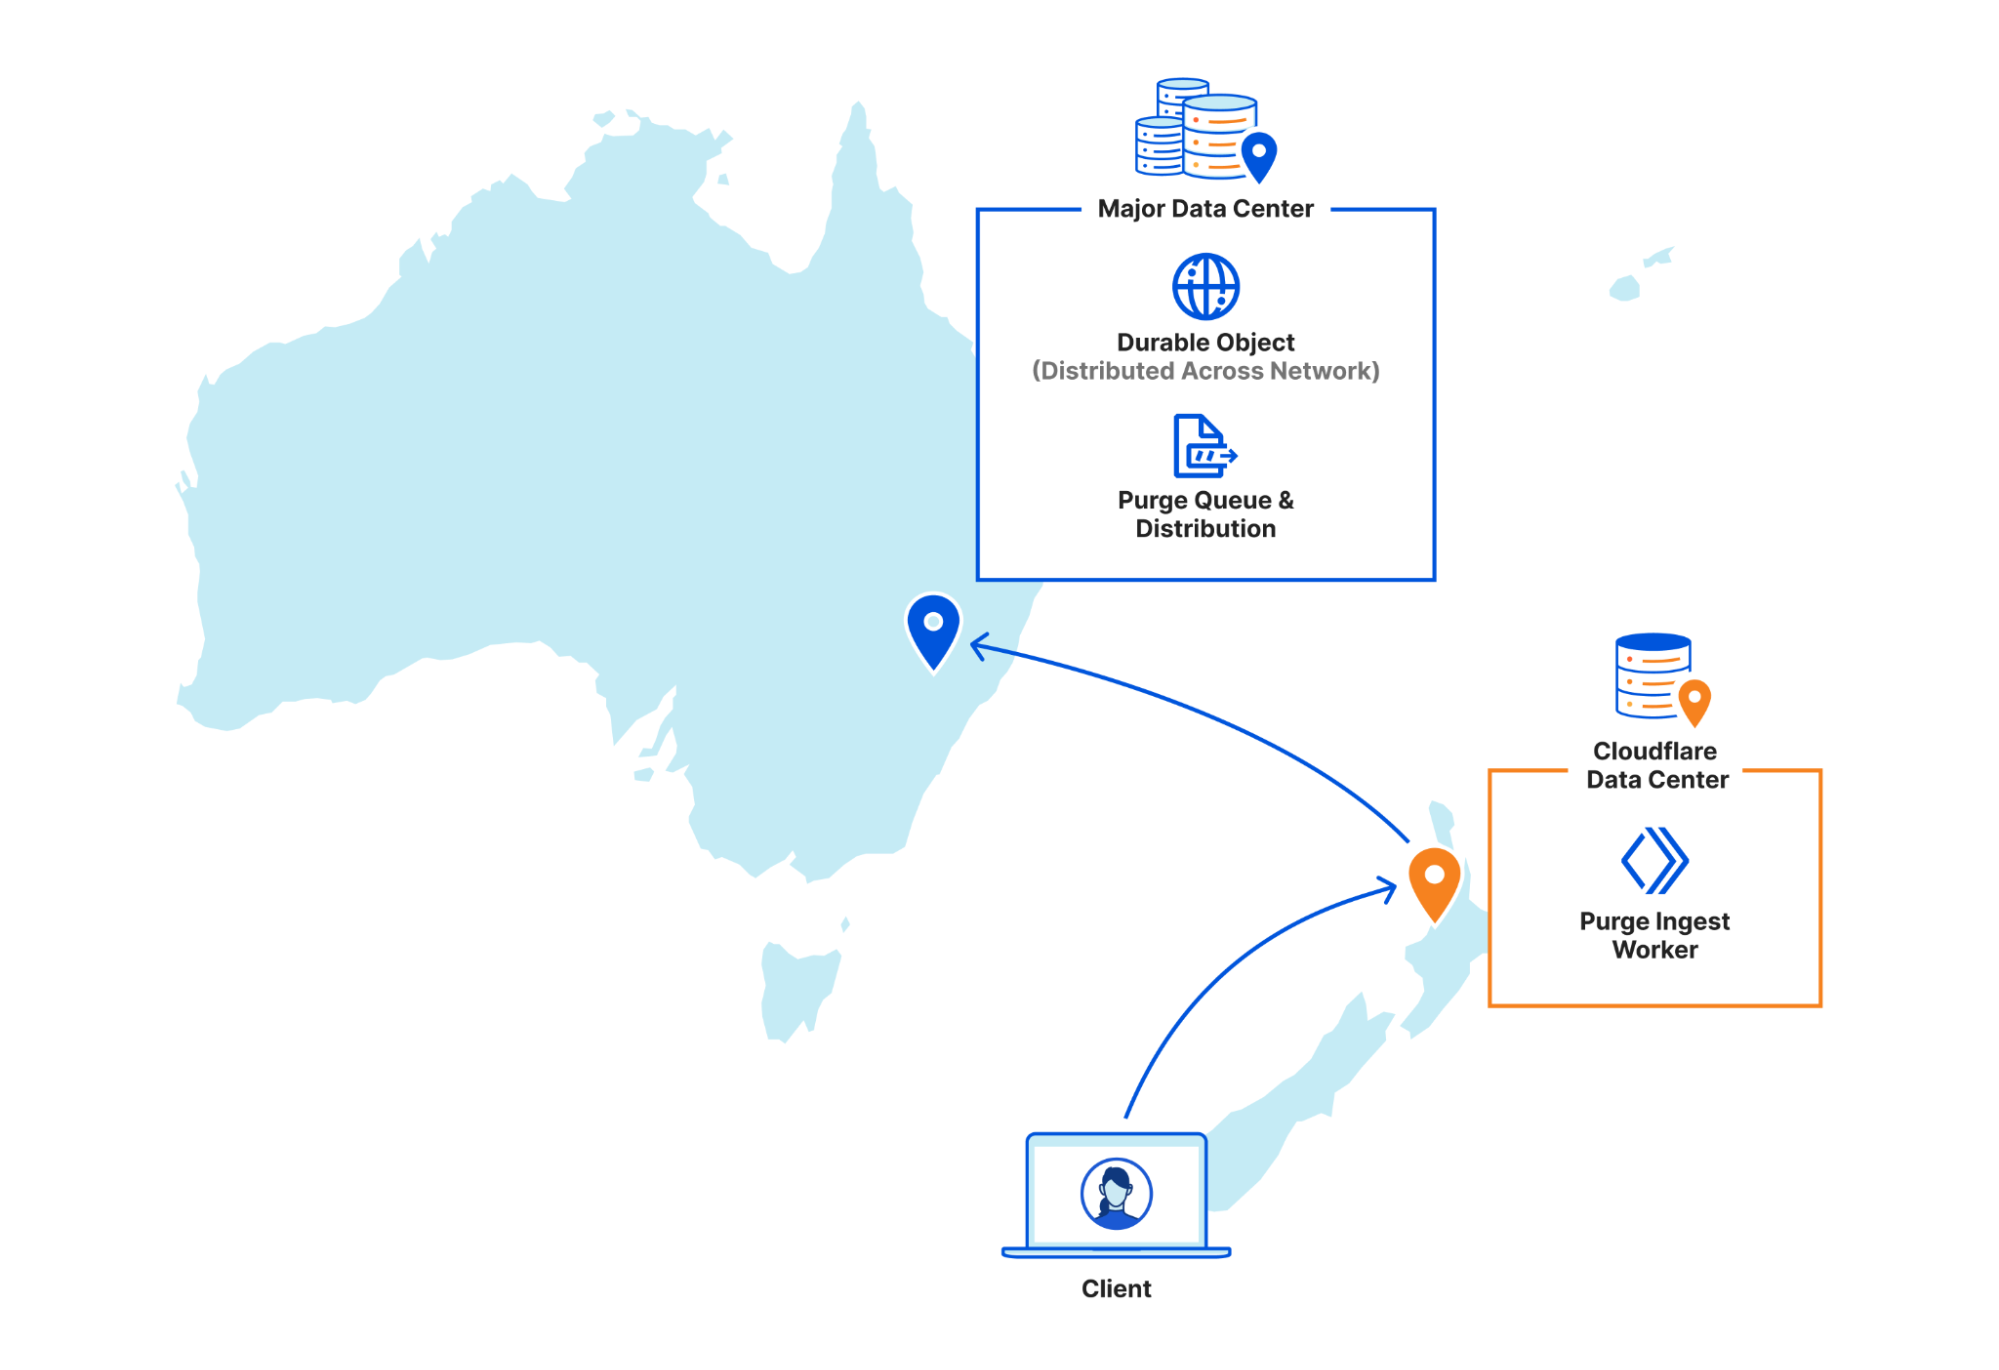
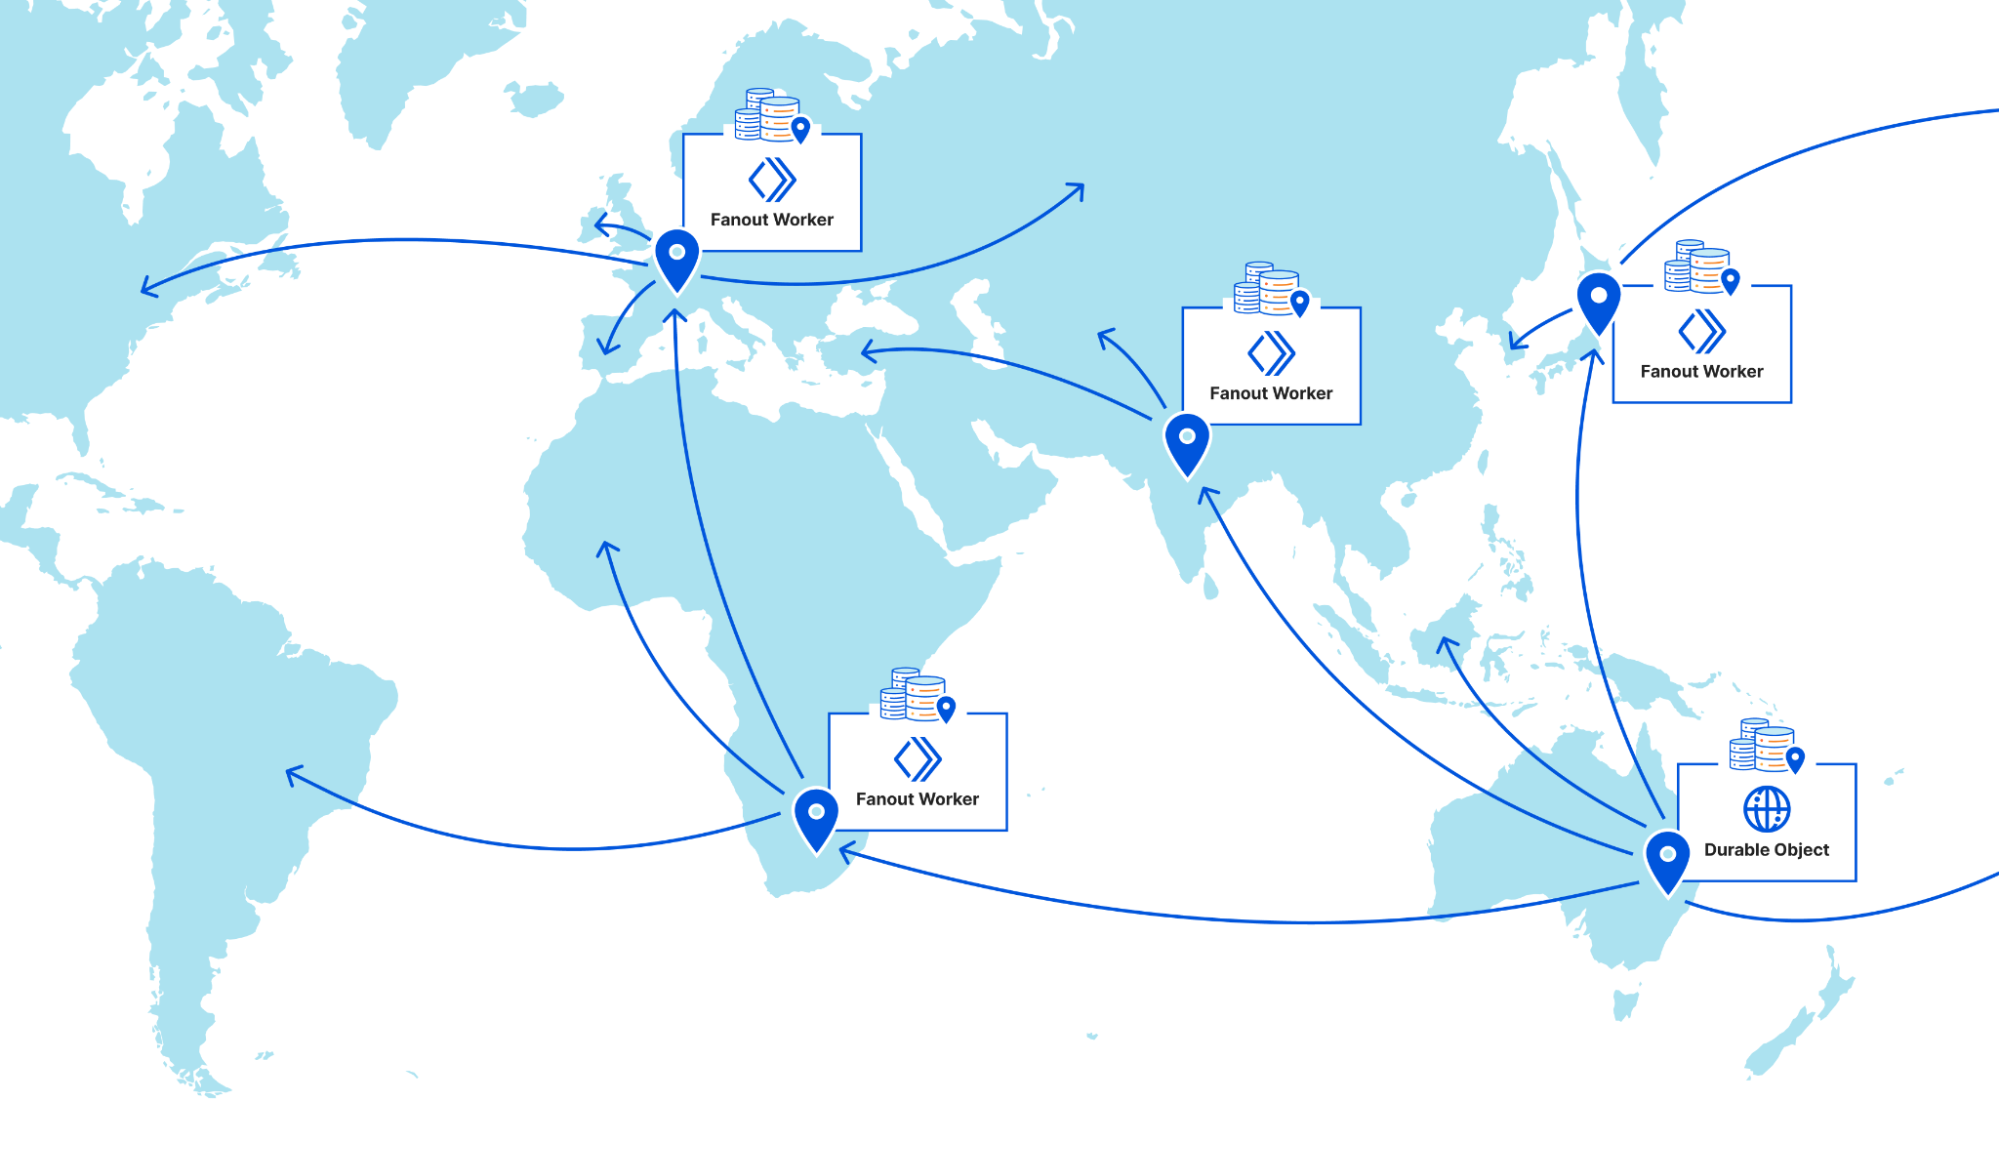
| Part 2: Rethinking cache purge with a new architecture | Discussing architecture improvements we’ve made so far for Cache Purge and what we’re working on now. |
| Speeding up your (WordPress) website is a few clicks away | In this blog, we will explain where the opportunities exist to improve website performance, how to check if a specific site can improve performance, and provide a small JavaScript snippet which can be used with Cloudflare Workers to do this optimization for you. |
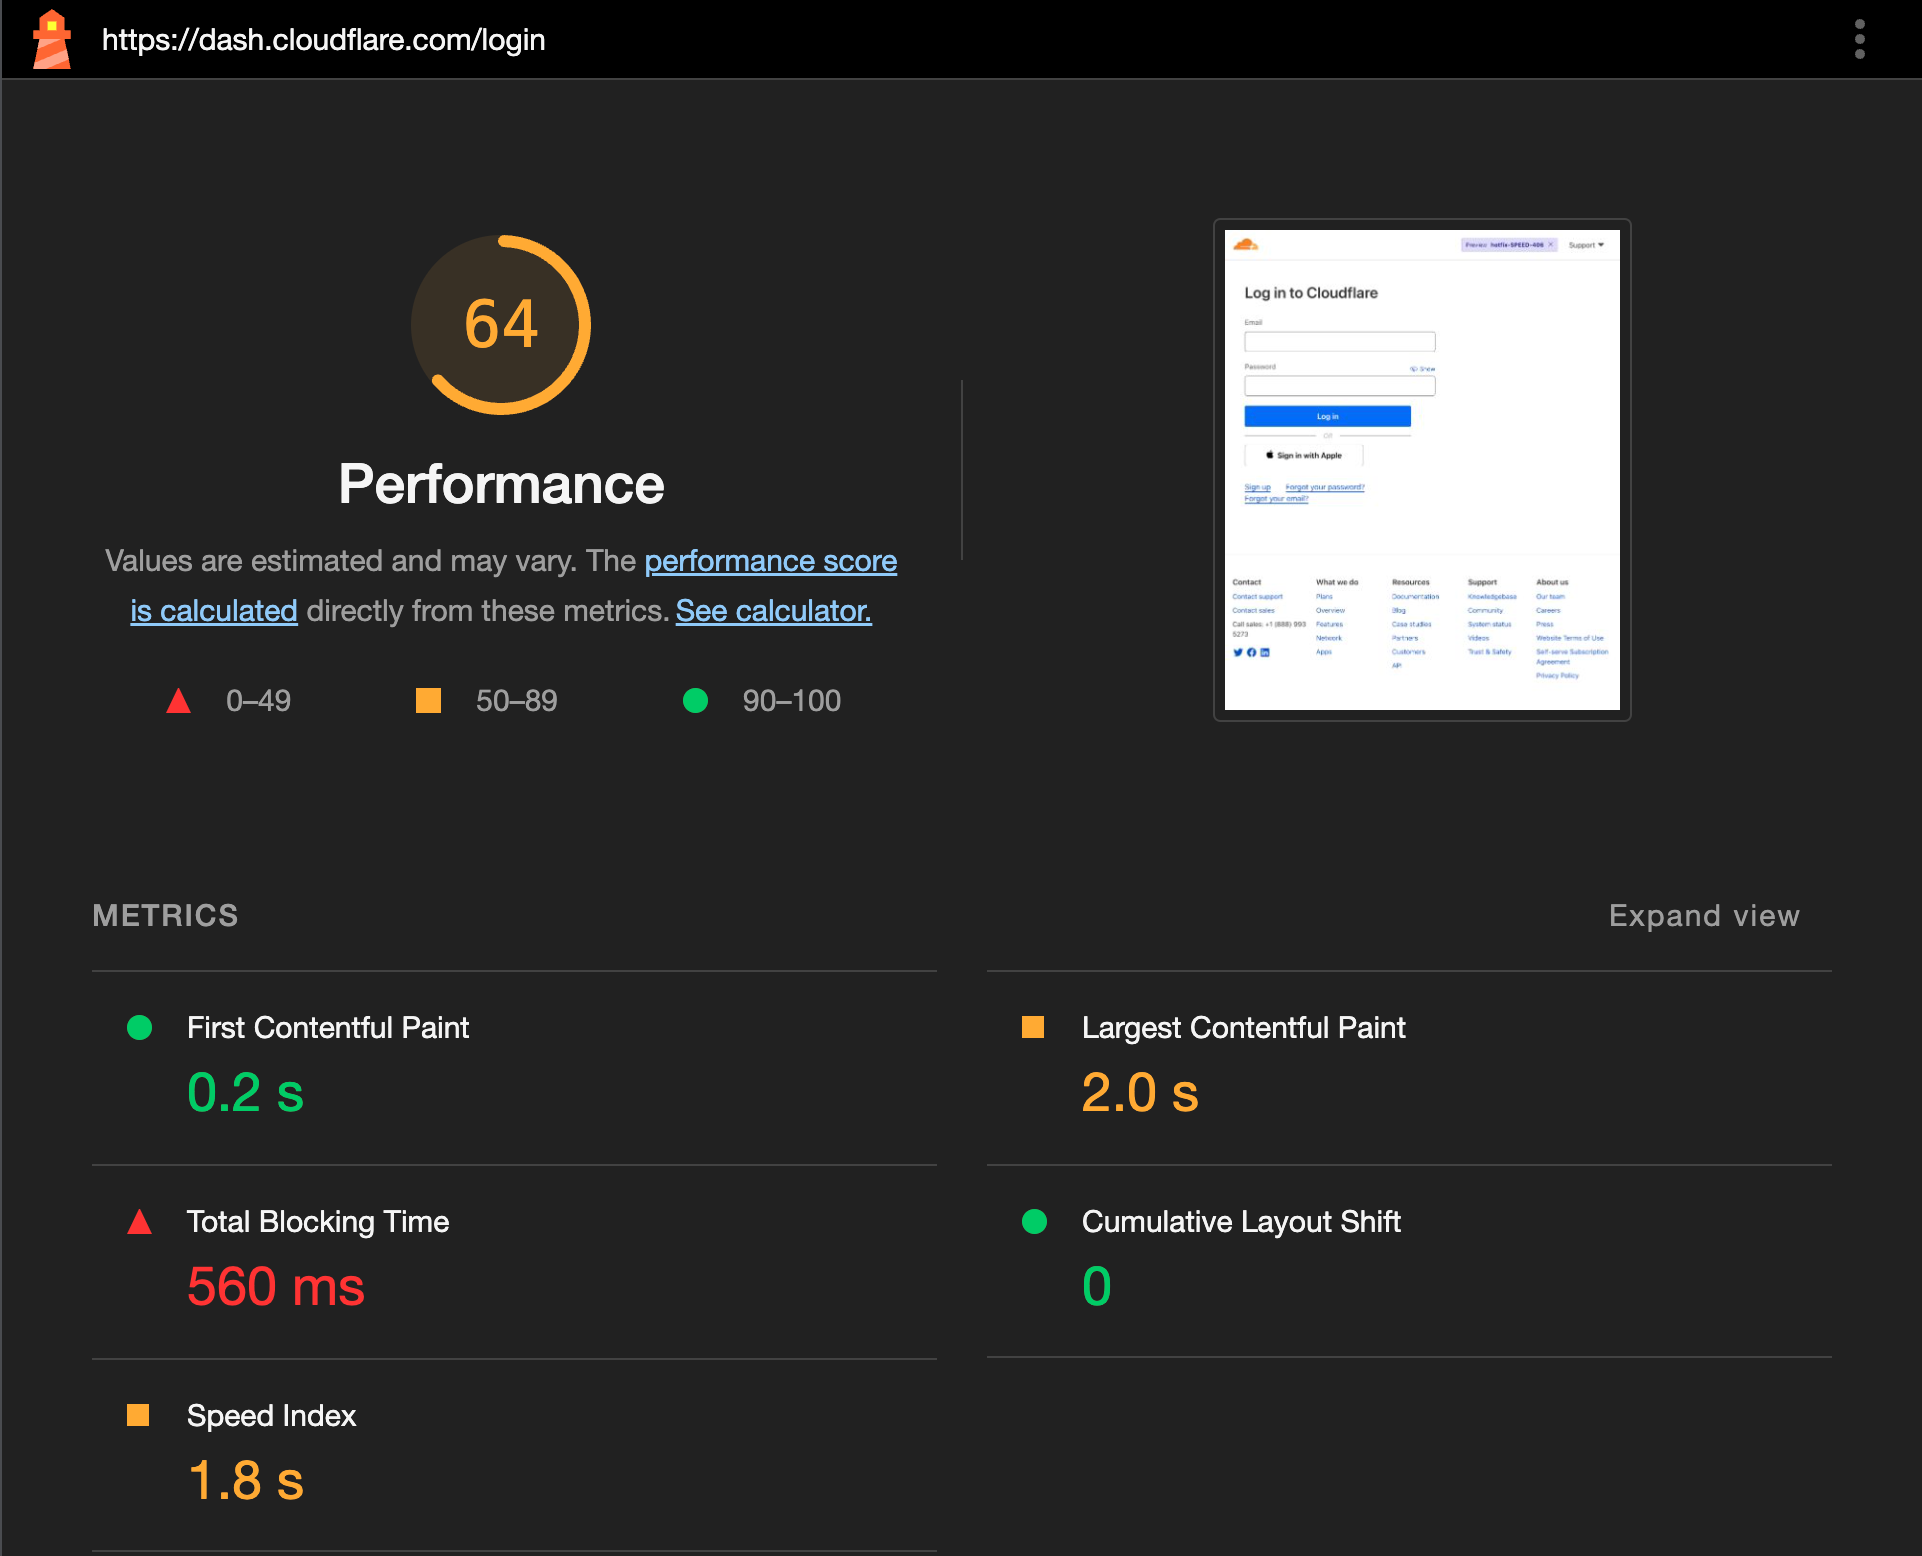
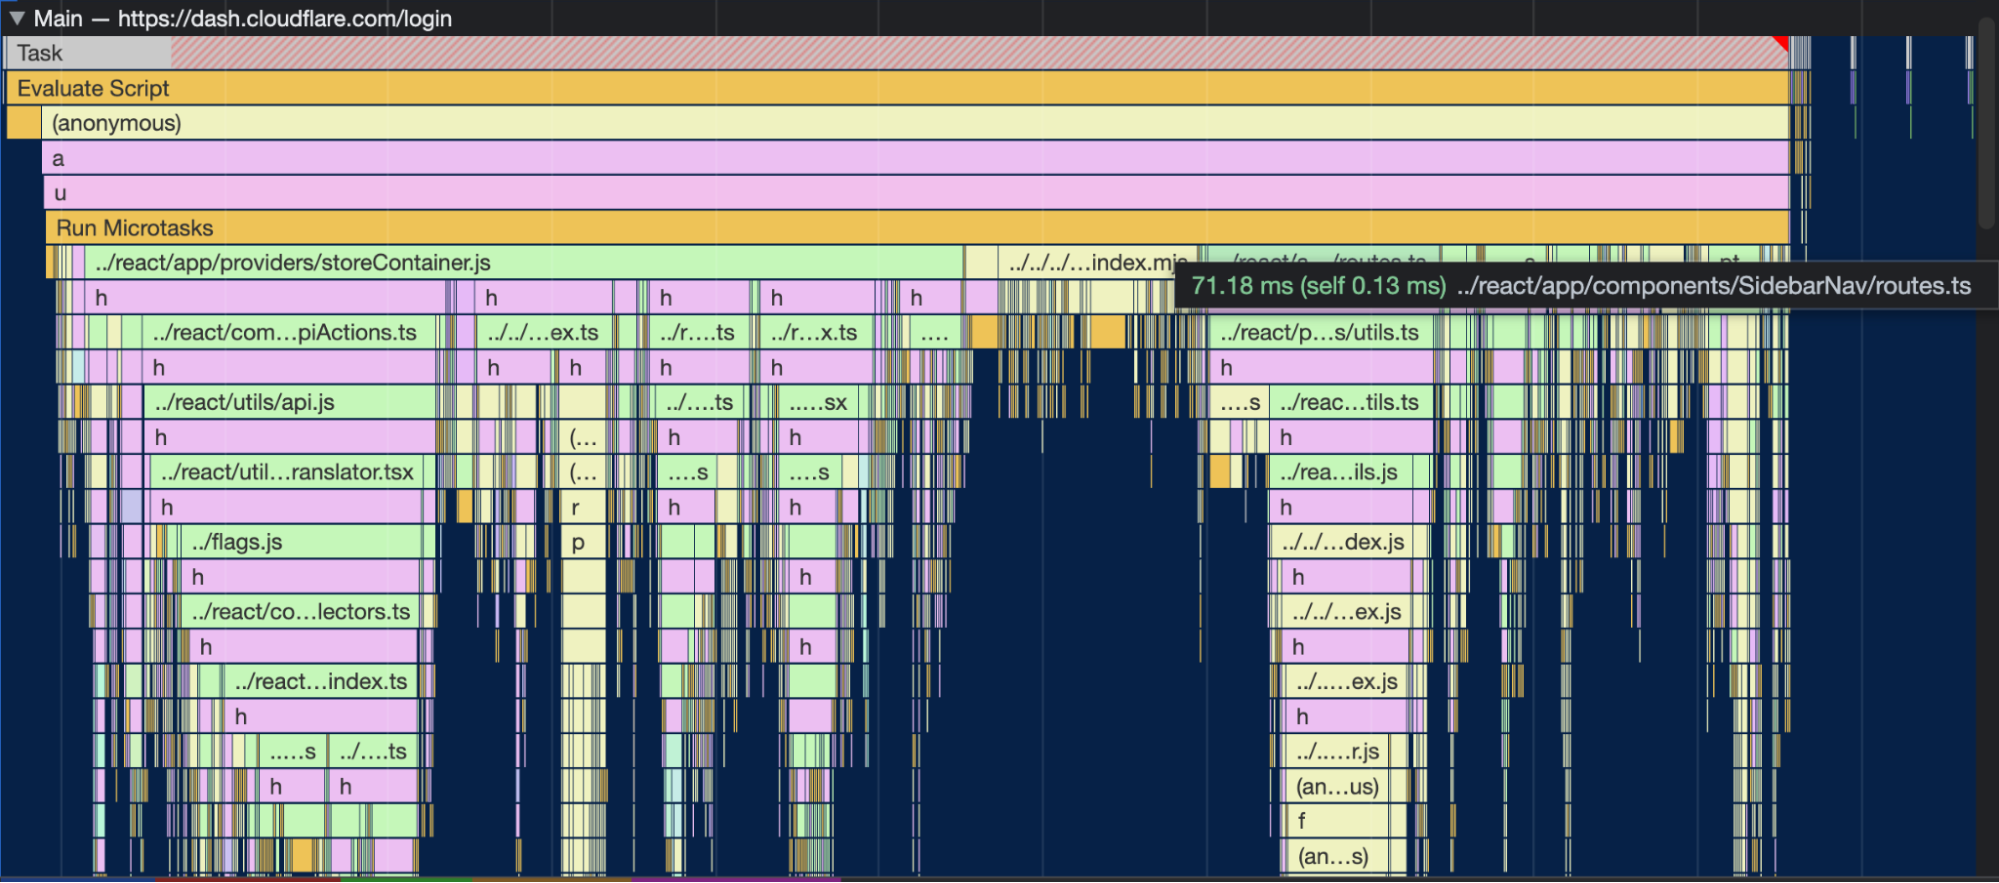
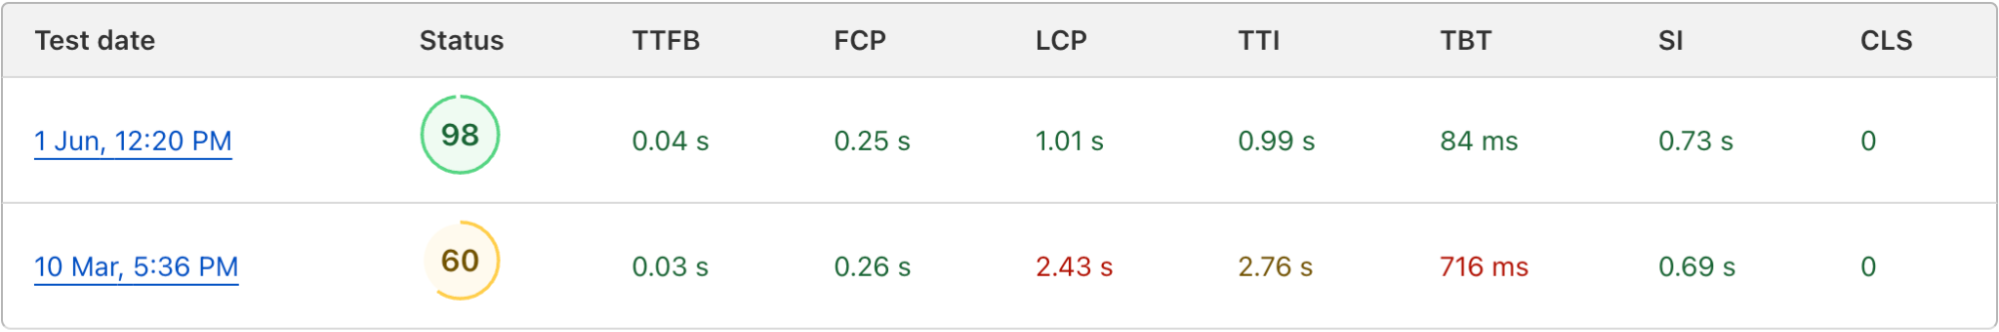
| Benchmarking dashboard performance | The Cloudflare dashboard is a single page application that houses all of the UI for our wide portfolio of existing products, as well as the new features we're releasing every day. |
| Workers KV is faster than ever with a new architecture | With the new architecture powering Workers KV our service will become faster and more scalable than ever. We have significantly reduced cold read probability, and enabled KV to serve over a trillion requests a month. |
| How Kinsta used Workers and Workers KV to improve cache hit rates by 56% | Kinsta delivers tailored cloud hosting solutions to over 26,000 companies across 128 countries. Learn how they used Workers and Workers KV to improve cache performance and customer performance. |
| A step-by-step guide to transferring domains to Cloudflare | Transferring your domains to a new registrar isn’t something you do every day, and getting any step of the process wrong could mean downtime and disruption. We’ve built a domain transfer checklist to help you quickly and safely transfer your domains to Cloudflare. |
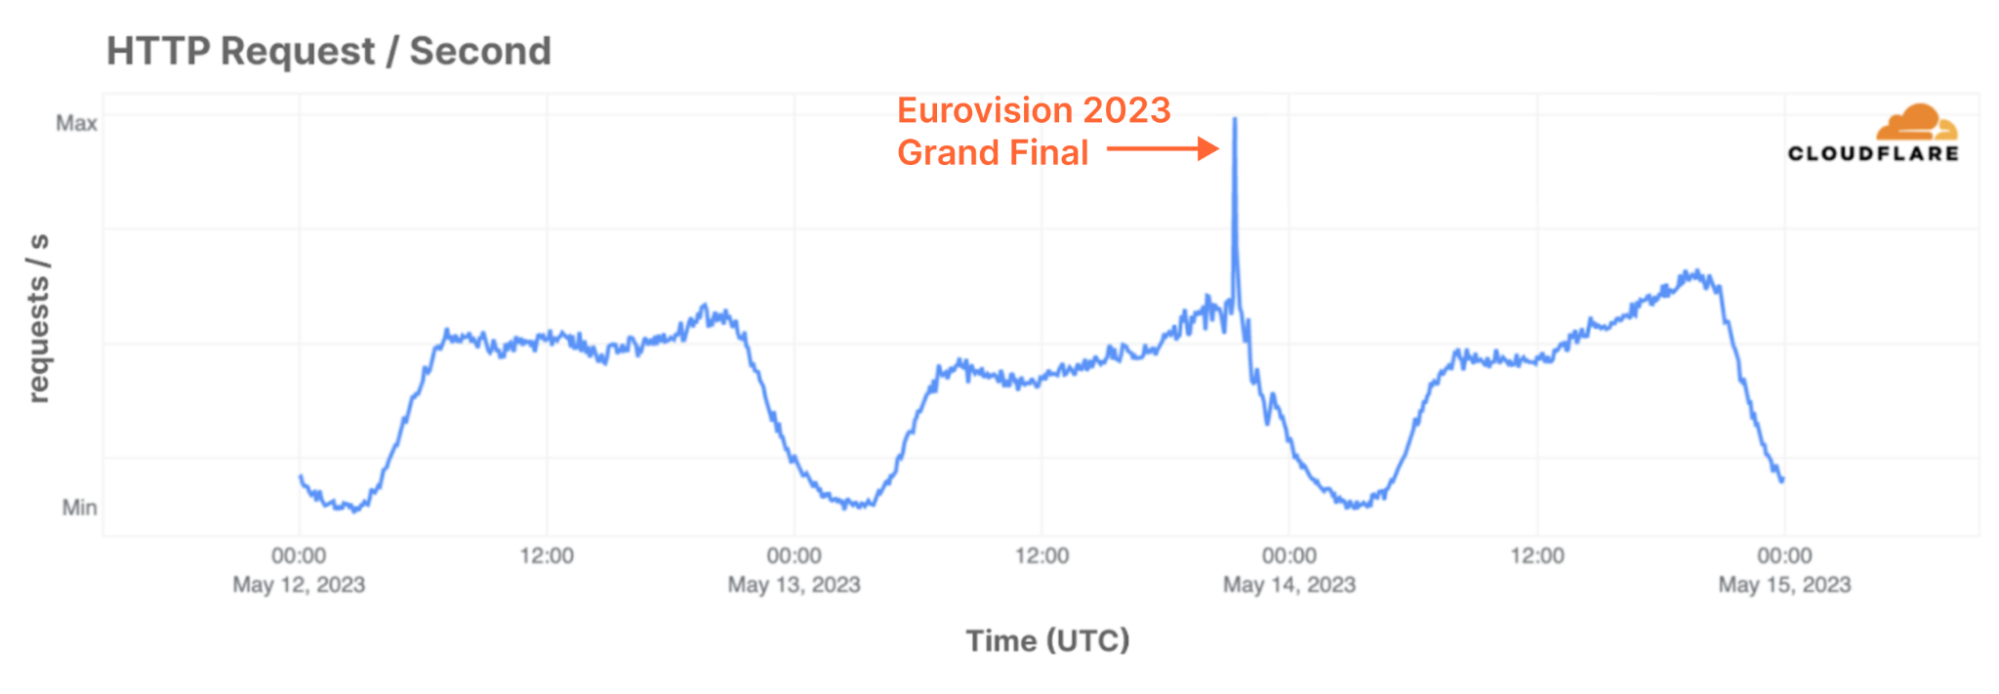
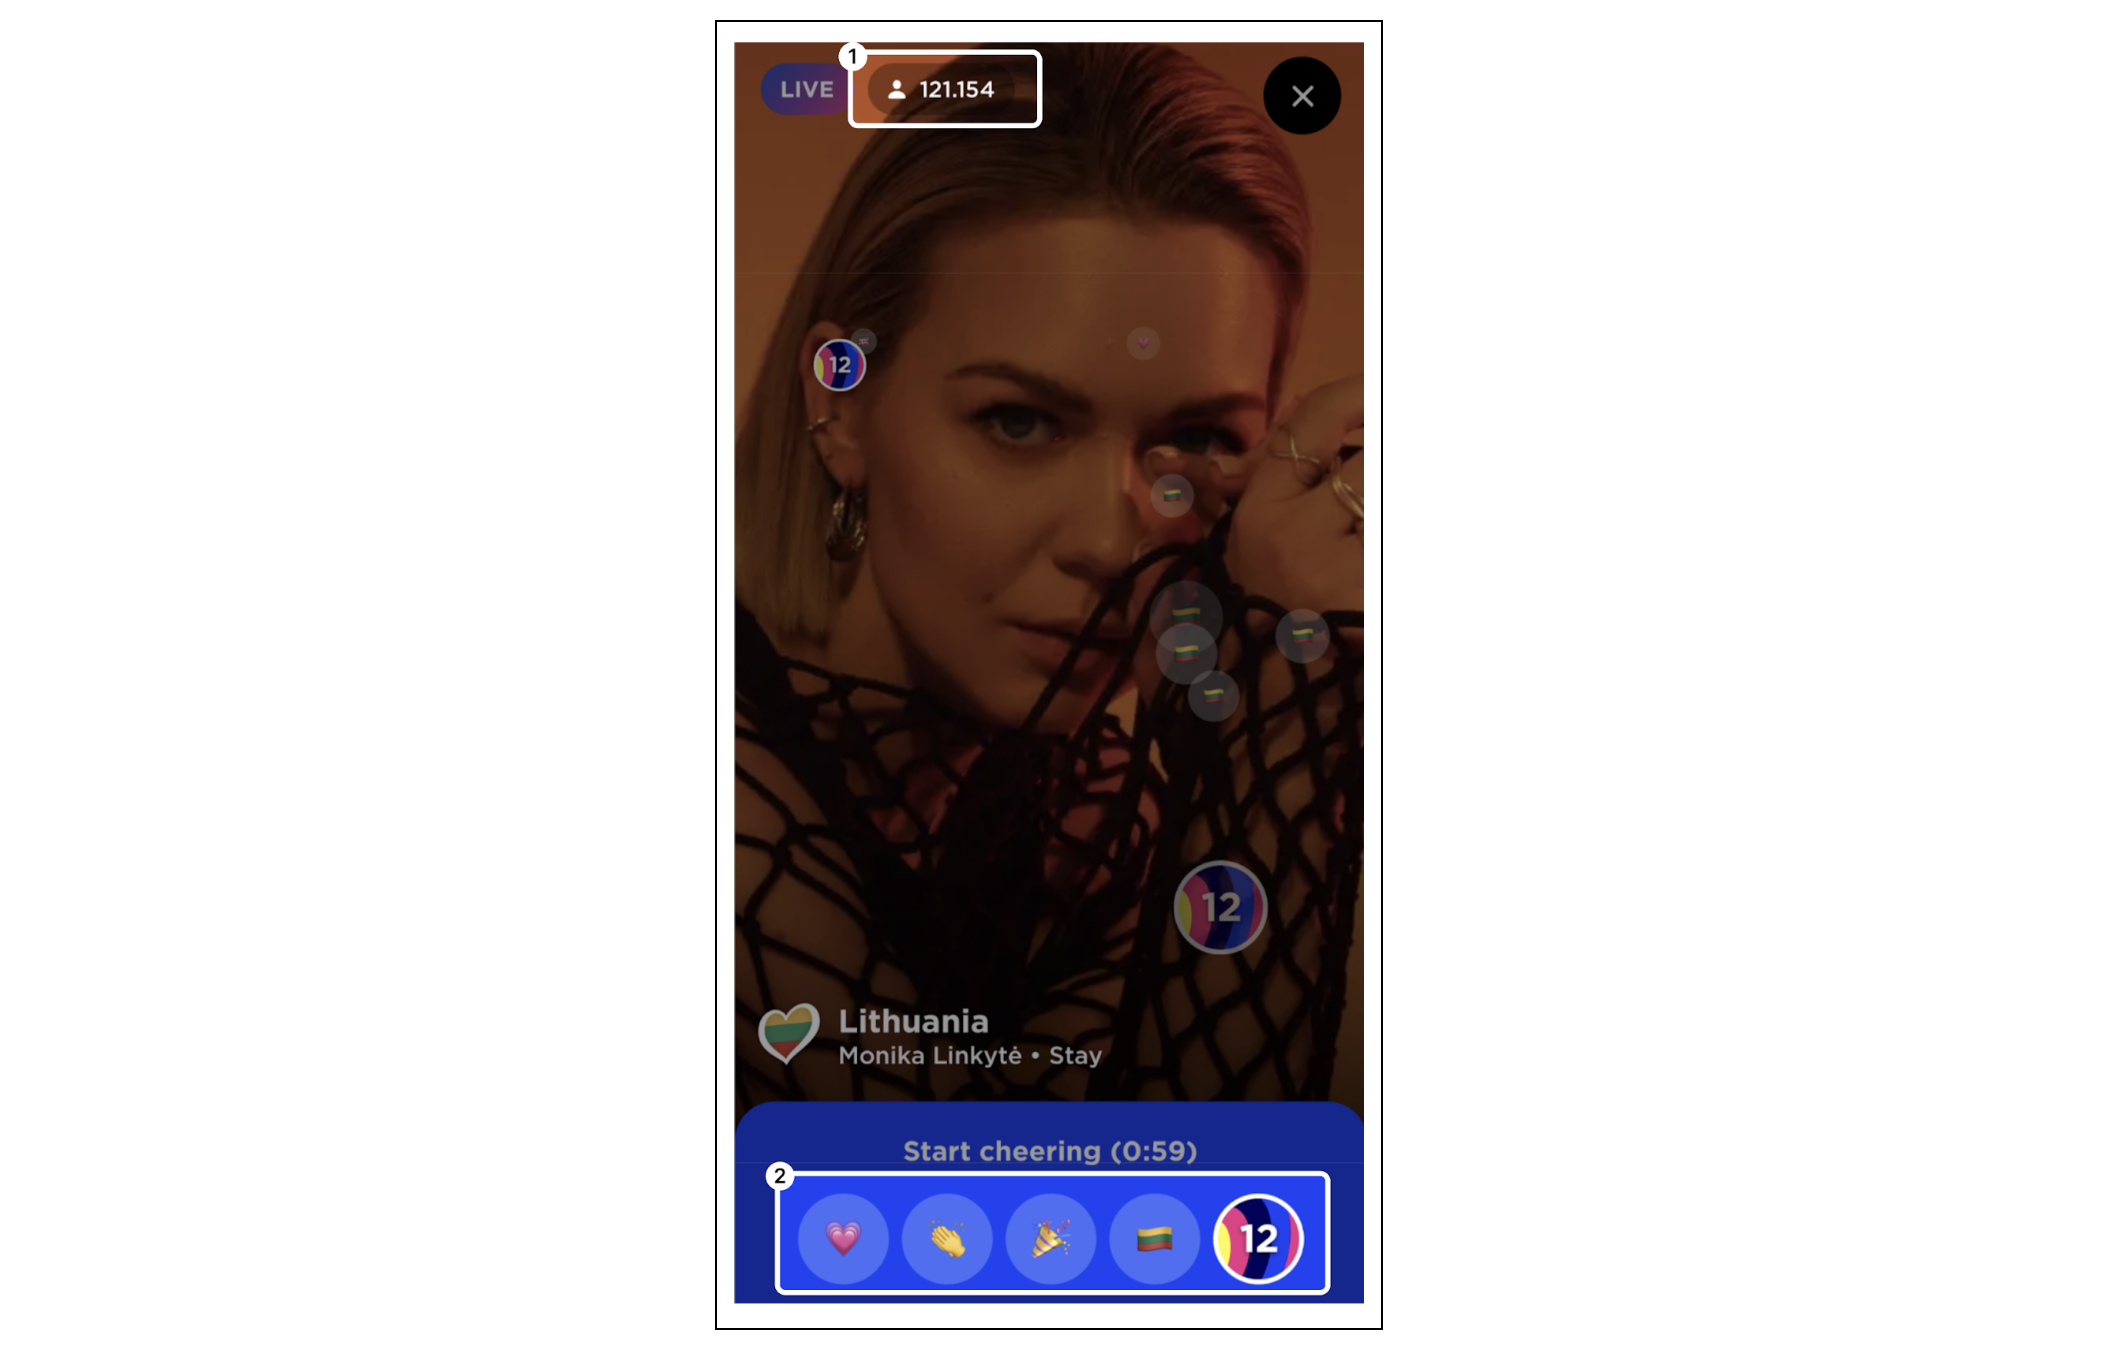
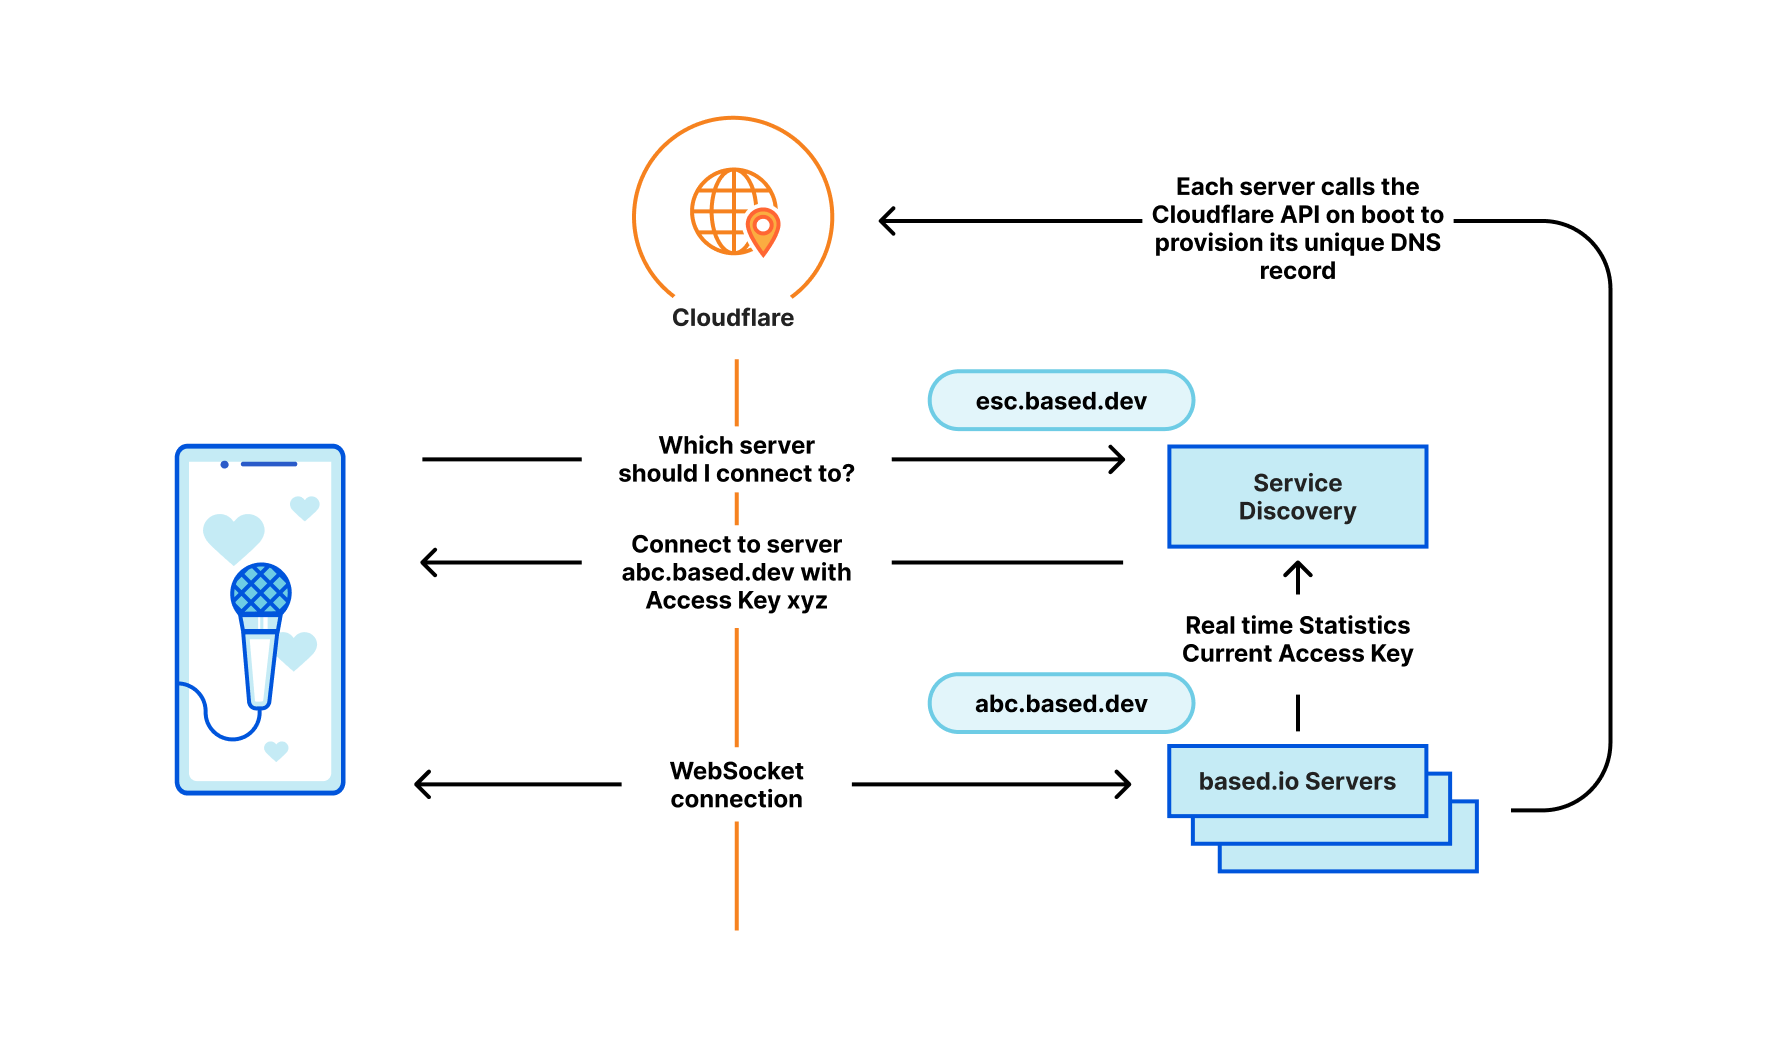
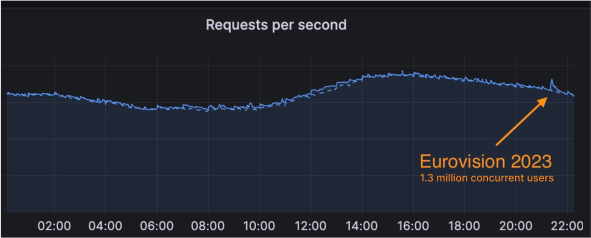
| How we scaled and protected Eurovision 2023 voting with Pages and Turnstile | More than 162 million fans tuned in to the 2023 Eurovision Song Contest, the first year that non-participating countries could also vote. Cloudflare helped scale and protect the voting application using our rapid DNS infrastructure, CDN, Cloudflare Pages and Turnstile. |
Watch on Cloudflare TV
Here's a summary of the Speed Week on Cloudflare TV:
If you missed any of the announcements or want to also view the associated Cloudflare TV segments, where blog authors went through each announcement, you can now watch all the Speed Week videos on Cloudflare TV.