Post Syndicated from Rajdip Chaudhuri original https://aws.amazon.com/blogs/big-data/migrate-an-existing-data-lake-to-a-transactional-data-lake-using-apache-iceberg/
A data lake is a centralized repository that you can use to store all your structured and unstructured data at any scale. You can store your data as-is, without having to first structure the data and then run different types of analytics for better business insights. Over the years, data lakes on Amazon Simple Storage Service (Amazon S3) have become the default repository for enterprise data and are a common choice for a large set of users who query data for a variety of analytics and machine leaning use cases. Amazon S3 allows you to access diverse data sets, build business intelligence dashboards, and accelerate the consumption of data by adopting a modern data architecture or data mesh pattern on Amazon Web Services (AWS).
Analytics use cases on data lakes are always evolving. Oftentimes, you want to continuously ingest data from various sources into a data lake and query the data concurrently through multiple analytics tools with transactional capabilities. But traditionally, data lakes built on Amazon S3 are immutable and don’t provide the transactional capabilities needed to support changing use cases. With changing use cases, customers are looking for ways to not only move new or incremental data to data lakes as transactions, but also to convert existing data based on Apache Parquet to a transactional format. Open table formats, such as Apache Iceberg, provide a solution to this issue. Apache Iceberg enables transactions on data lakes and can simplify data storage, management, ingestion, and processing.
In this post, we show you how you can convert existing data in an Amazon S3 data lake in Apache Parquet format to Apache Iceberg format to support transactions on the data using Jupyter Notebook based interactive sessions over AWS Glue 4.0.
Existing Parquet to Iceberg migration
There are two broad methods to migrate the existing data in a data lake in Apache Parquet format to Apache Iceberg format to convert the data lake to a transactional table format.
In-place data upgrade
In an in-place data migration strategy, existing datasets are upgraded to Apache Iceberg format without first reprocessing or restating existing data. This means the data files in the data lake aren’t modified during the migration and all Apache Iceberg metadata files (manifests, manifest files, and table metadata files) are generated outside the purview of the data. In this method, the metadata are recreated in an isolated environment and colocated with the existing data files. This can be a much less expensive operation compared to rewriting all the data files. The existing data file format must be Apache Parquet, Apache ORC, or Apache Avro. An in-place migration can be performed in either of two ways:
- Using add_files: This procedure adds existing data files to an existing Iceberg table with a new snapshot that includes the files. Unlike migrate or snapshot,
add_filescan import files from a specific partition or partitions and doesn’t create a new Iceberg table. This procedure doesn’t analyze the schema of the files to determine if they match the schema of the Iceberg table. Upon completion, the Iceberg table treats these files as if they are part of the set of files owned by Apache Iceberg. - Using migrate: This procedure replaces a table with an Apache Iceberg table loaded with the source’s data files. The table’s schema, partitioning, properties, and location are copied from the source table. Supported formats are Avro, Parquet, and ORC. By default, the original table is retained with the name
table_BACKUP_. However, to leave the original table intact during the process, you must use snapshot to create a new temporary table that has the same source data files and schema.
In this post, we show you how you can use the Iceberg add_files procedure for an in-place data upgrade. Note that the migrate procedure isn’t supported in AWS Glue Data Catalog.
The following diagram shows a high-level representation.

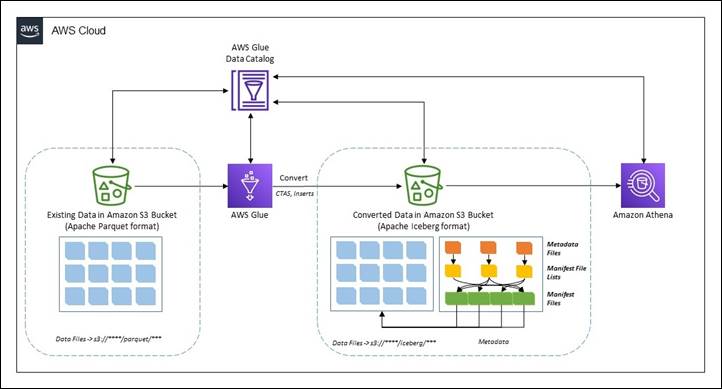
CTAS migration of data
The create table as select (CTAS) migration approach is a technique where all the metadata information for Iceberg is generated along with restating all the data files. This method shadows the source dataset in batches. When the shadow is caught up, you can swap the shadowed dataset with the source.
The following diagram showcases the high-level flow.
Prerequisites
To follow along with the walkthrough, you must have the following:
- An AWS account with a role that has sufficient access to provision the required resources.
- We will use AWS Region
us-east-1. - An AWS Identity and Access Management (IAM) role for your notebook as described in Set up IAM permissions for AWS Glue Studio.
- To demonstrate this solution, we use the NOAA Global Historical Climatology Network Daily (GHCN-D) dataset available under Registry of Open Data on AWS in Apache Parquet format in an S3 bucket (
s3://noaa-ghcn-pds/parquet/by_year/). - AWS Command Line Interface (AWS CLI) configured to interact with AWS Services.
You can check the data size using the following code in the AWS CLI or AWS CloudShell:
As of writing this post, there are 107 objects with total size of 70 MB for year 2023 in the Amazon S3 path.

Note that to implement the solution, you must complete a few preparatory steps.
Deploy resources using AWS CloudFormation
Complete the following steps to create the S3 bucket and the AWS IAM role and policy for the solution:
- Sign in to your AWS account and then choose Launch Stack to launch the CloudFormation template.
![]()
- For Stack name, enter a name.
- Leave the parameters at the default values. Note that if the default values are changed, then you must make corresponding changes throughout the following steps.
- Choose Next to create your stack.
This AWS CloudFormation template deploys the following resources:
- An S3 bucket named
demo-blog-post-XXXXXXXX(XXXXXXXXrepresents the AWS account ID used). - Two folders named
parquetandicebergunder the bucket. - An IAM role and a policy named
demoblogpostroleanddemoblogpostscopedrespectively. - An AWS Glue database named
ghcn_db. - An AWS Glue Crawler named
demopostcrawlerparquet.

After the the AWS CloudFormation template is successfully deployed:
- Copy the data in the created S3 bucket using following command in AWS CLI or AWS CloudShell. Replace
XXXXXXXXappropriately in the target S3 bucket name.
Note: In the example, we copy data only for the year 2023. However, you can work with the entire dataset, following the same instructions. - Open the AWS Management Console and go to the AWS Glue console.
- On the navigation pane, select Crawlers.
- Run the crawler named
demopostcrawlerparquet. - After the AWS Glue crawler
demopostcrawlerparquetis successfully run, the metadata information of the Apache Parquet data will be cataloged under theghcn_dbAWS Glue database with the table namesource_parquet. Notice that the table is partitioned overyearandelementcolumns (as in the S3 bucket).

- Use the following query to verify the data from the Amazon Athena console. If you’re using Amazon Athena for the first time in your AWS Account, set up a query result location in Amazon S3.

Launch an AWS Glue Studio notebook for processing
For this post, we use an AWS Glue Studio notebook. Follow the steps in Getting started with notebooks in AWS Glue Studio to set up the notebook environment. Launch the notebooks hosted under this link and unzip them on a local workstation.
- Open AWS Glue Studio.
- Choose ETL Jobs.
- Choose Jupyter notebook and then choose Upload and edit an existing notebook. From Choose file, select required
ipynbfile and choose Open, then choose Create. - On the Notebook setup page, for Job name, enter a logical name.
- For IAM role, select
demoblogpostrole. Choose Create job. After a minute, the Jupyter notebook editor appears. Clear all the default cells.
The preceding steps launch an AWS Glue Studio notebook environment. Make sure you Save the notebook every time it’s used.
In-place data upgrade
In this section we show you how you can use the add_files procedure to achieve an in-place data upgrade. This section uses the ipynb file named demo-in-place-upgrade-addfiles.ipynb. To use with the add_files procedure, complete the following:
- On the Notebook setup page, for Job name, enter
demo-in-place-upgradefor the notebook session as explained in Launch Glue notebook for processing. - Run the cells under the section Glue session configurations. Provide the S3 bucket name from the prerequisites for the
bucket_namevariable by replacingXXXXXXXX. - Run the subsequent cells in the notebook.
Notice that the cell under Execute add_files procedure section performs the metadata creation in the mentioned path.

Review the data file paths for the new Iceberg table. To show an Iceberg table’s current data files, .files can be used to get details such as file_path, partition, and others. Recreated files are pointing to the source path under Amazon S3.

Note the metadata file location after transformation. It’s pointing to the new folder named iceberg under Amazon S3. This can be checked using .snapshots to check Iceberg tables’ snapshot file location. Also, check the same in the Amazon S3 URI s3://demo-blog-post-XXXXXXXX/iceberg/ghcn_db.db/target_iceberg_add_files/metadata/. Also notice that there are two versions of the manifest list created after the add_files procedure has been run. The first is an empty table with the data schema and the second is adding the files.


The table is cataloged in AWS Glue under the database ghcn_db with the table type as ICEBERG.

Compare the count of records using Amazon Athena between the source and target table. They are the same.

In summary, you can use the add_files procedure to convert existing data files in Apache Parquet format in a data lake to Apache Iceberg format by adding the metadata files and without recreating the table from scratch. Following are some pros and cons of this method.
Pros
- Avoids full table scans to read the data as there is no restatement. This can save time.
- If there are any errors during while writing the metadata, only a metadata re-write is required and not the entire data.
- Lineage of the existing jobs is maintained because the existing catalog still exists.
Cons
- If data is processed (inserts, updates, and deletes) in the dataset during the metadata writing process, the process must be run again to include the new data.
- There must be write downtime to avoid having to run the process a second time.
- If a data restatement is required, this workflow will not work as source data files aren’t modified.
CTAS migration of data
This section uses the ipynb file named demo-ctas-upgrade.ipynb. Complete the following:
- On the Notebook setup page, for Job name, enter
demo-ctas-upgradefor the notebook session as explained under Launch Glue notebook for processing. - Run the cells under the section Glue session configurations. Provide the S3 bucket name from the prerequisites for the
bucket_namevariable by replacingXXXXXXXX. - Run the subsequent cells in the notebook.
Notice that the cell under Create Iceberg table from Parquet section performs the shadow upgrade to Iceberg format. Note that Iceberg requires sorting the data according to table partitions before writing to the Iceberg table. Further details can be found in Writing Distribution Modes.

Notice the data and metadata file paths for the new Iceberg table. It’s pointing to the new path under Amazon S3. Also, check under the Amazon S3 URI s3://demo-blog-post-XXXXXXXX/iceberg/ghcn_db.db/target_iceberg_ctas/ used for this post.


The table is cataloged under AWS Glue under the database ghcn_db with the table type as ICEBERG.

Compare the count of records using Amazon Athena between the source and target table. They are same.

In summary, the CTAS method creates a new table by generating all the metadata files along with restating the actual data. Following are some pros and cons of this method:
Pros
- It allows you to audit and validate the data during the process because data is restated.
- If there are any runtime issues during the migration process, rollback and recovery can be easily performed by deleting the Apache Iceberg table.
- You can test different configurations when migrating a source. You can create a new table for each configuration and evaluate the impact.
- Shadow data is renamed to a different directory in the source (so it doesn’t collide with old Apache Parquet data).
Cons
- Storage of the dataset is doubled during the process as both the original Apache Parquet and new Apache Iceberg tables are present during the migration and testing phase. This needs to be considered during cost estimation.
- The migration can take much longer (depending on the volume of the data) because both data and metadata are written.
- It’s difficult to keep tables in sync if there changes to the source table during the process.
Clean up
To avoid incurring future charges, and to clean up unused roles and policies, delete the resources you created: the datasets, CloudFormation stack, S3 bucket, AWS Glue job, AWS Glue database, and AWS Glue table.
Conclusion
In this post, you learned strategies for migrating existing Apache Parquet formatted data to Apache Iceberg in Amazon S3 to convert to a transactional data lake using interactive sessions in AWS Glue 4.0 to complete the processes. If you have an evolving use case where an existing data lake needs to be converted to a transactional data lake based on Apache Iceberg table format, follow the guidance in this post.
The path you choose for this upgrade, an in-place upgrade or CTAS migration, or a combination of both, will depend on careful analysis of the data architecture and data integration pipeline. Both pathways have pros and cons, as discussed. At a high level, this upgrade process should go through multiple well-defined phases to identify the patterns of data integration and use cases. Choosing the correct strategy will depend on your requirements—such as performance, cost, data freshness, acceptable downtime during migration, and so on.
About the author
 Rajdip Chaudhuri is a Senior Solutions Architect with Amazon Web Services specializing in data and analytics. He enjoys working with AWS customers and partners on data and analytics requirements. In his spare time, he enjoys soccer and movies.


 Rajdip Chaudhuri is a Senior Solutions Architect with Amazon Web Services specializing in data and analytics. He enjoys working with AWS customers and partners on data and analytics requirements. In his spare time, he enjoys soccer and movies.
 Dhiraj Thakur is a Solutions Architect with Amazon Web Services. He works with AWS customers and partners to provide guidance on enterprise cloud adoption, migration, and strategy. He is passionate about technology and enjoys building and experimenting in the analytics and AI/ML space.