Post Syndicated from Ray Wang original https://aws.amazon.com/blogs/big-data/seamlessly-integrate-data-on-google-bigquery-and-clickhouse-cloud-with-aws-glue/
Migrating from Google Cloud’s BigQuery to ClickHouse Cloud on AWS allows businesses to leverage the speed and efficiency of ClickHouse for real-time analytics while benefiting from AWS’s scalable and secure environment. This article provides a comprehensive guide to executing a direct data migration using AWS Glue ETL, highlighting the advantages and best practices for a seamless transition.
AWS Glue ETL enables organizations to discover, prepare, and integrate data at scale without the burden of managing infrastructure. With its built-in connectivity, Glue can seamlessly read data from Google Cloud’s BigQuery and write it to ClickHouse Cloud on AWS, removing the need for custom connectors or complex integration scripts. Beyond connectivity, Glue also provides advanced capabilities such as a visual ETL authoring interface, automated job scheduling, and serverless scaling, allowing teams to design, monitor, and manage their pipelines more efficiently. Together, these features simplify data integration, reduce latency, and deliver significant cost savings, enabling faster and more reliable migrations.
Prerequisites
Before using AWS Glue to integrate data into ClickHouse Cloud, you must first set up the ClickHouse environment on AWS. This includes creating and configuring your ClickHouse Cloud on AWS, making sure network access and security groups are properly defined, and verifying that the cluster endpoint is accessible. Once the ClickHouse environment is ready, you can leverage the AWS Glue built-in connector to seamlessly write data into ClickHouse Cloud from sources such as Google Cloud BigQuery. You can follow the next section to complete the setup.
- Set up ClickHouse Cloud on AWS
- Follow the ClickHouse official website to set up environment (remember to allow remote access in the config file if using Clickhouse OSS)
https://clickhouse.com/docs/get-started/quick-start
- Follow the ClickHouse official website to set up environment (remember to allow remote access in the config file if using Clickhouse OSS)
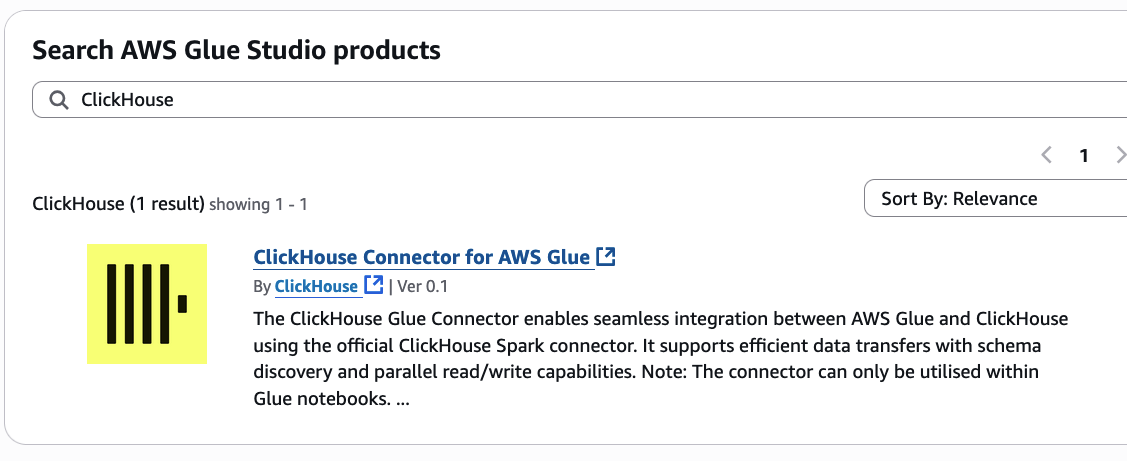
- Subscribe the ClickHouse Glue marketplace connector
- Open Glue Connectors and choose Go to AWS Marketplace
- On the list of AWS Glue marketplace connectors, enter
ClickHousein the search bar. Then choose ClickHouse Connector for AWS Glue

- Choose View purchase options on the right top of the view
- Review Terms and Conditions and choose Accept Terms
- Choose Continue to Configuration once it’s enabled
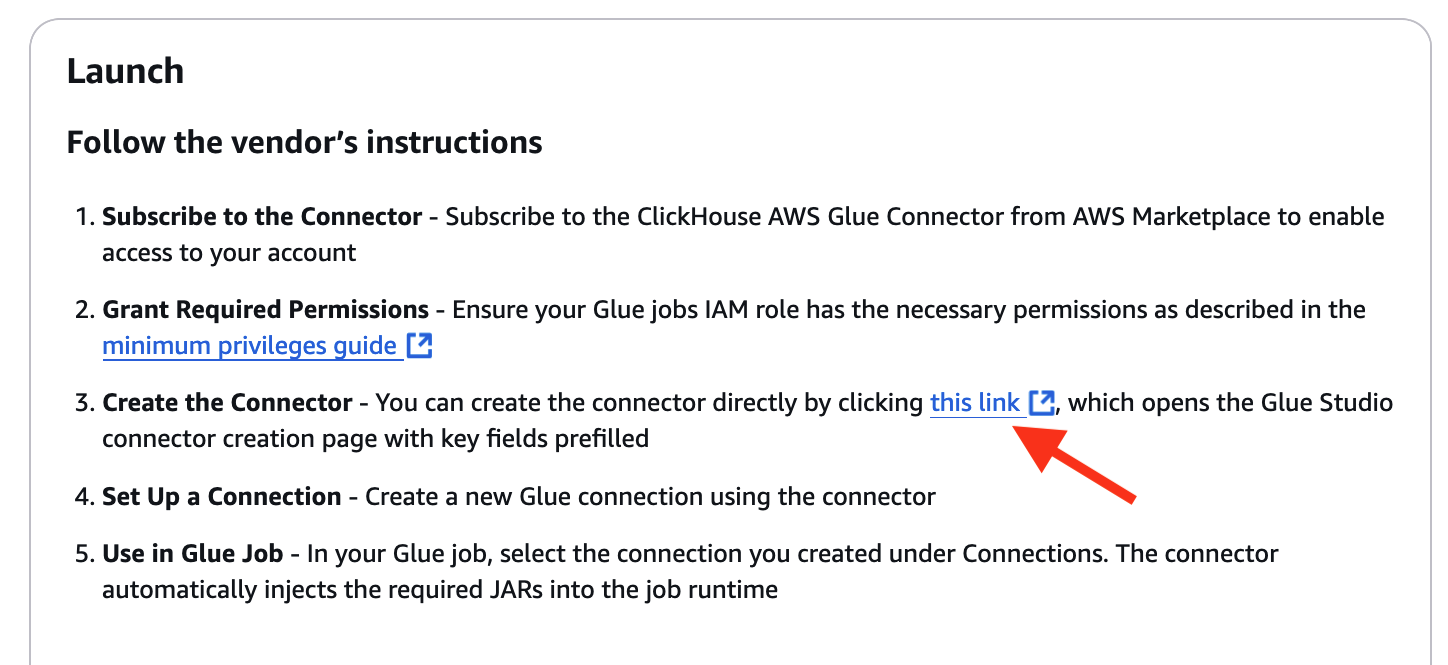
- On Follow the vendor’s instructions part in the connector instructions as below, choose the connector enabling link at step 3
Configure AWS Glue ETL Job for ClickHouse Integration
AWS Glue enables direct migration by connecting with ClickHouse Cloud on AWS through built-in connectors, allowing for seamless ETL operations. Within the Glue console, users can configure jobs to read data from S3 and write it directly to ClickHouse Cloud. Using AWS Glue Data Catalog, data in S3 can be indexed for efficient processing, while Glue’s PySpark support allows for complex data transformations, including data type conversions, to support compatibility with ClickHouse’s schema.
- Open AWS Glue in the AWS Management Console
- Navigate to Data Catalog and Connections
- Create a new connection
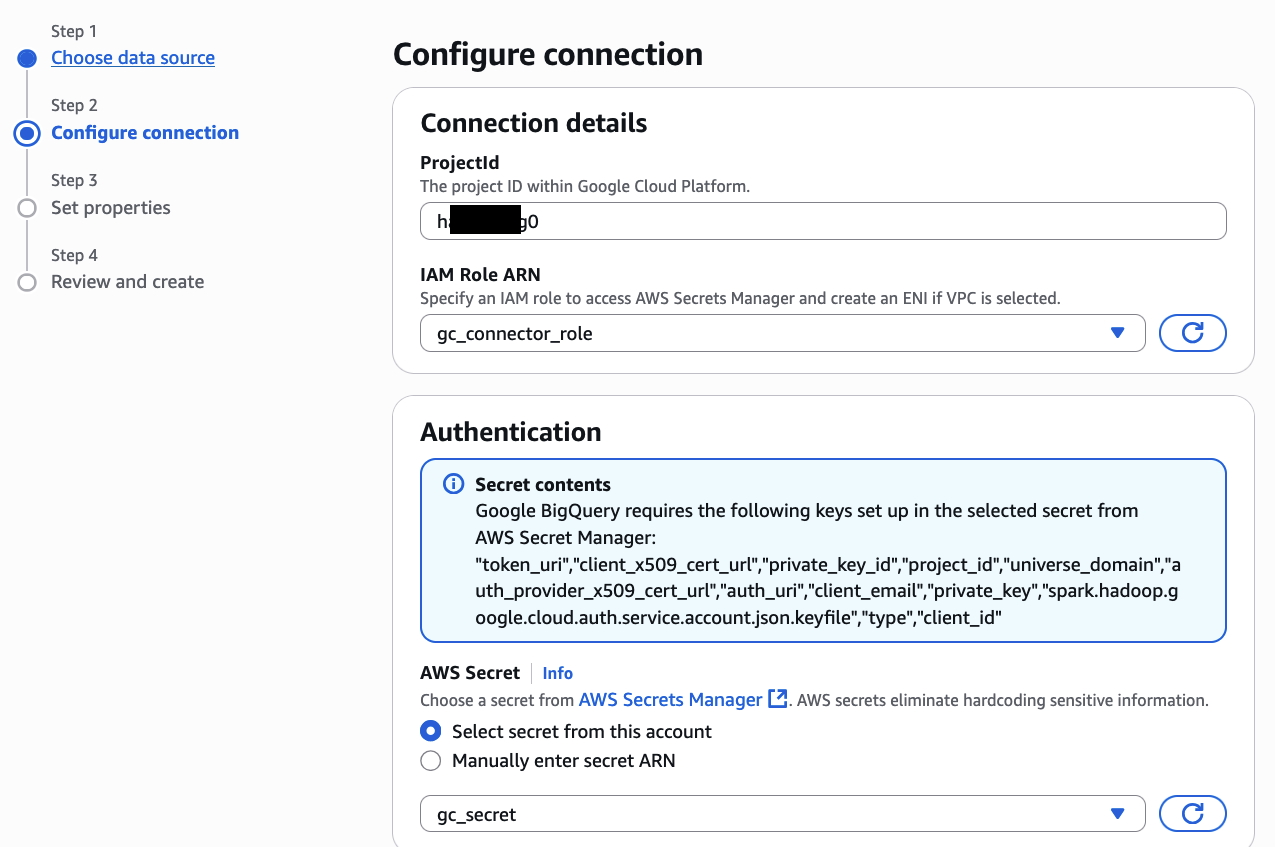
- Configure BigQuery Connection in Glue
- Prepare a Google Cloud BigQuery Environment
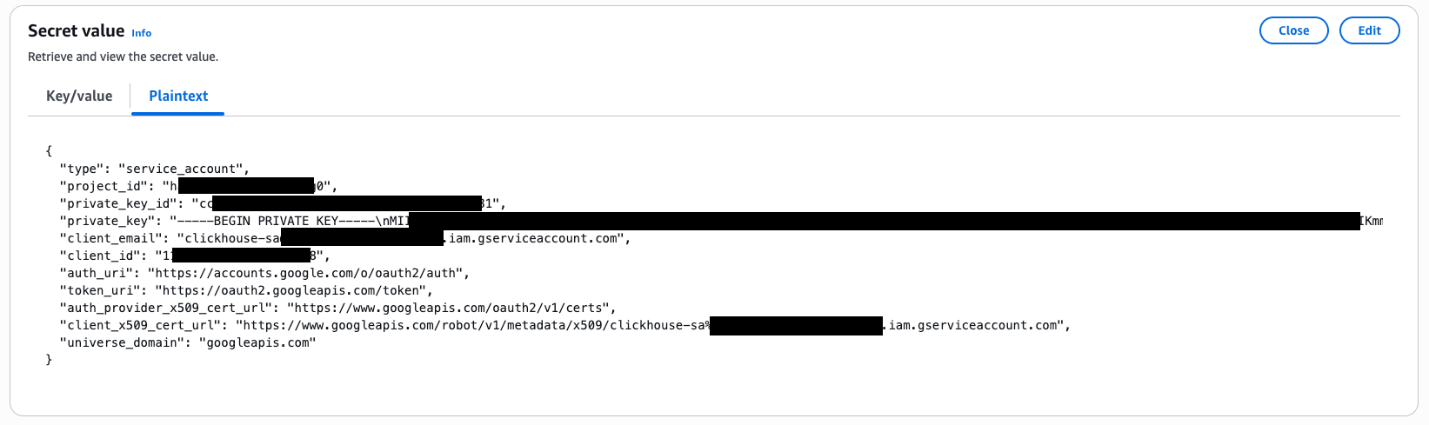
- Create and Store Google Cloud Service Account Key (JSON format) in AWS Secret Manager, you can find the details in BigQuery connections.
- The JSON Format content example is as following:
type: service_account.project_id: The ID of the GCP project.private_key_id: A unique ID for the private key within the file.private_key: The actual private key.client_email: The email address of the service account.client_id: A unique client ID associated with the service account.- auth_uri, token_uri, auth_provider_x509_cert_url
client_x509_cert_url: URLs for authentication and token exchange with Google’s identity and access management systems.universe_domain: The domain name of GCP, googleapis.com
- Create Google BigQuery Connection in AWS Glue
- Grant the IAM role associated with your AWS Glue job permission for S3, Secret Manager, Glue services, and AmazonEC2ContainerRegistryReadOnly for accessing connectors purchased from AWS Marketplace (reference doc)
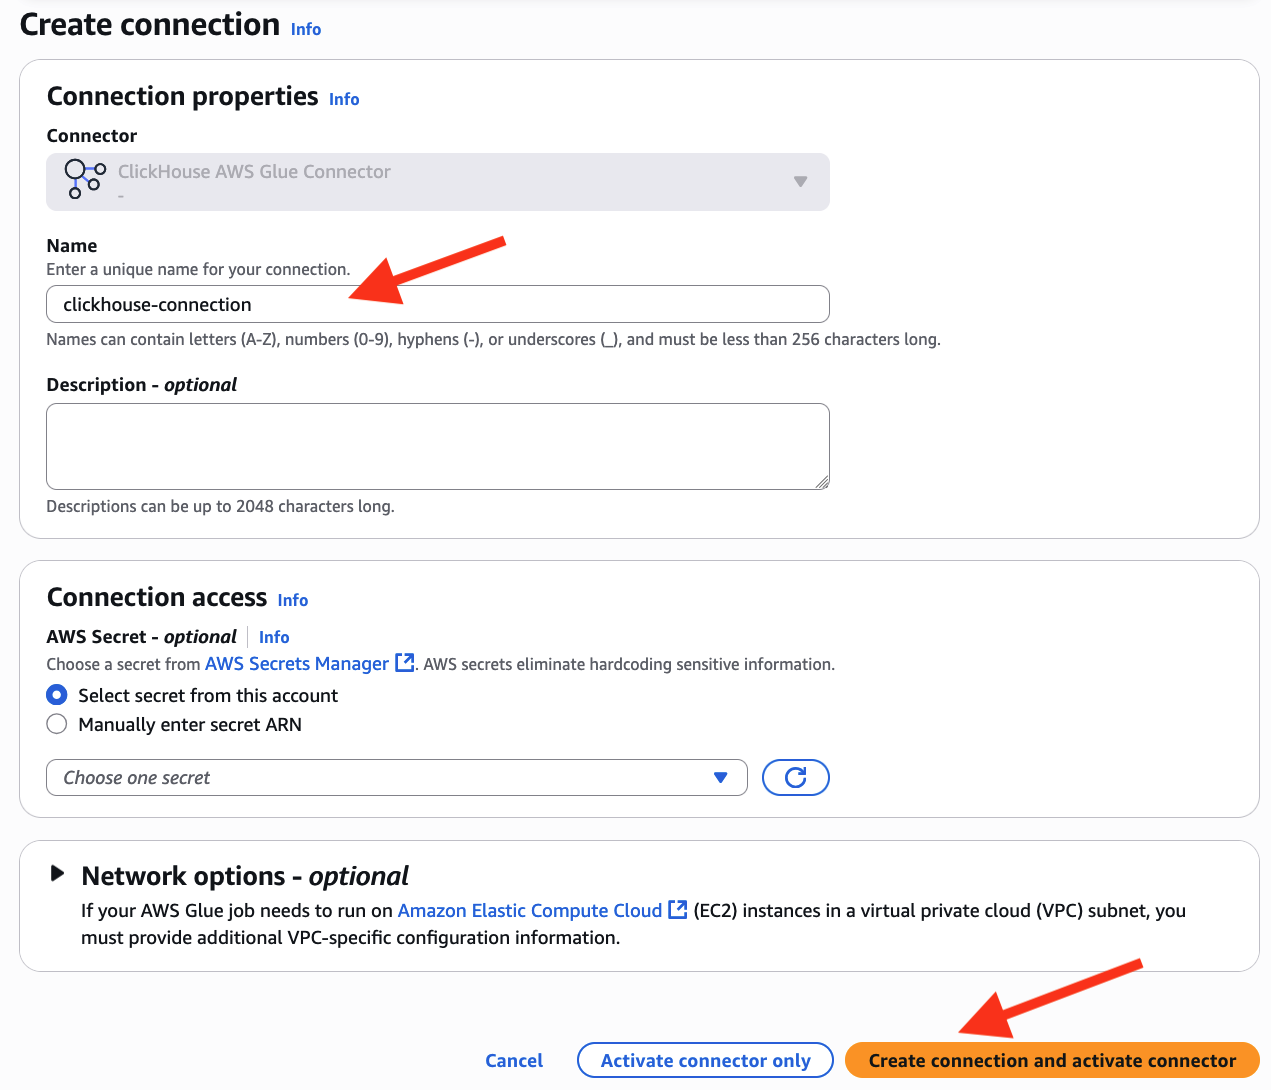
- Create ClickHouse connection in AWS Glue
- Enter
clickhouse-connectionas its connection name - Choose Create connection and activate connector
- Enter
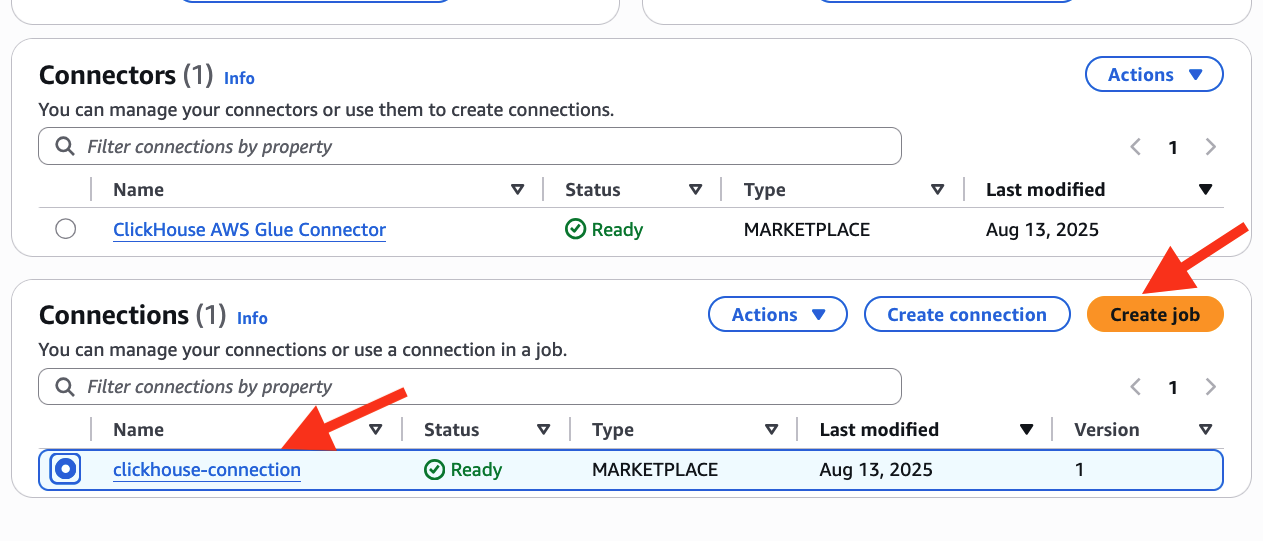
- Create a Glue job
- On the Connectors view as below, select clickhouse-connection and choose Create job
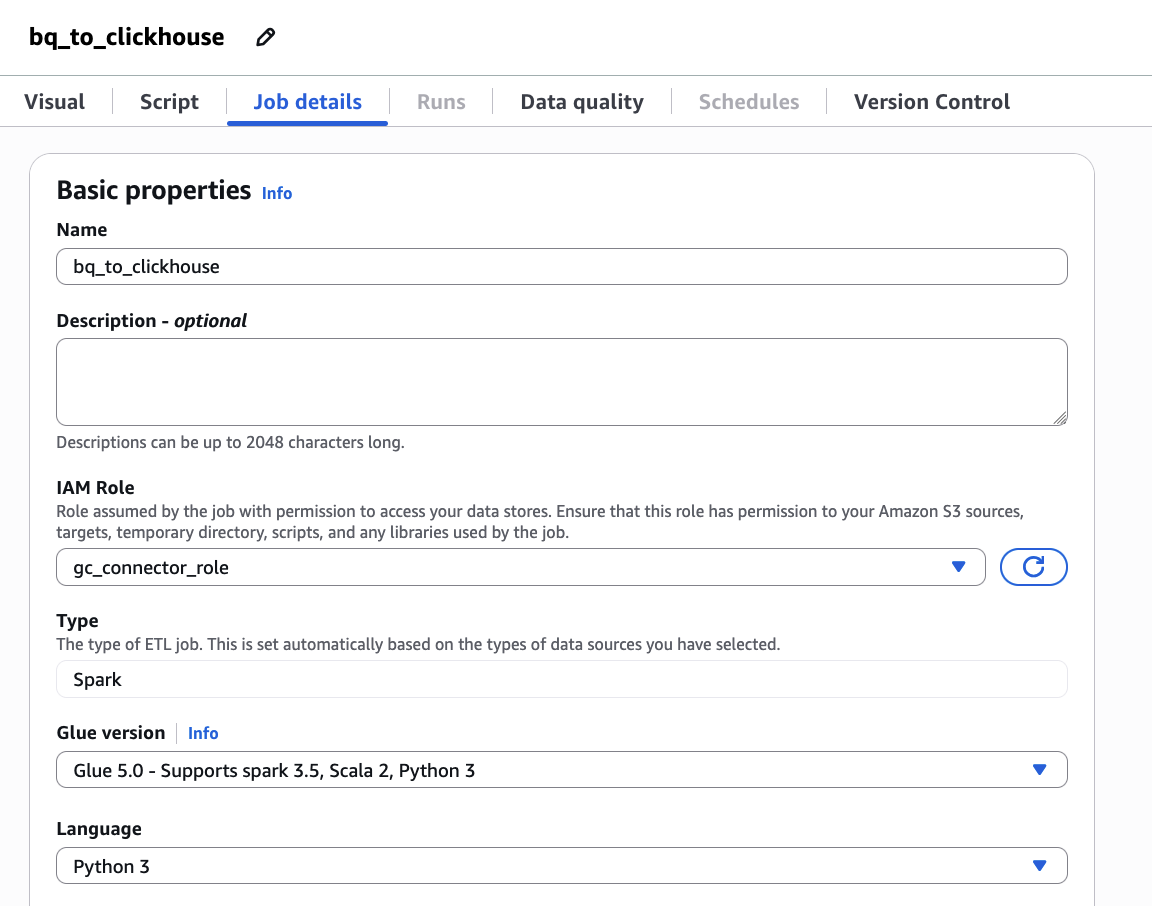
- Enter
bq_to_clickhouseas its job name and configure gc_connector_role as its IAM Role
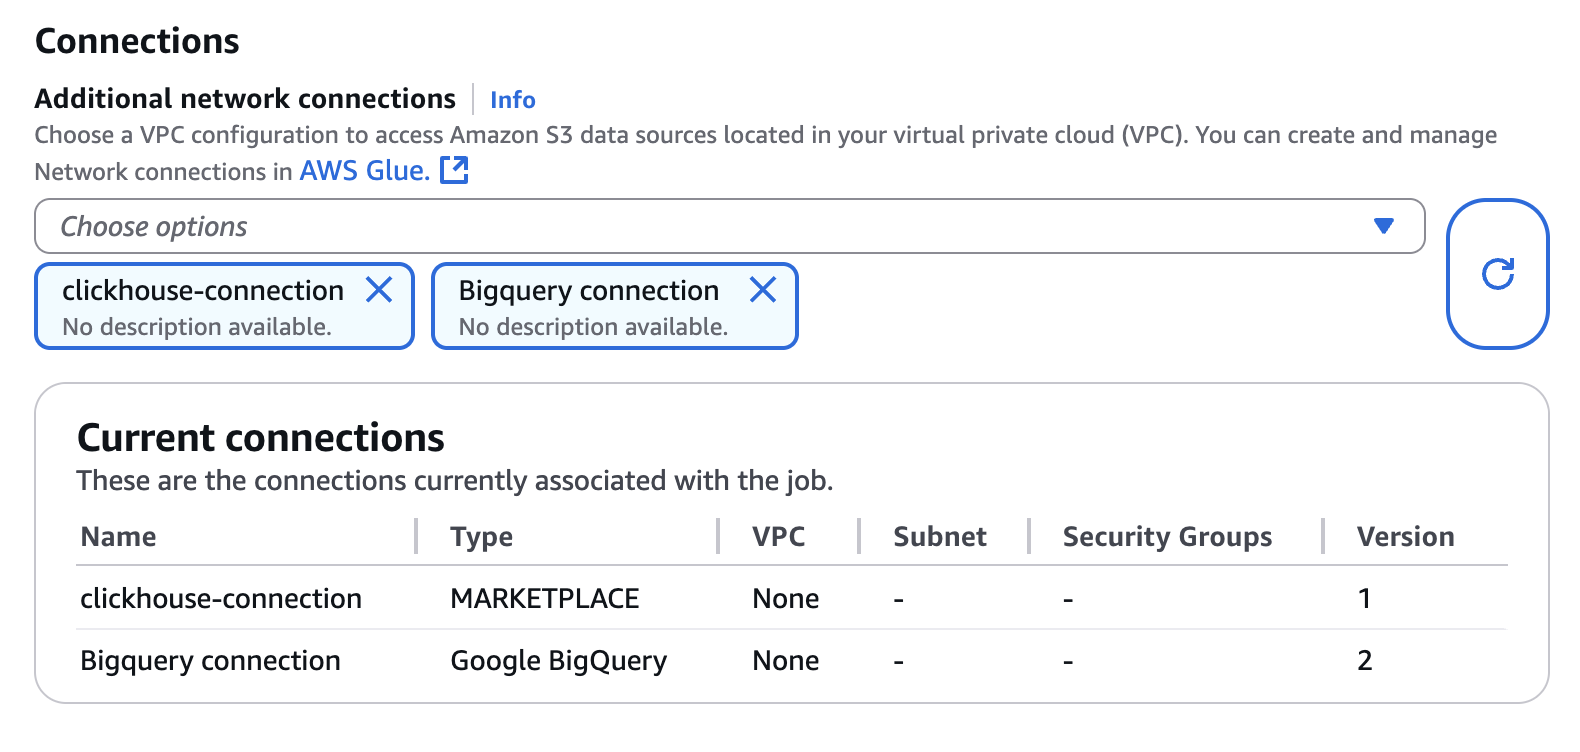
- Configure BigQuery connection and clickhouse-connection to the Connection property
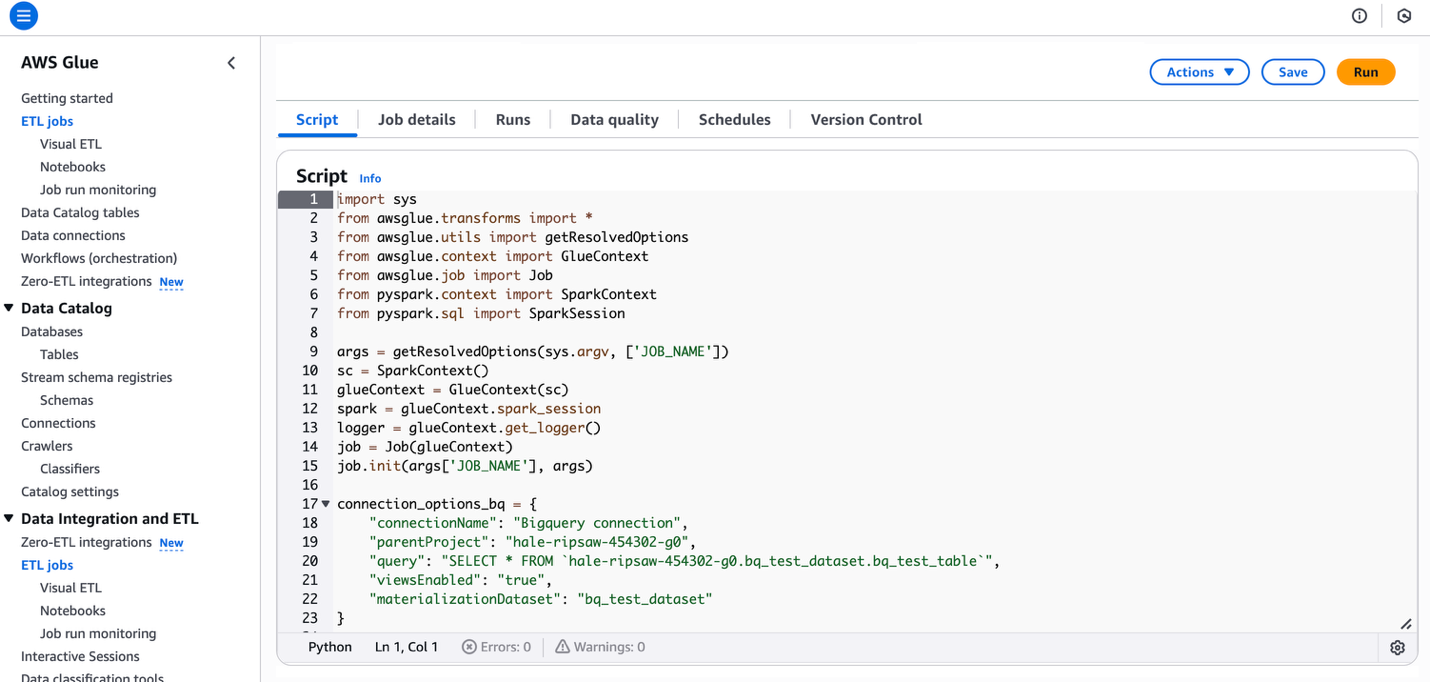
- Choose the Script tab and Edit script. Then choose Confirm on the Edit script popup view.
- Copy and paste the following code onto the script editor which can be referred from clickhouse official doc
- The source code is as following:
- Choose Save and Run on the right top of the current view
- On the Connectors view as below, select clickhouse-connection and choose Create job
Testing and Validation
Testing is crucial to verify data accuracy and performance in the new environment. After the migration completes, run data integrity checks to confirm record counts and data quality in ClickHouse Cloud. Schema validation is essential, as each data field must align correctly with ClickHouse’s format. Running performance benchmarks, such as sample queries, will help verify that ClickHouse’s setup delivers the desired speed and efficiency gains.
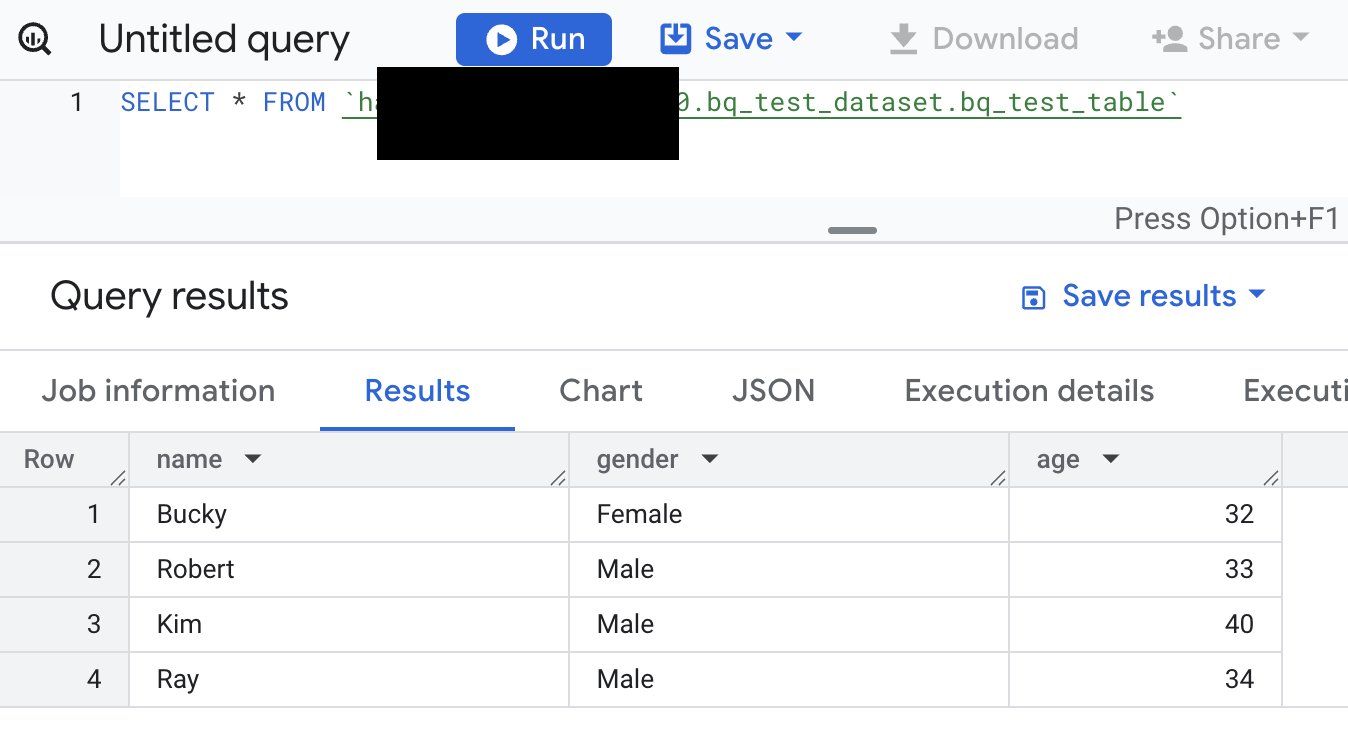
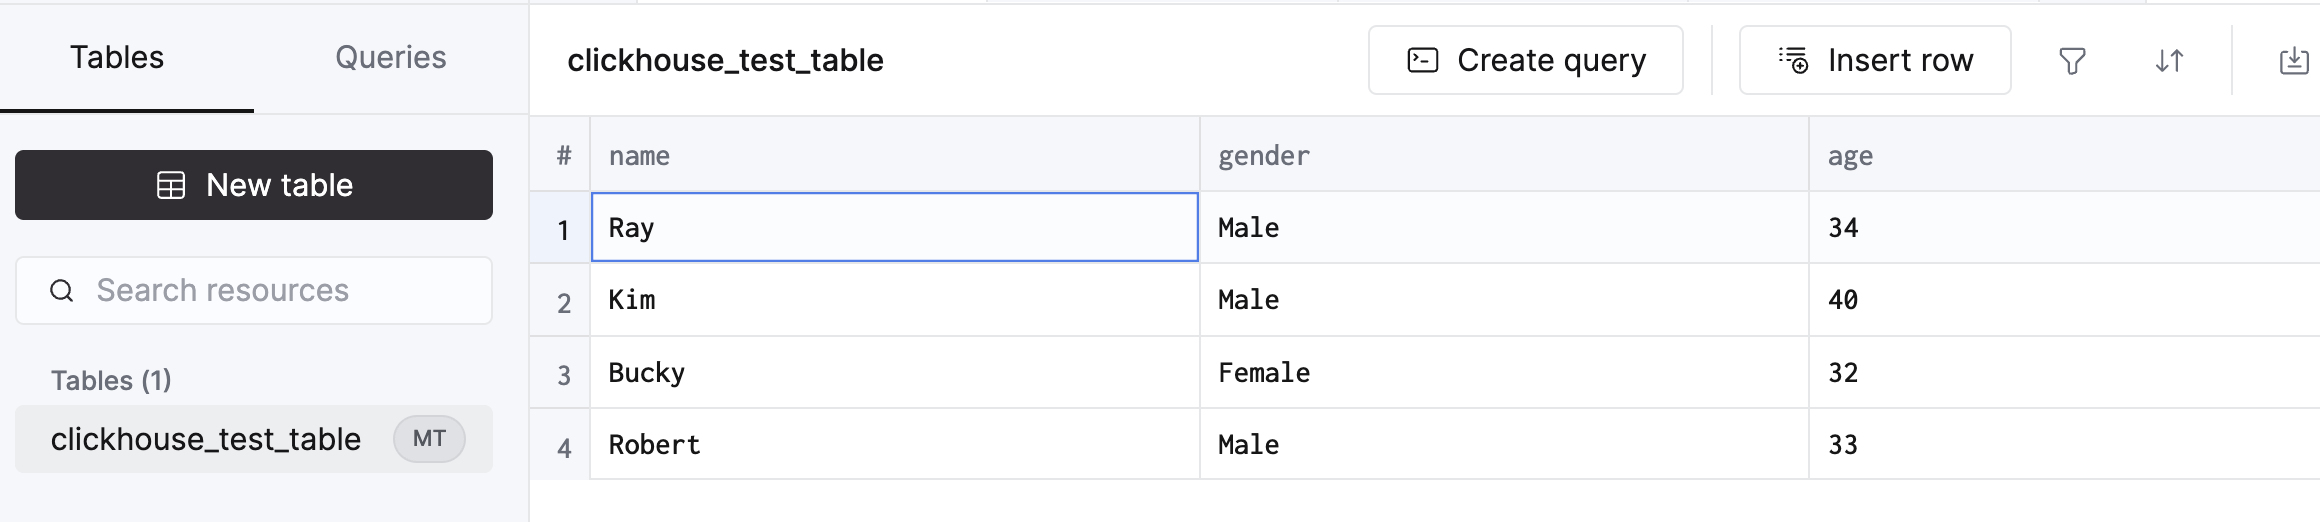
- The Schema and Data in source BigQuery and destination Clickhouse
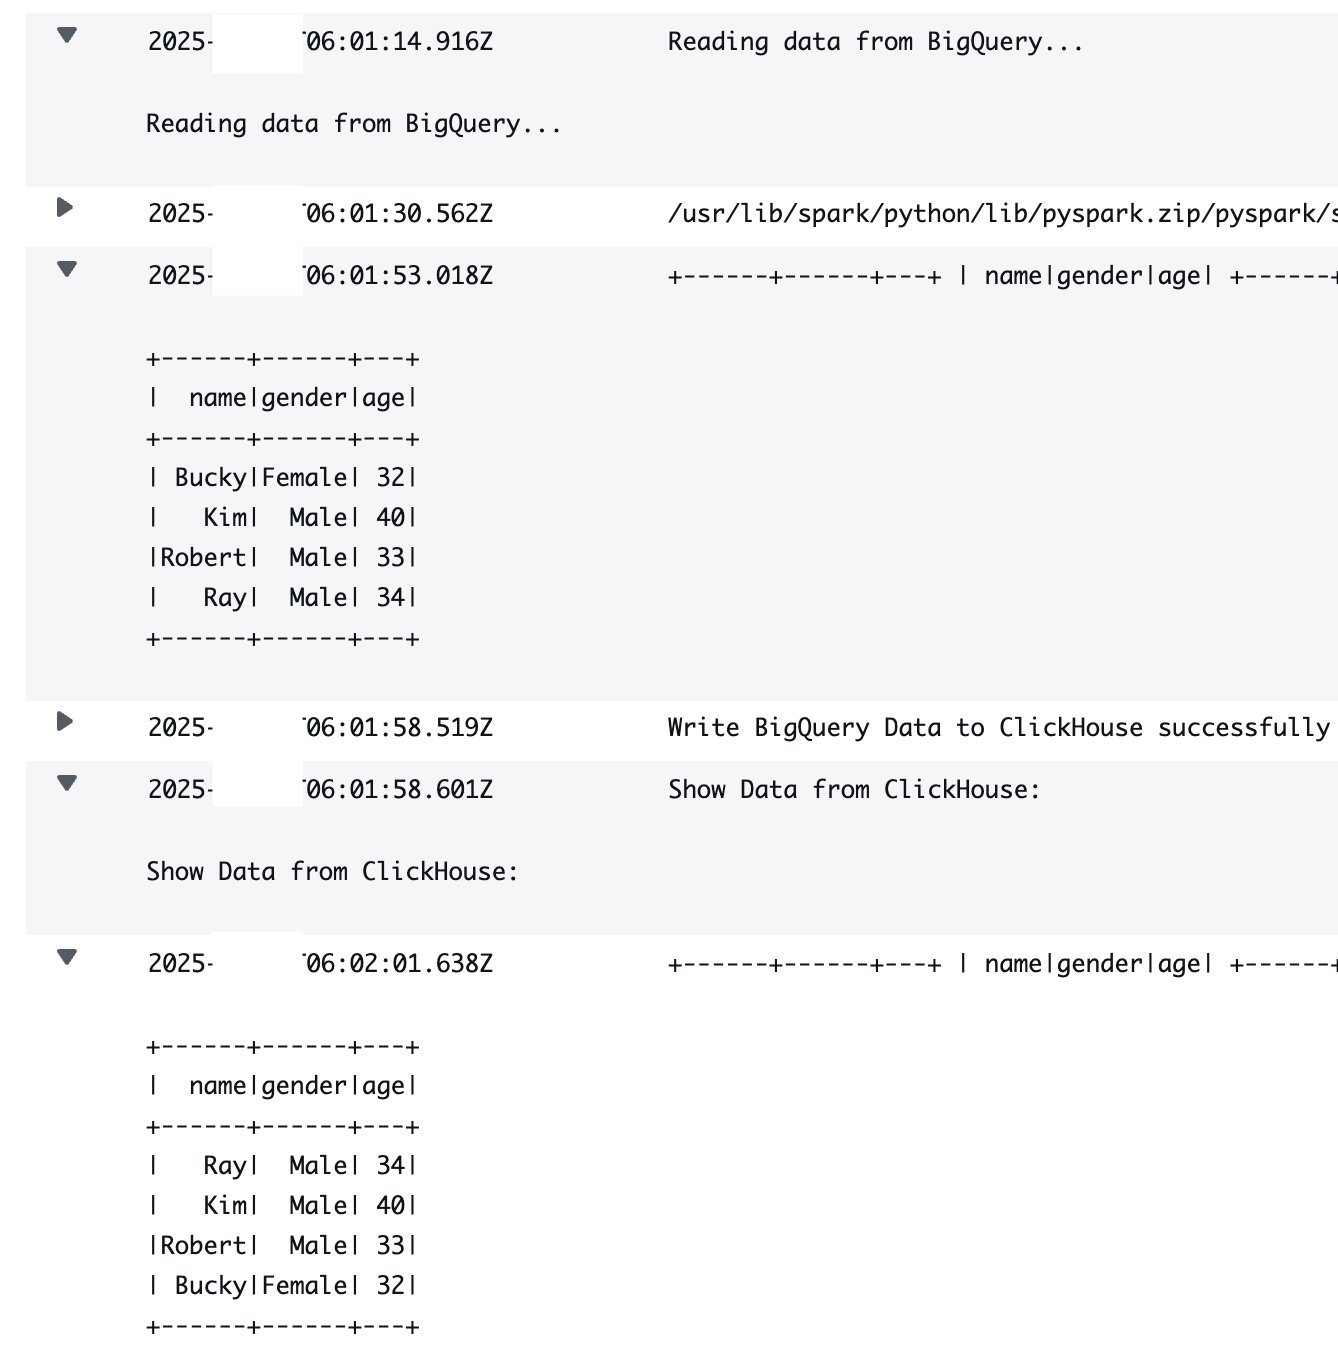
- AWS Glue output logs
Clean Up
After completing the migration, it’s important to clean up unused resources—such as BigQuery for sample data import and database resources in ClickHouse Cloud—to avoid unnecessary costs. Regarding IAM permissions, adhering to the principle of least privilege is advisable. This involves granting users and roles only the permissions necessary for their tasks and removing unnecessary permissions when they are no longer required. This approach enhances security by minimizing potential threat surfaces. Additionally, reviewing AWS Glue job costs and configurations can help identify optimization opportunities for future migrations. Monitoring overall costs and analyzing usage can reveal areas where code or configuration improvements may lead to cost savings.
Conclusion
AWS Glue ETL offers a robust and user-friendly solution for migrating data from BigQuery to ClickHouse Cloud on AWS. By utilizing Glue’s serverless architecture, organizations can perform data migrations that are efficient, secure, and cost-effective. The direct integration with ClickHouse streamlines data transfer, supporting high performance and flexibility. This migration approach is particularly well-suited for companies looking to enhance their real-time analytics capabilities on AWS.