However, because ALB log files aren’t stored in a Hive-style prefix (such as /year=2021/), the process of creating thousands of partitions using ALTER TABLE ADD PARTITION in Athena is cumbersome. This post shows a way to create and schedule an AWS Glue crawler with a Grok custom classifier that infers the schema of all ALB log files under the specified Amazon S3 prefix and populates the partition metadata (year, month, and day) automatically to the AWS Glue Data Catalog.
Prerequisites
To follow along with this post, complete the following prerequisites:
Enable access logging of the ALBs, and have the files already ingested in the specified S3 bucket.
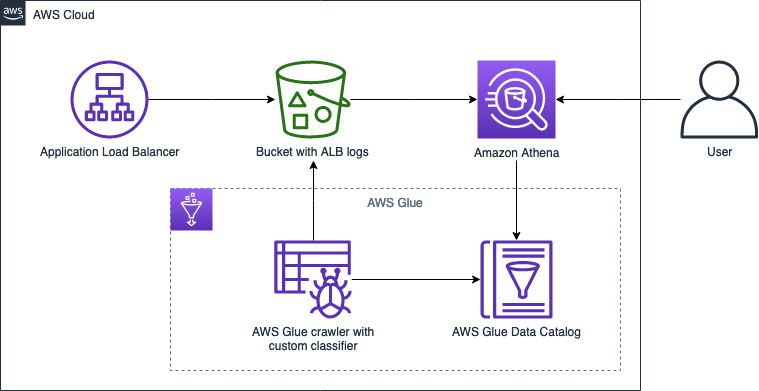
The following diagram illustrates the solution architecture.
To implement this solution, we complete the following steps:
Prepare the Grok pattern for our ALB logs, and cross-check with a Grok debugger.
Create an AWS Glue crawler with a Grok custom classifier.
Run the crawler to prepare a table with partitions in the Data Catalog.
Analyze the partitioned data using Athena and compare query speed vs. a non-partitioned table.
Prepare the Grok pattern for our ALB logs
As a preliminary step, locate the access log files on the Amazon S3 console, and manually inspect the files to observe the format and syntax. To allow an AWS Glue crawler to recognize the pattern, we need to use a Grok pattern to match against an expression and map specific parts into the corresponding fields. Approximately 100 sample Grok patterns are available in the Logstash Plugins GitHub, and we can write our own custom pattern if it’s not listed.
The following the basic syntax format for a Grok pattern %{PATTERN:FieldName}
To map the first field, the Grok pattern might look like the following code:
%{DATA:type}\s
The pattern includes the following components:
DATA maps to .*?
type is the column name
\s is the whitespace character
To map the second field, the Grok pattern might look like the following:
%{TIMESTAMP_ISO8601:time}\s
This pattern has the following elements:
TIMESTAMP_ISO8601 maps to %{YEAR}-%{MONTHNUM}-%{MONTHDAY}[T ]%{HOUR}:?%{MINUTE}(?::?%{SECOND})?%{ISO8601_TIMEZONE}?
time is the column name
\s is the whitespace character
When writing Grok patterns, we should also consider corner cases. For example, the following code is a normal case:
%{BASE10NUM:target_processing_time}\s
But when considering the possibility of null value, we should replace the pattern with the following:
%{DATA:target_processing_time}\s
When our Grok pattern is ready, we can test the Grok pattern with sample input using a third-party Grok debugger. The following pattern is a good start, but always remember to test it with the actual ALB logs.
Keep in mind that when you copy the Grok pattern from your browser, in some cases there are extra spaces in the end of the lines. Make sure to remove these extra spaces.
Create an AWS Glue crawler with a Grok custom classifier
Before you create your crawler, you first create a custom classifier. Complete the following steps:
On the AWS Glue console, under Crawler, choose Classifiers.
Choose Add classifier.
For Classifier name, enter alb-logs-classifier.
For Classifier type¸ select Grok.
For Classification, enter alb-logs.
For Grok pattern, enter the pattern from the previous section.
Choose Create.
Now you can create your crawler.
Choose Crawlers in the navigation pane.
Choose Add crawler.
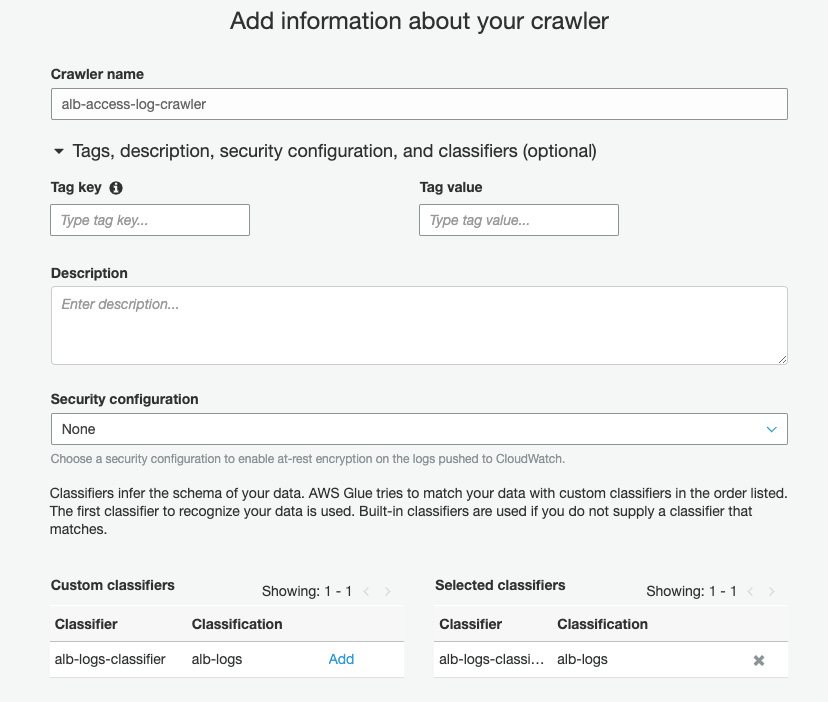
For Crawler name, enter alb-access-log-crawler.
For Selected classifiers, enter alb-logs-classifier.
Choose Next.
For Crawler source type, select Data stores.
For Repeat crawls of S3 data stores, select Crawl new folders only.
Choose Next.
For Choose a data store, choose S3.
For Crawl data in, select Specified path in my account.
For Include path, enter the path to your ALB logs (for example, s3://alb-logs-directory/AWSLogs/<ACCOUNT-ID>/elasticloadbalancing/<REGION>/).
Choose Next.
When prompted to add another data store, select No and choose Next.
Select Create an IAM role, and give it a name such as AWSGlueServiceRole-alb-logs-crawler.
For Frequency, choose Daily.
Indicate your start hour and minute.
Choose Next.
For Database, enter elb-access-log-db.
For Prefix added to tables, enter alb_logs_.
Expand Configuration options.
Select Update all new and existing partitions with metadata from the table.
Keep the other options at their default.
Choose Next.
Review your settings and choose Finish.
Run your AWS Glue crawler
Next, we run our crawler to prepare a table with partitions in the Data Catalog.
On the AWS Glue console, choose Crawlers.
Select the crawler we just created.
Choose Run crawler.
When the crawler is complete, you receive a notification indicating that a table has been created.
Next, we review and edit the schema.
Under Databases, choose Tables.
Choose the table alb_logs_<region>.
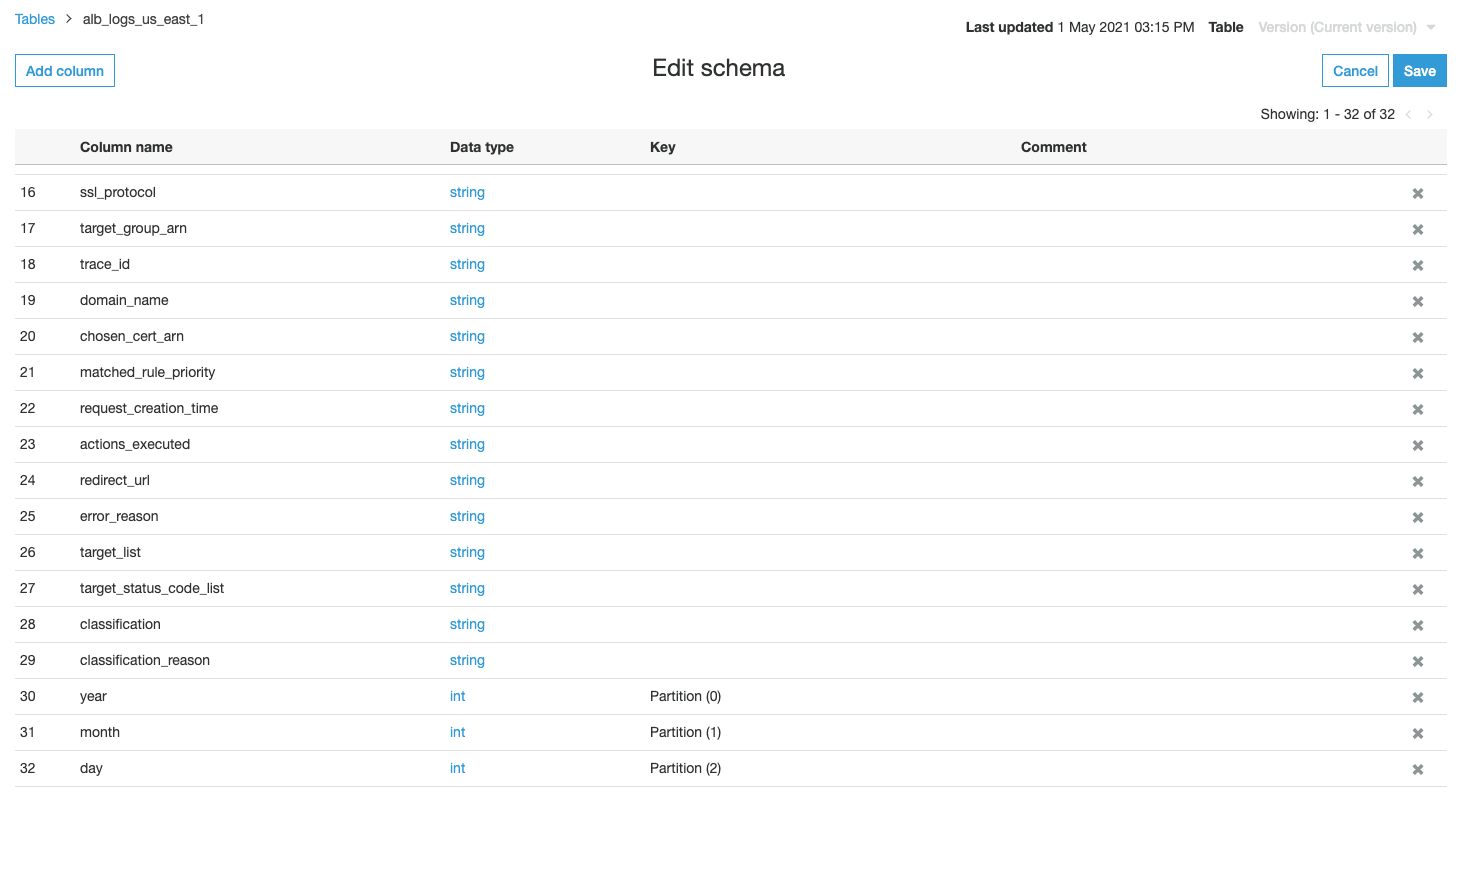
Cross-check the column name and corresponding data type.
The table has three columns: partiion_0, partition_1, and partition_2.
Choose Edit schema.
Rename the columns year, month, and day.
Choose Save.
Analyze the data using Athena
Next, we analyze our data by querying the access logs. We compare the query speed between the following tables:
Non-partitioned table – All data is treated as a single table
Partitioned table – Data is partitioned by year, month, and day
Query the non-partitioned table
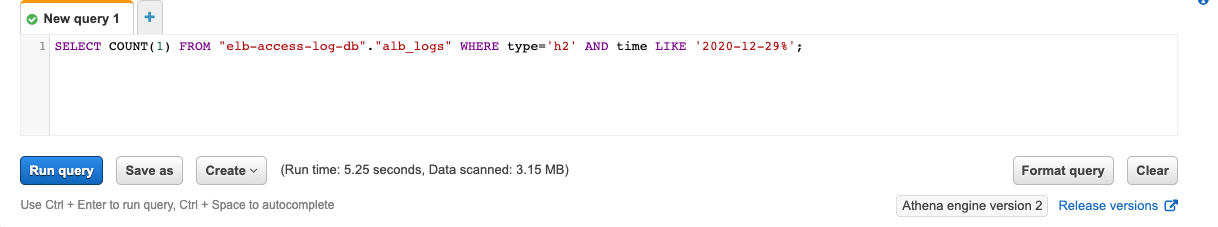
With the non-partitioned table, if we want to query access logs on a specific date, we have to write the WHERE clause using the LIKE operator because the data column was interpreted as a string. See the following code:
SELECT COUNT(1) FROM "elb-access-log-db"."alb_logs" WHERE type='h2' AND time LIKE '2020-12-29%';
The query takes 5.25 seconds to complete, with 3.15 MB data scanned.
Query the partitioned table
With the year, month, and day columns as partitions, we can use the following statement to query access logs on the same day:
SELECT COUNT(1) FROM "elb-access-log-db"."alb_logs" WHERE type='h2' AND year=2020 AND month=12 AND day=29;
This time the query takes only 1.89 seconds to complete, with 25.72 KB data scanned.
This query is faster and costs less (because less data is scanned) due to partition pruning.
Clean up
To avoid incurring future charges, delete the resources created in the Data Catalog, and delete the AWS Glue crawler.
Summary
In this post, we illustrated how to create an AWS Glue crawler that populates ALB logs metadata in the AWS Glue Data Catalog automatically with partitions by year, month, and day. With partition pruning, we can improve query performance and associated costs in Athena.
If you have questions or suggestions, please leave a comment.
About the Authors
Ray Wang is a Solutions Architect at AWS. With 8 years of experience in the IT industry, Ray is dedicated to building modern solutions on the cloud, especially in big data and machine learning. As a hungry go-getter, he passed all 12 AWS certificates to make his technical field not only deep but wide. He loves to read and watch sci-fi movies in his spare time.
Corvus Lee is a Data Lab Solutions Architect at AWS. He enjoys all kinds of data-related discussions with customers, from high-level like white boarding a data lake architecture, to the details of data modeling, writing Python/Spark code for data processing, and more.
Microservices commonly communicate with JSON over HTTP/1.1. These technologies are ubiquitous and human-readable, but they aren’t optimized for communication between dozens or hundreds of microservices.
Next-generation Web technologies, including gRPC and HTTP/2, significantly improve communication speed and efficiency between microservices. AWS offers the most compelling experience for builders implementing microservices. Moreover, the addition of HTTP/2 and gRPC support in Application Load Balancer (ALB) provides an end-to-end solution for next-generation microservices. ALBs can inspect and route gRPC calls, enabling features like health checks, access logs, and gRPC-specific metrics.
This post demonstrates .NET microservices communicating with gRPC via Application Load Balancers. The microservices run on AWS Graviton2 instances, utilizing a custom-built 64-bit Arm processor to deliver up to 40% better price/performance than x86.
Architecture Overview
Modern Tacos is a new restaurant offering delivery. Customers place orders via mobile app, then they receive real-time status updates as their order is prepared and delivered.
The tutorial includes two microservices: “Submit Order” and “Track Order”. The Submit Order service receives orders from the app, then it calls the Track Order service to initiate order tracking. The Track Order service provides streaming updates to the app as the order is prepared and delivered.
Each microservice is deployed in an Amazon EC2 Auto Scaling group. Each group is behind an ALB that routes gRPC traffic to instances in the group.
This architecture is simplified to focus on ALB and gRPC functionality. Microservices are often deployed in containers for elastic scaling, improved reliability, and efficient resource utilization. ALB, gRPC, and .NET all work equally effectively in these architectures.
Comparing gRPC and JSON for microservices
Microservices typically communicate by sending JSON data over HTTP. As a text-based format, JSON is readable, flexible, and widely compatible. However, JSON also has significant weaknesses as a data interchange format. JSON’s flexibility makes enforcing a strict API specification difficult — clients can send arbitrary or invalid data, so developers must write rigorous data validation code. Additionally, performance can suffer at scale due to JSON’s relatively high bandwidth and parsing requirements. These factors also impact performance in constrained environments, such as smartphones and IoT devices. gRPC addresses all of these issues.
gRPC is an open-source framework designed to efficiently connect services. Instead of JSON, gRPC sends messages via a compact binary format called Protocol Buffers, or protobuf. Although protobuf messages are not human-readable, they utilize less network bandwidth and are faster to encode and decode. Operating at scale, these small differences multiply to a significant performance gain.
gRPC APIs define a strict contract that is automatically enforced for all messages. Based on this contract, gRPC implementations generate client and server code libraries in multiple programming languages. This allows developers to use higher-level constructs to call services, rather than programming against “raw” HTTP requests.
gRPC also benefits from being built on HTTP/2, a major revision of the HTTP protocol. In addition to the foundational performance and efficiency improvements from HTTP/2, gRPC utilizes the new protocol to support bi-directional streaming data. Implementing real-time streaming prior to gRPC typically required a completely separate protocol (such as WebSockets) that might not be supported by every client.
Instead of working with JSON, dynamic objects, or strings, C# developers calling a gRPC service use a strongly-typed client, automatically generated from the protobuf specification. This obviates much of the boilerplate validation required by JSON APIs, and it enables developers to use rich data structures. Additionally, the generated code enables full IntelliSense support in Visual Studio.
For example, the “Submit Order” microservice executes this code in order to call the “Track Order” microservice:
using var channel = GrpcChannel.ForAddress("https://track-order.example.com");

var trackOrderClient = new TrackOrder.Protos.TrackOrder.TrackOrderClient(channel);

var reply = await trackOrderClient.StartTrackingOrderAsync(new TrackOrder.Protos.Order
{
    DeliverTo = "Address",
    LastUpdated = Timestamp.FromDateTime(DateTime.UtcNow),
    OrderId = order.OrderId,
    PlacedOn = order.PlacedOn,
    Status = TrackOrder.Protos.OrderStatus.Placed
});
This code calls the StartTrackingOrderAsync method on the Track Order client, which looks just like a local method call. The method intakes a data structure that supports rich data types like DateTime and enumerations, instead of the loosely-typed JSON. The methods and data structures are defined by the Track Order service’s protobuf specification, and the .NET gRPC tools automatically generate the client and data structure classes without requiring any developer effort.
Configuring ALB for gRPC
To make gRPC calls to targets behind an ALB, create a load balancer target group and select gRPC as the protocol version. You can do this through the AWS Management Console, AWS Command Line Interface (CLI), AWS CloudFormation, or AWS Cloud Development Kit (CDK).
This CDK code creates a gRPC target group:
var targetGroup = new ApplicationTargetGroup(this, "TargetGroup", new ApplicationTargetGroupProps
{
    Protocol = ApplicationProtocol.HTTPS,
    ProtocolVersion = ApplicationProtocolVersion.GRPC,
    Vpc = vpc,
    Targets = new IApplicationLoadBalancerTarget {...}
});
gRPC requests work with target groups utilizing HTTP/2, but the gRPC protocol enables additional features including health checks, request count metrics, access logs that differentiate gRPC requests, and gRPC-specific response headers. gRPC also works with native ALB features like stickiness, multiple load balancing algorithms, and TLS termination.
Deploy the Tutorial
The sample provisions AWS resources via the AWS Cloud Development Kit (CDK). The CDK code is provided in C# so that .NET developers can use a familiar language.
Open a terminal (such as Bash) or a PowerShell prompt.
Configure the environment variables needed by the CDK. In the sample commands below, replace AWS_ACCOUNT_ID with your numeric AWS account ID. Replace AWS_REGION with the name of the region where you will deploy the sample, such as us-east-1 or us-west-2.
If you’re using a *nix shell such as Bash, run these commands:
Throughout this tutorial, replace RED TEXT with the appropriate value.
Save the directory path where you cloned the GitHub repository. In the sample commands below, replace EXAMPLE_DIRECTORY with this path.
In your terminal or PowerShell, run these commands:
cd EXAMPLE_DIRECTORY/src/ModernTacoShop/Common/cdk
cdk bootstrap --context domain-name=PARENT_DOMAIN_NAME
cdk deploy --context domain-name=PARENT_DOMAIN_NAME
The CDK output includes the name of the S3 bucket that will store deployment packages. Save the name of this bucket. In the sample commands below, replace SHARED_BUCKET_NAME with this name.
Deploy the Track Order microservice
Compile the Track Order microservice for the Arm microarchitecture utilized by AWS Graviton2 processors. The TrackOrder.csproj file includes a target that automatically packages the compiled microservice into a ZIP file. You will upload this ZIP file to S3 for use by CodeDeploy. Next, you will utilize the CDK to deploy the microservice’s AWS infrastructure, and then install the microservice on the EC2 instance via CodeDeploy.
The CDK stack deploys these resources:
An Amazon EC2 Auto Scaling group.
An Application Load Balancer (ALB) using gRPC, targeting the Auto Scaling group and configured with microservice health checks.
A subdomain for the microservice, targeting the ALB.
A DynamoDB table used by the microservice.
CodeDeploy infrastructure to deploy the microservice to the Auto Scaling group.
The Submit Order ALB routes the gRPC call to an instance.
The Submit Order instance stores order data.
The Submit Order instance calls the Track Order service via gRPC.
The Track Order ALB routes the gRPC call to an instance.
The Track Order instance stores tracking data.
The app calls the Track Order service, which streams the order’s location during delivery.
Test the microservices
Once the CodeDeploy deployments have completed, test both microservices.
First, check the load balancers’ status. Go to Target Groups in the AWS Management Console, which will list one target group for each microservice. Click each target group, then click “Targets” in the lower details pane. Every EC2 instance in the target group should have a “healthy” status.
If a service is healthy, it will return an empty JSON object.
Run the mobile app
You will run a pre-compiled version of the app on AWS Device Farm, which lets you test on a real device without managing any infrastructure. Alternatively, compile your own version via the AndroidApp.FrontEnd project within the solution located at EXAMPLE_DIRECTORY/src/ModernTacoShop/AndroidApp/AndroidApp.sln.
Go to Device Farm in the AWS Management Console. Under “Mobile device testing projects”, click “Create a new project”. Enter “ModernTacoShop” as the project name, and click “Create Project”. In the ModernTacoShop project, click the “Remote access” tab, then click “Start a new session”. Under “Choose a device”, select the Google Pixel 3a running OS version 10, and click “Confirm and start session”.
Once the session begins, click “Upload” in the “Install applications” section. Unzip and upload the APK file located at EXAMPLE_DIRECTORY/src/ModernTacoShop/AndroidApp/com.example.modern_tacos.grpc_tacos.apk.zip, or upload an APK that you created.
Once the app has uploaded, drag up from the bottom of the device screen in order to reach the “All apps” screen. Click the ModernTacos app to launch it.
Once the app launches, enter the parent domain name in the “Domain Name” field. Click the “+” and “-“ buttons next to each type of taco in order to create your order, then click “Submit Order”. The order status will initially display as “Preparing”, and will switch to “InTransit” after about 30 seconds. The Track Order service will stream a random route to the app, updating with new position data every 5 seconds. After approximately 2 minutes, the order status will change to “Delivered” and the streaming updates will stop.
Once you’ve run a successful test, click “Stop session” in the console.
Cleaning up
To avoid incurring charges, use the cdk destroy command to delete the stacks in the reverse order that you deployed them.
In addition to deleting the stacks, you must delete the Route 53 hosted zone and the Device Farm project.
Conclusion
This post demonstrated multiple next-generation technologies for microservices, including end-to-end HTTP/2 and gRPC communication over Application Load Balancer, AWS Graviton2 processors, and .NET 5. These technologies enable builders to create microservices applications with new levels of performance and efficiency.
Matt Cline
Matt Cline is a Solutions Architect at Amazon Web Services, supporting customers in his home city of Pittsburgh PA. With a background as a full-stack developer and architect, Matt is passionate about helping customers deliver top-quality applications on AWS. Outside of work, Matt builds (and occasionally finishes) scale models and enjoys running a tabletop role-playing game for his friends.
Ulili Nhaga
Ulili Nhaga is a Cloud Application Architect at Amazon Web Services in San Diego, California. He helps customers modernize, architect, and build highly scalable cloud-native applications on AWS. Outside of work, Ulili loves playing soccer, cycling, Brazilian BBQ, and enjoying time on the beach.
The collective thoughts of the interwebz
Manage Consent
To provide the best experiences, we use technologies like cookies to store and/or access device information. Consenting to these technologies will allow us to process data such as browsing behavior or unique IDs on this site. Not consenting or withdrawing consent, may adversely affect certain features and functions.
Functional
Always active
The technical storage or access is strictly necessary for the legitimate purpose of enabling the use of a specific service explicitly requested by the subscriber or user, or for the sole purpose of carrying out the transmission of a communication over an electronic communications network.
Preferences
The technical storage or access is necessary for the legitimate purpose of storing preferences that are not requested by the subscriber or user.
Statistics
The technical storage or access that is used exclusively for statistical purposes.The technical storage or access that is used exclusively for anonymous statistical purposes. Without a subpoena, voluntary compliance on the part of your Internet Service Provider, or additional records from a third party, information stored or retrieved for this purpose alone cannot usually be used to identify you.
Marketing
The technical storage or access is required to create user profiles to send advertising, or to track the user on a website or across several websites for similar marketing purposes.


 Ray Wang is a Solutions Architect at AWS. With 8 years of experience in the IT industry, Ray is dedicated to building modern solutions on the cloud, especially in big data and machine learning. As a hungry go-getter, he passed all 12 AWS certificates to make his technical field not only deep but wide. He loves to read and watch sci-fi movies in his spare time.
 Corvus Lee is a Data Lab Solutions Architect at AWS. He enjoys all kinds of data-related discussions with customers, from high-level like white boarding a data lake architecture, to the details of data modeling, writing Python/Spark code for data processing, and more.


