Security updates for Thursday

Post Syndicated from jzb original https://lwn.net/Articles/1047220/

Security updates have been issued by AlmaLinux (bind, bind9.18, container-tools:rhel8, expat, grub2, haproxy, idm:DL1, kernel, kernel-rt, lasso, libsoup, libssh, libtiff, pcs, podman, python-kdcproxy, qt5-qt3d, redis, redis:7, runc, shadow-utils, sqlite, squid, vim, webkit2gtk3, xorg-x11-server, xorg-x11-server-Xwayland, and zziplib), Debian (chromium), Oracle (lasso and postgresql), SUSE (erlang27, ghostscript, grub2, kernel, libIex-3_4-33, python312, and sbctl), and Ubuntu (linux, linux-aws, linux-aws-5.4, linux-gcp, linux-gcp-5.4, linux-hwe-5.4,
linux-ibm, linux-ibm-5.4, linux-kvm, linux-oracle, linux-oracle-5.4,
linux-raspi, linux-raspi-5.4, linux-xilinx-zynqmp, linux-aws-6.8, linux-fips, linux-aws-fips, linux-gcp-fips, linux-oracle, and mysql-8.0, mysql-8.4).

Onboard at Cloud Speed with Rapid7 and AWS IAM Delegation

Post Syndicated from Rapid7 original https://www.rapid7.com/blog/post/cds-onboard-at-cloud-speed-with-rapid7-aws-iam-delegation

Every great product experience starts with a smooth beginning. But in the world of cloud security, onboarding can sometimes feel like an obstacle course. Detailed fine-grained Identity and Access Management (IAM) configurations, lengthy deployment steps, and manual permission setups can turn what should be an exciting first impression into a tedious chore.

That’s changing. Rapid7 has enhanced the onboarding experience for Exposure Command and InsightCloudSec by integrating with AWS IAM temporary delegation – a new AWS capability that lets customers approve deployment access directly in the AWS console. The result? A faster, simpler, and more secure path to getting up and running in the cloud.

Why onboarding matters – and why it often fails  

The first minutes with a new platform matter. It’s the difference between “this is amazing” and “I’ll come back to it later.”

In cloud environments, setup usually involves multiple AWS services – compute, storage, networking, access management – all of which must be configured precisely to maintain security. Traditionally, customers have had to manually create IAM roles, adjust trust relationships, and fine-tune permissions just to let a partner solution like Rapid7 deploy resources.

It’s not just time-consuming; it’s error-prone. Misconfigured roles can cause deployment failures or unnecessary security risk. Support teams spend hours walking customers through the process, and the friction delays time-to-value. When scaling across dozens or hundreds of AWS accounts, those delays multiply fast.

Meet AWS IAM temporary delegation: What it is and why it matters

AWS IAM temporary delegation simplifies the entire setup journey. It allows trusted partners like Rapid7 to automate deployment securely – but only after the customer grants explicit, time-bound approval.

Here’s how it works: When you initiate onboarding from within Rapid7’s interface, you’re redirected to the AWS console. There, you can review the exact permissions Rapid7 is requesting and how long access will last. Once approved, AWS provides Rapid7 with temporary credentials to complete the setup. After the time window expires, that access ends automatically.

No long-term IAM keys, no manual role creation, and no guesswork. Customers stay in control, with full visibility and auditability. It’s automation with accountability built in.

How Rapid7 is putting this into action

With the latest release, Rapid7 has integrated this capability directly into Exposure Command and InsightCloudSec, creating a guided onboarding experience that happens almost entirely inside the Rapid7 interface.

Here’s the new flow:

  1. Customers configure deployment options in Rapid7’s InsightCloudSec environment.
  2. A temporary delegation request appears via an AWS console pop-up.
  3. An authorized AWS user reviews and approves the request.
  4. Rapid7 automatically deploys the necessary resources on the customer’s behalf.

This streamlined workflow eliminates dozens of manual steps and reduces onboarding time from hours to minutes. It’s faster, simpler, and still fully aligned with AWS’s strict security model. 

Speed, simplicity, and security

This integration hits the sweet spot between automation and trust:

  • Speed: Customers can start realizing value from Rapid7’s cloud security solutions in minutes instead of days.

  • Simplicity: The UI-driven process means no wrestling with IAM policies or JSON templates.

  • Security: Access is temporary and permission-scoped. Customers retain complete oversight through the AWS console and CloudTrail logs.

For organizations with compliance or security governance requirements, this is the ideal balance: operational efficiency without compromising control.

Beyond onboarding: What this says about Rapid7 and AWS alignment

This update isn’t just about faster onboarding. It’s a glimpse into Rapid7’s broader partnership with AWS. Rapid7 has long been an AWS Advanced Tier Partner, building integrations that help customers manage security across cloud-native environments. From leveraging AWS telemetry in MXDR to integrating with AWS services like CloudTrail and GuardDuty, Rapid7’s platform has been designed to meet customers where they already operate within AWS.

By adopting AWS IAM temporary delegation early, Rapid7 reinforces its commitment to cloud-first innovation and shared responsibility principles. Customers get the assurance that their onboarding, deployment, and operations all align with AWS security best practices. 

What this means for customers

If you’re deploying Rapid7 Exposure Command (Advanced or Ultimate) or InsightCloudSec on AWS, here’s what to expect:

  • A guided onboarding experience that automates AWS resource setup.
  • A faster, less error-prone workflow that still keeps you in control.
  • The ability for authorized users to approve temporary access requests directly in the AWS console.

Before onboarding, make sure someone in your organization has the permissions to approve delegation requests. After deployment, review your CloudTrail logs as part of normal governance;  you’ll see every action logged and time-bounded.

Value from day one

Onboarding shouldn’t be a hurdle. And now with AWS IAM Temporary Delegation and Rapid7’s enhanced experience, it no longer is. Together, AWS and Rapid7 have reimagined what “getting started” looks like in the cloud – faster, more intuitive, and just as secure as you need it to be.

It’s one more way Rapid7 is helping organizations unlock value from day one, while staying aligned with AWS’s best practices for identity, access, and automation.

See how easy secure onboarding can be.Explore Rapid7’s listings for Exposure Command and InsightCloudSec straight from the AWS Marketplace.

Scam USPS and E-Z Pass Texts and Websites

Post Syndicated from Bruce Schneier original https://www.schneier.com/blog/archives/2025/11/scam-usps-and-e-z-pass-texts-and-websites.html

Google has filed a complaint in court that details the scam:

In a complaint filed Wednesday, the tech giant accused “a cybercriminal group in China” of selling “phishing for dummies” kits. The kits help unsavvy fraudsters easily “execute a large-scale phishing campaign,” tricking hordes of unsuspecting people into “disclosing sensitive information like passwords, credit card numbers, or banking information, often by impersonating well-known brands, government agencies, or even people the victim knows.”

These branded “Lighthouse” kits offer two versions of software, depending on whether bad actors want to launch SMS and e-commerce scams. “Members may subscribe to weekly, monthly, seasonal, annual, or permanent licenses,” Google alleged. Kits include “hundreds of templates for fake websites, domain set-up tools for those fake websites, and other features designed to dupe victims into believing they are entering sensitive information on a legitimate website.”

Google’s filing said the scams often begin with a text claiming that a toll fee is overdue or a small fee must be paid to redeliver a package. Other times they appear as ads—­sometimes even Google ads, until Google detected and suspended accounts—­luring victims by mimicking popular brands. Anyone who clicks will be redirected to a website to input sensitive information; the sites often claim to accept payments from trusted wallets like Google Pay.

Сълзичка – паричка. Журналистическа етика за оплакване

Post Syndicated from Светла Енчева original https://www.toest.bg/sulzichka-parichka-zhurnalisticheska-etika-za-oplakvane/

Сълзичка – паричка. Журналистическа етика за оплакване

Преди близо 15 години се самоуби най-добрият ми приятел. Смъртта му предизвика медиен интерес – държавен служител, ерудит, с много последователи в Twitter, отнема живота си по особено мъчителен начин, ако използваме юридическото клише. Вестник „Труд“ публикува статия, която наред с хвалебствия за личността на починалия, с представянето на предположения като факти (включително в заглавието) и с фриволни интерпретации на туитове на различни хора и публикация от блога ми съдържаше скрупульозно описани детайли. Например с какво точно се е самоубил, конкретните стъпки на изпълнението – първо, второ, трето. Че по всяка вероятност е припаднал от болка.

Какъв е проблемът?

Представете си да четете такива подробности за много близък човек, с когото само преди три седмици сте посрещнали Нова година заедно и чиято смърт е най-големият шок в досегашния ви живот. Представете си и какви идеи би могъл да почерпи от статията някой, който обмисля как да се самоубие по възможно най-ужасен начин.

Така в една-единствена статия са нарушени няколко принципа от Етичния кодекс на българските медии, между които:

1.1.4 Ясно ще разграничаваме фактите от коментарите и предположенията.

2.6.4 Ще се въздържаме от възхваляващо или придаващо излишна сензационност отразяване на престъпления, насилие и жестокост.

2.8.1 При съобщаване за самоубийства, ще избягваме да огласяваме подробности за начина, по който са извършени, за да ограничим риска от подражание.

Не изключение, а правило

Ще ми се да можех да кажа, че 15 години по-късно подобно отношение към правилата на професията може да се види само в жълто-кафявите медии (каквато „Труд“ не беше навремето), но уви. Нарушаването на стандартите на журналистическата етика в името на „по-сочни“ материали се среща толкова често, че човек остава с впечатлението, че то е нормата, не отклонението от нея. Че е окей да наричаш обвиняемия престъпник, да даваш да се разбере адресът на заподозрени или пострадали от престъпления – било като го казваш, било като показваш дома им. И т.н.

По-сериозният проблем е, че поколения журналисти биват индоктринирани в тази „норма“. Като студенти те може да са учили, че бъдещата им професия има стандарти и трябва да ги спазват. Вече като работещи може да са участвали в обучения, семинари и пр., свързани по един или друг начин с темата за етичното отразяване на събитията. Важното обаче е какво ръководителите им изискват от тях. Моя позната, работила в една от големите телевизии, разказва, че

още като прохождаща журналистка е била посветена в популярния телевизионерски принцип „сълзичка – паричка“.

Това ще рече: печелившо е да се снимат в близък план плачещи хора под въздействието на силни емоции. Например пострадали от природни бедствия или близки на загинали, родители на болни деца… Сещате се за още доста примери. Познатата ми журналистка описва ситуацията така:

Проблемът е, че ние работим в телевизии, при които всичко е рейтинг, и те ни формират като професионалисти, които после възпроизвеждат навсякъде този модел. […] А балансът между това да си адекватен, все пак гледаем и интересен, защото си комерсиална медия, и опазването на личното пространство на хората, е ужасно крехък.

Не е задължително някой да е работил в телевизия, за да възпроизвежда модела „сълзичка – паричка“. Тъй като са печеливши, телевизионерските прийоми се прихващат и от останалите видове медии.

Безкритичност към институции и източници

Ако се замислим например за репортажите за наводнения, които сме гледали, все едно дали в село Бисер през 2012 г., или по-скорошните в Царево и Елените, те основно се концентрират върху мъката на хора, загубили свои близки или домовете си, а не върху отговорността на институциите. Много сълзички – много парички. Покрай това минава новината, че виновни за тези трагедии така и не се намират.

Безкритичността към институциите се изразява и в друго – огласяване на всичко, което кажат, дори това огласяване да противоречи на журналистическата етика. Било чрез възпроизвеждане на прессъобщения едно към едно, било чрез активно търсене на информация от разследващи органи, болници и пр.

Липса на критичност се наблюдава не само по отношение на институции, а и спрямо експерти и публични личности, често канени в медиите. Но понякога и към обикновени хора, озовали се пред микрофона. При случай на домашно насилие, заснет на видео и разпространен в публичното пространство, пред bTV се съгласява да говори единствено майката на заподозрения. Тя твърди, че синът ѝ нищо не е направил, а снаха ѝ е виновна. Това се излъчва без коментар – имаме клип с насилие върху жена, имаме и твърдение, че побой няма, а пострадалата е лоша. Така де – всички гледни точки. 

В същия репортаж журналистката е пред дома на пострадалите, звъни на вратата и (каква изненада) никой не ѝ отваря. „Случката се е разиграла в ето този апартамент на метри от центъра на Бобов дол“, казва тя, а камерата показва вратата на жилището и номера му. Следва замъглен стопкадър от видеото с насилието, което репортерката казва, че няма да покажат от етични причини. Но се вижда, че мъж е притиснал жена в ъгъла и замахва към нея. В следващия момент отново виждаме журналистката пред апартамента в Бобов дол. Този път обаче тя чука на вратата и вика името на пострадалата жена, от която явно се очаква да излезе и да обясни пред камерата и микрофона „как се чувства“.

Етични проблеми при отразяването на случаи с деца

Може да се приведат множество примери за нарушаването на журналистическата етика, но ще се спра конкретно върху темата за отразяването на случаи с деца, защото то се подчинява на строги стандарти за защита на неприкосновеността на личния им живот. Не само по силата на гилдийна саморегулация, а и на Закона за закрила на детето. А той постановява, че не могат да се разгласяват сведения и данни за дете без съгласието на родителите или на законните му представители. Както и на самото дете, ако е навършило 14 години, а ако става въпрос за съдебно производство – 10 години.

Децата в институции са особено уязвими, най-вече когато законните им представители не са на тяхна страна, а може и да упражняват насилие върху тях. „Разкриването на самоличността им – директно или чрез описание – е недопустимо и представлява допълнителна форма на насилие“, заявяват от БХК по повод на отразяването на случаи на насилие, включително сексуално, върху момчета от Социално-педагогическия интернат в с. Варненци.

Законът беше нарушен с лека ръка наскоро,

когато 16-годишният син на евродепутата и бивш председател на ДСБ Радан Кънев беше арестуван заради притежание на марихуана в минимално количество. МВР разпространи прессъобщение, в което разкри самоличността на детето. Асоциацията на европейските журналисти – България посочи, че в случая Вътрешното министерство нарушава не само българското законодателство, а и Конвенцията на ООН за правата на детето. И все пак случаят беше широко отразен – заедно с личните данни – дори от медии с претенцията да отстояват висок професионализъм.

Особено интересно постъпи „Дневник“, който в рамките на една и съща статия каза, че името на момчето не трябва да се разпространява, защото става дума за висящо разследване срещу непълнолетен, и няколко реда по-надолу спомена името му, и то в акцент. Не слагам линк към материала, за да не мултиплицирам проблема.

На ръба на журналистическата етика

е и журналистическото разследване на Тина Ивайлова за сексуално насилие над 4-годишно момиченце в детска градина в гр. Каблешково. Не поставям под въпрос значимостта му – чак след него случаят придобива гласност и институциите се виждат принудени да се задействат.

За тази гласност обаче пострадалото дете и семейството му плащат висока цена. Смелостта на родителите да излязат от анонимност и да застанат пред камерата с имената и лицата си води дотам, че детето много лесно може да бъде разпознато, макар името му да не се споменава и лицето му да не се вижда ясно. А историята ще продължава да живее в интернет – и когато момичето порасне.

„Отговорните представители на медиите трябва да съзнават, че възрастните невинаги са наясно кой е най-добрият интерес на детето“, се казва в пътеводителя на УНИЦЕФ за етично отразяване на децата в медиите.

В опита си да постигне ефект материалът нарушава някои от принципите на Етичния кодекс на българските медии – например че журналистите не бива да засилват мъката на пострадалите от престъпление. А Ивайлова прилага принципа „сълзичка – паричка“ – задава на бащата въпроса дали често плаче, като в същото време камерата снима насълзените му очи в близък план. И го пита във връзка със съдебномедицинската експертиза, констатираща разкъсан химен на детето: „Какво е за един баща да види такъв документ от гинеколог?“.

Етически смущаващи са и някои реплики на директорката на психиатрията в Нови Искър Цветеслава Гълъбова. От висотата на професионалната си позиция тя отправя квалификации и свежда проблема със сексуалното насилие до остарялото понятие за моминска чест:

Как ще обясним на това момиче, когато порасне след години, че то няма онова, което се нарича девическа чест, и не е отнето при любовен акт с любим човек, а от една извратена лелка?

По-сериозният проблем е, че ръководителката на голяма психиатрична болница призовава към саморазправа, след като Ивайлова я приканва да излезе от професионалната си роля, заради която я е поканила. На въпроса как би реагирала, ако внукът ѝ преживее сексуално насилие, тя отговаря: 

Звучи ужасно, но не, не бих чакала правосъдието.

От другата страна на сълзичката

Освен да носи рейтинг, кликове и парички, вторачването в човешката мъка изпълнява и друга функция – отмества обществения поглед от темата за отговорността. Сълзите на хората са и по-безопасни за медиите от задаването на въпроси за невзети мерки, допуснати грешки, сбъркани приоритети. Не че в някои случаи няма и сълзи, и въпроси.

По същия начин легитимният гняв на хората, често намиращ израз в желание за по-строги наказания, отвлича вниманието от неработещото правосъдие, липсата на превенция, корупцията, безразличието. В резултат се приемат закони за повече години затвор и по-високи глоби, които са все така неработещи.

Сълзите затрогват, когато ги гледаме. Но когато излизат от нашите очи, а болката ни се експлоатира в името на рейтинга, кликовете и печалбата, никак не е трогателно. Чувството е на гняв, безпомощност, унижение – едновременно. Не пожелавам на журналистите, прилагащи принципа „сълзичка – паричка“, да изпитат на гърба си преживяванията на някои от героите на репортажите си, нито това, което ми беше след прочитането на статията на „Труд“, с която започнах. Малко емпатия обаче би била от полза. Не сълзлива, а с уважение.

На второ четене: „Изповедите на един буржоа“

Post Syndicated from Стефан Иванов original https://www.toest.bg/na-vtoro-chetene-izpovedite-na-edin-burzhoa/

„Изповедите на един буржоа. Исках да мълча“ от Шандор Мараи

На второ четене: „Изповедите на един буржоа“

превод от унгарски Мартин Христов, София: изд. „Ерго“, 2022

Когато човек отвори „Изповедите на един буржоа“, той попада не толкова в роман, колкото в един литературен кабинет на морала, където авторът разрязва тъканта на света, в който е живял, със същата прецизност, с която хирург разрязва собственото си тяло пред студенти.

Това е книга, представяща се като изповед, но под повърхността ѝ се движи нещо по-дълбоко. Това е хроника на разпад, опит за реконструкция на изгубена памет и същевременно остър обвинителен акт към една социална форма, която се оказва неспособна да удържи света си. Тонът на Мараи ту е горчив, ту е самоироничен. Ту прилича на финалната реплика на разочарован буржоа, който от години знае истината, но не е имал сили да я изрече. Ту на по-късен постмодернист, който с тънък скалпел демонстрира колко крехки са нашите институции, ритуали и самозаблуди.

Една от големите теми на текста е разпадането на буржоазната вселена. И не само като икономическа структура, а именно като морална екосистема.

Мараи описва света на своето детство и зрелост като дневник на привидно силни институции, сред които са кооперации, банки, семейни традиции и култура на обноските. Той обаче наблюдава как тези структури се пропукват отвътре, как ритуалите се превръщат в празни жестове, а езикът на благоприличието – в покривало на интелектуална пасивност и социална вина.

Буржоата на Мараи е едновременно наследник и затворник на собствените си навици. Той е човек, който се е доверил на правилата на порядъка, за да открие, че истерията на историята не се впечатлява от добри маниери. Разпадът в книгата не е спектакъл, а процес. Тих, постепенен и почти биологичен, сякаш става дума за вид, който се опитва да се адаптира към нов климат и установява, че е загубил инстинктите си.

Тук Мараи достига до втората си голяма тема. Мълчанието и вината.

Той разбира изповедта като акт на морално възстановяване, като отказ да продължиш да бъдеш невинен по подразбиране. Изповедта е неговият начин да не остане в зоната на деликатните жестове. Да напусне този добре подреден салон, в който проблемите се крият зад дървена ламперия и дебели килими. За него мълчанието е вина, тиха форма на съучастие. Книгата настоява, че човек не може да се изолира от историческите трусове чрез интелектуален финес, както буржоазията дълго е вярвала, че е възможно. Ако се оставиш да бъдеш безучастен наблюдател, ти ставаш част от механизма, който разрушава собствения ти свят.

Емиграцията в книгата е продължение на тази тема. Мараи описва напускането на родината не като географски жест, а като дълбинен избор. Емигрантът е човек, който носи със себе си не толкова багаж, колкото вина, спомени и мисъл за това какво оставя след себе си. Изгубеният град, изгубеният език, изгубеният ритуал се превръщат в символи на загубената лична консистентност. В това отношение Мараи се родее с Пруст, Зебалд и Цвайг – автори, които са разбирали, че паметта е форма на дом, а изгнанието е форма на постоянно самонаказание.

На второ четене: „Изповедите на един буржоа“

Ако направим паралел само с немскоезичната литература, Мараи стои между Томас Ман и Стефан Цвайг. Като Ман той проследява упадъка на класата през деликатните ритуали и икономическите грешки, а като Цвайг таи остра носталгия по изгубената Централна Европа. В същото време говори с етична взискателност, която напомня на Камю и неговите размисли за личната отговорност в епохи на интензивна историческа тревога. Мараи не вярва, че буржоазията е напълно виновна, но вярва, че тя е подценила собствения си морален дълг да бъде будна, мислеща и способна да се противопоставя. Той предлага не реставрация, а разследване. Не носталгия, а анатомия.

Когато прехвърлим този свят върху днешна България, се вижда нещо странно и донякъде тревожно. Прилика, която не е пряка, но е структурна.

Мараи описва общество, което се разпада тихо, през ерозия на доверието, през неоправдана вяра в институции, които не издържат проверката на историята.

България днес живее в подобно напрежение, макар и в различен контекст.

Политическата нестабилност, поредицата от служебни и краткотрайни кабинети, постоянните сътресения между партии, протести и недоверие към институциите създават усещането за общество, което трябва непрекъснато да ревизира себе си, но рядко намира сили да го направи. Разликата е, че нашият свят е по-шумен, по-медиатизиран и по-фрагментиран. Но моралната дилема е подобна. Какво правим, когато усещаме, че редът се оттегля, а никой не поема истинската отговорност?

Емиграцията също е странен мост между страниците на Мараи и днешна България. Тя остава централна тема. Хората продължават да напускат не само по икономически, но и по морални причини. Именно защото не вярват, че обществото ще се промени. Защото усещат, че тяхната жизнена траектория е по-ясна другаде. Защото им липсва доверие в общия проект. При Мараи напускането е трагедия. При нас често е практическо решение, но и тук носи следа от вина и от чувство за изкореняване. И в двата случая е знак, че институциите не предлагат достатъчен смисъл. Нито достатъчно бъдеще.

Разликата, разбира се, е в историческата рамка. България не е изолирана провинция на разпадаща се империя. Тя е член на ЕС, част е от голям пазар и сложна бюрокрация, която едновременно стабилизира и фрустрира. Еврозоната, политическите реформи, европейските механизми за наблюдение – това са все нови контексти, които Мараи не би могъл да си представи. Но основният въпрос, зададен от него, остава валиден. Какво правим, когато светът се променя по-бързо от нашия вътрешен ритъм? И можем ли да предотвратим разпада му чрез морално усилие и чрез навременна и честна изповед?

В крайна сметка „Изповедите на един буржоа“ е книга за отговорността. За личната, класовата, държавната и националната отговорност.

Това е книга, която отказва да идеализира изгубения свят и настоява да го разберем, за да не го повторим по много по-глупав начин. В един момент Мараи признава, че навярно е късно за този отчет, че историята е минала през дома му като товарен влак и е оставила само прах. Но самото написване на книгата е опит да се изтръгне смисъл от развалините.

И ако днес в България има усещане за политическа умора, недоверие и дори тихо отчаяние, Мараи ни предлага не спасение, а инструмент. Да не мълчим. Да не се преструваме, че ритуалите или заблудите сами ще ни спасят. Да не вярваме, че институциите функционират, защото някой ги е построил преди нас. И най-вече да помним, че единствената истинска защита срещу историческия хаос е моралната яснота, колкото и непопулярна да е тя в днешния свят на политически шум, социални мрежи и аморфни колективни страхове.

Мараи, казано с умерена постмодерна ирония, е старомоден модернист, който ни предупреждава:

ако не си напишете изповедта навреме, историята ще ви я напише вместо вас.


Никой от нас не чете единствено най-новите книги. Тогава защо само за тях се пише? „На второ четене“ е рубрика, в която отваряме списъците с книги, публикувани преди поне година, четем ги и препоръчваме любимите си от тях. За нея медията „Тоест“ е отличена с Националната награда „Христо Г. Данов“ (2025) за принос в представянето на българската книга.

Рубриката е част от партньорската програма Читателски клуб „Тоест“, благодарение на която активните дарители на „Тоест“ получават 20% отстъпка от коричната цена на всички книги на включените издателства. Изборът на заглавия обаче е единствено на авторите Стефан Иванов, Севда Семер и Антония Апостолова, които биха ви препоръчали тези книги и ако имаше как да се разходите с тях в книжарницата. 

Microsoft Azure Cobalt 200 Launched with 132 Arm Neoverse V3 Cores

Post Syndicated from Cliff Robinson original https://www.servethehome.com/microsoft-azure-cobalt-200-launched-with-132-arm-neoverse-v3-cores/

The Microsoft Azure Cobalt 200 is out, using 132 Arm Neoverse V3 cores for a next-generation TSMC 3nm compute option in Azure

The post Microsoft Azure Cobalt 200 Launched with 132 Arm Neoverse V3 Cores appeared first on ServeTheHome.

Improve API discoverability with the new Amazon API Gateway Portal

Post Syndicated from Giedrius Praspaliauskas original https://aws.amazon.com/blogs/compute/improve-api-discoverability-with-the-new-amazon-api-gateway-portal/

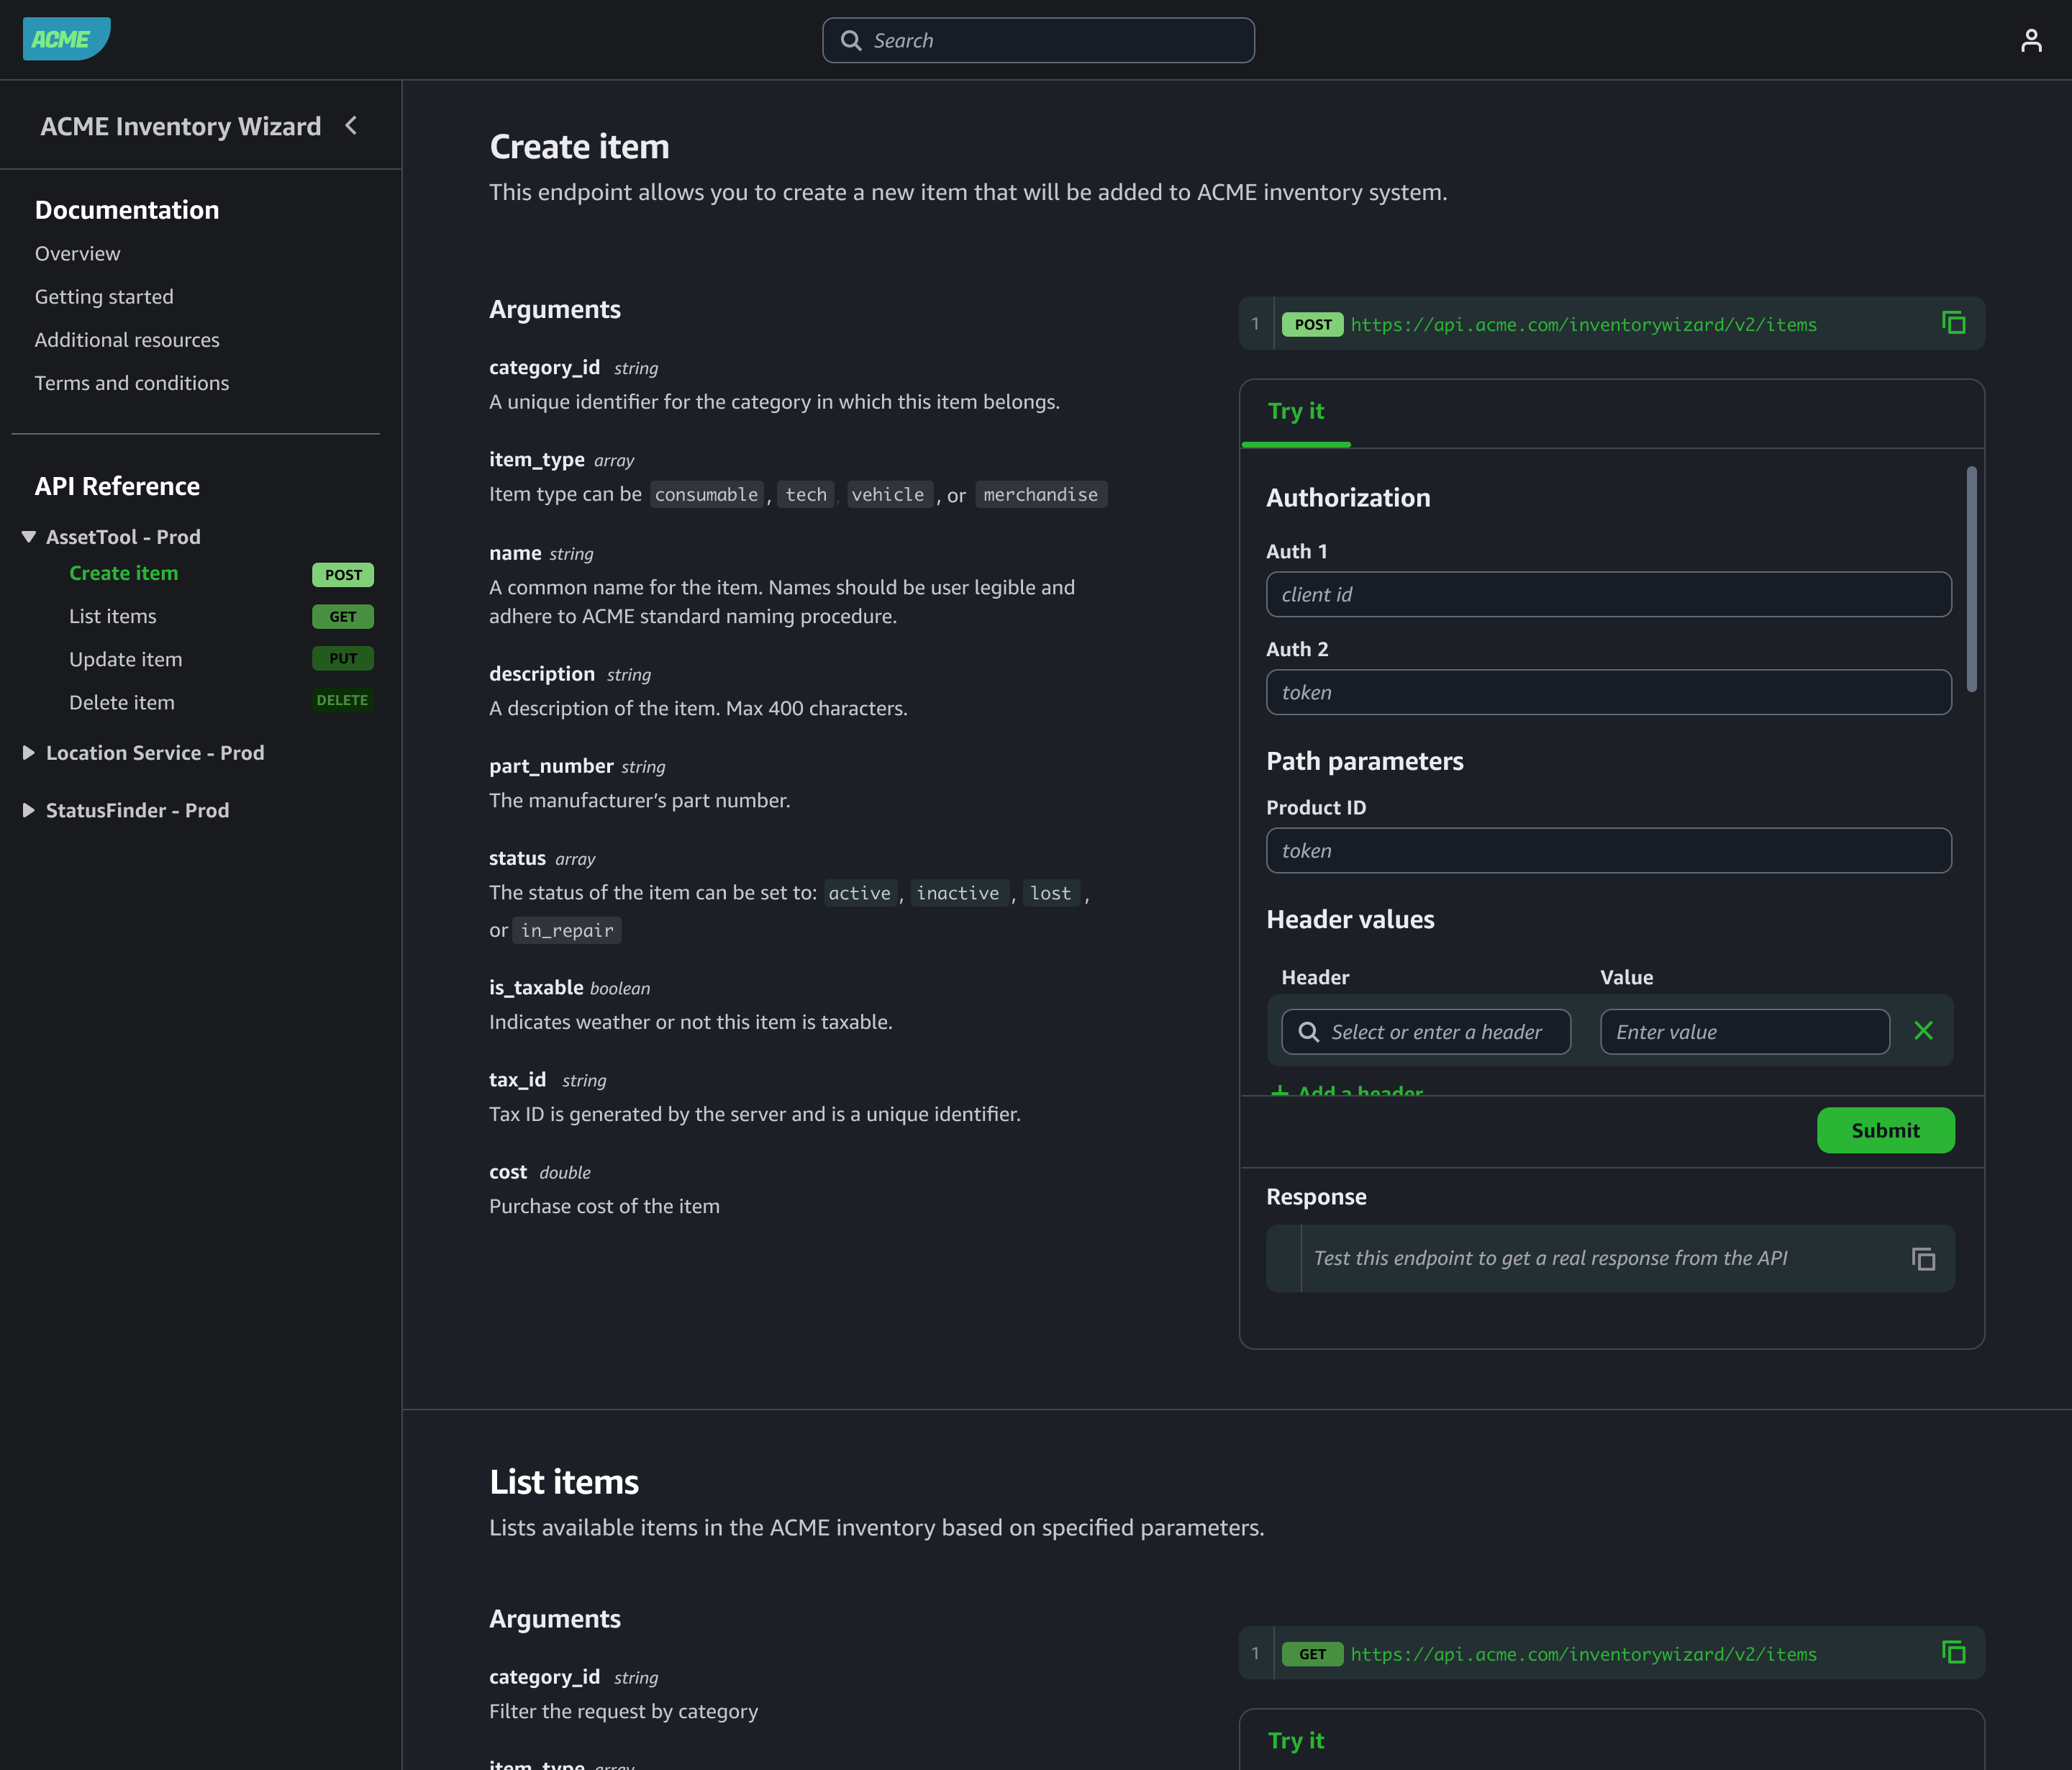
Amazon API Gateway now provides a fully managed portal feature, Amazon API Gateway Portal, that eliminates the need for static websites, open source solutions, or third-party offerings, which often led to fragmented API lifecycle management and increased costs. API Gateway Portal integrates with the API Gateway service and offers features like API products, interactive “Try it” functionality, and documentation for your API portfolio.

This fully managed solution addresses the need for a seamless way to showcase APIs and help developers quickly find, try, and integrate with them. By providing a managed solution that handles infrastructure, security, and scalability, API providers can focus on creating valuable APIs and delivering a great developer experience.

In this post, we will show how you can use the new portal feature to create customizable portals with enhanced security features in minutes, with APIs from multiple accounts, without managing any infrastructure.

Overview

A developer portal is a web page where API providers can share their APIs and API documentation by grouping them into portal products. Each portal product is a logical grouping of REST APIs and contains the documentation that you create and publish for your API consumers. Product pages within a portal contain the custom documentation at the portal product level. Product REST endpoint pages contain the documentation for each of the REST APIs with the details of the path and method of a REST API and the stage it’s deployed to. The combination of Product pages and Product REST endpoint pages provide the complete documentation for our API consumers on how to start using your REST APIs.

This abstraction allows you to organize endpoints from multiple APIs and stages into coherent product offerings for your consumers. For example, if you operate multiple APIs supporting a pet adoption service, you can create an “AdoptAnimals” portal product that groups dog-related endpoints from one API with cat-related endpoints from another API, while organizing user management functions into a separate “AdoptProcess” portal product.

With this flexibility you can present your APIs in a way that matches your business logic rather than your technical architecture and organize your APIs in ways that make the most sense for your consumers. For large enterprises managing extensive API portfolios, API Gateway Portal offers centralized catalogs of APIs across business groups, reducing duplicate work and improving standardization.

The portal feature automatically creates developer portals that display APIs with documentation, interactive testing capabilities, and integrated consumer analytics. The platform uses AWS Resource Access Manager (RAM) for multi-account API sharing, Amazon Cognito for access control, and Amazon CloudWatch for centralized monitoring.

Key features of API Gateway Portal

The API Gateway Portal provides comprehensive functionality for both API providers and consumers.

The following is a list of the key features that were introduced by the service at launch:

Customizable portal experience: You control your portal’s branding through custom logos and color schemes. You can configure custom domain names with SSL certificates managed by AWS Certificate Manager, or use the default domain structure provided by AWS.

Flexible access control: Access to developer portals can be controlled using Amazon Cognito, you can configure portals to be either publicly accessible or require authentication. Integration with Cognito user pools provides secure and scalable identity and access management that is enterprise-grade, cost-effective, and customizable. For organizations using existing identity systems, Cognito supports federation with SAML and OpenID Connect identity providers.

Cross-account API organization: The portal supports sharing portal products across AWS accounts using AWS RAM, so that organizations can create a unified API catalog while maintaining flexibility for API providers to develop and maintain APIs in their own accounts. When you share a portal product with another account, that account cannot modify any properties of your portal product or product endpoint pages, so API providers maintain control over their APIs while still enabling discovery across the organization. The cross-account sharing capabilities provide significant governance benefits for enterprise customers, including centralized discovery, standardization, reduced duplication, clear ownership, and controlled access.

Documentation: Beyond API reference documentation synchronized from your API definitions, you can add supplemental documentation including guides, use cases, and integration examples.

Search, discovery, and interactive API exploration: Consumers can search across your entire catalog. The portal provides intuitive customizable navigation and organization to help users find the right endpoints for their needs. Using the “Try It” functionality consumers can try APIs directly from the portal. Users can input request parameters, headers, and see live responses, reducing time-to-value for API integrations. This environment includes built-in limits for security and cost control.

Access control and governance

Amazon API Gateway Portal provides security and governance capabilities essential for production deployments.

Identity and access management: Integration with Cognito user pools provides secure and scalable identity and access management that is enterprise-grade, cost-effective, and customizable, including multi-factor authentication, password policies, and user lifecycle management.

API authorization: The portal respects existing authorization mechanisms configured on your APIs, including AWS IAM, Lambda authorizers, and Cognito user pools. Portal access doesn’t bypass your established security controls.

Cross-account governance: When sharing portal products across accounts using AWS RAM, the original API owners retain full control over their endpoints, including authorization strategies, integration configurations, and stage settings. Portal owners can use shared portal products but cannot modify the underlying API configurations.

Audit and monitoring: All portal management activities integrate with AWS CloudTrail for comprehensive audit logging. You can use Amazon CloudWatch RUM to perform real user monitoring to collect and view analytics about API consumers in near real time.

Resource limits: The service includes built-in quotas to prevent abuse, including limits on API testing rate limits, payload sizes, and integration timeouts. With these limits the “Try It” functionality cannot impact your production API performance.

Getting Started

Setting up a portal involves three main steps: creating portal products, configuring the portal, and publishing for consumer access. We will walk through those steps in more detail.

Create portal product

The following procedure shows you how to create a portal product:

  1. Navigate to the API Gateway console and select Portal products from the main navigation.
  2. Choose Create portal product and specify your portal product details including name, description, and visibility settings.
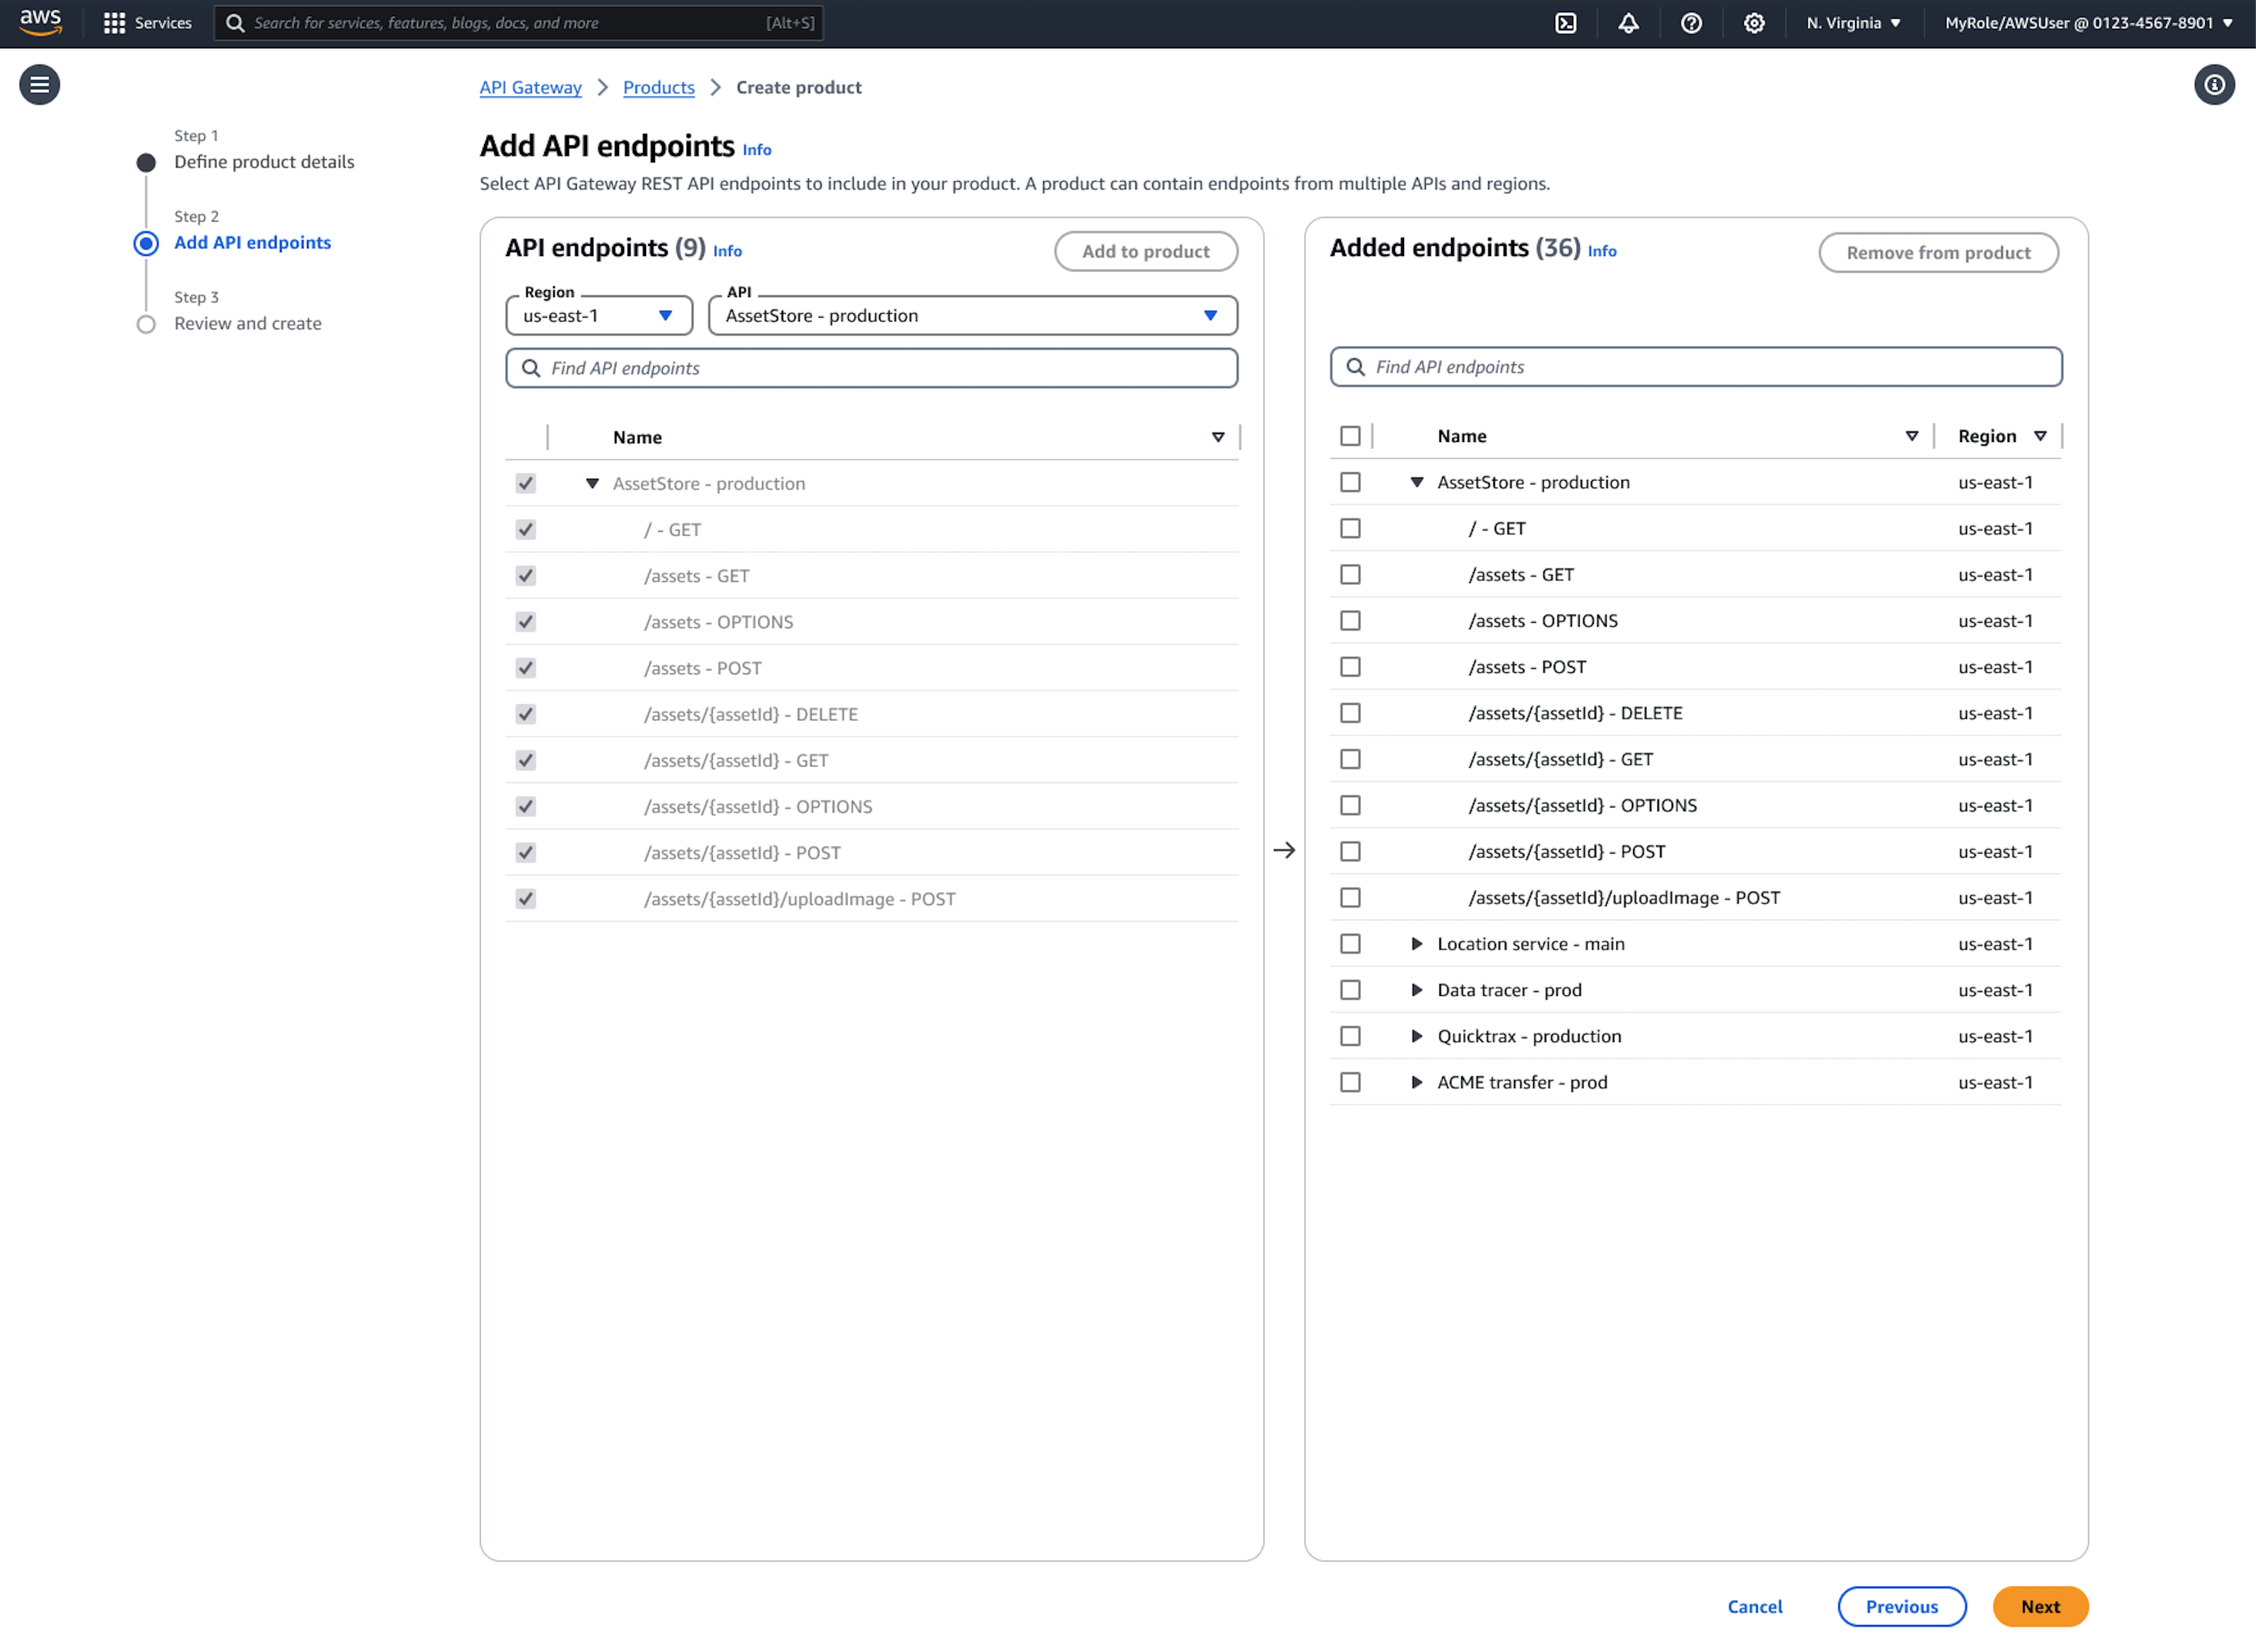
  3. Next, select the endpoints you want to include in this portal product. You can choose entire API stages or specific resources and methods, and even rename endpoints with user-friendly names for better discoverability.
  4. The system automatically imports your API documentation. You can improve the documentation with additional context, use cases, and examples later.
  5. Organize product endpoints into custom categories that reflect your business logic rather than technical implementation details.

Configure the developer portal

The following procedure shows how to create a portal.

  1. Select Developer portals in the API Gateway console navigation.
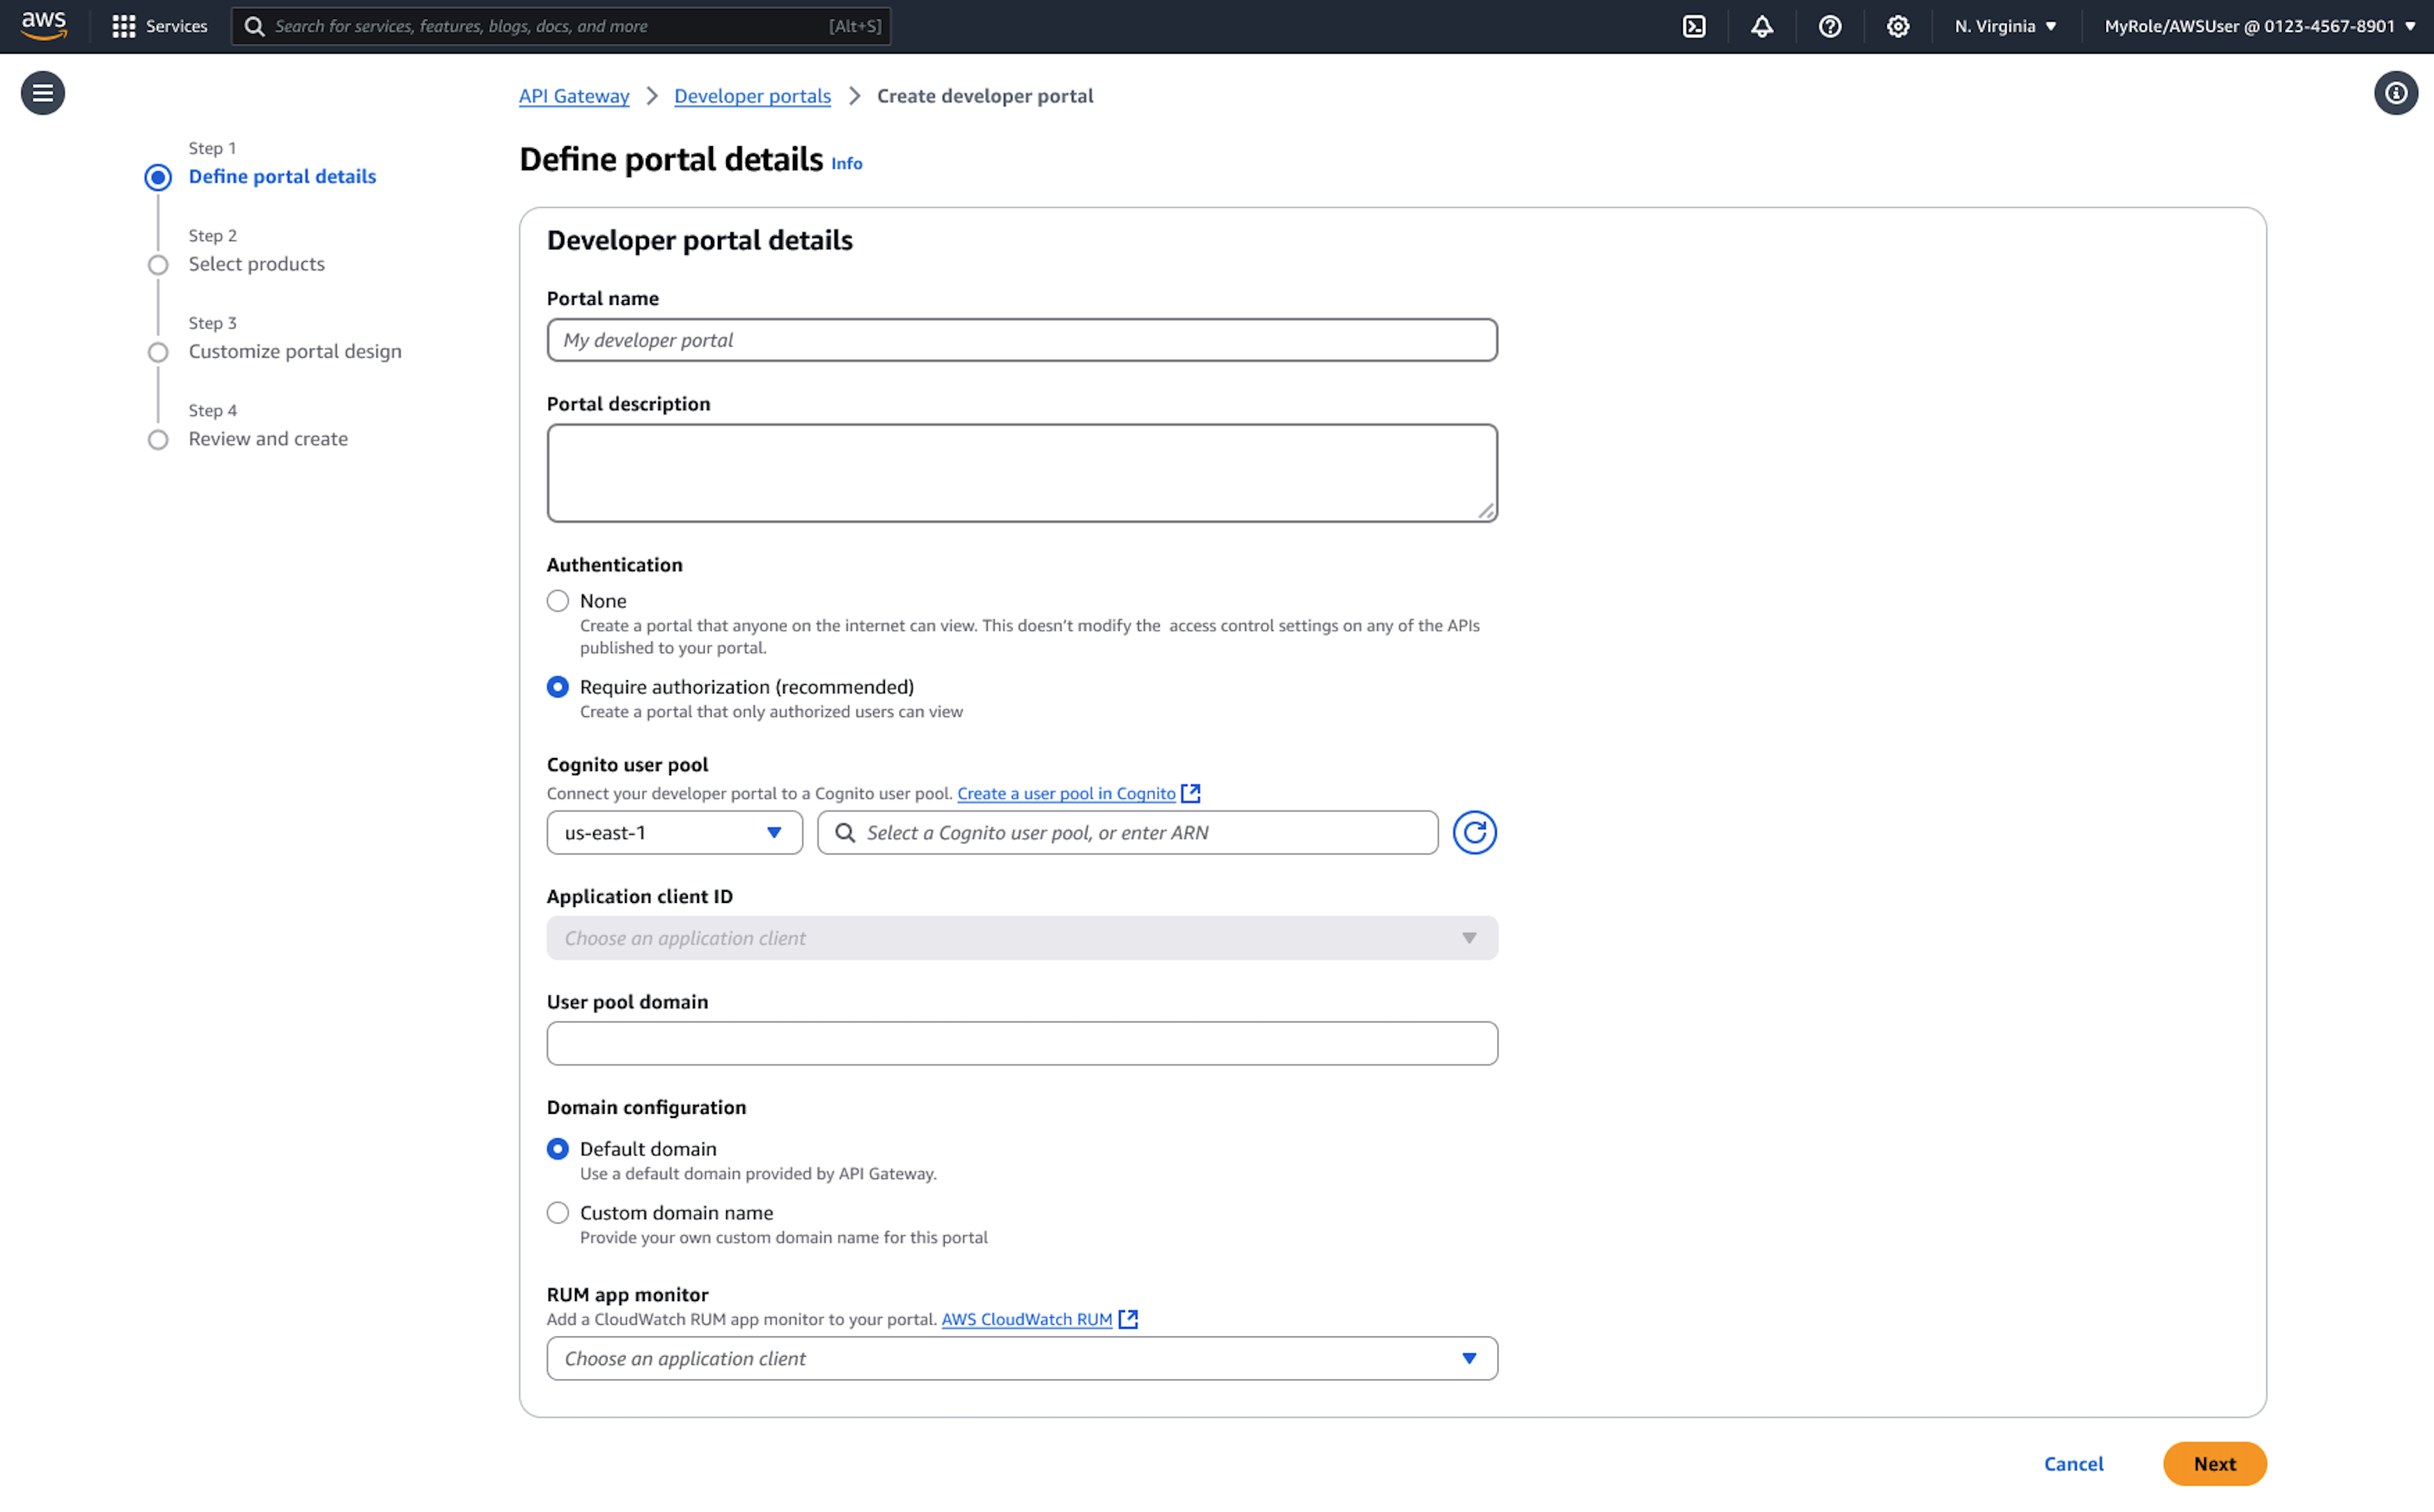
  2. Specify your portal name, description, and domain configuration.
  3. Choose between adding your prefix to the default AWS domain or configuring a custom domain name with your own SSL certificate.
  4. Configure access control by selecting authentication requirements. For internal portals, you might require Amazon Cognito authentication, while public portals can allow anonymous access to documentation.
  5. Upload your logo and select color themes to match your brand identity.
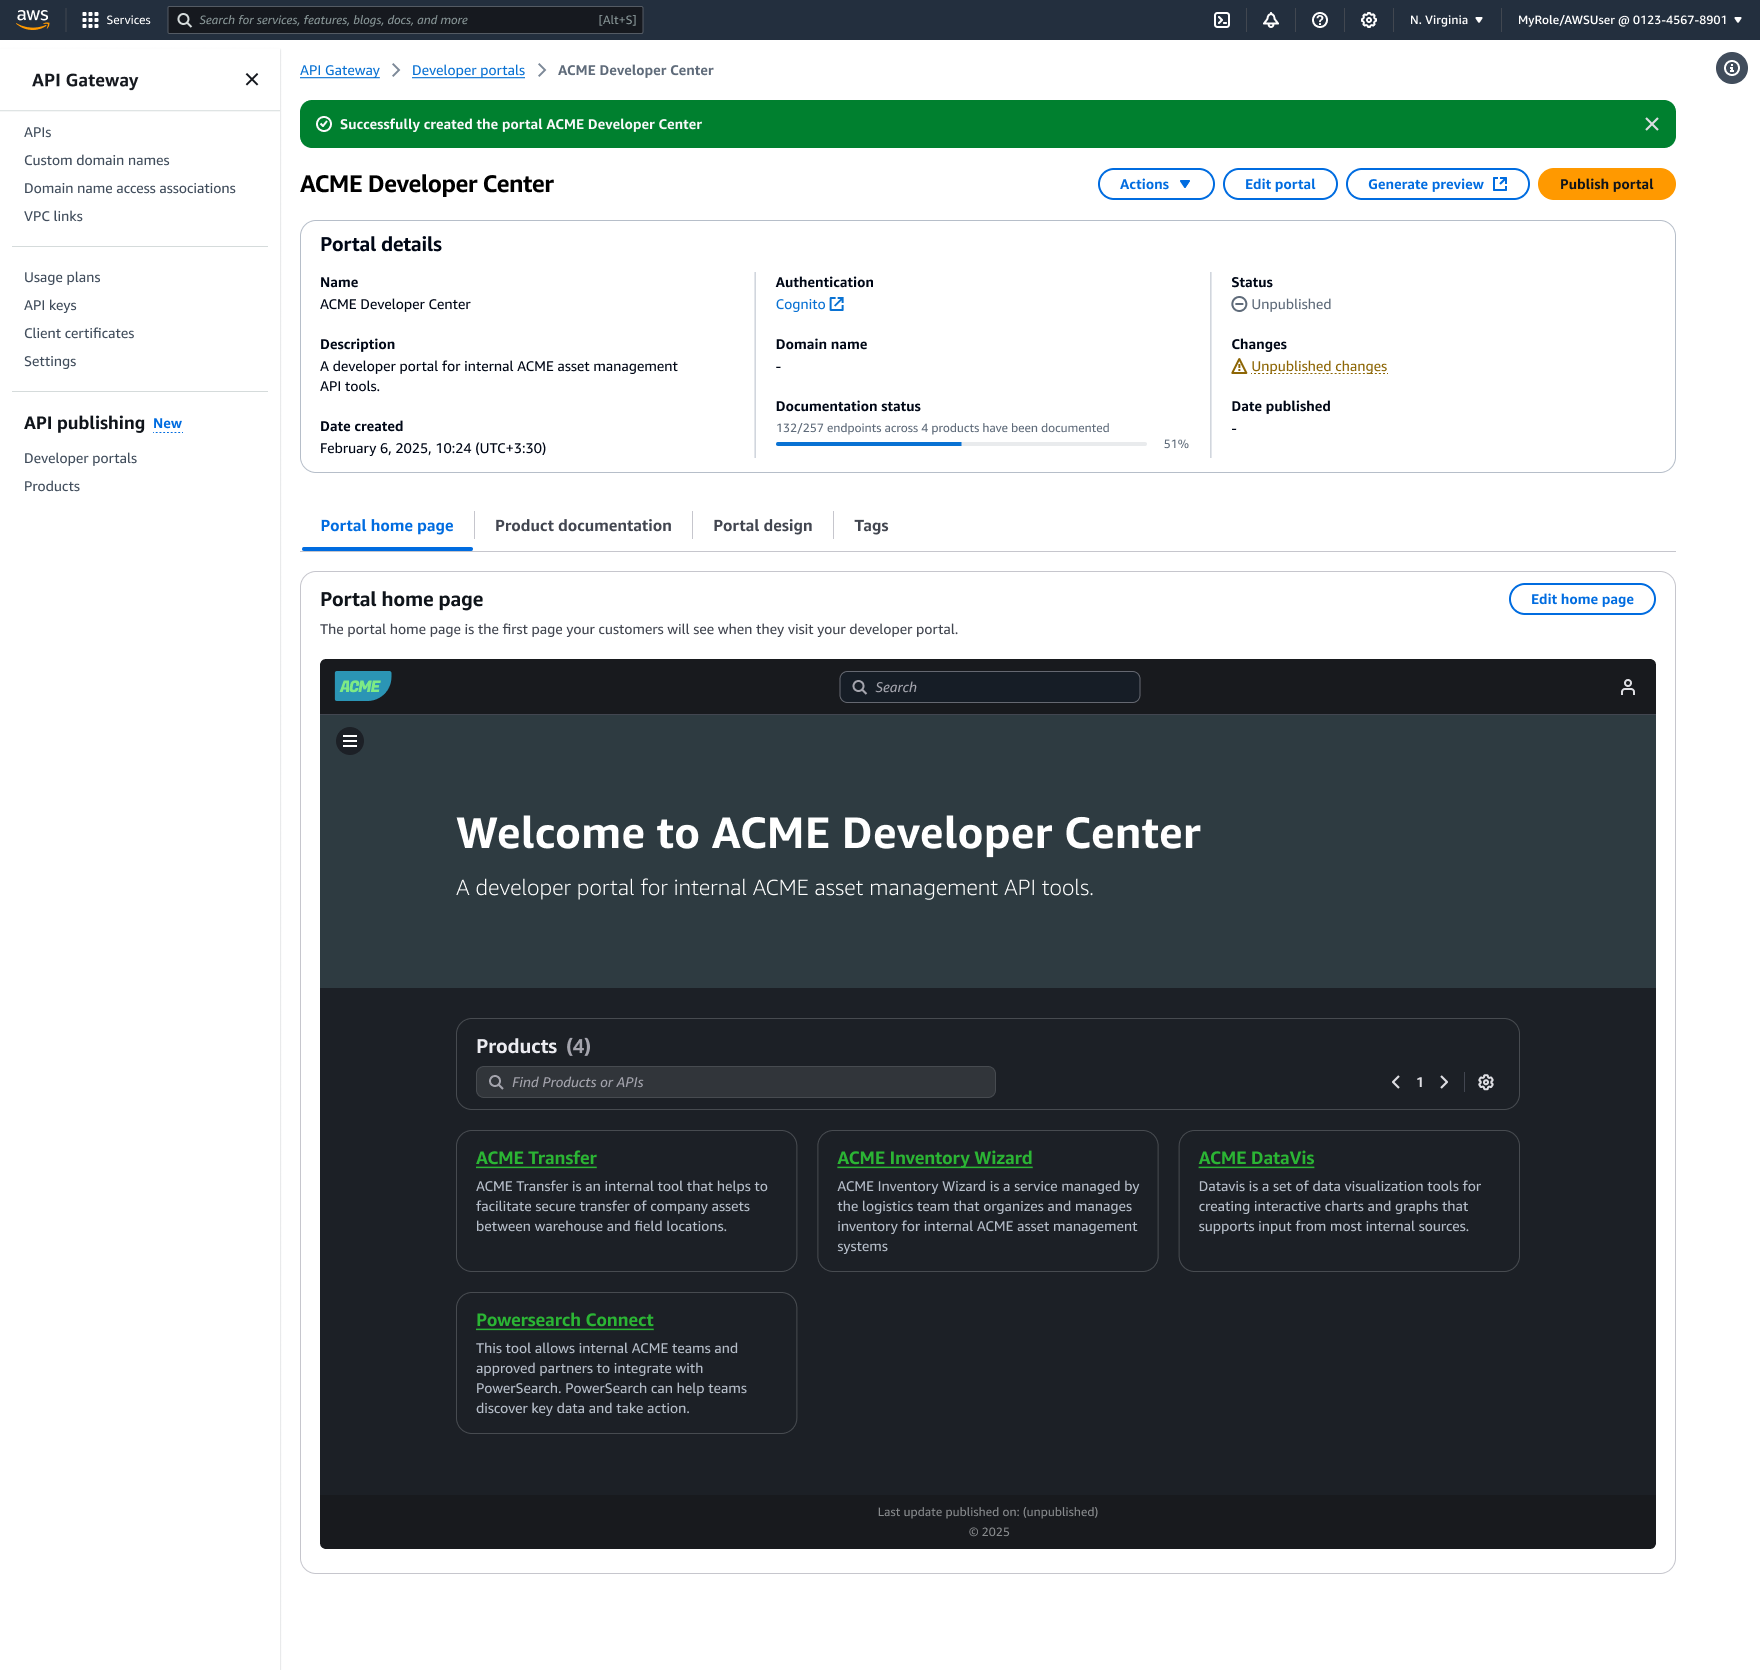
  6. Add your portal products. You can include products from your account or products shared with you from other accounts through AWS RAM. The portal provides search and filtering capabilities for consumers.

Preview and publish

Before making your portal publicly available, use the preview functionality to review the consumer experience. The preview shows exactly how your portal will appear to users, including navigation, documentation, and available API testing capabilities.

When you’re satisfied with the configuration, choose Publish portal to make it accessible to consumers. The publishing process typically completes within a few minutes, and API Gateway provides the final portal URL for distribution to your consumers.

Conclusion and next steps

The new API Gateway Portal eliminates the complexity of building and maintaining custom API documentation sites. Your developers get a professional, feature-rich experience where they can discover and try your APIs immediately. Plus, since everything stays within AWS, you get built-in security, simplified operations, and comprehensive observability through integration with services like CloudWatch and CloudTrail.

Ready to streamline your API discovery experience? Here’s how to get started:

[$] LWN.net Weekly Edition for November 20, 2025

Post Syndicated from corbet original https://lwn.net/Articles/1046323/

Inside this week’s LWN.net Weekly Edition:

  • Front: Hardware architectures; Fedora Flatpaks; Debian hardware support; sockaddr structure; NUMA nodes; Homebrew.
  • Briefs: LightDM security; Debian Libre Live; Xubuntu postmortem; Blender 5.0; Git 2.52.0; Rust in Android; Thunderbird 145; Quotes; …
  • Announcements: Newsletters, conferences, security updates, patches, and more.

Building an AI gateway to Amazon Bedrock with Amazon API Gateway

Post Syndicated from Thomas Natschläger original https://aws.amazon.com/blogs/architecture/building-an-ai-gateway-to-amazon-bedrock-with-amazon-api-gateway/

When building generative AI applications, enterprises need to govern foundation model usage through authorization, quota management, tenant isolation, and cost control. To meet these needs, Dynatrace developed a robust AI gateway architecture that has evolved into a reusable reference pattern for organizations looking to control access to Amazon Bedrock services at scale.

This pattern uses Amazon API Gateway as the access layer in front of Amazon Bedrock. It supports key capabilities such as request authorization with seamless integration into existing identity systems (for example, JWT validation), usage quotas and request throttling, lifecycle management, canary releases, and AWS WAF integration. The gateway also uses Amazon API Gateway response streaming, launched today, for real-time delivery of API model outputs that stream to users as they are generated. The complete solution code is available in our GitHub repository.

In this blog post, you’ll explore the underlying architecture, learn how to deploy and configure the solution, and discover further enhancement ideas.

Architecture of the AI gateway

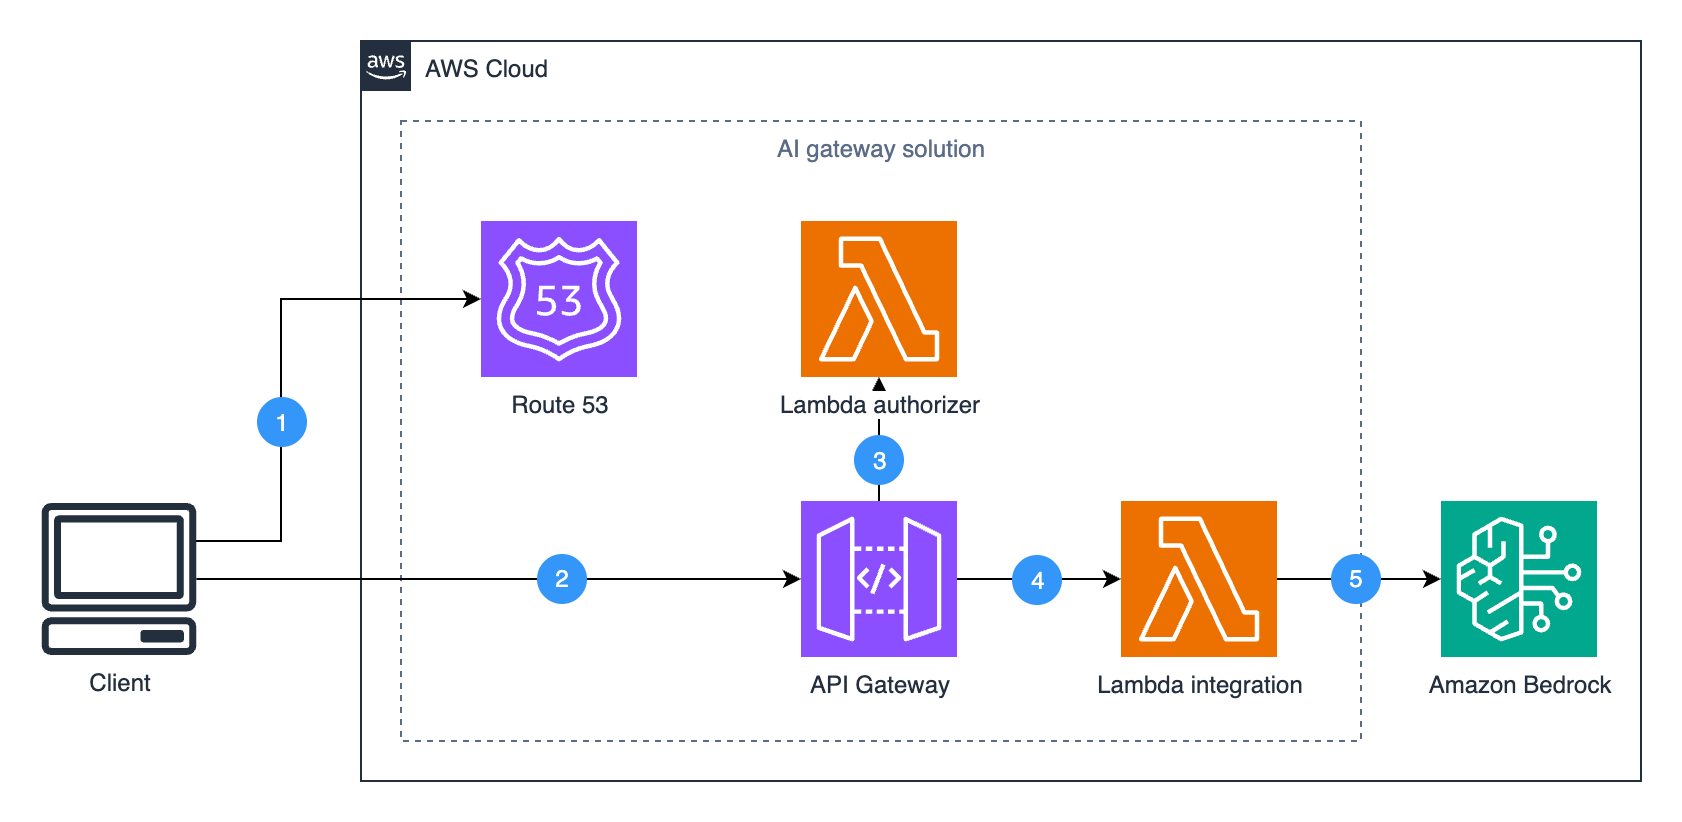
The reference architecture gives you granular control over LLM access using fully managed AWS services. It is transparent to client applications and seamlessly integrates into existing enterprise environments.


Figure 1. Reference architecture of the AI gateway.

The solution consists of four core components:

  1. Amazon Route 53 (optional) manages custom domain routing, allowing clients to access the gateway through a company-specific endpoint instead of the default Amazon API Gateway domain.
  2. Amazon API Gateway serves as the entry point for the requests and provides capabilities like authorization, request throttling, and lifecycle management.
  3. AWS Lambda authorizer handles request authorization, which in the Dynatrace implementation involves validating JWT tokens with existing authentication systems. For your specific implementation, you can implement your own authorization logic in a Lambda authorizer, integrate with Amazon Cognito user pools, or use other API Gateway authorization mechanisms.
  4. Lambda integration is a dynamic request forwarder that signs incoming requests with AWS credentials and routes them to the appropriate Amazon Bedrock endpoints. The function preserves the original request details, including the API action and parameters, to support current or future Amazon Bedrock APIs without code changes. The complete implementation is available in the integration Lambda function.
  5. Amazon Bedrock provides access to foundation models and AI capabilities.

The benefit of this architecture is the transparency to client applications and future-proof design. Clients can use AWS SDKs (like Boto3) to access Amazon Bedrock functionalities (such as LLMs and Knowledge Bases) exactly as they would when calling the Amazon Bedrock API directly. Meanwhile, the AI gateway handles authorization, quota management, and other capabilities behind the scenes.

When a client makes an Amazon Bedrock API call to the AI gateway endpoint, the Lambda integration function:

  1. Captures the original request with its details (headers, body, and parameters).
  2. Applies AWS Signature Version 4 authentication.
  3. Forwards the request to the correct Amazon Bedrock service endpoint.

With this approach the AI gateway can support current and new Amazon Bedrock features without requiring specific API knowledge or code updates, reducing gateway maintenance as the available features grow.

Deploying with AWS CloudFormation

This walkthrough will deploy a private AI gateway with authorization disabled for initial testing. You’ll create the core infrastructure (API Gateway, Lambda functions, and VPC endpoints) and then test basic functionality before optionally adding security features.

The quickest way to deploy this solution is with AWS CloudFormation:

  1. Sign in as an administrator to the AWS Management Console and use the navigation bar to select your desired AWS Region for deployment.
  2. Choose the following Launch Stack button:

launch stack button

  1. In the Quick create stack page, configure the key parameters as follows. For complete parameter descriptions, see the documentation.
Parameter Description Choose value Why
EndpointType API Gateway endpoint accessibility (PRIVATE or REGIONAL) PRIVATE Secure internal access only
EnableAuthorizer Enable Lambda Authorizer for API Gateway false Start without auth for simpler testing
CustomDomain Custom domain name for API Gateway (leave empty) Use default domain initially
HostedZoneId Route 53 Hosted Zone ID for custom domain SSL validation (leave empty) Not needed with default domain
  1. Select the capability I acknowledge that AWS CloudFormation might create IAM resources.
  2. Leave all other configurations at their default values and choose Create Stack.
  3. In the stack page, wait until the Status of the stack transitions to CREATE_COMPLETE.
  4. Choose Outputs and copy the values for GatewayUrl, VpcId, and ApiId – you’ll use these to test your gateway later.

Testing the deployment

Your gateway is now running privately inside its VPC, but that means you can’t reach it from the outside. You’ll now create an AWS CloudShell environment inside the VPC to test the gateway:

  1. Open the CloudShell console page, choose the + icon and then choose Create VPC environment.
  2. On the Create a VPC environment page, configure:
    1. Name: for example, AIGatewayTest
    2. Virtual Private Cloud (VPC): the VpcId you copied earlier
    3. Subnet: any available subnet
    4. Security group: the default VPC security group
  3. Choose Create to create your VPC environment.

Once your CloudShell environment is ready, you’ll create a client that properly routes requests through your private API endpoint.First, execute this command in CloudShell to create a reusable client factory that routes requests through your gateway while maintaining the standard boto3 interface:

cat > boto3_client_factory.py << 'EOF'
import boto3
from botocore import UNSIGNED
from botocore.client import BaseClient
from botocore.config import Config

class Boto3ClientFactory:
    """Utility class for creating boto3 clients."""
    
    @classmethod
    def create(cls, service_name: str, endpoint_url: str, jwt_token: str = None) -> BaseClient:
        """Create a boto3 client instance usable with the sign-and-forward Lambda.
        
        Parameters
        ----------
        service_name : str
            The service name to be used when initiating boto3.client.
        endpoint_url: str
            URL pointing to API gateway invoke endpoint.
        jwt_token: str, optional
            JWT token to include in Authorization header for all requests.
            If provided, adds 'Authorization: Bearer {jwt_token}' header.
        """
        generic_client = boto3.client(
            service_name = service_name,
            endpoint_url = endpoint_url,
            # do not sign the request at the client side; authentication is done
            # in API gateway
            config = Config(signature_version = UNSIGNED),
            # non-None Region_name needs to be passed due to validation logic
            # it is NOT used if we pass endpoint_url above
            region_name="",
        )
        
        def add_client_headers(model, params, **kwargs):
            """Hook to add custom headers each request."""
            headers = params["headers"]
            
            # the header "aws-endpoint-prefix" is used by the Lambda integration
            headers["aws-endpoint-prefix"] = model.service_model.endpoint_prefix
            
            # Add Authorization header if jwt_token is provided
            if jwt_token:
                headers["Authorization"] = f"Bearer {jwt_token}"
        
        # register the hook to add custom headers before each call
        generic_client.meta.events.register("before-call.*.*", add_client_headers)
        
        return generic_client
EOF

With the factory in place, you can now create clients for different Amazon Bedrock services. Set your configuration variables:

# Replace with your actual Gateway URL from CloudFormation Outputs (used in all examples)
export GATEWAY_URL="https://your-api-id.execute-api.region.amazonaws.com/v1"
# Replace with one of your pre-existing Amazon Bedrock Knowledge Bases ID (optional, only needed for knowledge base example)
export KB_ID="your-kb-id"

Test model inference with Amazon Bedrock ConverseStream API:

cat > test_converse_stream.py << 'EOF'
import os
from boto3_client_factory import Boto3ClientFactory
import json

# Get configuration from environment variables
api_gateway_url = os.environ['GATEWAY_URL']

# Create client for Bedrock Runtime (model inference)
bedrock_runtime_client = Boto3ClientFactory.create(
    service_name = "bedrock-runtime",
    endpoint_url = api_gateway_url
)

response = bedrock_runtime_client.converse_stream(
    modelId = 'global.anthropic.claude-haiku-4-5-20251001-v1:0',
    messages = [{"role": "user", "content": [{"text": "Who invented the airplane?"}]}]
)

print("Model Response:")
# Stream the response as it arrives
for event in response['stream']:
    if 'contentBlockDelta' in event:
        delta = event['contentBlockDelta']['delta']
        if 'text' in delta:
            print(delta['text'], end='', flush=True)  # Print each chunk immediately
    elif 'messageStop' in event:
        print("\n")  # End of stream
        break
EOF

python test_converse_stream.py

Test retrieval from Amazon Bedrock Knowledge Bases:

cat > test_knowledge_base.py << 'EOF'
import os
from boto3_client_factory import Boto3ClientFactory

# Get configuration from environment variables
api_gateway_url = os.environ['GATEWAY_URL']
knowledge_base_id = os.environ['KB_ID']

# Create client for Bedrock Agent Runtime (knowledge bases)
bedrock_kb_client = Boto3ClientFactory.create(
    service_name = "bedrock-agent-runtime",
    endpoint_url = api_gateway_url
)

response = bedrock_kb_client.retrieve(
    knowledgeBaseId = knowledge_base_id,
    retrievalQuery = {'text': 'Who invented the airplane?'},
    retrievalConfiguration = {
        'vectorSearchConfiguration': {
            'numberOfResults': 5
        }
    }
)

print("Knowledge base retrieval results:")
print(response)
EOF

python test_knowledge_base.py

Configuring authorization

After testing the basic functionality, you can now enable authorization by updating your deployed stack with custom authorization logic. For example, to implement JWT validation in a Lambda authorizer:

  1. Open the CloudFormation template file with your favorite text editor and replace the following placeholder code in the Lambda authorizer with your own authorization logic (see examples):
def lambda_handler(event, context):
    try:
        # Placeholder for JWT validation
        # Implement your authorization logic
        token = event['authorizationToken']
        
        # By default, deny all requests
        return generate_policy('user', 'Deny', event['methodArn'])
    except Exception as e:
        return generate_policy('user', 'Deny', event['methodArn'])
  1. Update the CloudFormation stack to enable your new authorization logic:
    1. Go back to the CloudFormation console
    2. Select your bedrock-llm-gateway stack, choose Update stack, and choose Make a direct update
    3. Choose Replace existing template, upload your modified template file, and choose Next
    4. In the parameters section, change EnableAuthorizer from false to true and choose Next
    5. Select the capability I acknowledge that AWS CloudFormation might create IAM resources.
    6. Choose Next and choose Submit
  2. Once the CloudFormation stack update is complete, deploy your changes to the API Gateway. API Gateway requires an explicit deployment step to activate configuration changes. While CloudFormation updates the API Gateway resources, the changes won’t be active until you create a new deployment to push them to the stage.
    1. Navigate to the API Gateway console
    2. Choose your API (find it using the ApiId from your CloudFormation outputs)
    3. Choose Deploy API
    4. For Stage select v1, and choose Deploy
  3. Test your authorization by going back to CloudShell and running this example. This example passes a JWT token to test the authorization – replace it with your actual token or other authorization parameters you configured in the Lambda authorizer.
cat > test_with_auth.py << 'EOF'
import os
from boto3_client_factory import Boto3ClientFactory

# Get configuration from environment variables
api_gateway_url = os.environ['GATEWAY_URL']

# Replace "your-jwt-token" with your actual JWT token
jwt_token = "your-jwt-token"

bedrock_runtime_client_with_jwt = Boto3ClientFactory.create(
    service_name = "bedrock-runtime",
    endpoint_url = api_gateway_url,
    jwt_token = jwt_token
)

response = bedrock_runtime_client_with_jwt.converse_stream(
    modelId = 'global.anthropic.claude-haiku-4-5-20251001-v1:0',
    messages = [{"role": "user", "content": [{"text": "Who invented the airplane?"}]}]
)

print("Model Response:")
# Stream the response as it arrives
for event in response['stream']:
    if 'contentBlockDelta' in event:
        delta = event['contentBlockDelta']['delta']
        if 'text' in delta:
            print(delta['text'], end='', flush=True)  # Print each chunk immediately
    elif 'messageStop' in event:
        print("\n")  # End of stream
        break
EOF

python test_with_auth.py

Enhancement options for the AI gateway

The solution can be enhanced using additional API Gateway capabilities. Here are some examples:

  • Rate limiting and throttling: Control request rates using usage plans and API keys. This is especially important in multi-tenant SaaS applications to avoid noisy neighbor problems. For examples of throttling scenarios, see the throttling documentation.
  • Private or edge-optimized endpoints: Configure endpoint types to optimize for internal access or global performance.
  • Lifecycle management and canary releases: Manage multiple API versions and implement gradual rollouts with stage variables and canary deployments.
  • WAF integration: Add AWS WAF rules to help protect from common exploits.
  • Prompt and response caching: Implement caching strategies to reduce costs and improve response times for frequently requested prompts using API Gateway caching.
  • Content filtering: In addition to the safeguards offered by Amazon Bedrock Guardrails, add custom filtering in the Lambda integration layer to screen for sensitive content such as personally identifiable information (PII).

For more information about these capabilities, visit the API Gateway features page.

Conclusion

The AI gateway pattern demonstrated in this post provides a scalable way to manage access to foundation models and agent tools through Amazon Bedrock. Initially developed and implemented by Dynatrace to serve their global user base, this pattern has proven its effectiveness at enterprise-scale. By using the Amazon API Gateway enterprise features organizations can implement necessary controls while maintaining the benefits of serverless architecture.

To start using this solution today, follow the walkthrough in this blog post or check out our GitHub repository. To learn more about the services used in this solution, explore the Amazon API Gateway features page, or visit the documentation for Amazon API Gateway and Amazon Bedrock. To learn how this solution streams foundation model responses, see the documentation for the new Amazon API Gateway response streaming capability.


About the authors

Getting started with Amazon S3 Tables in Amazon SageMaker Unified Studio

Post Syndicated from David Pasha original https://aws.amazon.com/blogs/big-data/getting-started-with-amazon-s3-tables-in-amazon-sagemaker-unified-studio/

Modern data teams face a critical challenge: their analytical datasets are scattered across multiple storage systems and formats, creating operational complexity that slows down insights and hampers collaboration. Data scientists waste valuable time navigating between different tools to access data stored in various locations, while data engineers struggle to maintain consistent performance and governance across disparate storage solutions. Teams often find themselves locked into specific query engines or analytics tools based on where their data resides, limiting their ability to choose the best tool for each analytical task.

Amazon SageMaker Unified Studio addresses this fragmentation by providing a single environment where teams can access and analyze organizational data using AWS analytics and AI/ML services. The new Amazon S3 Tables integration solves a fundamental problem: it enables teams to store their data in a unified, high-performance table format while maintaining the flexibility to query that same data seamlessly across multiple analytics engines—whether through JupyterLab notebooks, Amazon Redshift, Amazon Athena, or other integrated services. This eliminates the need to duplicate data or compromise on tool choice, allowing teams to focus on generating insights rather than managing data infrastructure complexity.

Table buckets are the third type of S3 bucket, taking place alongside the existing general purpose buckets, directory buckets, and now the fourth type – vector buckets. You can think of a table bucket as an analytics warehouse that can store Apache Iceberg tables with various schemas. Additionally, S3 Tables deliver the same durability, availability, scalability, and performance characteristics as S3 itself, and automatically optimize your storage to maximize query performance and to minimize cost.

In this post, you learn how to integrate SageMaker Unified Studio with S3 tables and query your data using Athena, Redshift, or Apache Spark in EMR and Glue.

Integrating S3 Tables with AWS analytics services

S3 table buckets integrate with AWS Glue Data Catalog and AWS Lake Formation to allow AWS analytics services to automatically discover and access your table data. For more information, see creating an S3 Tables catalog.

Before you get started with SageMaker Unified Studio, your administrator must first create a domain in the SageMaker Unified Studio and provide you with the URL. For more information, see the SageMaker Unified Studio Administrator Guide.

If you’ve never used S3 Tables in SageMaker Studio, you can allow it to enable the S3 Tables analytics integration when you create a new S3 Tables catalog in SageMaker Unified Studio.

Note: This integration needs to be configured individually in each AWS Region.

When you integrate using SageMaker Unified Studio, it takes the following actions in your account:

  • Creates a new AWS Identity and Access Management (IAM) service role that gives AWS Lake Formation access to all your tables and table buckets in the same AWS Region where you are going to provision the resources. This allows Lake Formation to manage access, permissions, and governance for all current and future table buckets.
  • Creates a catalog from an S3 table bucket in the AWS Glue Data Catalog.
  • Add the Redshift service role (AWSServiceRoleForRedshift) as a Lake Formation Read-only administrator permissions.

Prerequisites

Creating catalogs from S3 table buckets in SageMaker Unified Studio

To get started using S3 Tables in SageMaker Unified Studio you create a new Lakehouse catalog with S3 table bucket source using the following steps.

  1. Open the SageMaker console and use the region selector in the top navigation bar to choose the appropriate AWS Region.
  2. Select your SageMaker domain.
  3. Select or create a new project you want to create a table bucket in.
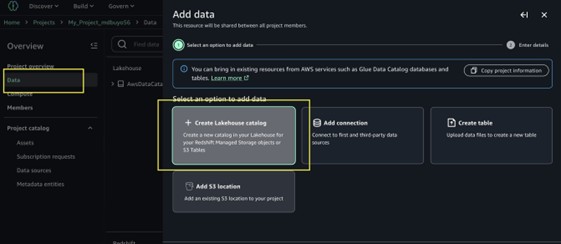
  4. In the navigation menu select Data, then select + to add a new data source.
  5. Choose Create Lakehouse catalog.
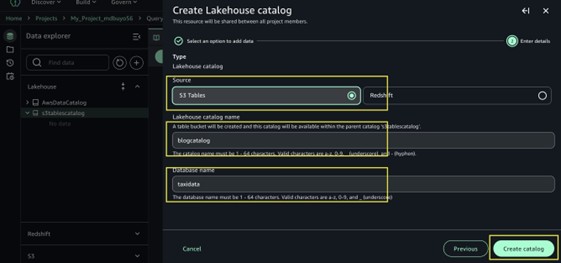
  6. In the add catalog menu, choose S3 Tables as the source.
  7. Enter a name for the catalog blogcatalog.
  8. Enter database name taxidata.
  9. Choose Create catalog.
  10. The following steps will help you create these resources in your AWS account:
    1. A new S3 table bucket and the corresponding Glue child catalog under the parent Catalog s3tablescatalog.
    2. Go to Glue console, expand Data Catalog, Click databases, a new database within that Glue child catalog. The database name will match the database name you provided.
    3. Wait for the catalog provisioning to finish.
  11. Create tables in your database, then use the Query Editor or a Jupyter notebook to run queries against them.

Creating and querying S3 table buckets

After adding an S3 Tables catalog, it can be queried using the format s3tablescatalog/blogcatalog. You can begin creating tables within the catalog and query them in SageMaker Studio using the Query Editor or JupyterLab. For more information, see Querying S3 Tables in SageMaker Studio.

Note: In SageMaker Unified Studio, you can create S3 tables only using the Athena engine. However, once the tables are created, they can be queried using Athena, Redshift, or through Spark in EMR and Glue.

Using the query editor

Creating a table in the query editor

  1. Navigate to the project you created in the top center menu of the SageMaker Unified Studio home page.
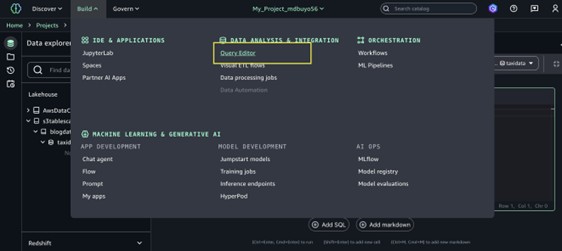
  2. Expand the Build menu in the top navigation bar, then choose Query editor.
  3. Launch a new Query Editor tab. This tool functions as a SQL notebook, enabling you to query across multiple engines and build visual data analytics solutions.
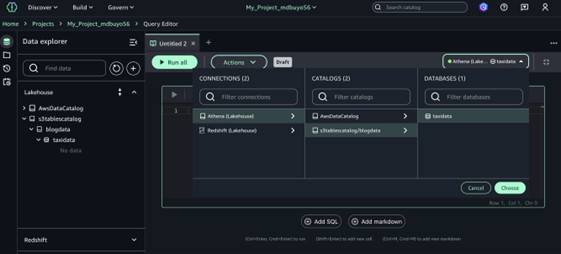
  4. Select a data source for your queries by using the menu in the upper-right corner of the Query Editor.
    1. Under Connections, choose Lakehouse (Athena) to connect to your Lakehouse resources.
    2. Under Catalogs, choose S3tablescatalog/blogcatalog.
    3. Under Databases, choose the name of the database for your S3 tables.
  5. Select Choose to connect to the database and query engine.
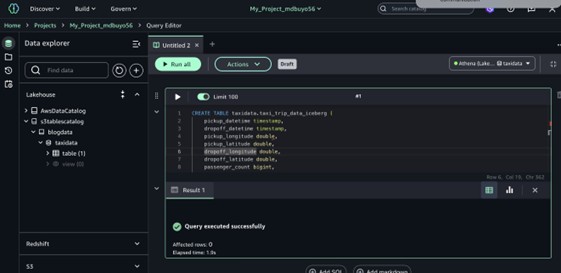
  6. Run the following SQL query to create a new table in the catalog.
    CREATE TABLE taxidata.taxi_trip_data_iceberg (
    pickup_datetime timestamp,
    dropoff_datetime timestamp,
    pickup_longitude double,
    pickup_latitude double,
    dropoff_longitude double,
    dropoff_latitude double,
    passenger_count bigint,
    fare_amount double
    )
    PARTITIONED BY
    (day(pickup_datetime))
    TBLPROPERTIES (
    'table_type' = 'iceberg'
    );

    After you create the table, you can browse to it in the Data explorer by choosing S3tablescatalog →s3tableCatalog →taxidata→taxi_trip_data_iceberg.

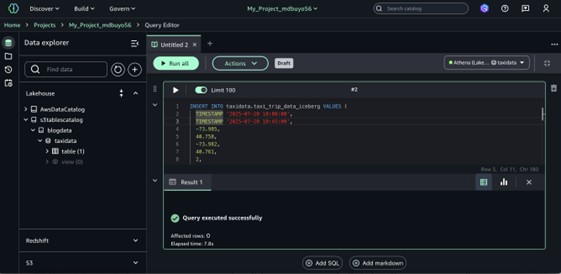
  7. Insert data into a table with the following DML statement.
    INSERT INTO taxidata.taxi_trip_data_iceberg VALUES (
    TIMESTAMP '2025-07-20 10:00:00',
    TIMESTAMP '2025-07-20 10:45:00',
    -73.985,
    40.758,
    -73.982,
    40.761,
    2, 23.75
    );

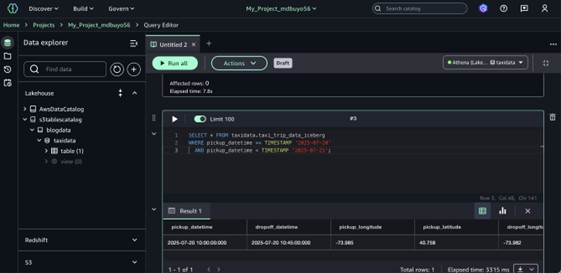
  8. Select data from a table with the following query.
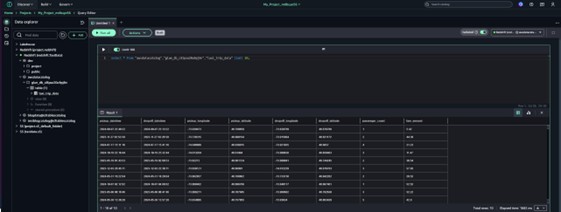
    SELECT * FROM taxidata.taxi_trip_data_iceberg
    WHERE pickup_datetime >= TIMESTAMP '2025-07-20'
    AND pickup_datetime < TIMESTAMP '2025-07-21';

You can learn more about the Query Editor and explore additional SQL examples in the SageMaker Unified Studio documentation.

Before proceeding with JupyterLab setup:

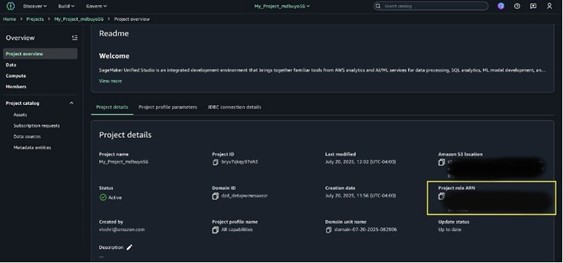
To create tables using the Spark engine via a Spark connection, you must grant the S3TableFullAccess permission to the Project Role ARN.

  1. Locate the Project Role ARN in SageMaker Unified Studio Project Overview.
  2. Go to the IAM console then select Roles.
  3. Search for and select the Project Role.
  4. Attach the S3TableFullAccess policy to the role, so that the project has full access to interact with S3 Tables.

Using JupyterLab

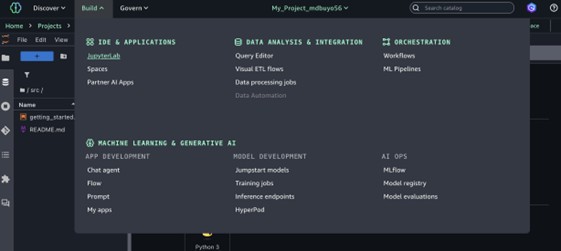
  1. Navigate to the project you created in the top center menu of the SageMaker Unified Studio home page.
  2. Expand the Build menu in the top navigation bar, then choose JupyterLab.
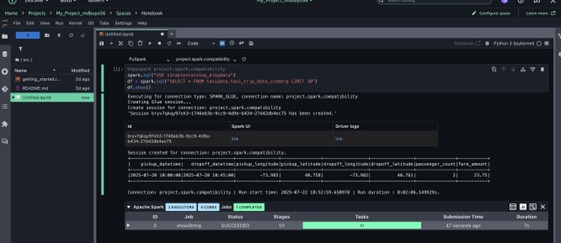
  3. Create a new notebook.
  4. Select Python3 Kernel.
  5. Choose PySpark as the connection type.
  6. Select your table bucket and namespace as the data source for your queries:
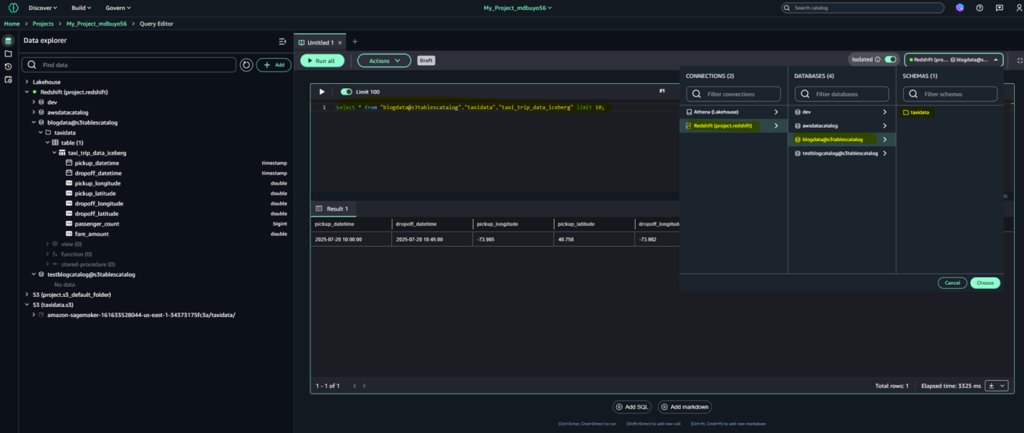
    1. For Spark engine, execute query USE s3tablescatalog_blogdata

Querying data using Redshift:

In this section, we walk through how to query the data using Redshift within SageMaker Unified Studio.

  1. From the SageMaker Studio home page, choose your project name in the top center navigation bar.
  2. In the navigation panel, expand the Redshift project folder.
  3. Open the blogdata@s3tablescatalog database.
  4. Expand the taxidata schema.
  5. Under the Tables section, locate and expand taxi_trip_data_iceberg.
  6. Review the table metadata to view all columns and their corresponding data types.
  7. Open the Sample data tab to preview a small, representative subset of records.
  8. Choose Actions.
  9. Select Preview data from the dropdown to open and view the full dataset in the data viewer.

When you select your table, the Query Editor automatically opens with a pre-populated SQL query. This default query retrieves the top 10 records from the table, giving you an instant preview of your data. It uses standard SQL naming conventions, referencing the table by its fully qualified name in the format database_schema.table_name. This approach ensures the query accurately targets the intended table, even in environments with multiple databases or schemas.

Best practices and considerations

The following are some considerations you should take note of.

  • When you create an S3 table bucket using the S3 console, integration with AWS analytics services is enabled automatically by default. You can also choose to set up the integration manually through a guided process in the console. Also, when you create S3 Table bucket programmatically using the AWS SDK, or AWS CLI, or REST APIs, the integration with AWS analytics services is not automatically configured. You need to manually perform the steps required to integrate the S3 Table bucket with AWS Glue Data Catalog and Lake Formation, allowing these services to discover and access the table data.
  • When creating an S3 table bucket for use with AWS analytics services like Athena, we recommend using all lowercase letters for the table bucket name. This requirement ensures proper integration and visibility within the AWS analytics ecosystem. Learn more about it from getting started with S3 tables.
  • S3 Tables offer automatic table maintenance features like compaction, snapshot management, and unreferenced file removal to optimize data for analytics workloads. However, there are some limitations to consider. Please read more on it from considerations and limitations for maintenance jobs.

Conclusion

In this post, we discussed how to use SageMaker Unified Studio’s integration with S3 Tables to enhance your data analytics workflows. The post explained the setup process, including creating a Lakehouse catalog with S3 table bucket source, configuring necessary IAM roles, and establishing integration with AWS Glue Data Catalog and Lake Formation. We walked you through practical implementation steps, from creating and managing Apache Iceberg based S3 tables to executing queries through both the Query Editor and JupyterLab with PySpark, as well as accessing and analyzing data using Redshift.

To get started with SageMaker Unified Studio and S3 Tables integration, visit Access Amazon SageMaker Unified Studio documentation.


About authors

Sakti Mishra

Sakti Mishra

Sakti is a Principal Data and AI Solutions Architect at AWS, where he helps customers modernize their data architecture and define end-to end-data strategies, including data security, accessibility, governance, and more. He is also the author of Simplify Big Data Analytics with Amazon EMR and AWS Certified Data Engineer Study Guide. Outside of work, Sakti enjoys learning new technologies, watching movies, and visiting places with family.

Vivek Shrivastava

Vivek Shrivastava

Vivek is a Principal Data Architect, Data Lake in AWS Professional Services. He is a big data enthusiast and holds 14 AWS Certifications. He is passionate about helping customers build scalable and high-performance data analytics solutions in the cloud. In his spare time, he loves reading and finds areas for home automation.

David Pasha

David Pasha

David is a Senior Healthcare and Life Sciences (HCLS) Technical Account Manager with 16 years of expertise in analytics. As an active member of the Analytics Technical Field Community (TFC), he specializes in designing and implementing scalable data warehouse solutions for customers in the cloud.

Debu Panda

Debu Panda

Debu is a Senior Manager, Product Management at AWS. He is an industry leader in analytics, application platform, and database technologies, and has more than 25 years of experience in the IT world.

Simplify access to external services using AWS IAM Outbound Identity Federation

Post Syndicated from Donnie Prakoso original https://aws.amazon.com/blogs/aws/simplify-access-to-external-services-using-aws-iam-outbound-identity-federation/

When building applications that span multiple cloud providers or integrate with external services, developers face a persistent challenge: managing credentials securely. Traditional approaches require storing long-term credentials like API keys and passwords, creating security risks and operational overhead.

Today, we’re announcing a new capability called AWS Identity and Access Management (IAM) outbound identity federation that customers can use to securely federate their Amazon Web Services (AWS) identities to external services without storing long-term credentials. You can now use short-lived JSON Web Tokens (JWTs) to authenticate your AWS workloads with a wide range of third-party providers, software-as-a-service (SaaS) platforms and self-hosted applications.

This feature enables IAM principals—such as IAM roles and users—to obtain cryptographically signed JWTs that assert their AWS identity. External services, such as third-party providers, SaaS platforms, and on-premises applications, can verify the token’s authenticity by validating its signature. Upon successful verification, you can securely access the external service.

How it works
With IAM outbound identity federation, you exchange your AWS IAM credentials for short-lived JWTs. This mitigates the security risks associated with long-term credentials while enabling consistent authentication patterns.

Let’s walk through a scenario where your application running on AWS needs to interact with an external service. To access the external service’s APIs or resources, your application calls the AWS Security Token Service (AWS STS) `GetWebIdentityToken` API to obtain a JWT.

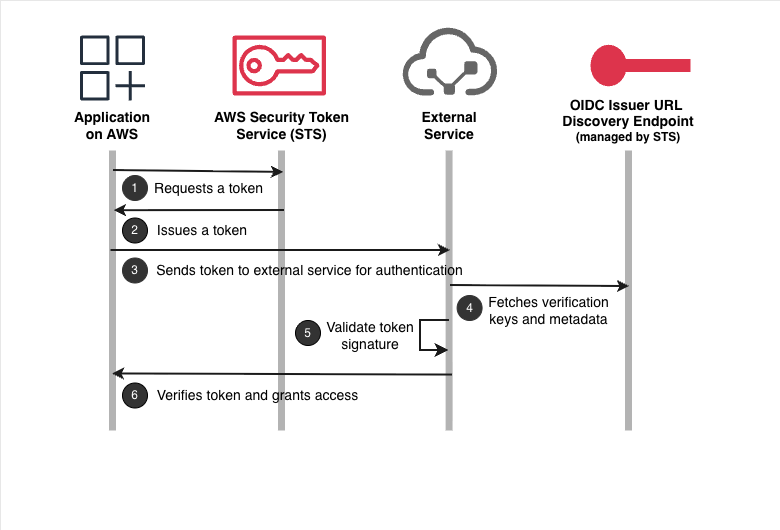
The following diagram shows this flow:

  1. Your application running on AWS requests a token from AWS STS by calling the GetWebIdentityToken API. The application uses its existing AWS credentials obtained from the underlying platform (such as Amazon EC2 instance profiles, AWS Lambda execution roles, or other AWS compute services) to authenticate this API call.
  2. AWS STS returns a cryptographically signed JSON Web Token (JWT) that asserts the identity of your application.
  3. Your application sends the JWT to the external service for authentication.
  4. The external service fetches the verification keys from the JSON Web Key Set (JWKS) endpoint to verify the token’s authenticity.
  5. The external service validates the JWT’s signature using these verification keys and confirms the token is authentic and was issued by AWS.
  6. After successful verification, the external service exchanges the JWT for its own credentials. Your application can then use these credentials to perform its intended operations.

Setting up AWS IAM outbound identity federation
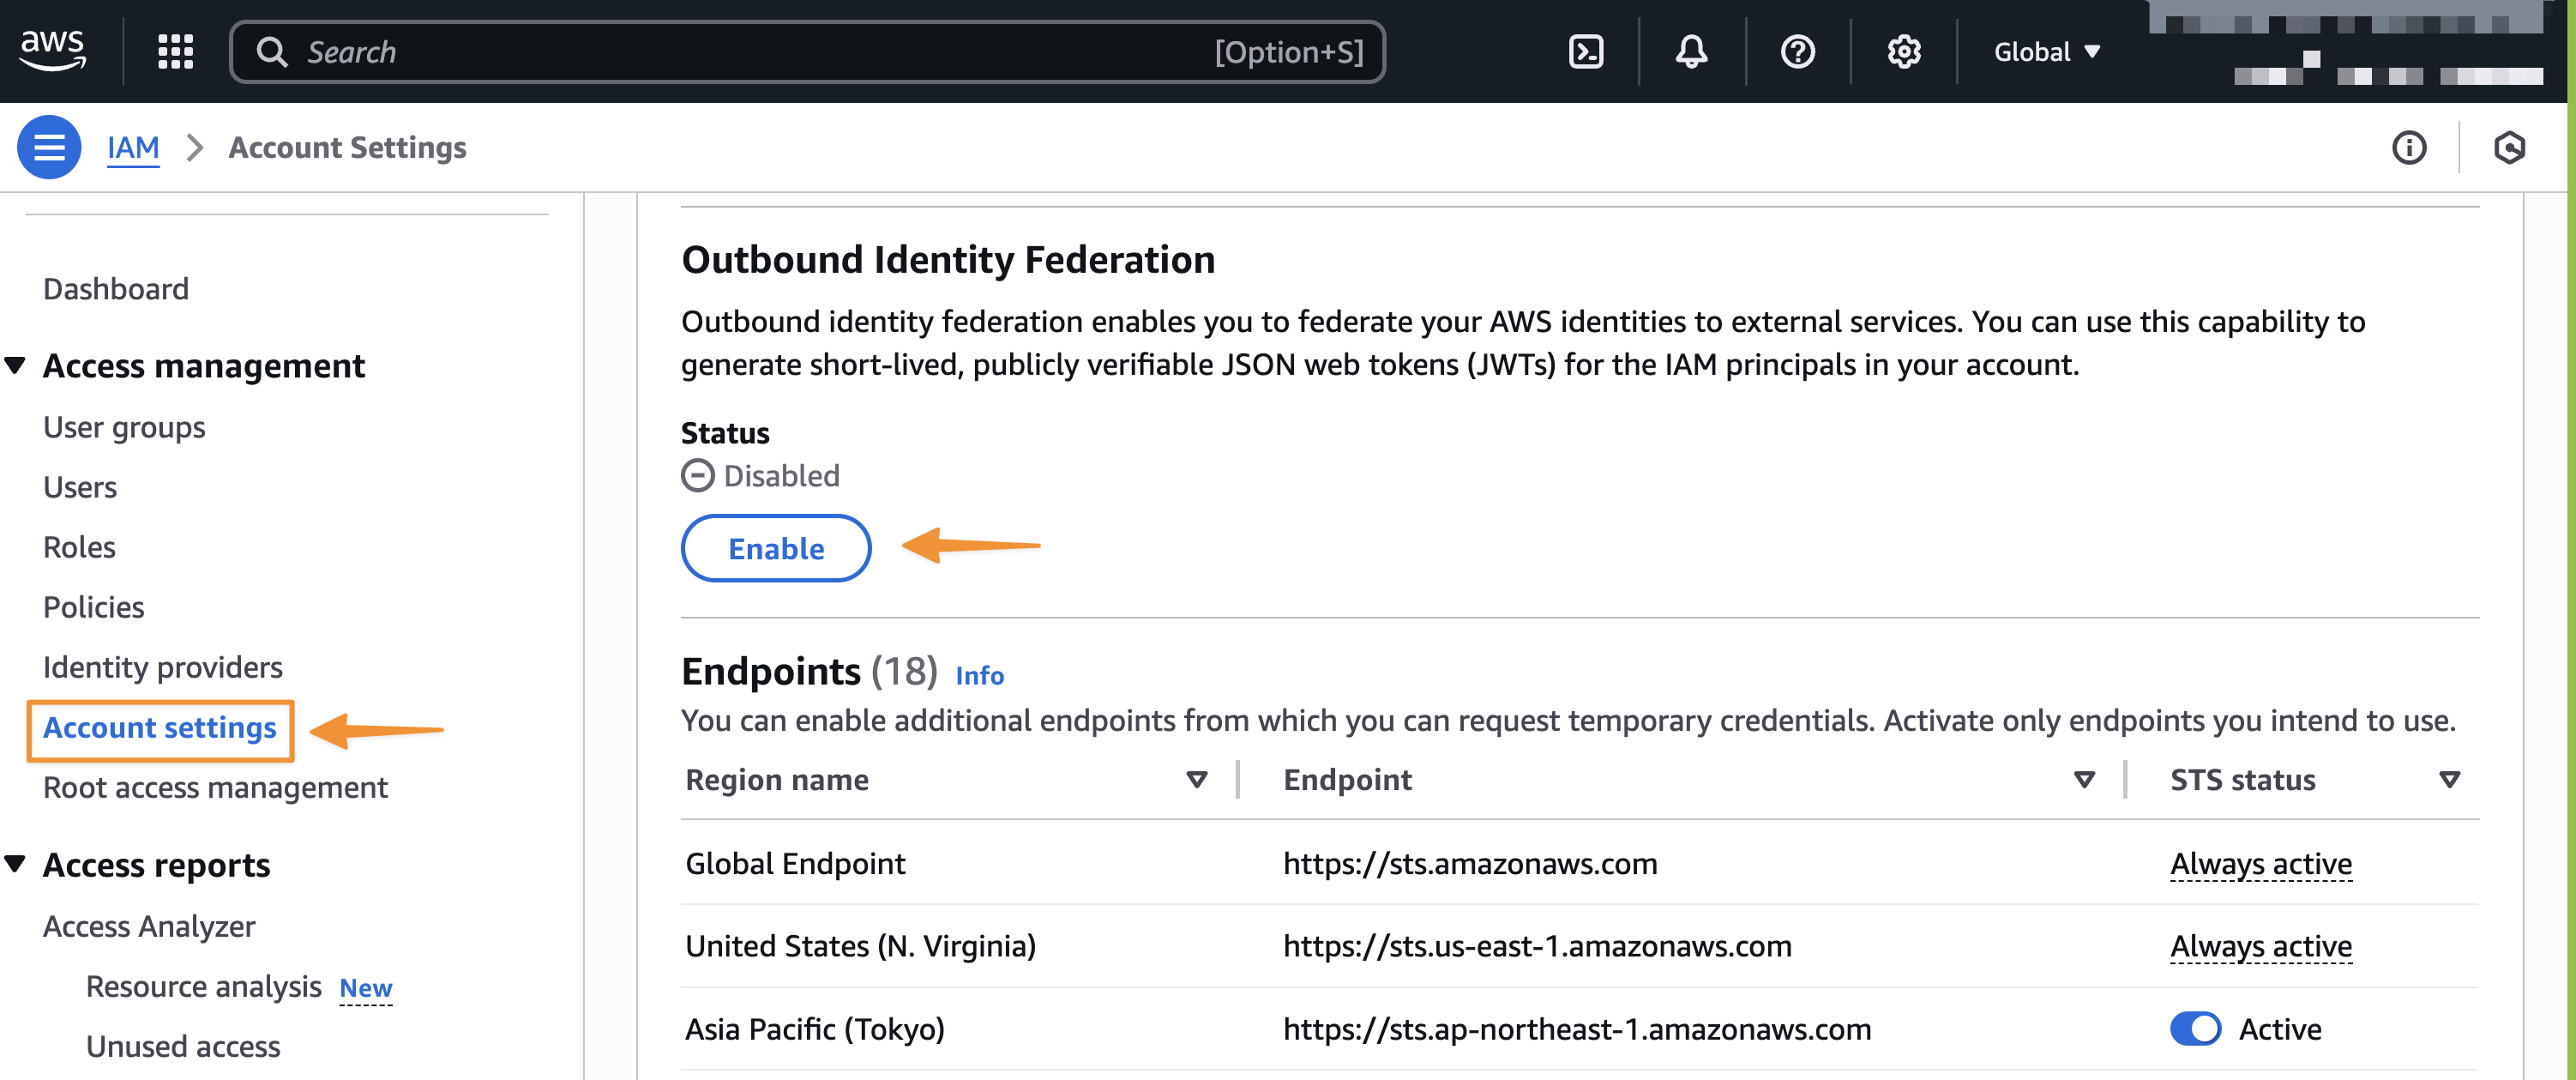
To begin using this feature, I need to enable outbound identity federation for my AWS account. I navigate to IAM and choose Account settings under Access management in the left-hand navigation pane.

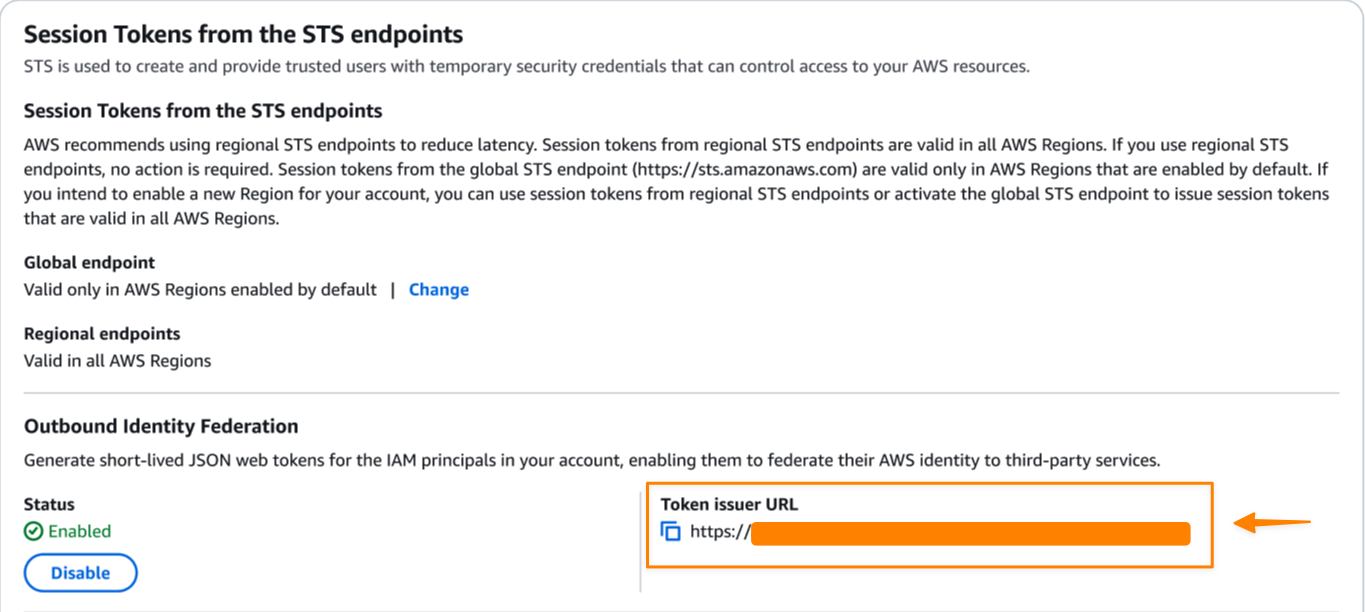
After I enable the feature, AWS generates a unique issuer URL for my AWS account that hosts the OpenID Connect (OIDC) discovery endpoints at /.well-known/openid-configuration and /.well-known/jwks.json. The OpenID Connect (OIDC) discovery endpoints contain the keys and metadata necessary for token verification.

Next, I need to configure IAM permissions. My IAM principal (role or user) must have the sts:GetWebIdentityToken permission to request tokens.

For example, the following identity policy specifies access to the STS GetWebIdentityToken API, enabling the IAM principal to generate tokens.

{
  "Version": "2012-10-17",
  "Statement": [
    {
      "Effect": "Allow",
      "Action": "sts:GetWebIdentityToken",
      "Resource": "*",
    }
  ]
}

At this stage, I need to configure the external service to trust and accept tokens issued by my AWS account. The specific steps vary by service, but generally involve:

  1. Registering my AWS account issuer URL as a trusted identity provider
  2. Configuring which claims to validate (audience, subject patterns)
  3. Mapping token claims to permissions in the external service

Let’s get started
Now, let me walk you through an example showing both the client-side token generation and server-side verification process.

First, I call the STS GetWebIdentityToken API to obtain a JWT that asserts my AWS identity. When calling the API, I can specify the intended audience, signing algorithm, and token lifetime as request parameters.

  • Audience: Populates the `aud` claim in the JWT, identifying the intended recipient of the token (for example, “my-app”)
  • DurationSeconds: The token lifetime in seconds, ranging from 60 seconds (1 minute) to 3600 seconds (1 hour), with a default of 600 seconds (5 minutes)
  • SigningAlgorithm: Choose either ES384 (ECDSA using P-384 and SHA-384) or RS256 (RSA using SHA-256)
  • Tags (optional): An array of key-value pairs that appear as custom claims in the token, which you can use to include additional context that enables external services to implement fine-grained access control

Here’s an example of getting an identity token using the AWS SDK for Python (Boto3). I can also do this using AWS Command Line Interface (AWS CLI).


import boto3

sts_client = boto3.client('sts')
response = sts_client.get_web_identity_token(
    Audience=['my-app'],
    SigningAlgorithm='ES384',  # or 'RS256'
    DurationSeconds=300
)
jwt_token = response['IdentityToken']
print(jwt_token)

This returns a signed JWT that I can inspect using any JWT parser.

{
eyJraWQiOiJFQzM4NF8wIiwidHlwIjoiSldUIiwiYWxnIjoiRVMzODQifQ.hey<REDACTED FOR BREVITY>...

I can decode the token using any JWT parser like this JWT Debugger. The token header shows it’s signed with ES384 (ECDSA).


{
  "kid": "EC384_0",
  "typ": "JWT",
  "alg": "ES384"
}

Also, the payload contains standard OIDC claims plus AWS specific metadata. The standard OIDC claims include subject (“sub”), audience (“aud”), issuer (“iss”), and others.

{
  "aud": "my-app",
  "sub": "arn:aws:iam::ACCOUNT_ID:role/MyAppRole",
  "https://sts.amazonaws.com/": {
    "aws_account": "ACCOUNT_ID",
    "source_region": "us-east-1",
    "principal_id": "arn:aws:iam::ACCOUNT_ID:role/MyAppRole"
  },
  "iss": "https://abc12345-def4-5678-90ab-cdef12345678.tokens.sts.global.api.aws",
  "exp": 1759786941,
  "iat": 1759786041,
  "jti": "5488e298-0a47-4c5b-80d7-6b4ab8a4cede"
}

AWS STS also enriches the token with identity-specific claims (such as account ID, organization ID, and principal tags) and session context. These claims provide information about the compute environment and session where the token request originated. AWS STS automatically includes these claims when applicable based on the requesting principal’s session context. You can also add custom claims to the token by passing request tags to the API call. To learn more about claims provided in the JWT, visit the documentation page.

Note the iss (issuer) claim. This is your account-specific issuer URL that external services use to verify that the token originated from a trusted AWS account. External services can verify the JWT by validating its signature using AWS’s verification keys available at a public JSON Web Key Set (JWKS) endpoint hosted at the /.well-known/jwks.json endpoint of the issuer URL.

Now, let’s look at how external services handle this identity token.

Here’s a snippet of Python example that external services can use to verify AWS tokens:


import json
import jwt
import requests
from jwt import PyJWKClient

# Trusted issuers list - obtained from EnableOutboundFederation API response
TRUSTED_ISSUERS = [
    "https://EXAMPLE.tokens.sts.global.api.aws",
    # Add your trusted AWS account issuer URLs here
    # Obtained from EnableOutboundFederation API response
]

def verify_aws_jwt(token, expected_audience=None):
    """Verify an AWS IAM outbound identity federation JWT"""
    try:
        # Get issuer from token
        unverified_payload = jwt.decode(token, options={"verify_signature": False})
        issuer = unverified_payload.get('iss')

 	# Verify issuer is trusted
        if not TRUSTED_ISSUERS or issuer not in TRUSTED_ISSUERS:
            raise ValueError(f"Untrusted issuer: {issuer}")

        # Fetch JWKS from AWS using PyJWKClient
        jwks_client = PyJWKClient(f"{issuer}/.well-known/jwks.json")
        signing_key = jwks_client.get_signing_key_from_jwt(token)

        # Verify token signature and claims
        decoded_token = jwt.decode(
            token,
            signing_key.key,
            algorithms=["ES384", "RS256"],
            audience=expected_audience,
            issuer=issuer
        )
        return decoded_token
    except Exception as e:
        print(f"Token verification failed: {e}")
        return None

Using IAM policies to control access to token generation
An IAM principal (such as a role or user) must have the sts:GetWebIdentityToken permission in their IAM policies to request tokens for authentication with external services. AWS account administrators can configure this permission in all relevant AWS policy types such as identity policies, service control policies (SCPs), resource control policies (RCPs), and virtual private cloud endpoint (VPCE) policies to control which IAM principals in their account can generate tokens.

Additionally, administrators can use the new condition keys to specify signing algorithms (sts:SigningAlgorithm), permitted token audiences (sts:IdentityTokenAudience), and maximum token lifetimes (sts:DurationSeconds). To learn more about the condition keys, visit IAM and STS Condition keys documentation page.

Additional things to know
Here are key details about this launch:

Get started with AWS IAM outbound identity federation by visiting AWS IAM console and enabling the feature in your AWS account. For more information, visit Federating AWS Identities to External Services documentation page.

Happy building!
— Donnie

Building responsive APIs with Amazon API Gateway response streaming

Post Syndicated from Anton Aleksandrov original https://aws.amazon.com/blogs/compute/building-responsive-apis-with-amazon-api-gateway-response-streaming/

Today, AWS announced support for response streaming in Amazon API Gateway to significantly improve the responsiveness of your REST APIs by progressively streaming response payloads back to the client. With this new capability, you can use streamed responses to enhance user experience when building LLM-driven applications (such as AI agents and chatbots), improve time-to-first-byte (TTFB) performance for web and mobile applications, stream large files, and perform long-running operations while reporting incremental progress using protocols such as server-sent events (SSE).

In this post you will learn about this new capability, the challenges it addresses, and how to use response streaming to improve the responsiveness of your applications.

Overview

Consider this scenario – you’re running an AI-powered agentic application that uses an Amazon Bedrock foundation model. Your users interact with the application through an API, asking complex questions that require detailed responses. Before response streaming, users would send their prompts and wait to eventually receive the application response, sometimes for tens of seconds. This awkward pause between questions and responses created a disconnected, unnatural experience.

With the new API Gateway response streaming capability, the interaction through the API becomes much more fluid and natural. As soon as your application starts processing the model response, you can stream it back to your users using the API Gateway.

The following animation illustrates this significant user experience improvement. The prompt on the left is processed using a non-streaming response with user having to wait for several seconds to receive the result. The prompt on the right is using the new API Gateway response streaming, significantly reducing TTFB and improving user experience.

Figure 1. Comparing user experience before (left) and after (right) enabling API Gateway response streaming when returning a response from a Bedrock foundational model.

Your users can now see AI responses appear in real-time, word by word, just like watching someone type. This immediate feedback makes your applications feel more responsive and engaging, keeping users connected throughout the interaction. In addition, you don’t have to worry about response size limits or implement complex workarounds – the streaming happens automatically and efficiently, letting you focus on building great user experiences rather than managing infrastructure constraints.

Understanding response steaming

In the traditional request-response model, responses must be fully computed before being sent to the client. This can negatively impact user experience – the client must wait for the complete response to be generated on the server-side and transmitted over-the-wire. This is especially pronounced in interactive, latency-sensitive cloud applications such as AI agents, chatbots, virtual assistants, or music generators.

Figure 2. Response is returned to the client only after it’s been fully generated, increasing time-to-first-byte latency.

Another important scenario is returning larger response payloads, such as images, large documents, or datasets. In some cases, these payloads may exceed the 10 MB response size limit or default integration timeout limit of 29 seconds of API Gateway. Before the launch of response streaming, developers worked around these limitations by using pre-signed Amazon S3 URLs to download large responses or accepting lower RPS for an increase in timeout. While functional, these workarounds introduced additional latency and architectural complexity.

With response streaming support you can address these challenges. You can now update your REST APIs to return streamed responses, significantly enhancing user experience, improving TTFB performance, supporting response payload sizes to exceed 10 MB, and serving requests that can take up to 15 minutes.

Figure 3. Response streaming reduces time-to-first-byte and improves user experience.

The response streaming capability is already delivering significant performance for organizations:

“Working closely with the AWS teams to enable response streaming was instrumental in advancing our roadmap to deliver the most performant storefront experiences for our largest customers at Salesforce Commerce Cloud. Our collaboration exceeded our Core Web Vital goals; we saw our Total Blocking Time metrics drop by over 98%, which will enable our customers to drive higher revenue and conversion rates.”, says Drew Lau, Senior Director of Product Management at Salesforce.

Response streaming is supported for any HTTP-proxy integration, AWS Lambda functions (using proxy integration mode), and private integrations. To get started, configure your API integration to stream the response from your backend, as described in the following sections, and redeploy your API for changes to take effect.

Getting started with response streaming

To enable response streaming for your REST APIs, update your integration configuration to set the response transfer mode to STREAM. This enables API Gateway to start streaming the response to the client as soon as response bytes become available. When using response streaming, you can configure request timeout up to 15 minutes. For best time to first byte user experience, AWS strongly recommends your backend integration also implements response streaming.

You can enable response streaming in several different ways, as illustrated in the following snippets:

Using the API Gateway console, when creating method integrations, select Stream for the Response transfer mode.

Figure 4. Enabling response streaming in API Gateway Console.

Setting response transfer mode using the Open API spec:

paths:
  /products:
    get:
      x-amazon-apigateway-integration:
        httpMethod: "GET"
        uri: "https://example.com"
        type: "http_proxy"
        timeoutInMillis: 300000
        responseTransferMode: "STREAM"

Setting response transfer mode using infrastructure-as-code (IaC) frameworks, such as AWS CloudFormation. Note the /response-streaming-invocations Uri fragment, it tells API Gateway to use the Lambda InvokeWithResponseStreaming endpoint:

MyProxyResourceMethod:
  Type: 'AWS::ApiGateway::Method'
  Properties:
    RestApiId: !Ref LambdaSimpleProxy
    ResourceId: !Ref ProxyResource
    HttpMethod: ANY
    Integration:
      Type: AWS_PROXY
      IntegrationHttpMethod: POST
      ResponseTransferMode: STREAM
      Uri: !Sub arn:aws:apigateway:${APIGW_REGION}:lambda:path/2021-11-
           15/functions/${FN_ARN}/response-streaming-invocations

Updating response transfer mode using the AWS CLI:

aws apigw update-integration \
   --rest-api-id a1b2c2 \
   --resource-id aaa111 \
   --http-method GET \
   --patch-operations "op='replace',path='/responseTransferMode',value=STREAM" \
   --region us-west-2

Using response streaming with Lambda functions

When using Lambda functions as a downstream integration endpoint, your Lambda functions must be streaming-enabled. The API Gateway uses the InvokeWithResponseStreaming API to invoke functions, as illustrated in the following diagram, and requires Lambda proxy integration. See the API Gateway documentation for additional guidance.

Figure 5. Using API Gateway response streaming with Lambda functions for interactive AI applications.

When you use response streaming with Lambda functions, API Gateway expects the handler response stream to contain the following components (in order):

  • JSON response metadata – Must be a valid JSON object and can only contain statusCode, headers, multiValueHeaders, and cookies fields (all optional). Metadata cannot be an empty string; at a minimum it must be an empty JSON object.
  • The 8-null-byte delimiter – Lambda adds this delimiter automatically when you use the built-in awslambda.HttpResponseStream.from() method, as illustrated below. When not using this method, you’re responsible for adding the delimiter yourself.
  • Response payload – Can be empty.

The following code snippet illustrates how you can return a streamed response from your Lambda functions so it will be compatible with API Gateway response streaming:

export const handler = awslambda.streamifyResponse(
   async (event, responseStream, context) => {

      const httpResponseMetadata = {
         statusCode: 200,
         headers: {
            'Content-Type': 'text/plain',
            'X-Custom-Header': 'some-value'
         }
      };

      responseStream = awslambda.HttpResponseStream.from(
         responseStream,
         httpResponseMetadata
      );

      responseStream.write('hello');
      await new Promise(r => setTimeout(r, 1000));
      responseStream.write(' world');
      await new Promise(r => setTimeout(r, 1000));
      responseStream.write('!!!');
      responseStream.end();
   }
);

Refer to the API Gateway documentation for further implementation guidelines.

Using response streaming with HTTP Proxy integrations

You can stream HTTP responses from your applications used as downstream integration endpoints, for example web servers running on Amazon Elastic Container Service (Amazon ECS) or Amazon Elastic Kubernetes Service (Amazon EKS). In this case, you must use HTTP_PROXY integration and specify the response transfer mode as STREAM (using the console, AWS CLI, or IaC). Redeploy your API after modifying it.

Figure 6. Using API Gateway response streaming with HTTP server applications.

Once API Gateway receives a streaming response from your application, it will wait until the HTTP headers block transfer is complete. Then, it will send to the client an HTTP response status code and headers, followed by the content from your application as it gets received by the API Gateway service. It will continue streaming response from your application to the client until the stream ends (up to 15 minutes).

Many popular API and web application development frameworks provide response streaming abstractions. The following code snippet illustrates how you can implement HTTP response streaming using FastAPI:

app = FastAPI()

async def stream_response():
   yield b"Hello "
   await asyncio.sleep(1)
   yield b"World "
   await asyncio.sleep(1)
   yield b"!"

@app.get("/")
async def main():
   return StreamingResponse(stream_response(), media_type="text/plain")

Adding real-time response streaming to your HTTP clients

Different HTTP clients have different ways to process streamed response fragments as they arrive. The following code snippet illustrates how to process a streamed response with a Node.js application:

const request = http.request(options, (response)=>{
   response.on('data', (chunk) => {
      console.log(chunk);
   });

   response.on('end', () => {
      console.log('Response complete’);
   });
});

request.end();

When using CURL, you can use the –no-buffer argument to print response fragments as they arrive.

curl --no-buffer {URL}

Sample code

Clone this sample project from GitHub to see API Gateway response streaming in action. Follow instructions in the README.md to provision the sample project in your AWS account.

Considerations

Before you enable response streaming, consider:

  • Response streaming is available for REST APIs and can be used with HTTP_PROXY integrations, Lambda integrations (in proxy mode), and private integrations.
  • You can use API Gateway response streaming with any endpoint type, such as Regional, Private, and Edge-optimized, with or without custom domain names.
  • When using response streaming, you can configure response timeouts up to 15 minutes, according to your scenario requirements.
  • All streaming responses from Regional or Private endpoints are subject to a 5-minute idle timeout. All streaming responses from edge-optimized endpoints are subject to a 30-second idle timeout.
  • Within each streaming response, the first 10MB of response payload is not subject to any bandwidth restrictions. Response payload data exceeding 10MB is restricted to 2MB/s.
  • Response streaming is compatible with API Gateway security capabilities such as authorizers, WAF, access controls, TLS/mTLS, request throttling, and access logging.
  • When processing streamed responses, the following features are not supported: response transformation with VTL, integration response caching, and content encoding.
  • Always protect your APIs against unauthorized access and other potential security threats by implementing proper authorization with Lambda Authorizers or Amazon Cognito User Pools. Read REST API protection documentation and API Gateway security documentation for additional details.

Observability

You can continue using existing observability capabilities, such as execution logs, access logs, AWS X-Ray integration, and Amazon CloudWatch metrics with API Gateway response streaming.

In addition to the existing access logs variables, the following new variables are available:

  • $content.integration.responseTransferMode – the response transfer mode of your integration. This can be either BUFFERED or STREAMED.
  • $context.integration.timeToAllHeaders – the time between when API Gateway establishes the integration connection to when it receives all integration response headers from the client.
  • $context.integration.timeToFirstContent – the time between when API Gateway establishes the integration connection to when it receives the first content bytes.

See API Gateway documentation for more information.

Pricing

With this new capability, you continue to pay the same API Invoke rates for streamed responses. Each 10MB of response data, rounded up to the nearest 10MB, is billed as a single request. See API Gateway pricing page for additional details.

Conclusion

The new response streaming capability for Amazon API Gateway enhances how you can build and deliver responsive APIs in the cloud. With immediate streaming of response data as it becomes available, you can significantly improve time-to-first-byte performance and overcome traditional payload size and timeout limitations. This is particularly valuable for AI-powered applications, file transfers, and interactive web experiences that demand real-time responsiveness.

To learn more about API Gateway response streaming see the service documentation.

To learn more about building Serverless architectures see Serverless Land.

Simplified developer access to AWS with ‘aws login’

Post Syndicated from Shreya Jain original https://aws.amazon.com/blogs/security/simplified-developer-access-to-aws-with-aws-login/

Getting credentials for local development with AWS is now simpler and more secure. A new AWS Command Line Interface (AWS CLI) command, aws login, lets you start building immediately after signing up for AWS without creating and managing long-term access keys. You use the same sign-in method you already use for the AWS Management Console.

In this blog, we’ll show you how to get temporary credentials to your workstation for use with the AWS CLI, AWS Software Development Kits (AWS SDKs), and tools or applications built using them with the new aws login command.
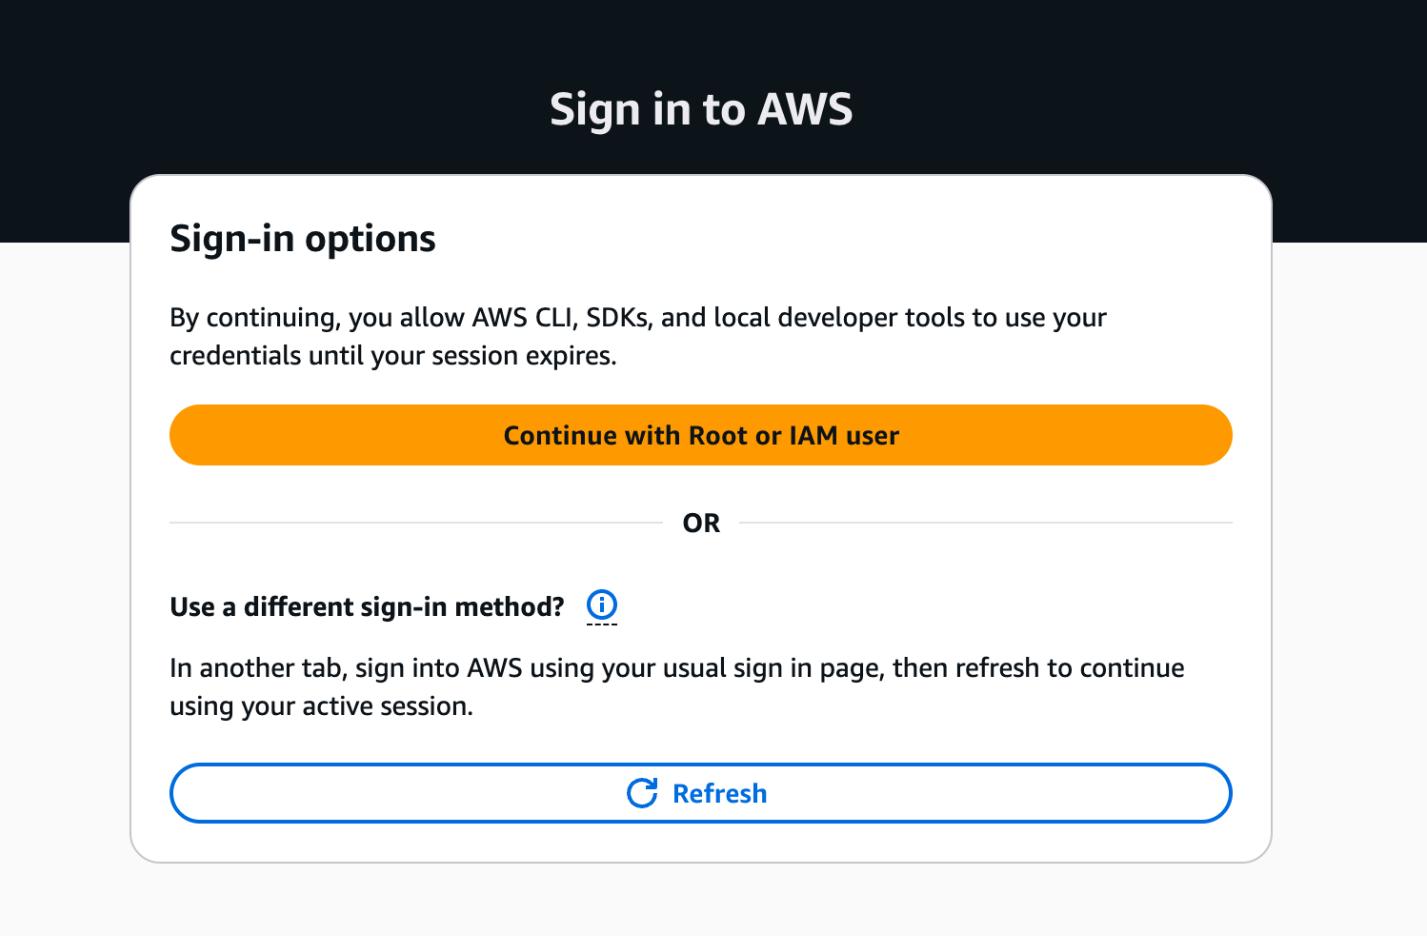
Getting started with programmatic access to AWS

You can use the aws login command with your AWS Management Console sign-in method, as described in the following sections.

Scenario 1: Using IAM credentials (root or IAM user)

To obtain programmatic credentials using your root or IAM user username and password:

  1. Install the latest AWS CLI (version 2.32.0 or later).
  2. Run the aws login command.
  3. If you have not set a default Region, the CLI prompts you to specify the AWS Region of your choice (e.g., us-east-2, eu-central-1). The CLI remembers which Region you set once you enter it into this prompt.
    Figure 1: CLI Region prompt

    Figure 1: CLI Region prompt

  4. The CLI opens your default browser.
  5. Follow the instructions in the browser window:
    1. If you have already signed into the AWS Management Console, you will see a screen that says, “Continue with an active session.”
      Figure 2: Sign in to AWS - active session selection

      Figure 2: Sign in to AWS – active session selection

    2. If you haven’t signed into the AWS Management Console, you will see the sign-in options page. Select “Continue with Root or IAM user” and log in to your AWS account.
      Figure 3: AWS Sign in to AWS - Sign-in options

      Figure 3: AWS Sign in to AWS – Sign-in options

  6. Success! You’re ready to run AWS CLI commands. Try the aws sts get-caller-identity command to verify the identity you’re currently using.
    Figure 4: Sign in to AWS - completion

    Figure 4: Sign in to AWS – completion

Scenario 2: Using federated sign-in

This scenario applies when you authenticate through your organization’s identity provider. To retrieve programmatic credentials for roles you assumed with federation:

  1. Complete steps 1–4 from Scenario 1, then continue with the following instructions.
  2. Follow the instructions in the browser window:
    1. If you have already signed into the AWS Management Console, the browser provides you with the option to select your active IAM role session from federated sign-in to the console. This enables you to switch between 5 active AWS sessions if you have multi-session support enabled on your AWS Management Console.
      Figure 5: Sign in to AWS - active IAM role session selection

      Figure 5: Sign in to AWS – active IAM role session selection

    2. If you have not signed into the AWS Management Console or want to get temporary credentials for a different IAM role, sign into your AWS account using your current authentication mechanism in another browser tab. Upon successful login, switch back to this tab and select the “Refresh” button. Your console session should now be available under the active sessions.
  3. Return to the AWS CLI once you have successfully completed the aws login process.

Regardless of the console sign-in method you choose, the temporary credentials issued by the aws login command are automatically rotated by the AWS CLI, AWS Tools for PowerShell and AWS SDKs every 15 minutes. They are valid up to the set session duration of the IAM principal (maximum of 12 hours). After reaching the session duration limit, you will be prompted to log in again.

Figure 6: AWS Sign in - session expiration

Figure 6: AWS Sign in – session expiration

Accessing AWS using local developer tools

The aws login command supports switching between multiple AWS accounts and roles using profiles. You can configure a profile with aws login --profile <PROFILE_NAME> and run AWS commands with the profile using: aws sts get-caller-identity --profile <PROFILE_NAME>. The short-term credentials issued by aws login work with more than the AWS CLI. You can also use them with:

  • AWS SDKs: If you use AWS SDKs for development, the SDK clients can use these temporary credentials to authenticate with AWS.
  • AWS Tools for PowerShell: Use the Invoke-AWSLogin command.
  • Remote development servers: Use aws login --remote on a remote server without browser access, to deliver temporary credentials from your device with browser access to the AWS console.
  • Older versions of AWS SDKs that do not support the new console credentials provider: Any software written using these older SDKs can support credentials delivered by aws login by using the credential_process provider with the AWS CLI.

Controlling access to aws login with IAM policies

The aws login command is controlled by two IAM actions: signin:AuthorizeOAuth2Access and signin:CreateOAuth2Token. Use the SignInLocalDevelopmentAccess managed policy or add these actions to your IAM policies to allow IAM users and IAM roles with console access to use this feature.

AWS Organizations customers looking to control the usage of this login feature on member accounts can deny the two actions above using Service Control Policies (SCPs). These IAM actions and their resources are usable in all relevant IAM policies.

AWS recommends using centralized root access management in AWS Organizations to eliminate long-term root credentials from member accounts. This feature allows security teams to perform privileged tasks through short-term, task-scoped root sessions from a central management account. After you enable centralized root management and delete root credentials on member accounts, root login to member accounts is denied, which also prevents programmatic access with root credentials using aws login. For developers using root credentials or IAM users, aws login delivers short-lived credentials to development tools, providing a secure alternative to long-term static access keys.

Logging and security of programmatic access using aws login

AWS Sign-In logs API activity through AWS CloudTrail, which now includes two new events specific to aws login. The service logs two new event names called AuthorizeOAuth2Access and CreateOauth2Token in the AWS Region where the user logs in.

Here’s a CloudTrail sample for an AuthorizeOAuth2Access event:

{
    "eventVersion": "1.11",
    "userIdentity": {
        "type": "AssumedRole",
        "principalId": "AROATJHQDX737YZP72NTF:testuser”,
        "arn": "arn:aws:sts::225989345271:assumed-role/Admin/testuser,
        "accountId": “111111111111”,
        "sessionContext": {
            "sessionIssuer": {
                "type": "Role",
                "principalId": "AROATJHQDX737YZP72NTF",
                "arn": "arn:aws:iam::111111111111:role/Admin",
                "accountId": “11111111111”,
                "userName": "Admin"
            },
            "attributes": {
                "creationDate": "2025-11-17T22:50:14Z",
                "mfaAuthenticated": "false"
            }
        }
    },
    "eventTime": "2025-11-17T22:51:32Z",
    "eventSource": "signin.amazonaws.com",
    "eventName": "AuthorizeOAuth2Access",
    "awsRegion": "us-east-1",
    "sourceIPAddress": “192.0.2.2”,
    "userAgent": "Mozilla/5.0 (Macintosh; Intel Mac OS X 10_15_7) AppleWebKit/537.36 (KHTML, like Gecko) Chrome/142.0.0.0 Safari/537.36",
    "requestParameters": {
        "scope": "openid",
        "redirect_uri": "http://127.0.0.1:53037/oauth/callback",
        "code_challenge_method": "SHA-256",
        "client_id": "arn:aws:signin:::devtools/same-device"
    },
    "responseElements": null,
    "additionalEventData": {
        "success": "true",
        "x-amzn-vpce-id": ""
    },
    "requestID": "e2854c76-1cba-4360-9fd1-5037b591466b",
    "eventID": "59e1720d-3deb-44ff-933d-6828be2a860a",
    "readOnly": true,
    "eventType": "AwsApiCall",
    "managementEvent": true,
    "recipientAccountId": “111111111111”,
    "eventCategory": "Management",
    "tlsDetails": {
        "tlsVersion": "TLSv1.3",
        "cipherSuite": "TLS_AES_128_GCM_SHA256",
        "clientProvidedHostHeader": "us-east-1.signin.aws.amazon.com"
    }
}

Here’s a CloudTrail sample for a CreateOAuth2Token event:

{
    "eventVersion": "1.11",
    "userIdentity": {
        "type": "AssumedRole",
        "principalId": "AROATJHQDX737YZP72NTF:testuser-Isengard",
        "arn": "arn:aws:sts::111111111111:assumed-role/Admin/testuser-Isengard",
        "accountId": "111111111111",
        "sessionContext": {
            "sessionIssuer": {
                "type": "Role",
                "principalId": "AROATJHQDX737YZP72NTF",
                "arn": "arn:aws:iam::111111111111:role/Admin",
                "accountId": "111111111111",
                "userName": "Admin"
            },
            "attributes": {
                "creationDate": "2025-11-18T20:38:10Z",
                "mfaAuthenticated": "false"
            }
        }
    },
    "eventTime": "2025-11-18T20:38:44Z",
    "eventSource": "signin.amazonaws.com",
    "eventName": "CreateOAuth2Token",
    "awsRegion": "us-east-1",
    "sourceIPAddress": "192.0.2.2",
    "userAgent": "aws-cli/2.32.0 md/awscrt#0.28.4 ua/2.1 os/macos#24.6.0 md/arch#arm64 lang/python#3.13.9 md/pyimpl#CPython m/b,AA,Z,E cfg/retry-mode#standard md/installer#exe sid/35033f4ca1bd md/prompt#off md/command#login",
    "requestParameters": {
        "client_id": "arn:aws:signin:::devtools/same-device"
    },
    "responseElements": null,
    "additionalEventData": {
        "success": "true",
        "x-amzn-vpce-id": ""
    },
    "requestID": "94562943-c85b-4dc1-bf72-43b0fd42d6de",
    "eventID": "0b338fac-6a10-4740-b34d-1bb6923e799e",
    "readOnly": true,
    "eventType": "AwsApiCall",
    "managementEvent": true,
    "recipientAccountId": "111111111111",
    "eventCategory": "Management",
    "tlsDetails": {
        "tlsVersion": "TLSv1.3",
        "cipherSuite": "TLS_AES_128_GCM_SHA256",
        "clientProvidedHostHeader": "us-east-1.signin.aws.amazon.com"
    }
}

The aws login command uses the OAuth 2.0 authorization code flow with PKCE (Proof Key for Code Exchange) to protect against authorization code interception attacks. This provides a secure alternative to setting up IAM user access keys for getting started with development on AWS. For guidance on additional modern authentication approaches and alternatives to long-term IAM access keys, see the AWS Security Blog post “Beyond IAM access keys: Modern authentication approaches for AWS.”

Conclusion

The login for AWS local development feature is a secure-by-default enhancement that helps customers eliminate the use of long-term credentials for programmatic access with AWS. With aws login, you can start building immediately using the same credentials you use to sign in to the AWS Management Console. This feature is now available across all AWS commercial Regions (excluding China and GovCloud) at no additional cost to customers.

For more information, visit the authentication and access section in the CLI user guide.

If you have feedback about this post, submit comments in the Comments section below.

Shreya Jain

Shreya Jain

Shreya is a Senior Technical Product Manager in AWS Identity. She is energized by bringing clarity and simplicity to complex ideas. When she’s not applying her creative energy at work, you’ll find her at Pilates, dancing, or discovering her next favorite coffee shop.

Sowjanya Rajavaram

Sowjanya Rajavaram

Sowjanya is a Sr Solutions Architect who specializes in Identity and Security in AWS. She works on helping customers of all sizes solve their identity and access management problems. She enjoys traveling and exploring new cultures and food.

AWS designated as a critical third-party provider under EU’s DORA regulation

Post Syndicated from Andrew Vennekotter original https://aws.amazon.com/blogs/security/aws-designated-as-a-critical-third-party-provider-under-eus-dora-regulation/

Amazon Web Services has been designated as a critical third-party provider (CTPP) by the European Supervisory Authorities (ESAs) under the European Union’s Digital Operational Resilience Act (DORA).

This designation is a key milestone in the EU’s implementation of DORA, which took effect in January 2025 and aims to strengthen the operational resilience of the EU financial sector. Under this regulation, certain third-party information and communications technology (ICT) service providers identified as playing a critical role for financial entities in the EU are subject to direct joint oversight by the European Banking Authority (EBA), the European Securities and Markets Authority (ESMA), and the European Insurance and Occupational Pensions Authority (EIOPA).

AWS recognizes the significance of this oversight for our financial services customers as they advance their digital transformation and modernization efforts, which remain essential to their long-term resilience and competitiveness.

What the CTPP designation means for customers

  • Financial institutions that use AWS services should note that AWS is engaged in an active oversight relationship with the ESAs.
  • AWS will maintain its commitment to operational resilience as part of the oversight activities associated with the designation.
  • Customers can use AWS security, resilience, and compliance features while maintaining control over their own cloud environments and compliance journeys.

Proven readiness for DORA oversight

AWS has been engaging with EU institutions, national competent authorities, and the broader financial regulatory community for years, helping to build a more resilient and secure financial system.

Our readiness for this oversight process builds on our demonstrated experience in meeting rigorous operational and regulatory standards. AWS has made, and will continue to make, investments in compliance, risk management, operational resilience, and transparency, which are critical pillars of DORA.

Being designated as a CTPP means AWS will now participate in a formal oversight process. We expect that this process will promote a deeper understanding of how AWS and other cloud technologies help enhance the resilience of the financial services industry.

Supporting customers through DORA implementation

Although AWS is now subject to direct oversight under DORA, we remain equally focused on supporting our financial services customers that are subject to the regulation.

Operational resilience is both a compliance requirement for DORA and a business necessity. Our services are designed to help financial institutions achieve high availability, durability, and scalability, while maintaining robust controls and visibility into their operations.

Our dedicated team of security and compliance specialists is ready to assist financial organizations in understanding how AWS security and compliance features can help them fulfill their obligations under DORA and how AWS services help to support their compliance strategies. We offer detailed documentation, whitepapers, and compliance guides tailored to DORA’s key requirements, such as the AWS User Guide to DORA and Amazon Web Services’ Approach to Operational Resilience in the Financial Sector & Beyond. To learn more about our security and compliance resources, visit the AWS Trust Center. Customers can also download our third-party attestations and certifications through AWS Artifact.

If you have feedback about this post, submit comments in the Comments section below.

Andrew Vennekotter

Andrew Vennekotter

Andrew is the Head of Regulatory Assurance for EMEA within the AWS Security organization. He combines 16 years of public sector experience in technology policy, cybersecurity, counterterrorism, and security policy at NASA and the U.S. State Department with nine years of experience in software engineering, information security, and responsible AI. In his spare time, he enjoys hiking, coming up with new dad jokes, and pretending to be a novelist.

Accelerate workflow development with enhanced local testing in AWS Step Functions

Post Syndicated from Donnie Prakoso original https://aws.amazon.com/blogs/aws/accelerate-workflow-development-with-enhanced-local-testing-in-aws-step-functions/

Today, I’m excited to announce enhanced local testing capabilities for AWS Step Functions through the TestState API, our testing API.

These enhancements are available through the API, so you can build automated test suites that validate your workflow definitions locally on your development machines, test error handling patterns, data transformations, and mock service integrations using your preferred testing frameworks. This launch introduces an API-based approach for local unit testing, providing programmatic access to comprehensive testing capabilities without deploying to Amazon Web Services (AWS).

There are three key capabilities introduced in this enhanced TestState API:

  • Mocking support – Mock state outputs and errors without invoking downstream services, enabling true unit testing of state machine logic. TestState validates mocked responses against AWS API models with three validation modes: STRICT (this is the default and validates all required fields), PRESENT (validates field types and names), and NONE (no validation), providing high-fidelity testing.

  • Support for all state types – All state types, including advanced states such as Map states (inline and distributed), Parallel states, activity-based Task states, .sync service integration patterns, and .waitForTaskToken service integration patterns, can now be tested. This means you can use TestState API across your entire workflow definition and write unit tests to verify control flow logic, including state transitions, error handling, and data transformations.

  • Testing individual states – Test specific states within a full state machine definition using the new stateName parameter. You can provide the complete state machine definition one time and test each state individually by name. You can control execution context to test specific retry attempts, Map iteration positions, and error scenarios.

Getting started with enhanced TestState
Let me walk you through these new capabilities in enhanced TestState.

Scenario 1: Mock successful results

The first capability is mocking support, which you can use to test your workflow logic without invoking actual AWS services or even external HTTP requests. You can either mock service responses for fast unit testing or test with actual AWS services for integration testing. When using mocked responses, you don’t need AWS Identity and Access Management (IAM) permissions.

Here’s how to mock a successful AWS Lambda function response:

aws stepfunctions test-state --region us-east-1 \
--definition '{
  "Type": "Task",
  "Resource": "arn:aws:states:::lambda:invoke",
  "Parameters": {"FunctionName": "process-order"},
  "End": true
}' \
--mock '{"result":"{\"orderId\":\"12345\",\"status\":\"processed\"}"}' \
--inspection-level DEBUG

This command tests a Lambda invocation state without actually calling the function. TestState validates your mock response against the Lambda service API model so your test data matches what the real service would return.

The response shows the successful execution with detailed inspection data (when using DEBUG inspection level):

{
    "output": "{\"orderId\":\"12345\",\"status\":\"processed\"}",
    "inspectionData": {
        "input": "{}",
        "afterInputPath": "{}",
        "afterParameters": "{\"FunctionName\":\"process-order\"}",
        "result": "{\"orderId\":\"12345\",\"status\":\"processed\"}",
        "afterResultSelector": "{\"orderId\":\"12345\",\"status\":\"processed\"}",
        "afterResultPath": "{\"orderId\":\"12345\",\"status\":\"processed\"}"
    },
    "status": "SUCCEEDED"
}

When you specify a mock response, TestState validates it against the AWS service’s API model so your mocked data conforms to the expected schema, maintaining high-fidelity testing without requiring actual AWS service calls.

Scenario 2: Mock error conditions
You can also mock error conditions to test your error handling logic:

aws stepfunctions test-state --region us-east-1 \
--definition '{
  "Type": "Task",
  "Resource": "arn:aws:states:::lambda:invoke",
  "Parameters": {"FunctionName": "process-order"},
  "End": true
}' \
--mock '{"errorOutput":{"error":"Lambda.ServiceException","cause":"Function failed"}}' \
--inspection-level DEBUG

This simulates a Lambda service exception so you can verify how your state machine handles failures without triggering actual errors in your AWS environment.

The response shows the failed execution with error details:

{
    "error": "Lambda.ServiceException",
    "cause": "Function failed",
    "inspectionData": {
        "input": "{}",
        "afterInputPath": "{}",
        "afterParameters": "{\"FunctionName\":\"process-order\"}"
    },
    "status": "FAILED"
}

Scenario 3: Test Map states
The second capability adds support for previously unsupported state types. Here’s how to test a Distributed Map state:

aws stepfunctions test-state --region us-east-1 \
--definition '{
  "Type": "Map",
  "ItemProcessor": {
    "ProcessorConfig": {"Mode": "DISTRIBUTED", "ExecutionType": "STANDARD"},
    "StartAt": "ProcessItem",
    "States": {
      "ProcessItem": {
        "Type": "Task", 
        "Resource": "arn:aws:states:::lambda:invoke",
        "Parameters": {"FunctionName": "process-item"},
        "End": true
      }
    }
  },
  "End": true
}' \
--input '[{"itemId":1},{"itemId":2}]' \
--mock '{"result":"[{\"itemId\":1,\"status\":\"processed\"},{\"itemId\":2,\"status\":\"processed\"}]"}' \
--inspection-level DEBUG

The mock result represents the complete output from processing multiple items. In this case, the mocked array must match the expected Map state output format.

The response shows successful processing of the array input:

{
    "output": "[{\"itemId\":1,\"status\":\"processed\"},{\"itemId\":2,\"status\":\"processed\"}]",
    "inspectionData": {
        "input": "[{\"itemId\":1},{\"itemId\":2}]",
        "afterInputPath": "[{\"itemId\":1},{\"itemId\":2}]",
        "afterResultSelector": "[{\"itemId\":1,\"status\":\"processed\"},{\"itemId\":2,\"status\":\"processed\"}]",
        "afterResultPath": "[{\"itemId\":1,\"status\":\"processed\"},{\"itemId\":2,\"status\":\"processed\"}]"
    },
    "status": "SUCCEEDED"
}

Scenario 4: Test Parallel states
Similarly, you can test Parallel states that execute multiple branches concurrently:

aws stepfunctions test-state --region us-east-1 \
--definition '{
  "Type": "Parallel",
  "Branches": [
    {"StartAt": "Branch1", "States": {"Branch1": {"Type": "Pass", "End": true}}},
    {"StartAt": "Branch2", "States": {"Branch2": {"Type": "Pass", "End": true}}}
  ],
  "End": true
}' \
--mock '{"result":"[{\"branch1\":\"data1\"},{\"branch2\":\"data2\"}]"}' \
--inspection-level DEBUG

The mock result must be an array with one element per branch. By using TestState, your mock data structure matches what a real Parallel state execution would produce.

The response shows the parallel execution results:

{
    "output": "[{\"branch1\":\"data1\"},{\"branch2\":\"data2\"}]",
    "inspectionData": {
        "input": "{}",
        "afterResultSelector": "[{\"branch1\":\"data1\"},{\"branch2\":\"data2\"}]",
        "afterResultPath": "[{\"branch1\":\"data1\"},{\"branch2\":\"data2\"}]"
    },
    "status": "SUCCEEDED"
}

Scenario 5: Test individual states within complete workflows
You can test specific states within a full state machine definition using the stateName parameter. Here’s an example testing a single state, though you would typically provide your complete workflow definition and specify which state to test:

aws stepfunctions test-state --region us-east-1 \
--definition '{
  "Type": "Task",
  "Resource": "arn:aws:states:::lambda:invoke",
  "Parameters": {"FunctionName": "validate-order"},
  "End": true
}' \
--input '{"orderId":"12345","amount":99.99}' \
--mock '{"result":"{\"orderId\":\"12345\",\"validated\":true}"}' \
--inspection-level DEBUG

This tests a Lambda invocation state with specific input data, showing how TestState processes the input and transforms it through the state execution.

The response shows detailed input processing and validation:

{
    "output": "{\"orderId\":\"12345\",\"validated\":true}",
    "inspectionData": {
        "input": "{\"orderId\":\"12345\",\"amount\":99.99}",
        "afterInputPath": "{\"orderId\":\"12345\",\"amount\":99.99}",
        "afterParameters": "{\"FunctionName\":\"validate-order\"}",
        "result": "{\"orderId\":\"12345\",\"validated\":true}",
        "afterResultSelector": "{\"orderId\":\"12345\",\"validated\":true}",
        "afterResultPath": "{\"orderId\":\"12345\",\"validated\":true}"
    },
    "status": "SUCCEEDED"
}

These enhancements bring the familiar local development experience to Step Functions workflows, helping me to get instant feedback on changes before deploying to my AWS account. I can write automated test suites to validate all Step Functions features with the same reliability as cloud execution, providing confidence that my workflows will work as expected when deployed.

Things to know
Here are key points to note:

  • Availability – Enhanced TestState capabilities are available in all AWS Regions where Step Functions is supported.
  • Pricing – TestState API calls are included with AWS Step Functions at no additional charge.
  • Framework compatibility – TestState works with any testing framework that can make HTTP requests, including Jest, pytest, JUnit, and others. You can write test suites that validate your workflows automatically in your continuous integration and continuous delivery (CI/CD) pipeline before deployment.
  • Feature support – Enhanced TestState supports all Step Functions features including Distributed Map, Parallel states, error handling, and JSONata expressions.
  • Documentation – For detailed options for different configurations, refer to the TestState documentation and API reference for the updated request and response model.

Get started today with enhanced local testing by integrating TestState into your development workflow.

Happy building!
— Donnie

Optimize latency-sensitive workloads with Amazon EC2 detailed NVMe statistics

Post Syndicated from Sanjeev Malladi original https://aws.amazon.com/blogs/compute/optimize-latency-sensitive-workloads-with-amazon-ec2-detailed-nvme-statistics/

Amazon Elastic Cloud Compute (Amazon EC2) instances with locally attached NVMe storage can provide the performance needed for workloads demanding ultra-low latency and high I/O throughput. High-performance workloads, from high-frequency trading applications and in-memory databases to real-time analytics engines and AI/ML inference, need comprehensive performance tracking. Operating system tools like iostat and sar provide valuable system-level insights, and Amazon CloudWatch offers important disk IOPs and throughput measurements, but high-performance workloads can benefit from even more detailed visibility into instance store performance.

For latency-sensitive applications where every millisecond counts, enhanced performance monitoring tools provide deep visibility into storage systems, so your teams can track and analyze behavior at a 1 second granularity. This detailed insight can help your organization detect bottlenecks quickly, fine-tune application performance, and deliver reliable service.

In this post, we discuss how you can use Amazon EC2 detailed performance statistics for instance store NVMe volumes, a set of new metrics that provide per-second granularity, to provide real-time visibility into your locally attached storage performance. These statistics are similar to the Amazon EBS detailed performance statistics, providing a consistent monitoring experience across both storage types. You can access these statistics directly from your NVMe devices attached to the Amazon EC2 instance using nvme-cli or using CloudWatch agent to monitor I/O performance at the storage level. We also provide examples of how to use these statistics to identify performance bottlenecks.

Feature overview

Amazon EC2 Nitro-based instances with locally attached NVMe instance storage now offer 11 comprehensive metrics at per-second granularity. These metrics, similar to EBS volume metrics, include queue length measurements, IOPS, throughput data, and IO latency histograms for the locally attached NVMe instance storage. Additionally, they also include IO size-specific latency histograms to provide even more detailed insights into performance patterns of the local NVMe instance storage. These metrics are collected and presented separately for each individual NVMe volume available on an instance.

The statistics are presented in three main formats:

    1. Cumulative counters that track IO operations, throughput, and read/write times
    2. Real-time queue length, displaying the current value at the time of your query
    3. Latency histograms visualizing the distribution of IO operations across different latency ranges by displaying both cumulative view and IO size-specific distributions

Prerequisites

To access detailed performance statistics for local instance storage, complete the following steps:

    1. Launch a new Amazon EC2 Nitro instance or use an existing one, then connect to it using SSH or your preferred connection method.
    2. Identify the NVMe device associated with the local storage to query for the performance statistics. For example, you can run the nvme-cli command in the CLI to output all NVMe devices on the instance.
      $ sudo nvme list.

      The following is an example output of the list command that lists the NVMe devices on the instance and their volume Serial Numbers (SN; masked in the below output for privacy). In this demonstration, consider that the local storage used by your application is /dev/nvme1n1.

      Terminal output showing five NVMe devices: one EBS volume and four EC2 instance storage volumes with 3.75TB capacity each

    3. If you are using Amazon Linux 2023 version 2023.8.20250915 (or later) or Amazon Linux 2 2.0.20251014.0 (or later) you can proceed to Step 4 because nvme-cli will use the latest version. If you are using an earlier Amazon Linux version, update the nvme-cli using the following command, where 2023.8.20250915 can be replaced with the latest Amazon Linux 2023 version:
      $ sudo dnf upgrade --releasever=2023.8.20250915
    4. Run the nvme-cli, with the correct permissions, and pass the device as a parameter. You can use --help to get details on the command usage:
      $ sudo nvme amzn stats --help

      Example output:
      Command help output for 'nvme amzn stats' showing usage syntax and format options
      If you prefer output in a JSON format, you can provide the -o json parameter to the command.

      $ sudo nvme amzn stats /dev/nvme1n1 -o json

      The following output (without the -o json parameter) shows cumulative read/write operations, read/write bytes, total processing time (read and write in microseconds), and duration (in microseconds) when application attempted to exceed the instance’s IOPS/throughput limits.
      Storage performance metrics showing read operations count, total bytes, and timing statistics for an EC2 NVMe volume
      It also displays read/write I/O latency histograms, with each row representing completed I/O operations within a specific bin of time (in microseconds).
      Read latency distribution histogram showing operation counts across different microsecond ranges, with peak activity in 2048-4096 rangeWrite latency distribution histogram showing zero operations across all time ranges, indicating no write activity
      If you want to view the latency histograms across 5 different IO bands: (0, 512 Byte], (512B, 4KiB], (4KiB, 8KiB], (8KiB 32KiB], (32 KiB, MAX], you can provide --details or -d parameter to the command:

      $ sudo nvme amzn stats -d /dev/nvme1n

      The following image is an excerpt of the above command’s output, showing the additional latency histograms (read and write) of the 5 different IO bands.
      Dual read/write I/O latency histogram analyzing small block operations from 0-512 bytes with peak at 4096-8192 rangePerformance analysis histogram showing I/O patterns for 512-4K blocks with significant activity in 512-1024 rangeDual histogram showing I/O latency patterns for 4K-8K block operations with concentrated activity at 4096-8192Performance analysis histogram displaying I/O patterns for 8K-32K blocks with peak activity in 4096-8192 rangeComprehensive I/O latency histogram analyzing largest block sizes from 32K to maximum with concentrated activity in 4096-8192

You can run the stats command at a per second granularity. You can also write scripts to pull the stats at a desired interval (every second or any other duration) with each subsequent output reflecting the updated cumulative totals for the metrics. Calculating the difference in the statistics across the last two outputs allows you to derive insight into the instance storage profile during the interval. Below is a sample script you can use to pull the stats at a default interval of 1 second or at your desired interval.

#!/bin/bash 
# interval of 1 second 
INTERVAL=${1:-1} 
while true; do 
	echo "=== $(date) ===" 
	sudo nvme amzn stats /dev/nvme1 || break 
	echo 
	sleep $INTERVAL 
done

You can save this script, make it executable and run it at either the default 1-second interval or provide a custom interval when executing the script. For example, if you saved the script as nvme_stats.sh, you could use the following commands to make it executable and run to get the output at the default 1-second interval (assuming you are in the same directory as that of nvme_stats.sh).

chmod +x nvme_stats.sh
./nvme_stats.sh

If, for instance, you want to get the output at every 5 seconds, you can use the command below (after making the script executable)

./nvme_stats.sh 5

You can also integrate with CloudWatch using CloudWatch agent to collect and publish these statistics for historical tracking, trend visualization through dashboards, and performance-based alerts to correlate with application metrics and automated notifications for performance issues.

Deriving insights from the Amazon EC2 instance store NVMe detailed performance statistics

Similar to EBS detailed performance statistics, you can use Amazon EC2 instance store NVMe statistics to troubleshoot various workload performance issues. As mentioned in the preceding section, you can also use the detailed statistics to view I/O latency histograms to observe the spread of I/O latency within the period. You can use the read/write operations and time spent statistics to calculate the average latency. The detailed statistics show the average latency at per-second granularity.

The next two example scenarios demonstrate key performance analysis using the statistics. In Scenario 1, we will use the EC2 Instance Local Storage Performance Exceeded (us) metric to check if I/O demands exceed instance storage capabilities, helping with instance right-sizing for sufficient I/O application performance. In Scenario 2, we will use IO-size specific histograms (using --details) to diagnose how large block writes affect subsequent read performance – an issue typically hidden by traditional monitoring tools’ aggregated metrics across all IO sizes.

Scenario 1: Identifying when applications exceed instance storage performance limits

Understanding whether your application’s I/O demands exceed your instance store volumes’ capabilities is important for performance troubleshooting. When applications generate I/O workloads that consistently attempt to exceed the IOPS and throughput limits of specific Amazon EC2 instance types, you’ll experience increased latency and degraded performance. The EC2 Instance Local Storage Performance Exceeded (us) metric helps identify these scenarios by showing the duration (in microseconds) when workloads exceeded supported instance performance. A non-zero value or increasing count between snapshots indicates your current instance size or type may not provide sufficient I/O performance for your application.

The following section shows how to identify if an application is sending more IOPS than the instance’s local storage can support.

The example scenario: An application on an i3en.xlarge instance shows elevated write latency of >1ms. You want to determine if the application’s workload is exceeding the instance’s NVMe volume supported performance.

    1. Select the Instance Storage NVMe device you want to analyze – Identify the instance you want to analyze for the application experiencing elevated latency.
    2. Identify the NVMe device – Use the following nvme-cli command, and identify the NVMe device associated with that instance storage.
      $ sudo nvme list

      Example scenario: We used the list and identified /dev/nvme1n1 as the NVMe device associated with the i3en.xlarge instance that is running the application which is currently seeing elevated write latency >1ms (while read latency is <50us as per normal conditions), so now we want to. analyze it.

    3. Collect statistics for the device at a single point in time or at desired intervals – Collect the detailed performance statistics using the nvme-cli command or use the sample script provided in previous section to capture statistics at the desired intervals, if needed.
      $ sudo nvme amzn stats /dev/nvme1n1

      Example scenario: We choose to collect the statistics only once after noticing elevated write latency of the application.

    4. Analyze the statistics to check if the application demands more than the supported performance of the instance storage – Confirm existence of overall I/O latency degradation by comparing two sets of read/write I/O latency histograms taken some time apart.Example scenario: The following output shows Read IO histogram of the NVMe local instance storage taken 40 seconds apart with no read IO latency issues (as normal read latency for this workload is < 50 us).

      Metric captured at time T:
      AWS EC2 storage performance histogram showing read latency distribution, peak at 16-32 microsecond bucket
      Metric captured at time T+40s:
      AWS EC2 storage performance data showing increased read latency concentration in 16-32 microsecond bucket
      The following output shows Write IO histogram taken 40 seconds apart. We can discern that many write IOs fall into the 1ms – 2ms latency range, which is not expected for this application.
      Metric captured at time T:
      AWS EC2 storage write performance data showing majority of operations between 1-2ms latency
      Metric captured at time T+40s:
      AWS EC2 storage performance metrics showing increased write operations clustered in 1-2ms latency range

    5. Analyze the EC2 Instance Local Storage Performance Exceeded (us) metric which shows total time (in microseconds) IOPS requests exceed volume limits. Ideally, the incremental count of this metric between two snapshot times should be minimal, as any value above 0 indicates that the workload demanded more IOPS than the volume could deliver.Example scenario: Comparing metrics 40 seconds apart shows that for more than 34 seconds, the application’s IOPS demands surpassed the IOPS supported by the local instance storage. This explains elevated write latency: excess IOPS above what the underlying storage can physically handle queue the operations, increasing wait times. This indicates that the i3en.xlarge instance chosen to run this application cannot meet the application’s performance requirements, suggesting either upgrading to a larger instance size or re-evaluating the instance type itself.
      Metric captured at time T:
      EC2 Instance Local Storage Performance exceeded output of nvme-cli for the described scenario at time T
      Metric captured at time T+40s:
      EC2 Instance Local Storage Performance exceeded output of nvme-cli for the described scenario at time T+40 with increased count of metric

It’s important to have the right instance size to avoid performance bottlenecks to your application. Refer to the Amazon EC2 instance documentation for more information on the different instances and their storage size.

Scenario 2: Identifying the block size causing elevated latency in your applications

Many storage performance issues arise from complex interactions between read and write operations with different I/O sizes, which traditional system-level monitoring tools like iostat or sar cannot effectively diagnose due to their aggregated metrics across all I/O sizes. EC2 instance store NVMe detailed performance statistics solves this by providing I/O-size specific latency histograms through the --details option in NVMe CLI. These histograms show latency data for different I/O size ranges: (0, 512 Byte], (512B, 4KiB], (4KiB, 8KiB], (8KiB, 32KiB], (32KiB, MAX], for a more precise correlation between application workload patterns and I/O size-specific latency metrics for targeted optimizations.

In this example scenario, your application performs small reads (typically <=4KiB, like metadata read) followed by large writes (>=32KiB) and shows unexpectedly high read latency. This common issue occurs when large writes impact subsequent read operations’ performance, creating a cascading effect on overall I/O performance.

    1. Gather read and write IO latency by size ranges – Use the NVMe CLI with the --details option to gather read and write IO latency by size ranges:
      $ sudo nvme amzn stats /dev/nvme1n1 --details

    2. Confirm existence of overall IO latency degradation – In the example scenario, examining overall IO latency, both read (left) and write (right) operations are showing higher than expected latency.
      NVMe storage read latency histogram highlighting concentrated IO operations in 4K-16K microsecond rangeNVMe storage write latency histogram highlighting concentrated IO operations in 8-32K microsecond range
    3. Examine the output for patterns across different IO size bands – Analyzing latency by operation sizes shows small read operations (512 bytes to 4K), typically fast, are experiencing unexpected latency spikes while large writes (32K+) show significant delays. Small reads should theoretically maintain good performance regardless of other I/O activities.
      NVMe storage read/write latency histogram highlighting concentrated IO operations in 8-16K microsecond range for IO band of 512 - 4KNVMe storage read/write latency histogram highlighting concentrated IO operations in 8-16K microsecond range in IO band 32K and above
      The observed pattern indicates that the backed-up large write operations create system-wide congestion, affecting all I/O operations of types and sizes. Despite the storage system’s capability to handle small reads efficiently, the queued large writes slow down both read and write operations at the application level.

Based on this analysis, we can implement several targeted optimizations to the application, like using smaller block sizes for write operations when possible, or batching smaller writes instead of performing large single writes.

Clean up

If you created an Amazon EC2 instance with NVMe volume for this exercise, then terminate and delete the appropriate instance to avoid future costs.

Conclusion

Amazon EC2 detailed performance statistics for instance store NVMe volumes provide real-time, sub-minute storage performance monitoring, similar to the detailed performance statistics available for Amazon EBS volumes. This offers consistent monitoring experience across both storage types, with additional IO-size based latency histograms for instance storage for better optimization of I/O patterns, and more effective troubleshooting.

To learn more about Amazon EC2 instance store NVMe volumes, optimization techniques for latency-sensitive workloads or other Amazon EC2 related topics, visit the Amazon EC2 documentation page or explore our other AWS Storage Blog posts on performance optimization.

We’d love to hear how you’re using these statistics to enhance your workloads, or if you have any questions, in the comments section below.

The collective thoughts of the interwebz