Tag Archives: Internet of Things

Introducing AWS IoT Core Device Location integration with Amazon Sidewalk

Post Syndicated from Channy Yun (윤석찬) original https://aws.amazon.com/blogs/aws/introducing-aws-iot-core-device-location-integration-with-amazon-sidewalk/

Today, I’m happy to announce a new capability to resolve location data for Amazon Sidewalk enabled devices with the AWS IoT Core Device Location service. This feature removes the requirement to install GPS modules in a Sidewalk device and also simplifies the developer experience of resolving location data. Devices powered by small coin cell batteries, such as smart home sensor trackers, use Sidewalk to connect. Supporting built-in GPS modules for products that move around is not only expensive, it can creates challenge in ensuring optimal battery life performance and longevity.

With this launch, Internet of Things (IoT) device manufacturers and solution developers can build asset tracking and location monitoring solutions using Sidewalk-enabled devices by sending Bluetooth Low Energy (BLE), Wi-Fi, or Global Navigation Satellite System (GNSS) information to AWS IoT for location resolution. They can then send the resolved location data to an MQTT topic or AWS IoT rule and route the data to other Amazon Web Services (AWS) services, thus using different capabilities of AWS Cloud through AWS IoT Core. This would simplify their software development and give them more options to choose the optimal location source, thereby improving their product performance.

This launch addresses previous challenges and architecture complexity. You don’t need location sensing on network-based devices when you use the Sidewalk network infrastructure itself to determine device location, which eliminates the need for power-hungry and costly GPS hardware on the device. And, this feature also allows devices to efficiently measure and report location data from GNSS and Wi-Fi, thus extending the product battery life. Therefore, you can build a more compelling solution for asset tracking and location-aware IoT applications with these enhancements.

For those unfamiliar with Amazon Sidewalk and the AWS IoT Core Device Location service, I’ll briefly explain their history and context. If you’re already familiar with them, you can skip to the section on how to get started.

AWS IoT Core integrations with Amazon Sidewalk
Amazon Sidewalk is a shared network that helps devices work better through improved connectivity options. It’s designed to support a wide range of customer devices with capabilities ranging from locating pets or valuables, to smart home security and lighting control and remote diagnostics for appliances and tools.

Amazon Sidewalk is a secure community network that uses Amazon Sidewalk Gateways (also called Sidewalk Bridges), such as compatible Amazon Echo and Ring devices, to provide cloud connectivity for IoT endpoint devices. Amazon Sidewalk enables low-bandwidth and long-range connectivity at home and beyond using BLE for short-distance communication and LoRa and frequency-shift keying (FSK) radio protocols at 900MHz frequencies to cover longer distances.

Sidewalk now provides coverage to more than 90% of the US population and supports long-range connected solutions for communities and enterprises. Users with Ring cameras or Alexa devices that act as a Sidewalk Bridge can choose to contribute a small portion of their internet bandwidth, which is pooled to create a shared network that benefits all Sidewalk-enabled devices in a community.

In March 2023, AWS IoT Core deepened its integration with Amazon Sidewalk to seamlessly provision, onboard, and monitor Sidewalk devices with qualified hardware development kits (HDKs), SDKs, and sample applications. As of this writing, AWS IoT Core is the only way for customers to connect the Sidewalk network.

In the AWS IoT Core console, you can add your Sidewalk device, provision and register your devices, and connect your Sidewalk endpoint to the cloud. To learn more about onboarding your Sidewalk devices, visit the Getting started with AWS IoT Core for Amazon Sidewalk in the AWS IoT Wireless Developer Guide.

In November 2022, we announced AWS IoT Core Device Location service, a new feature that you can use to get the geo-coordinates of their IoT devices even when the device doesn’t have a GPS module. You can use the Device Location service as a simple request and response HTTP API, or you can use it with IoT connectivity pathways like MQTT, LoRaWAN, and now with Amazon Sidewalk.

In the AWS IoT Core console, you can test the Device Location service to resolve the location of your device by importing device payload data. Resource location is reported as a GeoJSON payload. To learn more, visit the AWS IoT Core Device Location in the AWS IoT Core Developer Guide.

Customers across multiple industries like automotive, supply chain, and industrial tools have requested a simplified solution such as the Device Location service to extract location-data from Sidewalk products. This would streamline customer software development and give them more options to choose the optimal location source, thereby improving their product.

Get started with a Device Location integration with Amazon Sidewalk
To enable Device Location for Sidewalk devices, go to the AWS IoT Core for Amazon Sidewalk section under LPWAN devices in the AWS IoT Core console. Choose Provision device or your existing device to edit the setting and select Activate positioning in the Geolocation option when creating and updating your Sidewalk devices.

While activating position, you need to specify a destination where you want to send your location data. The destination can either be an AWS IoT rule or an MQTT topic.

Here is a sample AWS Command Line Interface (AWS CLI) command to enable position while provisioning a new Sidewalk device:

$ aws iotwireless createwireless device --type Sidewalk \
  --name "demo-1" --destination-name "New-1" \
  --positioning Enabled

After your Sidewalk device establishes a connection to the Amazon Sidewalk network, the device SDK will send the GNSS-, Wi-Fi- or BLE-based information to AWS IoT Core for Amazon Sidewalk. If the customer has enabled Positioning, then AWS IoT Core Device Location will resolve the location data and send the location data to the specified Destination. After your Sidewalk device transmits location measurement data, the resolved geographic coordinates and a map pin will also be displayed in the Position section for the selected device.

You will also get location information delivered to your destination in GeoJSON format, as shown in the following example:

{
    "coordinates": [
        13.376076698303223,
        52.51823043823242
    ],
    "type": "Point",
    "properties": {
        "verticalAccuracy": 45,
        "verticalConfidenceLevel": 0.68,
        "horizontalAccuracy": 303,
        "horizontalConfidenceLevel": 0.68,
        "country": "USA",
        "state": "CA",
        "city": "Sunnyvale",
        "postalCode": "91234",
        "timestamp": "2025-11-18T12:23:58.189Z"
    }
}

You can monitor the Device Location data between your Sidewalk devices and AWS Cloud by enabling Amazon CloudWatch Logs for AWS IoT Core. To learn more, visit the AWS IoT Core for Amazon Sidewalk in the AWS IoT Wireless Developer Guide.

Now available
AWS IoT Core Device Location integration with Amazon Sidewalk is now generally available in the US East (N. Virginia) Region. To learn more about use cases, documentation, sample codes, and partner devices, visit the AWS IoT Core for Amazon Sidewalk product page.

Give it a try in the AWS IoT Core console and send feedback to AWS re:Post for AWS IoT Core or through your usual AWS Support contacts.

Channy

Optimize industrial IoT analytics with Amazon Data Firehose and Amazon S3 Tables with Apache Iceberg

Post Syndicated from Ashok Padmanabhan original https://aws.amazon.com/blogs/big-data/optimize-industrial-iot-analytics-with-amazon-data-firehose-and-amazon-s3-tables-with-apache-iceberg/

Manufacturing organizations are racing to digitize their operations through Industry 4.0 initiatives. A key challenge they face is capturing, processing, and analyzing real-time data from industrial equipment to enable data-driven decision making.Modern manufacturing facilities generate massive amounts of real-time data from their production lines. Capturing this valuable data requires a two-tier architecture: first, an edge device that understands industrial protocols collects data directly from the shop floor sensors. Then, these edge gateways securely buffer and transmit the data to AWS Cloud, providing reliability during network interruptions.

In this post, we show how to use AWS service integrations to minimize custom code while providing a robust platform for industrial data ingestion, processing, and analytics. By using Amazon S3 Tables and its built-in optimizations, you can maximize query performance and minimize costs without additional infrastructure setup. Additionally, AWS IoT Greengrass supports VPC endpoints, and you can securely communicate between the edge gateway (hosted on premises) and AWS.

Solution overview

Let’s consider a manufacturing line with and equipment sensors capturing flow rate, temperature, and pressure. To perform analysis on this data, you ingest real-time streaming data from these sensors into the AWS environment using an edge gateway. After data lands in AWS, you can use various analytics services to gain insights.

To demonstrate the data flow from the edge to the cloud, we have assets, machines, and tools publish data using MQTT. Optionally, we use a simulated edge device that publishes data to a local MQTT endpoint. We use an edge gateway with an AWS IoT Greengrass V2 edge runtime to stream data through Amazon Data Firehose in the cloud to S3 Tables.

The following diagram illustrates the solution architecture.

High Level Arch

Fig 1 : High Level Architecture

The workflow consists of the following steps:

  1. Collect data from Internet of Things (IoT) sensors and stream real-time data from edge devices to the AWS Cloud using AWS IoT Greengrass.
  2. Ingest, transform, and land data in near real time using Data Firehose, with the Firehose component on AWS IoT Greengrass, and S3 Tables integration.
  3. Store and organize the tabular data using S3 Tables, which provides purpose-built storage for Apache Iceberg format with a simple, performant, and cost-effective querying solution.
  4. Query and analyze the tabular data using Amazon Athena.

The edge data flow consists of the following key components:

  • IoT device to local MQTT broker – A simulated device used to generate data for the purposes of this post. In a typical production implementation, this would be your equipment or gateway that supports MQTT. IoT devices can publish messages to a local MQTT broker (Moquette) running on AWS IoT Greengrass.
  • MQTT bridge – The MQTT bridge component relays messages between:
    • MQTT broker (where client devices communicate)
    • Local AWS IoT Greengrass publish/subscribe (IPC)
  • Local PubSub (custom) component – This component completes the following tasks:
    • Subscribes to the local IPC messages.
    • Forwards messages to the kinesisfirehose/message topic.
    • Uses the IPC interface to subscribe to messages.
  • Firehose component – The Firehose component subscribes to the kinesisfirehose/message topic. The component then streams the data to Data Firehose in the cloud. It uses QoS 1 for reliable message delivery.

You can scale this solution to multiple edge locations, so you have a seamless view of data across multiple locations of the manufacturing site, as a low-code solution.In the following sections, we walk through the steps to configure the cloud data ingestion flow:

  1. Create an S3 Tables bucket and enable integration with AWS analytics services.
  2. Create a namespace in the table bucket using the AWS Command Line Interface (AWS CLI).
  3. Create a table in the table bucket with the defined schema using the AWS CLI.
  4. Create an AWS Identity and Access Management (IAM) role for Data Firehose with necessary permissions.
  5. Configure AWS Lake Formation permissions:
    • Grant Super permissions on specific tables for the Data Firehose role.
  6. Set up a Data Firehose stream:
    • Choose Direct PUT as the source and Iceberg tables as the destination.
    • Configure the destination settings with database and table names.
    • Specify an Amazon Simple Storage Service (Amazon S3) bucket for error output.
    • Associate the IAM role created earlier.
  7. Verify and query data using Athena:
    • Grant Lake Formation permissions for Athena access.
    • Query the table to verify data ingestion.

Prerequisites

You must have the following prerequisites:

  • An AWS account
  • The required IAM privileges to launch AWS IoT Greengrass on an edge gateway (or another supported device)
  • An Amazon Elastic Compute Cloud (Amazon EC2) instance with a supported operating system to perform a proof of concept

Install AWS IoT Greengrass on the edge gateway

For instructions to install AWS IoT Greengrass, refer to Install the AWS IoT Greengrass Core software. After you complete the installation, you will have a core device provisioned, as shown in the following screenshot. The status of the device says Healthy, which means that your account is able to communicate with the device successfully.

For a proof of concept, you can use an Ubuntu-based EC2 instance as your edge gateway.

Greengrass Core Device

Fig 2: Greengrass Core Device

Provision a Data Firehose stream

For detailed steps on setting up Data Firehose to deliver data to Iceberg tables, refer to Deliver data to Apache Iceberg Tables with Amazon Data Firehose. For S3 Tables integration, refer to Build a data lake for streaming data with Amazon S3 Tables and Amazon Data Firehose.

Because you’re using AWS IoT Greengrass to stream data, you can skip the Kinesis Data Generator steps mentioned in these tutorials. The data will instead flow from your edge devices through the Greengrass components to Data Firehose.After you complete these steps, you will have a Firehose stream and S3 Tables bucket, as shown in the following screenshot. Note the Amazon Resource Name (ARN) of the Firehose stream to use in subsequent steps.

Amazon Data Firehose Stream

Fig 3: Amazon Data Firehose Stream

Deploy the Greengrass components

Complete the following steps to configure and deploy the Greengrass components. For more details, refer to Create deployments.

  1. Use the following configuration to enable message routing from local MQTT to the AWS IoT Greengrass PubSub component. Note the topic in the code. This is the MQTT topic where the devices will send the data to.
{
  "reset": [""],
  "merge": {
    "mqttTopicMapping": {
      "HelloWorldIotCoreMapping": {
        "topic": "clients/#",
        "source": "LocalMqtt",
        "target": "Pubsub"
      }
    }
  }
}
  1. Use the following configuration to deploy the Firehose component. Use the Firehose stream ARN that you noted earlier.
{
"reset": [""],
"merge": {
   "lambdaExecutionParameters": {
     "EnvironmentVariables": {
       "DEFAULT_DELIVERY_STREAM_ARN": "arn:aws:firehose:us-east-1:<<account-id>>:deliverystream/<<stream name>>"
         }
     },
   "containerMode": "NoContainer"
      }
}
  1. Use the following configuration to deploy the legacy subscription router component (Note that this is a dependent component to the Firehose component):
{
"reset": [""],
"merge": {
   "subscriptions": {
      "aws-greengrass-kinesisfirehose": {
          "id": "aws-greengrass-kinesisfirehose",
          "source": "component:aws.greengrass.KinesisFirehose",
          "subject": "kinesisfirehose/message/status",
         "target": "cloud"
                  }
           }
         }
}
  1. Create and deploy a custom PubSub component. You can use the following sample code snippet in your preferred language to deploy as a Greengrass component. You can use gdk to create custom components.
{
"reset": [""],
"merge": {
   "subscriptions": {
      "aws-greengrass-kinesisfirehose": {
         "id": "aws-greengrass-kinesisfirehose",
        "source": "component:aws.greengrass.KinesisFirehose",
        "subject": "kinesisfirehose/message/status",
          "target": "cloud"
        }
        }
    }
       }

After you deploy the components, you will see them on the Components tab of your core device.

Greengrass Components

Fig 4: AWS IoT Greengrass components

Ingest data

In this step, you ingest the data from your device to AWS IoT Greengrass, which will subsequently land in Data Firehose. Complete the following steps:

  1. From your edge device that is MQTT aware, or your edge gateway, publish the data to the topic defined earlier ( client/#). For example, we publish the data to the client/devices/telemetry MQTT topic.
  2. If you want to do this as a proof of concept, refer to Create a virtual device with Amazon EC2 to create a sample IoT device.

The following code is a sample payload for our example:

PAYLOAD="{
\"device_id\": \"$DEVICE_ID\",
\"timestamp\": \"$TIMESTAMP\",
\"temperature\": $TEMPERATURE,
\"pressure\": $PRESSURE,
\"flow_rate\": $FLOW_RATE,
\"vibration\": $VIBRATION,
\"motor_speed\": $MOTOR_SPEED,
\"status\": \"$STATUS\",
\"battery\": $((RANDOM % 30 + 70 )),
}"

For additional details on how to publish messages from a sample device, refer to Just-in-time provisioning.

The MQTT bridge component will route the payload from the MQTT topic (client/devices/telemetry) to an IPC topic by the same name. The custom component that you deployed earlier will listen to the IPC topic client/devices/telemetry and publish to the IPC topic kinesisfirehose/message. The message must follow the structure described in Input data.

Validate the data in Athena

You can now query the data published from the edge IoT device using Athena. On the Athena console, find the catalog and database that you set up, and run the following query:SELECT * FROM <<database>>."device_telemetry" limit 10;You should see the data displayed as shown in the following screenshot. Note the database and table name that you had defined as part of the “Provision a Data Firehose” stream step.

Validate Data in Athena

Fig 5: Validate Data in Athena

Scale out the solution

In the preceding sections, we showed how multiple equipments can ingest data into the cloud using a single Greengrass edge gateway device. Because manufacturing locations are distributed in a real-world scenario, you might set up Greengrass devices at other sites and publish the data to the same Firehose stream. This makes sure the data from different sites is landed into a single S3 bucket, is partitioned appropriately (Device_Id in our example), and can be queried seamlessly.

Clean up

After you validate the results, you can delete the following resources to avoid incurring additional costs:

  1. Delete the EC2 Ubuntu instance you created for your proof of concept.
  2. Delete the Firehose delivery stream and associated resources.
  3. Drop the Athena tables created for querying the data.
  4. Delete the S3 Tables bucket you provisioned.

Conclusion

In this post, we showed how to set up a scalable edge-to-cloud near real-time data ingestion framework using AWS IoT Greengrass and start performing analytics on the data within AWS services using a low-code approach. We demonstrated how to optimize the data storage into Iceberg format with S3 Tables, and transform the streaming data before it lands on the storage layer using Data Firehose. We also discussed how you can scale this solution horizontally across multiple manufacturing locations (plants or sites) to create a low-code solution to analyze data in near real time.

To learn more, refer to the following resources:


About the authors

Joyson Neville Lewis is a Sr. Conversational AI Architect with AWS Professional Services. Joyson worked as a Software/Data engineer before diving into the Conversational AI and Industrial IoT space. He assists AWS customers to materialize their AI visions using Voice Assistant/Chatbot and IoT solutions.

Anil Vure is a Sr. IoT Data Architect with AWS Professional services. Anil has extensive experience building large-scale data platforms and works with manufacturing customers designing high-speed data ingestion systems.

Ashok Padmanabhan is a Sr. IoT Data Architect with AWS Professional Services. Ashok primarily works with manufacturing and automotive customers to design and build Industry 4.0 solutions.

Process millions of observability events with Apache Flink and write directly to Prometheus

Post Syndicated from Lorenzo Nicora original https://aws.amazon.com/blogs/big-data/process-millions-of-observability-events-with-apache-flink-and-write-directly-to-prometheus/

AWS recently announced support for a new Apache Flink connector for Prometheus. The new connector, contributed by AWS to the Flink open source project, adds Prometheus and Amazon Managed Service for Prometheus as a new destination for Flink.

In this post, we explain how the new connector works. We also show how you can manage your Prometheus metrics data cardinality by preprocessing raw data with Flink to build real-time observability with Amazon Managed Service for Prometheus and Amazon Managed Grafana.

Amazon Managed Service for Prometheus is a secure, serverless, scaleable, Prometheus-compatible monitoring service. You can use the same open source Prometheus data model and query language that you use today to monitor the performance of your workloads without having to manage the underlying infrastructure. Flink connectors are software components that move data into and out of an Amazon Managed Service for Apache Flink application. You can use the new connector to send processed data to an Amazon Managed Service for Prometheus destination starting with Flink version 1.19. With Amazon Managed Service for Apache Flink, you can transform and analyze data in real time. There are no servers and clusters to manage, and there is no compute and storage infrastructure to set up.

Observability beyond compute

In an increasingly connected world, the boundary of systems extends beyond compute assets, IT infrastructure, and applications. Distributed assets such as Internet of Things (IoT) devices, connected cars, and end-user media streaming devices are an integral part of business operations in many sectors. The ability to observe every asset of your business is key to detecting potential issues early, improving the experience of your customers, and protecting the profitability of the business.

Metrics and time series

It is helpful to think of observability as three pillars: metrics, logs, and traces. The most relevant pillar for distributed devices, like IoT, is metrics. This is because metrics can capture measurements from sensors or counting of specific events emitted by the device.

Metrics are series of samples of a given measurement at specific times. For example, in the case of a connected vehicle, they can be the readings from the electric motor RPM sensor. Metrics are normally represented as time series, or sequences of discrete data points in chronological order. Metrics’ time series are normally associated with dimensions, also called labels or tags, to help with classifying and analyzing the data. In the case of a connected vehicle, labels might be something like the following:

  • Metric name – For example, “Electric Motor RPM”
  • Vehicle ID – A unique identifier of the vehicle, like the Vehicle Identification Number (VIN)

Prometheus as a specialized time series database

Prometheus is a popular solution for storing and analyzing metrics. Prometheus defines a standard interface for storing and querying time series. Commonly used in combination with visualization tools like Grafana, Prometheus is optimized for real-time dashboards and real-time alerting.

Often considered mainly for observing compute resources, like containers or applications, Prometheus is actually a specialized time series database that can effectively be used to observe different types of distributed assets, including IoT devices.

Amazon Managed Service for Prometheus is a serverless, Prometheus-compatible monitoring service. See What is Amazon Managed Service for Prometheus? to learn more about Amazon Managed Service for Prometheus.

Effectively processing observability events, at scale

Handling observability data at scale becomes more challenging, due to the number of assets and unique metrics, especially when observing massively distributed devices, for the following reasons:

  • High cardinality – Each device emits multiple metrics or types of events, each to be tracked independently.
  • High frequency – Devices might emit events very frequently, multiple times per second. This might result in a large volume of raw data. This aspect in particular represents the main difference from observing compute resources, which are usually scraped at longer intervals.
  • Events arrive at irregular intervals and out of order – Unlike compute assets that are usually scraped at regular intervals, we often see delays of transmission or temporarily disconnected devices, which cause events to arrive at irregular intervals. Concurrent events from different devices might follow different paths and arrive at different times.
  • Lack of contextual information – Devices often transmit over channels with limited bandwidth, such as GPRS or Bluetooth. To optimize communication, events seldom contain contextual information, such as device model or user detail. However, this information is required for an effective observability.
  • Derive metrics from events – Devices often emit specific events when specific facts happen. For example, when the vehicle ignition is turned on or off, or when a warning is emitted by the onboard computer. These are not direct metrics. However, counting and measuring the rates of these events are valuable metrics that can be inferred from these events.

Effectively extracting value from raw events requires processing. Processing might happen on read, when you query the data, or upfront, before storing.

Storing and analyzing raw events

The common approach with observability events, and with metrics in particular, is “storing first.” You can simply write the raw metrics into Prometheus. Processing, such as grouping, aggregating, and calculating derived metrics, happens “on query,” when data is extracted from Prometheus.

This approach might become particularly inefficient when you’re building real-time dashboards or alerting, and your data has very high cardinality or high frequency. As a time series database is continuously queried, a large volume of data is repeatedly extracted from the storage and processed. The following diagram illustrates this workflow.

Process on query

Preprocessing raw observability events

Preprocessing raw events before storing shifts the work left, as illustrated in the following diagram. This increases the efficiency of real-time dashboards and alerts, allowing the solution to scale.

Pre-process

Apache Flink for preprocessing observability events

Preprocessing raw observability events requires a processing engine that allows you to do the following:

  • Enrich events efficiently, looking up reference data and adding new dimensions to the raw events. For example, adding the vehicle model based on the vehicle ID. Enrichment allows adding new dimensions to the time series, enabling analysis otherwise impossible.
  • Aggregate raw events over time windows, to reduce frequency. For example, if a vehicle emits an engine temperature measurement every second, you can emit a single sample with the average over 5 seconds. Prometheus can efficiently aggregate frequent samples on read. However, ingesting data with a frequency much higher than what is useful for dashboarding and real-time alerting is not an efficient use of Prometheus ingestion throughout and storage.
  • Aggregate raw events over dimensions, to reduce cardinality. For example, aggregating some measurement per vehicle model.
  • Calculate derived metrics applying arbitrary logic. For example, counting the number of warning events emitted by each vehicle. This also enables analysis otherwise impossible using only Prometheus and Grafana.
  • Support event-time semantics, to aggregate over time events from different sources.

Such a preprocessing engine must also be able to scale and process the large volume of input raw events, and to process data with low latency—normally subsecond or single-digit seconds—to enable real-time dashboards and altering. To address these requirements, we see many customers using Flink.

Apache Flink meets the aforementioned requirements. Flink is a framework and distributed stream processing engine, designed to perform computations at in-memory speed and at scale. Amazon Managed Service for Apache Flink offers a fully managed, serverless experience, allowing you to run your Flink applications without managing infrastructure or clusters.

Amazon Managed Service for Apache Flink can process the ingested raw events. The resulting metrics, with lower cardinality and frequency, and additional dimensions, can be written to Prometheus for a more effective visualization and analysis. The following diagram illustrates this workflow.

Amazon Managed Service for Apache Flink, Amazon Managed Prometheus and Grafana

Integrating Apache Flink and Prometheus

The new Flink Prometheus connector allows Flink applications to seamlessly write preprocessed time series data to Prometheus. No intermediate component is needed, and there is no requirement to implement a custom integration. The connector is designed to scale, using the ability of Flink to scale horizontally, and optimizing the writes to a Prometheus backend using a Remote-Write interface.

Example use case

AnyCompany is a car rental company managing a fleet of hundreds of thousands hybrid connected vehicles, in multiple regions. Each vehicle continuously transmits measurements from several sensors. Each sensor emits a sample every second or more frequently. Vehicles also communicate warning events when something wrong is detected by the onboard computer. The following diagram illustrates the workflow.

Example use case: connected cars

AnyCompany is planning to use Amazon Managed Service for Prometheus and Amazon Managed Grafana to visualize vehicle metrics and set up custom alerts.

However, building a real-time dashboard based on raw data, as transmitted by the vehicles, might be complicated and inefficient. Each vehicle might have hundreds of sensors, each of them resulting in a separate time series to display. Additionally, AnyCompany wants to monitor the behavior of different vehicle models. Unfortunately, the events transmitted by the vehicles only contain the VIN. The model can be inferred by looking up (joining) some reference data.

To overcome these challenges, AnyCompany has built a preprocessing stage based on Amazon Managed Service for Apache Flink. This stage has the following capabilities:

  • Enrich the raw data by adding the vehicle model, and looking up reference data based on the vehicle identification.
  • Reduce the cardinality, aggregating the results per vehicle model, available after the enrichment step.
  • Reduce the frequency of the raw metrics to reduce write bandwidth, aggregating over time windows of a few seconds.
  • Calculate derived metrics based on multiple raw metrics. For example, determine whether a vehicle is in motion when either the internal combustion engine or the electrical motor are rotating.

The result of preprocessing are more actionable metrics. A dashboard built on these metrics can, for example, help determine whether the last software update released over-the-air to all vehicles of a specific model in specific regions, is causing issues.

Using the Flink Prometheus connector, the preprocessor application can write directly to Amazon Managed Service for Prometheus, without intermediate components.

Nothing prevents you from choosing to write raw metrics with full cardinality and frequency to Prometheus, allowing you to drill down to the single vehicle. The Flink Prometheus connector is designed to scale by batching and parallelizing writes.

Solution overview

The following GitHub repository contains a fictional end-to-end example covering this use case. The following diagram illustrates the architecture of this example.

Example architecture

The workflow consists of the following steps:

  1. Vehicles, radio transmission, and ingestion of IoT events have been abstracted away, and replaced by a data generator that produces raw events for a hundred thousand fictional vehicles. For simplicity, the data generator is itself an Amazon Managed Service for Apache Flink application.
  2. Raw vehicle events are sent to a stream storage service. In this example, we use Amazon Managed Streaming for Apache Kafka (Amazon MSK).
  3. The core of the system is the preprocessor application, running in Amazon Managed Service for Apache Flink. We will dive deeper into the details of the processor in the following sections.
  4. Processed metrics are directly written to the Prometheus backend, in Amazon Managed Service for Prometheus.
  5. Metrics are used to generate real-time dashboards on Amazon Managed Grafana.

The following screenshot shows a sample dashboard.

Grafana dashboard

Raw vehicle events

Each vehicle transmits three metrics almost every second:

  • Internal combustion (IC) engine RPM
  • Electric motor RPM
  • Number of reported warnings

The raw events are identified by the vehicle ID and the region where the vehicle is located.

Preprocessor application

The following diagram illustrates the logical flow of the preprocessing application running in Amazon Managed Service for Apache Flink.

Flink application logical data flow

The workflow consists of the following steps:

  1. Raw events are ingested from Amazon MSK from Flink Kafka source.
  2. An enrichment operator adds the vehicle model, which is not contained in the raw events. This additional dimension is then used to aggregate the raw events. The resulting metrics have only two dimensions: vehicle model and region.
  3. Raw events are then aggregated over time windows (5 seconds) to reduce frequency. In this example, the aggregation logic also generates a derived metric: the number of vehicles in motion. A new metric can be derived from raw metrics with arbitrary logic. For the sake of the example, a vehicle is considered “in motion” if either the IC engine or electric motor RPM metric are not zero.
  4. The processed metrics are mapped into the input data structure of the Flink Prometheus connector, which maps directly to the time series records expected by the Prometheus Remote-Write interface. Refer to the connector documentation for more details.
  5. Finally, the metrics are sent to Prometheus using the Flink Prometheus connector. Write authentication, required by Amazon Managed Service for Prometheus, is seamlessly enabled using the Amazon Managed Service for Prometheus request signer provided with the connector. Credentials are automatically derived from the AWS Identity and Access Management (IAM) role of the Amazon Managed Service for Apache Flink application. No additional secret or credential is required.

In the GitHub repository, you can find the step-by-step instructions to set up the working example and create the Grafana dashboard.

Flink Prometheus connector key features

The Flink Prometheus connector allows Flink applications to write processed metrics to Prometheus, using the Remote-Write interface.

The connector is designed to scale write throughput by:

  • Parallelizing writes, using the Flink parallelism capability
  • Batching multiple samples in a single write request to the Prometheus endpoint

Error handling complies with Prometheus Remote-Write 1.0 specifications. The specifications are particularly strict about malformed or out-of-order data rejected by Prometheus.

When a malformed or out-of-order write is rejected, the connector discards the offending write request and continues, preferring data freshness over completeness. However, the connector makes data loss observable, emitting WARN log entries and exposing metrics that measure the volume of discarded data. In Amazon Managed Service for Apache Flink, these connector metrics can be automatically exported to Amazon CloudWatch.

Responsibilities of the user

The connector is optimized for efficiency, write throughput, and latency. Validation of incoming data would be particularly expensive in terms of CPU utilization. Additionally, different Prometheus backend implementations enforce constraints differently. For these reasons, the connector doesn’t validate incoming data before writing to Prometheus.

The user is responsible of making sure that the data sent to the Flink Prometheus connector follows the constraints enforced by the particular Prometheus implementations they are using.

Ordering

Ordering is particularly relevant. Prometheus expects that samples belonging to the same time series—samples with the same metric name and labels—are written in time order. The connector makes sure ordering is not lost when data is partitioned to parallelize writes.

However, the user is responsible for retaining the ordering upstream in the pipeline. To achieve this, the user must carefully design data partitioning within the Flink application and the stream storage. Only partitioning by key must be used, and partitioning keys must compound the metric name and all labels that will be used in Prometheus.

Conclusion

Prometheus is a specialized time series database, designed for building real-time dashboards and altering. Amazon Managed Service for Prometheus is a fully managed, serverless backend compatible with the Prometheus open source standard. Amazon Managed Grafana allows you to build real-time dashboards, seamlessly interfacing with Amazon Managed Service for Prometheus.

You can use Prometheus for observability use cases beyond compute resource, to observe IoT devices, connected cars, media streaming devices, and other highly distributed assets providing telemetry data.

Directly visualizing and analyzing high-cardinality and high-frequency data can be inefficient. Preprocessing raw observability events with Amazon Managed Service for Apache Flink shifts the work left, greatly simplifying the dashboards or alerting you can build on top of Amazon Managed Service for Prometheus.

For more information about running Flink, Prometheus, and Grafana on AWS, see the resources of these services:

For more information about the Flink Prometheus integration, see the Apache Flink documentation.


About the authors

Lorenzo NicoraLorenzo Nicora works as Senior Streaming Solution Architect at AWS, helping customers across EMEA. He has been building cloud-centered, data-intensive systems for over 25 years, working across industries both through consultancies and product companies. He has used open-source technologies extensively and contributed to several projects, including Apache Flink, and is the maintainer of the Flink Prometheus connector.

Francisco MorilloFrancisco Morillo is a Senior Streaming Solutions Architect at AWS. Francisco works with AWS customers, helping them design real-time analytics architectures using AWS services, supporting Amazon MSK and Amazon Managed Service for Apache Flink. He is also a main contributor to the Flink Prometheus connector.

IoT Devices in Password-Spraying Botnet

Post Syndicated from Bruce Schneier original https://www.schneier.com/blog/archives/2024/11/iot-devices-in-password-spraying-botnet.html

Microsoft is warning Azure cloud users that a Chinese controlled botnet is engaging in “highly evasive” password spraying. Not sure about the “highly evasive” part; the techniques seem basically what you get in a distributed password-guessing attack:

“Any threat actor using the CovertNetwork-1658 infrastructure could conduct password spraying campaigns at a larger scale and greatly increase the likelihood of successful credential compromise and initial access to multiple organizations in a short amount of time,” Microsoft officials wrote. “This scale, combined with quick operational turnover of compromised credentials between CovertNetwork-1658 and Chinese threat actors, allows for the potential of account compromises across multiple sectors and geographic regions.”

Some of the characteristics that make detection difficult are:

  • The use of compromised SOHO IP addresses
  • The use of a rotating set of IP addresses at any given time. The threat actors had thousands of available IP addresses at their disposal. The average uptime for a CovertNetwork-1658 node is approximately 90 days.
  • The low-volume password spray process; for example, monitoring for multiple failed sign-in attempts from one IP address or to one account will not detect this activity.

More Details on Israel Sabotaging Hezbollah Pagers and Walkie-Talkies

Post Syndicated from Bruce Schneier original https://www.schneier.com/blog/archives/2024/10/more-details-on-israel-sabotaging-hezbollah-pagers-and-walkie-talkies.html

The Washington Post has a long and detailed story about the operation that’s well worth reading (alternate version here).

The sales pitch came from a marketing official trusted by Hezbollah with links to Apollo. The marketing official, a woman whose identity and nationality officials declined to reveal, was a former Middle East sales representative for the Taiwanese firm who had established her own company and acquired a license to sell a line of pagers that bore the Apollo brand. Sometime in 2023, she offered Hezbollah a deal on one of the products her firm sold: the rugged and reliable AR924.

“She was the one in touch with Hezbollah, and explained to them why the bigger pager with the larger battery was better than the original model,” said an Israeli official briefed on details of the operation. One of the main selling points about the AR924 was that it was “possible to charge with a cable. And the batteries were longer lasting,” the official said.

As it turned out, the actual production of the devices was outsourced and the marketing official had no knowledge of the operation and was unaware that the pagers were physically assembled in Israel under Mossad oversight, officials said. Mossad’s pagers, each weighing less than three ounces, included a unique feature: a battery pack that concealed a tiny amount of a powerful explosive, according to the officials familiar with the plot.

In a feat of engineering, the bomb component was so carefully hidden as to be virtually undetectable, even if the device was taken apart, the officials said. Israeli officials believe that Hezbollah did disassemble some of the pagers and may have even X-rayed them.

Also invisible was Mossad’s remote access to the devices. An electronic signal from the intelligence service could trigger the explosion of thousands of the devices at once. But, to ensure maximum damage, the blast could also be triggered by a special two-step procedure required for viewing secure messages that had been encrypted.

“You had to push two buttons to read the message,” an official said. In practice, that meant using both hands.

Also read Bunnie Huang’s essay on what it means to live in a world where people can turn IoT devices into bombs. His conclusion:

Not all things that could exist should exist, and some ideas are better left unimplemented. Technology alone has no ethics: the difference between a patch and an exploit is the method in which a technology is disclosed. Exploding batteries have probably been conceived of and tested by spy agencies around the world, but never deployed en masse because while it may achieve a tactical win, it is too easy for weaker adversaries to copy the idea and justify its re-deployment in an asymmetric and devastating retaliation.

However, now that I’ve seen it executed, I am left with the terrifying realization that not only is it feasible, it’s relatively easy for any modestly-funded entity to implement. Not just our allies can do this—a wide cast of adversaries have this capability in their reach, from nation-states to cartels and gangs, to shady copycat battery factories just looking for a big payday (if chemical suppliers can moonlight in illicit drugs, what stops battery factories from dealing in bespoke munitions?). Bottom line is: we should approach the public policy debate around this assuming that someday, we could be victims of exploding batteries, too. Turning everyday objects into fragmentation grenades should be a crime, as it blurs the line between civilian and military technologies.

I fear that if we do not universally and swiftly condemn the practice of turning everyday gadgets into bombs, we risk legitimizing a military technology that can literally bring the front line of every conflict into your pocket, purse or home.

Deebot Robot Vacuums Are Using Photos and Audio to Train Their AI

Post Syndicated from Bruce Schneier original https://www.schneier.com/blog/archives/2024/10/deebot-robot-vacuums-are-using-photos-and-audio-to-train-their-ai.html

An Australian news agency is reporting that robot vacuum cleaners from the Chinese company Deebot are surreptitiously taking photos and recording audio, and sending that data back to the vendor to train their AIs.

Ecovacs’s privacy policy—available elsewhere in the app—allows for blanket collection of user data for research purposes, including:

  • The 2D or 3D map of the user’s house generated by the device
  • Voice recordings from the device’s microphone
  • Photos or videos recorded by the device’s camera

It also states that voice recordings, videos and photos that are deleted via the app may continue to be held and used by Ecovacs.

No word on whether the recorded audio is being used to train the vacuum in some way, or whether it is being used to train a LLM.

Slashdot thread.

Build a dynamic rules engine with Amazon Managed Service for Apache Flink

Post Syndicated from Steven Carpenter original https://aws.amazon.com/blogs/big-data/build-a-dynamic-rules-engine-with-amazon-managed-service-for-apache-flink/

Imagine you have some streaming data. It could be from an Internet of Things (IoT) sensor, log data ingestion, or even shopper impression data. Regardless of the source, you have been tasked with acting on the data—alerting or triggering when something occurs. Martin Fowler says: “You can build a simple rules engine yourself. All you need is to create a bunch of objects with conditions and actions, store them in a collection, and run through them to evaluate the conditions and execute the actions.”

A business rules engine (or simply rules engine) is a software system that executes many rules based on some input to determine some output. Simplistically, it’s a lot of “if then,” “and,” and “or” statements that are evaluated on some data. There are many different business rule systems, such as Drools, OpenL Tablets, or even RuleBook, and they all share a commonality: they define rules (collection of objects with conditions) that get executed (evaluate the conditions) to derive an output (execute the actions). The following is a simplistic example:

if (office_temperature) < 50 degrees => send an alert

if (office_temperature) < 50 degrees AND (occupancy_sensor) == TRUE => < Trigger action to turn on heat>

When a single condition or a composition of conditions evaluates to true, it is desired to send out an alert to potentially act on that event (trigger the heat to warm the 50 degrees room).

This post demonstrates how to implement a dynamic rules engine using Amazon Managed Service for Apache Flink. Our implementation provides the ability to create dynamic rules that can be created and updated without the need to change or redeploy the underlying code or implementation of the rules engine itself. We discuss the architecture, the key services of the implementation, some implementation details that you can use to build your own rules engine, and an AWS Cloud Development Kit (AWS CDK) project to deploy this in your own account.

Solution overview

The workflow of our solution starts with the ingestion of the data. We assume that we have some source data. It could be from a variety of places, but for this demonstration, we use streaming data (IoT sensor data) as our input data. This is what we will evaluate our rules on. For example purposes, let’s assume we are looking at data from our AnyCompany Home Thermostat. We’ll see attributes like temperature, occupancy, humidity, and more. The thermostat publishes the respective values every 1 minute, so we’ll base our rules around that idea. Because we’re ingesting this data in near real time, we need a service designed specifically for this use case. For this solution, we use Amazon Kinesis Data Streams.

In a traditional rules engine, there may be a finite list of rules. The creation of new rules would likely involve a revision and redeployment of the code base, a replacement of some rules file, or some overwriting process. However, a dynamic rules engine is different. Much like our streaming input data, our rules can also be streamed as well. Here we can use Kinesis Data Streams to stream our rules as they are created.

At this point, we have two streams of data:

  • The raw data from our thermostat
  • The business rules perhaps created through a user interface

The following diagram illustrates we can connect these streams together.Architecture Diagram

Connecting streams

A typical use case for Managed Service for Apache Flink is to interactively query and analyze data in real time and continuously produce insights for time-sensitive use cases. With this in mind, if you have a rule that corresponds to the temperature dropping below a certain value (especially in winter), it might be critical to evaluate and produce a result as timely as possible.

Apache Flink connectors are software components that move data into and out of a Managed Service for Apache Flink application. Connectors are flexible integrations that let you read from files and directories. They consist of complete modules for interacting with AWS services and third-party systems. For more details about connectors, see Use Apache Flink connectors with Managed Service for Apache Flink.

We use two types of connectors (operators) for this solution:

  • Sources – Provide input to your application from a Kinesis data stream, file, or other data source
  • Sinks – Send output from your application to a Kinesis data stream, Amazon Data Firehose stream, or other data destination

Flink applications are streaming dataflows that may be transformed by user-defined operators. These dataflows form directed graphs that start with one or more sources and end in one or more sinks. The following diagram illustrates an example dataflow (source). As previously discussed, we have two Kinesis data streams that can be used as sources for our Flink program.

Flink Data Flow

The following code snippet shows how we have our Kinesis sources set up within our Flink code:

/**
* Creates a DataStream of Rule objects by consuming rule data from a Kinesis
* stream.
*
* @param env The StreamExecutionEnvironment for the Flink job
* @return A DataStream of Rule objects
* @throws IOException if an error occurs while reading Kinesis properties
*/
private DataStream<Rule> createRuleStream(StreamExecutionEnvironment env, Properties sourceProperties)
                throws IOException {
        String RULES_SOURCE = KinesisUtils.getKinesisRuntimeProperty("kinesis", "rulesTopicName");
        FlinkKinesisConsumer<String> kinesisConsumer = new FlinkKinesisConsumer<>(RULES_SOURCE,
                        new SimpleStringSchema(),
                        sourceProperties);
        DataStream<String> rulesStrings = env.addSource(kinesisConsumer)
                        .name("RulesStream")
                        .uid("rules-stream");
        return rulesStrings.flatMap(new RuleDeserializer()).name("Rule Deserialization");
}

/**
* Creates a DataStream of SensorEvent objects by consuming sensor event data
* from a Kinesis stream.
*
* @param env The StreamExecutionEnvironment for the Flink job
* @return A DataStream of SensorEvent objects
* @throws IOException if an error occurs while reading Kinesis properties
*/
private DataStream<SensorEvent> createSensorEventStream(StreamExecutionEnvironment env,
            Properties sourceProperties) throws IOException {
    String DATA_SOURCE = KinesisUtils.getKinesisRuntimeProperty("kinesis", "dataTopicName");
    FlinkKinesisConsumer<String> kinesisConsumer = new FlinkKinesisConsumer<>(DATA_SOURCE,
                    new SimpleStringSchema(),
                    sourceProperties);
    DataStream<String> transactionsStringsStream = env.addSource(kinesisConsumer)
                    .name("EventStream")
                    .uid("sensor-events-stream");

    return transactionsStringsStream.flatMap(new JsonDeserializer<>(SensorEvent.class))
                    .returns(SensorEvent.class)
                    .flatMap(new TimeStamper<>())
                    .returns(SensorEvent.class)
                    .name("Transactions Deserialization");
}

We use a broadcast state, which can be used to combine and jointly process two streams of events in a specific way. A broadcast state is a good fit for applications that need to join a low-throughput stream and a high-throughput stream or need to dynamically update their processing logic. The following diagram illustrates an example how the broadcast state is connected. For more details, see A Practical Guide to Broadcast State in Apache Flink.

Broadcast State

This fits the idea of our dynamic rules engine, where we have a low-throughput rules stream (added to as needed) and a high-throughput transactions stream (coming in at a regular interval, such as one per minute). This broadcast stream allows us to take our transactions stream (or the thermostat data) and connect it to the rules stream as shown in the following code snippet:

// Processing pipeline setup
DataStream<Alert> alerts = sensorEvents
    .connect(rulesStream)
    .process(new DynamicKeyFunction())
    .uid("partition-sensor-data")
    .name("Partition Sensor Data by Equipment and RuleId")
    .keyBy((equipmentSensorHash) -> equipmentSensorHash.getKey())
    .connect(rulesStream)
    .process(new DynamicAlertFunction())
    .uid("rule-evaluator")
    .name("Rule Evaluator");

To learn more about the broadcast state, see The Broadcast State Pattern. When the broadcast stream is connected to the data stream (as in the preceding example), it becomes a BroadcastConnectedStream. The function applied to this stream, which allows us to process the transactions and rules, implements the processBroadcastElement method. The KeyedBroadcastProcessFunction interface provides three methods to process records and emit results:

  • processBroadcastElement() – This is called for each record of the broadcasted stream (our rules stream).
  • processElement() – This is called for each record of the keyed stream. It provides read-only access to the broadcast state to prevent modifications that result in different broadcast states across the parallel instances of the function. The processElement method retrieves the rule from the broadcast state and the previous sensor event of the keyed state. If the expression evaluates to TRUE (discussed in the next section), an alert will be emitted.
  • onTimer() – This is called when a previously registered timer fires. Timers can be registered in the processElement method and are used to perform computations or clean up states in the future. This is used in our code to make sure any old data (as defined by our rule) is evicted as necessary.

We can handle the rule in the broadcast state instance as follows:

@Override
public void processBroadcastElement(Rule rule, Context ctx, Collector<Alert> out) throws Exception {
   BroadcastState<String, Rule> broadcastState = ctx.getBroadcastState(RulesEvaluator.Descriptors.rulesDescriptor);
   Long currentProcessTime = System.currentTimeMillis();
   // If we get a new rule, we'll give it insufficient data rule op status
    if (!broadcastState.contains(rule.getId())) {
        outputRuleOpData(rule, OperationStatus.INSUFFICIENT_DATA, currentProcessTime, ctx);
    }
   ProcessingUtils.handleRuleBroadcast(rule, broadcastState);
}

static void handleRuleBroadcast(FDDRule rule, BroadcastState<String, FDDRule> broadcastState)
        throws Exception {
    switch (rule.getStatus()) {
        case ACTIVE:
            broadcastState.put(rule.getId(), rule);
            break;
        case INACTIVE:
            broadcastState.remove(rule.getId());
            break;
    }
}

Notice what happens in the code when the rule status is INACTIVE. This would remove the rule from the broadcast state, which would then no longer consider the rule to be used. Similarly, handling the broadcast of a rule that is ACTIVE would add or replace the rule within the broadcast state. This is allowing us to dynamically make changes, adding and removing rules as necessary.

Evaluating rules

Rules can be evaluated in a variety of ways. Although it’s not a requirement, our rules were created in a Java Expression Language (JEXL) compatible format. This allows us to evaluate rules by providing a JEXL expression along with the appropriate context (the necessary transactions to reevaluate the rule or key-value pairs), and simply calling the evaluate method:

JexlExpression expression = jexl.createExpression(rule.getRuleExpression());
Boolean isAlertTriggered = (Boolean) expression.evaluate(context);

A powerful feature of JEXL is that not only can it support simple expressions (such as those including comparison and arithmetic), it also has support for user-defined functions. JEXL allows you to call any method on a Java object using the same syntax. If there is a POJO with the name SENSOR_cebb1baf_2df0_4267_b489_28be562fccea that has the method hasNotChanged, you would call that method using the expression. You can find more of these user-defined functions that we used within our SensorMapState class.

Let’s look at an example of how this would work, using a rule expression exists that reads as follows:

"SENSOR_cebb1baf_2df0_4267_b489_28be562fccea.hasNotChanged(5)"

This rule, evaluated by JEXL, would be equivalent to a sensor that hasn’t changed in 5 minutes

The corresponding user-defined function (part of SensorMapState) that is exposed to JEXL (using the context) is as follows:

public Boolean hasNotChanged(Integer time) {
    Long minutesSinceChange = getMinutesSinceChange();
    log.debug("Time: " + time + " | Minutes since change: " + minutesSinceChange);
    return minutesSinceChange >  time;
}

Relevant data, like that below, would go into the context window, which would then be used to evaluate the rule.

{
    "id": "SENSOR_cebb1baf_2df0_4267_b489_28be562fccea",
    "measureValue": 10,
    "eventTimestamp": 1721666423000
}

In this case, the result (or value of isAlertTriggered) is TRUE.

Creating sinks

Much like how we previously created sources, we also can create sinks. These sinks will be used as the end to our stream processing where our analyzed and evaluated results will get emitted for future use. Like our source, our sink is also a Kinesis data stream, where a downstream Lambda consumer will iterate the records and process them to take the appropriate action. There are many applications of downstream processing; for example, we can persist this evaluation result, create a push notification, or update a rule dashboard.

Based on the previous evaluation, we have the following logic within the process function itself:

if (isAlertTriggered) {
    alert = new Alert(rule.getEquipmentName(), rule.getName(), rule.getId(), AlertStatus.START,
            triggeringEvents, currentEvalTime);
    log.info("Pushing {} alert for {}", AlertStatus.START, rule.getName());
}
out.collect(alert);

When the process function emits the alert, the alert response is sent to the sink, which then can be read and used downstream in the architecture:

alerts.flatMap(new JsonSerializer<>(Alert.class))
    .name("Alerts Deserialization").sinkTo(createAlertSink(sinkProperties))
    .uid("alerts-json-sink")
    .name("Alerts JSON Sink");

At this point, we can then process it. We have a Lambda function logging the records where we can see the following:

{
   "equipmentName":"THERMOSTAT_1",
   "ruleName":"RuleTest2",
   "ruleId":"cda160c0-c790-47da-bd65-4abae838af3b",
   "status":"START",
   "triggeringEvents":[
      {
         "equipment":{
            "id":"THERMOSTAT_1",
         },
         "id":"SENSOR_cebb1baf_2df0_4267_b489_28be562fccea",
         "measureValue":20.0,
         "eventTimestamp":1721672715000,
         "ingestionTimestamp":1721741792958
      }
   ],
   "timestamp":1721741792790
}

Although simplified in this example, these code snippets form the basis for taking the evaluation results and sending them elsewhere.

Conclusion

In this post, we demonstrated how to implement a dynamic rules engine using Managed Service for Apache Flink with both the rules and input data streamed through Kinesis Data Streams. You can learn more about it with the e-learning that we have available.

As companies seek to implement near real-time rules engines, this architecture presents a compelling solution. Managed Service for Apache Flink offers powerful capabilities for transforming and analyzing streaming data in real time, while simplifying the management of Flink workloads and seamlessly integrating with other AWS services.

To help you get started with this architecture, we’re excited to announce that we’ll be publishing our complete rules engine code as a sample on GitHub. This comprehensive example will go beyond the code snippets provided in our post, offering a deeper look into the intricacies of building a dynamic rules engine with Flink.

We encourage you to explore this sample code, adapt it to your specific use case, and take advantage of the full potential of real-time data processing in your applications. Check out the GitHub repository, and don’t hesitate to reach out with any questions or feedback as you embark on your journey with Flink and AWS!


About the Authors

Steven Carpenter is a Senior Solution Developer on the AWS Industries Prototyping and Customer Engineering (PACE) team, helping AWS customers bring innovative ideas to life through rapid prototyping on the AWS platform. He holds a master’s degree in Computer Science from Wayne State University in Detroit, Michigan. Connect with Steven on LinkedIn!

Aravindharaj Rajendran is a Senior Solution Developer within the AWS Industries Prototyping and Customer Engineering (PACE) team, based in Herndon, VA. He helps AWS customers materialize their innovative ideas by rapid prototyping using the AWS platform. Outside of work, he loves playing PC games, Badminton and Traveling.

Israel’s Pager Attacks and Supply Chain Vulnerabilities

Post Syndicated from Bruce Schneier original https://www.schneier.com/blog/archives/2024/09/israels-pager-attacks.html

Israel’s brazen attacks on Hezbollah last week, in which hundreds of pagers and two-way radios exploded and killed at least 37 people, graphically illustrated a threat that cybersecurity experts have been warning about for years: Our international supply chains for computerized equipment leave us vulnerable. And we have no good means to defend ourselves.

Though the deadly operations were stunning, none of the elements used to carry them out were particularly new. The tactics employed by Israel, which has neither confirmed nor denied any role, to hijack an international supply chain and embed plastic explosives in Hezbollah devices have been used for years. What’s new is that Israel put them together in such a devastating and extravagantly public fashion, bringing into stark relief what the future of great power competition will look like—in peacetime, wartime and the ever expanding gray zone in between.

The targets won’t be just terrorists. Our computers are vulnerable, and increasingly so are our cars, our refrigerators, our home thermostats and many other useful things in our orbits. Targets are everywhere.

The core component of the operation, implanting plastic explosives in pagers and radios, has been a terrorist risk since Richard Reid, the so-called shoe bomber, tried to ignite some on an airplane in 2001. That’s what all of those airport scanners are designed to detect—both the ones you see at security checkpoints and the ones that later scan your luggage. Even a small amount can do an impressive degree of damage.

The second component, assassination by personal device, isn’t new, either. Israel used this tactic against a Hamas bomb maker in 1996 and a Fatah activist in 2000. Both were killed by remotely detonated booby-trapped cellphones.

The final and more logistically complex piece of Israel’s plan, attacking an international supply chain to compromise equipment at scale, is something that the United States has done, though for different purposes. The National Security Agency has intercepted communications equipment in transit and modified it not for destructive purposes but for eavesdropping. We know from an Edward Snowden document that the agency did this to a Cisco router destined for a Syrian telecommunications company. Presumably, this wasn’t the agency’s only operation of this type.

Creating a front company to fool victims isn’t even a new twist. Israel reportedly created a shell company to produce and sell explosive-laden devices to Hezbollah. In 2019 the FBI created a company that sold supposedly secure cellphones to criminals—not to assassinate them but to eavesdrop on and then arrest them.

The bottom line: Our supply chains are vulnerable, which means that we are vulnerable. Any individual, country or group that interacts with a high-tech supply chain can subvert the equipment passing through it. It can be subverted to eavesdrop. It can be subverted to degrade or fail on command. And although it’s harder, it can be subverted to kill.

Personal devices connected to the internet—and countries where they are in high use, such as the United States—are especially at risk. In 2007 the Idaho National Laboratory demonstrated that a cyberattack could cause a high-voltage generator to explode. In 2010 a computer virus believed to have been developed by the United States and Israel destroyed centrifuges at an Iranian nuclear facility. A 2017 dump of CIA documents included statements about the possibility of remotely hacking cars, which WikiLeaks asserted could be used to carry out “nearly undetectable assassinations.” This isn’t just theoretical: In 2015 a Wired reporter allowed hackers to remotely take over his car while he was driving it. They disabled the engine while he was on a highway.

The world has already begun to adjust to this threat. Many countries are increasingly wary of buying communications equipment from countries they don’t trust. The United States and others are banning large routers from the Chinese company Huawei because we fear that they could be used for eavesdropping and—even worse—disabled remotely in a time of escalating hostilities. In 2019 there was a minor panic over Chinese-made subway cars that could have been modified to eavesdrop on their riders.

It’s not just finished equipment that is under the scanner. More than a decade ago, the US military investigated the security risks of using Chinese parts in its equipment. In 2018 a Bloomberg report revealed US investigators had accused China of modifying computer chips to steal information.

It’s not obvious how to defend against these and similar attacks. Our high-tech supply chains are complex and international. It didn’t raise any red flags to Hezbollah that the group’s pagers came from a Hungary-based company that sourced them from Taiwan, because that sort of thing is perfectly normal. Most of the electronics Americans buy come from overseas, including our iPhones, whose parts come from dozens of countries before being pieced together primarily in China.

That’s a hard problem to fix. We can’t imagine Washington passing a law requiring iPhones to be made entirely in the United States. Labor costs are too high, and our country doesn’t have the domestic capacity to make these things. Our supply chains are deeply, inexorably international, and changing that would require bringing global economies back to the 1980s.

So what happens now? As for Hezbollah, its leaders and operatives will no longer be able to trust equipment connected to a network—very likely one of the primary goals of the attacks. And the world will have to wait to see if there are any long-term effects of this attack and how the group will respond.

But now that the line has been crossed, other countries will almost certainly start to consider this sort of tactic as within bounds. It could be deployed against a military during a war or against civilians in the run-up to a war. And developed countries like the United States will be especially vulnerable, simply because of the sheer number of vulnerable devices we have.

This essay originally appeared in The New York Times.

Hacking Wireless Bicycle Shifters

Post Syndicated from Bruce Schneier original https://www.schneier.com/blog/archives/2024/08/hacking-wireless-bicycle-shifters.html

This is yet another insecure Internet-of-things story, this one about wireless gear shifters for bicycles. These gear shifters are used in big-money professional bicycle races like the Tour de France, which provides an incentive to actually implement this attack.

Research paper. Another news story.

Slashdot thread.

Robot Dog Internet Jammer

Post Syndicated from Bruce Schneier original https://www.schneier.com/blog/archives/2024/07/robot-dog-internet-jammer.html

Supposedly the DHS has these:

The robot, called “NEO,” is a modified version of the “Quadruped Unmanned Ground Vehicle” (Q-UGV) sold to law enforcement by a company called Ghost Robotics. Benjamine Huffman, the director of DHS’s Federal Law Enforcement Training Centers (FLETC), told police at the 2024 Border Security Expo in Texas that DHS is increasingly worried about criminals setting “booby traps” with internet of things and smart home devices, and that NEO allows DHS to remotely disable the home networks of a home or building law enforcement is raiding. The Border Security Expo is open only to law enforcement and defense contractors. A transcript of Huffman’s speech was obtained by the Electronic Frontier Foundation’s Dave Maass using a Freedom of Information Act request and was shared with 404 Media.

“NEO can enter a potentially dangerous environment to provide video and audio feedback to the officers before entry and allow them to communicate with those in that environment,” Huffman said, according to the transcript. “NEO carries an onboard computer and antenna array that will allow officers the ability to create a ‘denial-of-service’ (DoS) event to disable ‘Internet of Things’ devices that could potentially cause harm while entry is made.”

Slashdot thread.

Building a scalable streaming data platform that enables real-time and batch analytics of electric vehicles on AWS

Post Syndicated from Ayush Agrawal original https://aws.amazon.com/blogs/big-data/building-a-scalable-streaming-data-platform-that-enables-real-time-and-batch-analytics-of-electric-vehicles-on-aws/

The automobile industry has undergone a remarkable transformation because of the increasing adoption of electric vehicles (EVs). EVs, known for their sustainability and eco-friendliness, are paving the way for a new era in transportation. As environmental concerns and the push for greener technologies have gained momentum, the adoption of EVs has surged, promising to reshape our mobility landscape.

The surge in EVs brings with it a profound need for data acquisition and analysis to optimize their performance, reliability, and efficiency. In the rapidly evolving EV industry, the ability to harness, process, and derive insights from the massive volume of data generated by EVs has become essential for manufacturers, service providers, and researchers alike.

As the EV market is expanding with many new and incumbent players trying to capture the market, the major differentiating factor will be the performance of the vehicles.

Modern EVs are equipped with an array of sensors and systems that continuously monitor various aspects of their operation including parameters such as voltage, temperature, vibration, speed, and so on. From battery management to motor performance, these data-rich machines provide a wealth of information that, when effectively captured and analyzed, can revolutionize vehicle design, enhance safety, and optimize energy consumption. The data can be used to do predictive maintenance, device anomaly detection, real-time customer alerts, remote device management, and monitoring.

However, managing this deluge of data isn’t without its challenges. As the adoption of EVs accelerates, the need for robust data pipelines capable of collecting, storing, and processing data from an exponentially growing number of vehicles becomes more pronounced. Moreover, the granularity of data generated by each vehicle has increased significantly, making it essential to efficiently handle the ever-increasing number of data points. The challenges include not only the technical intricacies of data management but also concerns related to data security, privacy, and compliance with evolving regulations.

In this blog post, we delve into the intricacies of building a reliable data analytics pipeline that can scale to accommodate millions of vehicles, each generating hundreds of metrics every second using Amazon OpenSearch Ingestion. We also provide guidelines and sample configurations to help you implement a solution.

Of the prerequisites that follow, the IOT topic rule and the Amazon Managed Streaming for Apache Kafka (Amazon MSK) cluster can be set up by following How to integrate AWS IoT Core with Amazon MSK. The steps to create an Amazon OpenSearch Service cluster are available in Creating and managing Amazon OpenSearch Service domains.

Prerequisites

Before you begin the implementing the solution, you need the following:

  • IOT topic rule
  • Amazon MSK Simple Authentication and Security Layer/Salted Challenge Response Mechanism (SASL/SCRAM) cluster
  • Amazon OpenSearch Service domain

Solution overview

The following architecture diagram provides a scalable and fully managed modern data streaming platform. The architecture uses Amazon OpenSearch Ingestion to stream data into OpenSearch Service and Amazon Simple Storage Service (Amazon S3) to store the data. The data in OpenSearch powers real-time dashboards. The data can also be used to notify customers of any failures occurring on the vehicle (see Configuring alerts in Amazon OpenSearch Service). The data in Amazon S3 is used for business intelligence and long-term storage.

Architecture diagram

In the following sections, we focus on the following three critical pieces of the architecture in depth:

1. Amazon MSK to OpenSearch ingestion pipeline

2. Amazon OpenSearch Ingestion pipeline to OpenSearch Service

3. Amazon OpenSearch Ingestion to Amazon S3

Solution Walkthrough

Step 1: MSK to Amazon OpenSearch Ingestion pipeline

Because each electric vehicle streams massive volumes of data to Amazon MSK clusters through AWS IoT Core, making sense of this data avalanche is critical. OpenSearch Ingestion provides a fully managed serverless integration to tap into these data streams.

The Amazon MSK source in OpenSearch Ingestion uses Kafka’s Consumer API to read records from one or more MSK topics. The MSK source in OpenSearch Ingestion seamlessly connects to MSK to ingest the streaming data into OpenSearch Ingestion’s processing pipeline.

The following snippet illustrates the pipeline configuration for an OpenSearch Ingestion pipeline used to ingest data from an MSK cluster.

While creating an OpenSearch Ingestion pipeline, add the following snippet in the Pipeline configuration section.

version: "2"
msk-pipeline: 
  source: 
    kafka: 
      acknowledgments: true                  
      topics: 
         - name: "ev-device-topic " 
           group_id: "opensearch-consumer" 
           serde_format: json                 
      aws: 
        # Provide the Role ARN with access to MSK. This role should have a trust relationship with osis-pipelines.amazonaws.com 
        sts_role_arn: "arn:aws:iam:: ::<<account-id>>:role/opensearch-pipeline-Role"
        # Provide the region of the domain. 
        region: "<<region>>" 
        msk: 
          # Provide the MSK ARN.  
          arn: "arn:aws:kafka:<<region>>:<<account-id>>:cluster/<<name>>/<<id>>" 

When configuring Amazon MSK and OpenSearch Ingestion, it’s essential to establish an optimal relationship between the number of partitions in your Kafka topics and the number of OpenSearch Compute Units (OCUs) allocated to your ingestion pipelines. This optimal configuration ensures efficient data processing and maximizes throughput. You can read more about it in Configure recommended compute units (OCUs) for the Amazon MSK pipeline.

Step 2: OpenSearch Ingestion pipeline to OpenSearch Service

OpenSearch Ingestion offers a direct method for streaming EV data into OpenSearch. The OpenSearch sink plugin channels data from multiple sources directly into the OpenSearch domain. Instead of manually provisioning the pipeline, you define the capacity for your pipeline using OCUs. Each OCU provides 6 GB of memory and two virtual CPUs. To use OpenSearch Ingestion auto-scaling optimally, it’s essential to configure the maximum number of OCUs for a pipeline based on the number of partitions in the topics being ingested. If a topic has a large number of partitions (for example, more than 96, which is the maximum OCUs per pipeline), it’s recommended to configure the pipeline with a maximum of 1–96 OCUs. This way, the pipeline can automatically scale up or down within this range as needed. However, if a topic has a low number of partitions (for example, fewer than 96), it’s advisable to set the maximum number of OCUs to be equal to the number of partitions. This approach ensures that each partition is processed by a dedicated OCU enabling parallel processing and optimal performance. In scenarios where a pipeline ingests data from multiple topics, the topic with the highest number of partitions should be used as a reference to configure the maximum OCUs. Additionally, if higher throughput is required, you can create another pipeline with a new set of OCUs for the same topic and consumer group, enabling near-linear scalability.

OpenSearch Ingestion provides several pre-defined configuration blueprints that can help you quickly build your ingestion pipeline on AWS

The following snippet illustrates pipeline configuration for an OpenSearch Ingestion pipeline using OpenSearch as a SINK with a dead letter queue (DLQ) to Amazon S3. When a pipeline encounters write errors, it creates DLQ objects in the configured S3 bucket. DLQ objects exist within a JSON file as an array of failed events.

sink: 
      - opensearch: 
          # Provide an AWS OpenSearch Service domain endpoint 
          hosts: [ "https://<<domain-name>>.<<region>>.es.amazonaws.com" ] 
          aws: 
          # Provide a Role ARN with access to the domain. This role should have a trust relationship with osis-pipelines.amazonaws.com 
            sts_role_arn: "arn:aws:iam::<<account-id>>:role/<<role-name>>" 
          # Provide the region of the domain. 
            region: "<<region>>" 
          # Enable the 'serverless' flag if the sink is an Amazon OpenSearch Serverless collection 
          # serverless: true 
          # index name can be auto-generated from topic name 
          index: "index_ev_pipe-%{yyyy.MM.dd}" 
          # Enable 'distribution_version' setting if the AWS OpenSearch Service domain is of version Elasticsearch 6.x 
          #distribution_version: "es6" 
          # Enable the S3 DLQ to capture any failed requests in Ohan S3 bucket 
          dlq: 
            s3: 
            # Provide an S3 bucket 
              bucket: "<<bucket-name>>"
            # Provide a key path prefix for the failed requests
              key_path_prefix: "oss-pipeline-errors/dlq"
            # Provide the region of the bucket.
              region: "<<region>>"
            # Provide a Role ARN with access to the bucket. This role should have a trust relationship with osis-pipelines.amazonaws.com
              sts_role_arn: "arn:aws:iam:: <<account-id>>:role/<<role-name>>"

Step 3: OpenSearch Ingestion to Amazon S3

OpenSearch Ingestion offers a built-in sink for loading streaming data directly into S3. The service can compress, partition, and optimize the data for cost-effective storage and analytics in Amazon S3. Data loaded into S3 can be partitioned for easier query isolation and lifecycle management. Partitions can be based on vehicle ID, date, geographic region, or other dimensions as needed for your queries.

The following snippet illustrates how we’ve partitioned and stored EV data in Amazon S3.

- s3:
            aws:
              # Provide a Role ARN with access to the bucket. This role should have a trust relationship with osis-pipelines.amazonaws.com
                sts_role_arn: "arn:aws:iam::<<account-id>>:role/<<role-name>>"
              # Provide the region of the domain.
                region: "<<region>>"
            # Replace with the bucket to send the logs to
            bucket: "evbucket"
            object_key:
              # Optional path_prefix for your s3 objects
              path_prefix: "index_ev_pipe/year=%{yyyy}/month=%{MM}/day=%{dd}/hour=%{HH}"
            threshold:
              event_collect_timeout: 60s
            codec:
              parquet:
                auto_schema: true

The pipeline can be created following the steps in Creating Amazon OpenSearch Ingestion pipelines.

The following is the complete pipeline configuration, combining the configuration of all three steps. Update the Amazon Resource Names (ARNs), AWS Region, Open Search Service domain endpoint, and S3 names as needed.

The entire OpenSearch Ingestion pipeline configuration can be directly copied into the ‘Pipeline configuration’ field in the AWS Management Console while creating the OpenSearch Ingestion pipeline

version: "2"
msk-pipeline: 
  source: 
    kafka: 
      acknowledgments: true           # Default is false  
      topics: 
         - name: "<<msk-topic-name>>" 
           group_id: "opensearch-consumer" 
           serde_format: json        
      aws: 
        # Provide the Role ARN with access to MSK. This role should have a trust relationship with osis-pipelines.amazonaws.com 
        sts_role_arn: "arn:aws:iam::<<account-id>>:role/<<role-name>>"
        # Provide the region of the domain. 
        region: "<<region>>" 
        msk: 
          # Provide the MSK ARN.  
          arn: "arn:aws:kafka:us-east-1:<<account-id>>:cluster/<<cluster-name>>/<<cluster-id>>" 
  processor:
      - parse_json:
  sink: 
      - opensearch: 
          # Provide an AWS OpenSearch Service domain endpoint 
          hosts: [ "https://<<opensearch-service-domain-endpoint>>.us-east-1.es.amazonaws.com" ] 
          aws: 
          # Provide a Role ARN with access to the domain. This role should have a trust relationship with osis-pipelines.amazonaws.com 
            sts_role_arn: "arn:aws:iam::<<account-id>>:role/<<role-name>>" 
          # Provide the region of the domain. 
            region: "<<region>>" 
          # Enable the 'serverless' flag if the sink is an Amazon OpenSearch Serverless collection 
          # index name can be auto-generated from topic name 
          index: "index_ev_pipe-%{yyyy.MM.dd}" 
          # Enable 'distribution_version' setting if the AWS OpenSearch Service domain is of version Elasticsearch 6.x 
          #distribution_version: "es6" 
          # Enable the S3 DLQ to capture any failed requests in Ohan S3 bucket 
          dlq: 
            s3: 
            # Provide an S3 bucket 
              bucket: "<<bucket-name>>"
            # Provide a key path prefix for the failed requests
              key_path_prefix: "oss-pipeline-errors/dlq"
            # Provide the region of the bucket.
              region: "<<region>>"
            # Provide a Role ARN with access to the bucket. This role should have a trust relationship with osis-pipelines.amazonaws.com
              sts_role_arn: "arn:aws:iam::<<account-id>>:role/<<role-name>>"
      - s3:
            aws:
              # Provide a Role ARN with access to the bucket. This role should have a trust relationship with osis-pipelines.amazonaws.com
                sts_role_arn: "arn:aws:iam::<<account-id>>:role/<<role-name>>"
              # Provide the region of the domain.
                region: "<<region>>"
            # Replace with the bucket to send the logs to
            bucket: "<<bucket-name>>"
            object_key:
              # Optional path_prefix for your s3 objects
              path_prefix: "index_ev_pipe/year=%{yyyy}/month=%{MM}/day=%{dd}/hour=%{HH}"
            threshold:
              event_collect_timeout: 60s
            codec:
              parquet:
                auto_schema: true

Real-time analytics

After the data is available in OpenSearch Service, you can build real-time monitoring and notifications. OpenSearch Service has robust support for multiple notification channels, allowing you to receive alerts through services like Slack, Chime, custom webhooks, Microsoft Teams, email, and Amazon Simple Notification Service (Amazon SNS).

The following screenshot illustrates supported notification channels in OpenSearch Service.

The notification feature in OpenSearch Service allows you to create monitors that will watch for certain conditions or changes in your data and launch alerts, such as monitoring vehicle telemetry data and launching alerts for issues like battery degradation or abnormal energy consumption. For example, you can create a monitor that analyzes battery capacity over time and notifies the on-call team using Slack if capacity drops below expected degradation curves in a significant number of vehicles. This could indicate a potential manufacturing defect requiring investigation.

In addition to notifications, OpenSearch Service makes it easy to build real-time dashboards to visually track metrics across your fleet of vehicles. You can ingest vehicle telemetry data like location, speed, fuel consumption, and so on, and visualize it on maps, charts, and gauges. Dashboards can provide real-time visibility into vehicle health and performance.

The following screenshot illustrates creating a sample dashboard on OpenSearch Service

Opensearch Dashboard

A key benefit of OpenSearch Service is its ability to handle high sustained ingestion and query rates with millisecond latencies. It distributes incoming vehicle data across data nodes in a cluster for parallel processing. This allows OpenSearch to scale out to handle very large fleets while still delivering the real-time performance needed for operational visibility and alerting.

Batch analytics

After the data is available in Amazon S3, you can build a secure data lake to power a variety of analytics use cases deriving powerful insights. As an immutable store, new data is continually stored in S3 while existing data remains unaltered. This serves as a single source of truth for downstream analytics.

For business intelligence and reporting, you can analyze trends, identify insights, and create rich visualizations powered by the data lake. You can use Amazon QuickSight to build and share dashboards without needing to set up servers or infrastructure. Here’s an example of a Quicksight dashboard for IoT device data. For example, you can use a dashboard to gain insights from historical data that can help with better vehicle and battery design.

The Amazon Quicksight public gallery shows examples of dashboards across different domains.

You should consider Amazon OpenSearch dashboards for your operational day-to-day use cases to identify issues and alert in near real time whereas Amazon Quicksight should be used to analyze big data stored in a lake house and generate actionable insights from them.

Clean up

Delete the OpenSearch pipeline and Amazon MSK cluster to stop incurring costs on these services.

Conclusion

In this post, you learned how Amazon MSK, OpenSearch Ingestion, OpenSearch Services, and Amazon S3 can be integrated to ingest, process, store, analyze, and act on endless streams of EV data efficiently.

With OpenSearch Ingestion as the integration layer between streams and storage, the entire pipeline scales up and down automatically based on demand. No more complex cluster management or lost data from bursts in streams.

See Amazon OpenSearch Ingestion to learn more.


About the authors

Ayush Agrawal is a Startups Solutions Architect from Gurugram, India with 11 years of experience in Cloud Computing. With a keen interest in AI, ML, and Cloud Security, Ayush is dedicated to helping startups navigate and solve complex architectural challenges. His passion for technology drives him to constantly explore new tools and innovations. When he’s not architecting solutions, you’ll find Ayush diving into the latest tech trends, always eager to push the boundaries of what’s possible.

Fraser SequeiraFraser Sequeira is a Solutions Architect with AWS based in Mumbai, India. In his role at AWS, Fraser works closely with startups to design and build cloud-native solutions on AWS, with a focus on analytics and streaming workloads. With over 10 years of experience in cloud computing, Fraser has deep expertise in big data, real-time analytics, and building event-driven architecture on AWS.

How PostNL processes billions of IoT events with Amazon Managed Service for Apache Flink

Post Syndicated from Çağrı Çakır original https://aws.amazon.com/blogs/big-data/how-postnl-processes-billions-of-iot-events-with-amazon-managed-service-for-apache-flink/

This post is co-written with Çağrı Çakır and Özge Kavalcı from PostNL.

PostNL is the designated universal postal service provider for the Netherlands and has three main business units offering postal delivery, parcel delivery, and logistics solutions for ecommerce and cross-border solutions. With 5,800 retail points, 11,000 mailboxes, and over 900 automated parcel lockers, the company plays an important role in the logistics value chain. It aims to be the delivery organization of choice by making it as easy as possible to send and receive parcels and mail. With almost 34,000 employees, PostNL is at the heart of society. On a typical weekday, the company delivers an average of 1.1 million parcels and 6.9 million letters across Belgium, Netherlands, and Luxemburg.

In this post, we describe the legacy PostNL stream processing solution, its challenges, and why PostNL chose Amazon Managed Service for Apache Flink to help modernize their Internet of Things (IoT) data stream processing platform. We provide a reference architecture, describe the steps we took to migrate to Apache Flink, and the lessons learned along the way.

With this migration, PostNL has been able to build a scalable, robust, and extendable stream processing solution for their IoT platform. Apache Flink is a perfect fit for IoT. Scaling horizontally, it allows processing the sheer volume of data generated by IoT devices. With event time semantics, you can correctly handle events in the order they were generated, even from occasionally disconnected devices.

PostNL is excited about the potential of Apache Flink, and now plans to use Managed Service for Apache Flink with other streaming use cases and shift more business logic upstream into Apache Flink.

Apache Flink and Managed Service for Apache Flink

Apache Flink is a distributed computation framework that allows for stateful real-time data processing. It provides a single set of APIs for building batch and streaming jobs, making it straightforward for developers to work with bounded and unbounded data. Managed Service for Apache Flink is an AWS service that provides a serverless, fully managed infrastructure for running Apache Flink applications. Developers can build highly available, fault-tolerant, and scalable Apache Flink applications with ease and without needing to become an expert in building, configuring, and maintaining Apache Flink clusters on AWS.

The challenge of real-time IoT data at scale

Today, PostNL’s IoT platform, Roller Cages solution, tracks more than 380,000 assets with Bluetooth Low Energy (BLE) technology in near real time. The IoT platform was designed to provide availability, geofencing, and bottom state events of each asset by using telemetry sensor data such as GPS points and accelerometers that are coming from Bluetooth devices. Those events are used by different internal consumers to make logistical operations straightforward to plan, more efficient, and sustainable.

PostNL Roller cages tracking solution

Tracking this high volume of assets emitting different sensor readings inevitably creates billions of raw IoT events for the IoT platform as well as for the downstream systems. Handling this load repeatedly both within the IoT platform and throughout the downstream systems was neither cost-efficient nor easy to maintain. To reduce the cardinality of events, the IoT platform uses stream processing to aggregate data over fixed time windows. These aggregations must be based on the moment when the device emitted the event. This type of aggregation based on event time becomes complex when messages may be delayed and arrive out of order, which may frequently happen with IoT devices that can get disconnected temporarily.

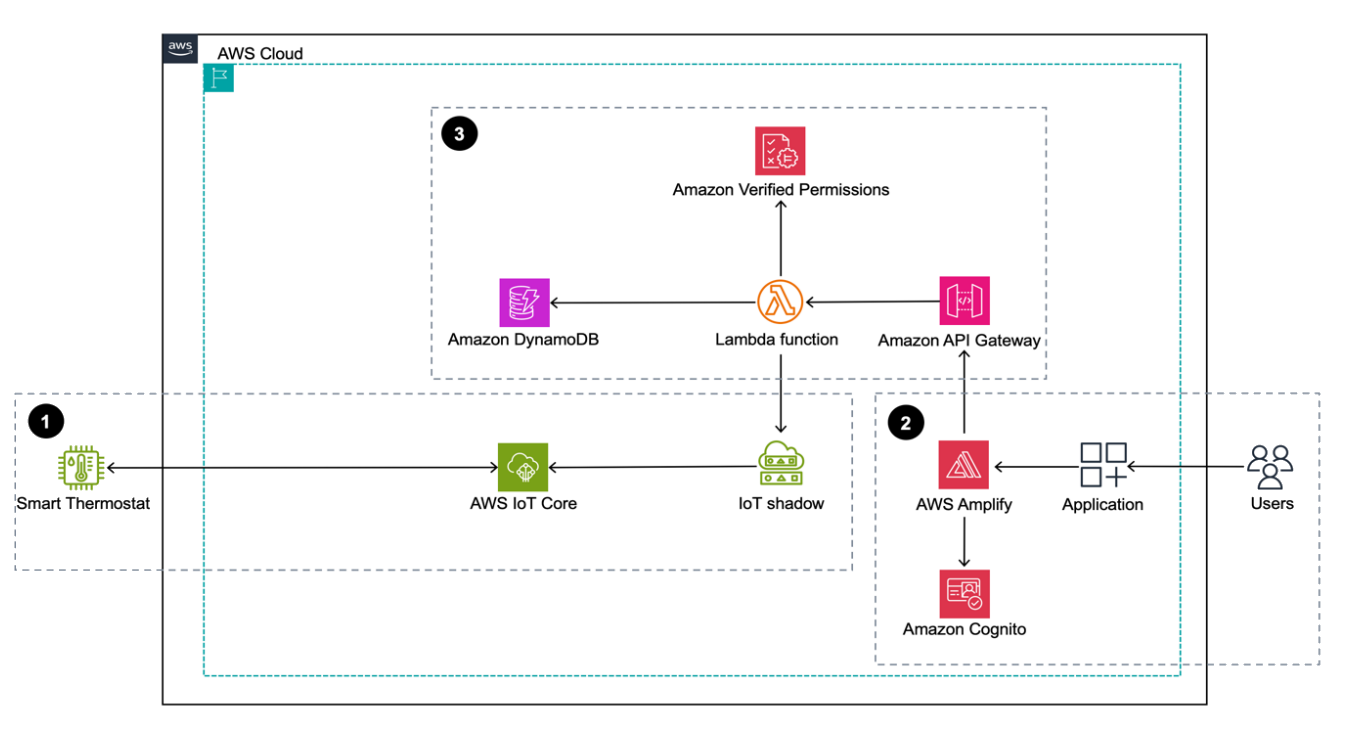
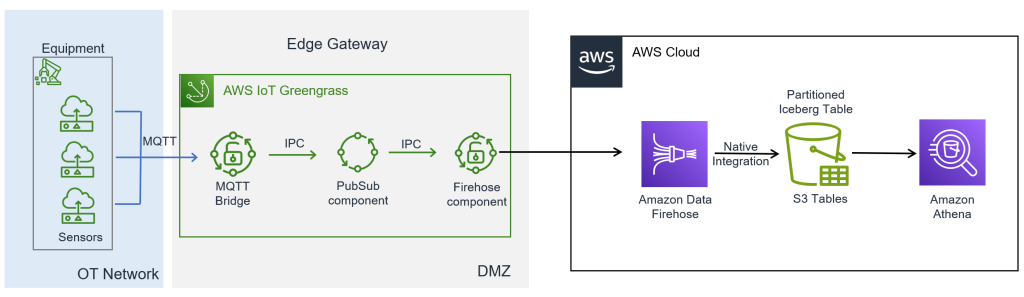
The following diagram illustrates the overall flow from edge to the downstream systems.

PostNL IoT workflow

The workflow consists of the following components:

  1. The edge architecture includes IoT BLE devices that serve as sources of telemetry data, and gateway devices that connect these IoT devices to the IoT platform.
  2. Inlets contain a set of AWS services such as AWS IoT Core and Amazon API Gateway to collect IoT detections using MQTTS or HTTPS and deliver them to the source data stream using Amazon Kinesis Data Streams.
  3. The aggregation application filters IoT detections, aggregates them for a fixed time window, and sinks aggregations to the destination data stream.
  4. Event producers are the combination of different stateful services that generate IoT events such as geofencing, availability, bottom state, and in-transit.
  5. Outlets, including services such as Amazon EventBridge, Amazon Data Firehose, and Kinesis Data Streams, deliver produced events to consumers.
  6. Consumers, which are internal teams, interpret IoT events and build business logic based on them.

The core component of this architecture is the aggregation application. This component was originally implemented using a legacy stream processing technology. For several reasons, as we discuss shortly, PostNL decided to evolve this critical component. The journey of replacing the legacy stream processing with Managed Service for Apache Flink is the focus of the rest of this post.

The decision to migrate the aggregation application to Managed Service for Apache Flink

As the number of connected devices grows, so does the necessity for a robust and scalable platform capable of handling and aggregating massive volumes of IoT data. After thorough analysis, PostNL opted to migrate to Managed Service for Apache Flink, driven by several strategic considerations that align with evolving business needs:

  • Enhanced data aggregation – Using Apache Flink’s strong capabilities in real-time data processing enables PostNL to efficiently aggregate raw IoT data from various sources. The ability to extend the aggregation logic beyond what was provided by the current solution can unlock more sophisticated analytics and more informed decision-making processes.
  • Scalability – The managed service provides the ability to scale your application horizontally. This allows PostNL to handle increasing data volumes effortlessly as the number of IoT devices grows. This scalability means that data processing capabilities can expand in tandem with the business.
  • Focus on core business – By adopting a managed service, the IoT platform team can focus on implementing business logic and develop new use cases. The learning curve and overhead of operating Apache Flink at scale would have diverted valuable energies and resources of the relatively small team, slowing down the adoption process.
  • Cost-effectiveness – Managed Service for Apache Flink employs a pay-as-you-go model that aligns with operational budgets. This flexibility is particularly beneficial for managing costs in line with fluctuating data processing needs.

Challenges of handling late events

Common stream processing use cases require aggregating events based on when they were generated. This is called event time semantics. When implementing this type of logic, you may encounter the problem of delayed events, in which events reach your processing system late, long after other events generated around the same time.

Late events are common in IoT due to reasons inherent to the environment, such as network delays, device failures, temporarily disconnected devices, or downtime. IoT devices often communicate over wireless networks, which can introduce delays in transmitting data packets. And sometimes they may experience intermittent connectivity issues, resulting in data being buffered and sent in batches after connectivity is restored. This may result in events being processed out of order—some events may be processed several minutes after other events that were generated around the same time.

Imagine you want to aggregate events generated by devices within a specific 10-second window. If events can be several minutes late, how can you be sure you have received all events that were generated in those 10 seconds?

A simple implementation may just wait for several minutes, allowing late events to arrive. But this method means that you can’t calculate the result of your aggregation until several minutes later, increasing the output latency. Another solution would be waiting a few seconds, and then dropping any events arriving later.

Increasing latency or dropping events that may contain critical information are not palatable options for the business. The solution must be a good compromise, a trade-off between latency and completeness.

Apache Flink offers event time semantics out of the box. In contrast to other stream processing frameworks, Flink offers multiple options for dealing with late events. We dive into how Apache Flink deal with late events next.

A powerful stream processing API

Apache Flink provides a rich set of operators and libraries for common data processing tasks, including windowing, joins, filters, and transformations. It also includes over 40 connectors for various data sources and sinks, including streaming systems like Apache Kafka and Amazon Managed Streaming for Apache Kafka, or Kinesis Data Streams, databases, and also file system and object stores like Amazon Simple Storage Service (Amazon S3).

But the most important characteristic for PostNL is that Apache Flink offers different APIs with different level of abstractions. You can start with a higher level of abstraction, SQL, or Table API. These APIs abstract streaming data as more familiar tables, making them easier to learn for simpler use cases. If your logic becomes more complex, you can switch to the lower level of abstraction of the DataStream API, where streams are represented natively, closer to the processing happening inside Apache Flink. If you need the finest-grained level of control on how each single event is handled, you can switch to the Process Function.

A key learning has been that choosing one level of abstraction for your application is not an irreversible architectural decision. In the same application, you can mix different APIs, depending on the level of control you need at that specific step.

Scaling horizontally

To process billions of raw events and grow with the business, the ability to scale was an essential requirement for PostNL. Apache Flink is designed to scale horizontally, distributing processing and application state across multiple processing nodes, with the ability to scale out further when the workload grows.

For this particular use case, PostNL had to aggregate the sheer volume of raw events with similar characteristics and over time, to reduce their cardinality and make the data flow manageable for the other systems downstream. These aggregations go beyond simple transformations that handle one event at a time. They require a framework capable of stateful stream processing. This is exactly the type of use case Apache Flink was designed for.

Advanced event time semantics

Apache Flink emphasizes event time processing, which enables accurate and consistent handling of data with respect to the time it occurred. By providing built-in support for event time semantics, Flink can handle out-of-order events and late data gracefully. This capability was fundamental for PostNL. As mentioned, IoT generated events may arrive late and out of order. However, the aggregation logic must be based on the moment the measurement was actually taken by the device—the event time—and not when it’s processed.

Resiliency and guarantees

PostNL had to make sure no data sent from the device is lost, even in case of failure or restart of the application. Apache Flink offers strong fault tolerance guarantees through its distributed snapshot-based checkpointing mechanism. In the event of failures, Flink can recover the state of the computations and achieve exactly-once semantics of the result. For example, each event from a device is never missed nor counted twice, even in the event of an application failure.

The journey of choosing the right Apache Flink API

A key requirement of the migration was reproducing exactly the behavior of the legacy aggregation application, as expected by the downstream systems that can’t be modified. This introduced several additional challenges, in particular around windowing semantics and late event handling.

As we have seen, in IoT, events may be out of order by several minutes. Apache Flink offers two high-level concepts for implementing event time semantics with out-of-order events: watermarks and allowed lateness.

Apache Flink provides a range of flexible APIs with different levels of abstraction. After some initial research, Flink-SQL and the Table API were discarded. These higher levels of abstraction provide advanced windowing and event time semantics, but couldn’t provide the fine-grained control PostNL needed to reproduce exactly the behavior of the legacy application.

The lower level of abstraction of the DataStream API also offers windowing aggregation capabilities, and allows you to customize the behaviors with custom triggers, evictors, and handling late events by setting an allowed lateness.

Unfortunately, the legacy application was designed to handle late events in a peculiar way. The result was a hybrid event time and processing time logic that couldn’t be easily reproduced using high-level Apache Flink primitives.

Fortunately, Apache Flink offers a further lower level of abstraction, the ProcessFunction API. With this API, you have the finest-grained control on application state, and you can use timers to implement virtually any custom time-based logic.

PostNL decided to go in this direction. The aggregation was implemented using a KeyedProcessFunction that provides a way to perform arbitrary stateful processing on keyed streams—logically partitioned streams. Raw events from each IoT device are aggregated based on their event time (the timestamp written on the event by the source device) and the results of each window is emitted based on processing time (the current system time).

This fine-grained control finally allowed PostNL to reproduce exactly the behavior expected by the downstream applications.

The journey to production readiness

Let’s explore the journey of migrating to Managed Service for Apache Flink, from the start of the project to the rollout to production.

Identifying requirements

The first step of the migration process focused on thoroughly understanding the existing system’s architecture and performance metrics. The goal was to provide a seamless transition to Managed Service for Apache Flink with minimal disruption to ongoing operations.

Understanding Apache Flink

PostNL needed to familiarize themselves with the Managed Service for Apache Flink application and its streaming processing capabilities, including built-in windowing strategies, aggregation functions, event time vs. processing time differences, and finally KeyProcessFunction and mechanisms for handling late events.

Different options were considered, using primitives provided by Apache Flink out of the box, for event time logic and late events. The biggest requirement was to reproduce exactly the behavior of the legacy application. The ability to switch to using a lower level of abstraction helped. Using the finest-grained control allowed by the ProcessFunction API, PostNL was able to handle late events exactly as the legacy application.

Designing and implementing ProcessFunction

The business logic is designed using ProcessFunction to emulate the peculiar behavior of the legacy application in handling late events without excessively delaying the initial results. PostNL decided to use Java for the implementation, because Java is the primary language for Apache Flink. Apache Flink allows you to develop and test your application locally, in your preferred integrated development environment (IDE), using all the available debug tools, before deploying it to Managed Service for Apache Flink. Java 11 with Maven compiler was used for implementation. For more information about IDE requirements, refer to Getting started with Amazon Managed Service for Apache Flink (DataStream API).

Testing and validation

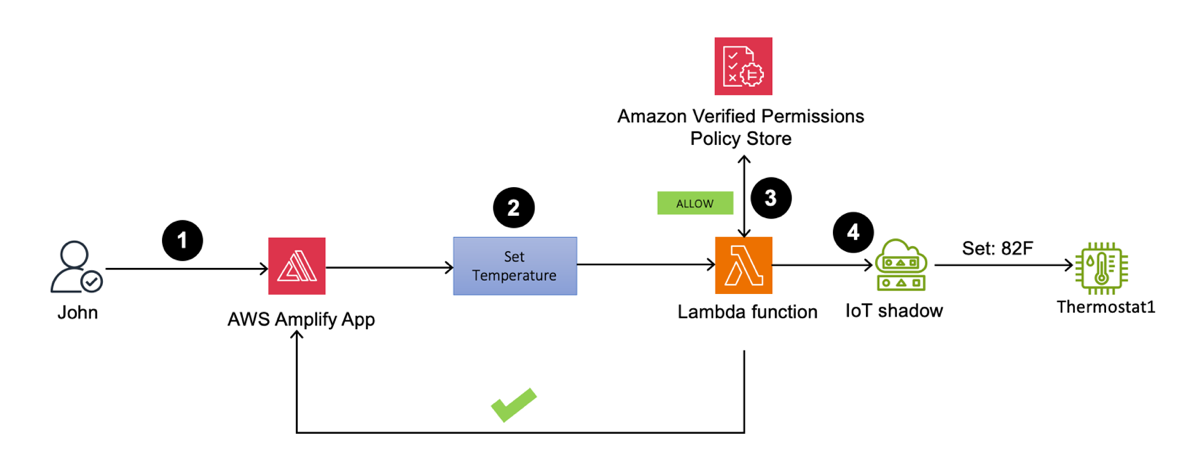
The following diagram shows the architecture used to validate the new application.

Testing architecture

To validate the behavior of the ProcessFunction and late event handling mechanisms, integration tests were designed to run both the legacy application and the Managed Service for Flink application in parallel (Steps 3 and 4). This parallel execution allowed PostNL to directly compare the results generated by each application under identical conditions. Multiple integration test cases push data to the source stream (2) in parallel (7) and wait until their aggregation window is complete, then they pull the aggregated results from the destination stream to compare (8). Integration tests are automatically triggered by the CI/CD pipeline after deployment of the infrastructure is complete. During the integration tests, the primary focus was on achieving data consistency and processing accuracy between the legacy application and the Managed Service for Flink application. The output streams, aggregated data, and processing latencies were compared to validate that the migration didn’t introduce any unexpected discrepancies. For writing and running the integration tests, Robot Framework, an open source automation framework, was utilized.

After the integration tests are passed, there is one more validation layer: end-to-end tests. Similar to the integration tests, end-to-end tests are automatically invoked by the CI/CD pipeline after the deployment of the platform infrastructure is complete. This time, multiple end-to-end test cases send data to AWS IoT Core (1) in parallel (9) and check the aggregated results from the destination S3 bucket (5, 6) dumped from the output stream to compare (10).

Deployment

PostNL decided to run the new Flink application on shadow mode. The new application ran for some time in parallel with the legacy application, consuming exactly the same inputs, and sending output from both applications to a data lake on Amazon S3. This allowed them to compare the results of the two applications using real production data, and also to test the stability and performance of the new one.

Performance optimization

During migration, the PostNL IoT platform team learned how the Flink application can be fine-tuned for optimal performance, considering factors such as data volume, processing speed, and efficient late event handling. A particularly interesting aspect was to verify that the state size wasn’t increasing unbounded over the long term. A risk of using the finest-grained control of ProcessFunction is state leak. This happens when your implementation, directly controlling the state in the ProcessFunction, misses some corner cases where a state is never deleted. This causes the state to grow unbounded. Because streaming applications are designed to run continuously, an expanding state can degrade performance and eventually exhaust memory or local disk space.

With this phase of testing, PostNL found the right balance of application parallelism and resources—including compute, memory, and storage—to process the normal daily workload profile without lag, and handle occasional peaks without over-provisioning, optimizing both performance and cost-effectiveness.

Final switch

After running the new application in shadow mode for some time, the team decided the application was stable and emitting the expected output. The PostNL IoT platform finally switched over to production and shut down the legacy application.

Key takeaways

Among the several learnings gathered in the journey of adopting Managed Service for Apache Flink, some are particularly important, and proving key when expanding to new and diverse use cases:

  • Understand event time semantics – A deep understanding of event time semantics is crucial in Apache Flink for accurately implementing time-dependent data operations. This knowledge makes sure events are processed correctly relative to when they actually occurred.
  • Use the powerful Apache Flink API – Apache Flink’s API allows for the creation of complex, stateful streaming applications beyond basic windowing and aggregations. It’s important to fully grasp the extensive capabilities offered by the API to tackle sophisticated data processing challenges.
  • With power comes more responsibility – The advanced functionality of Apache Flink’s API brings significant responsibility. Developers must make sure applications are efficient, maintainable, and stable, requiring careful resource management and adherence to best practices in coding and system design.
  • Don’t mix event time and processing time logic – Combining event time and processing time for data aggregation presents unique challenges. It prevents you from using higher-level functionalities provided out of the box by Apache Flink. The lowest level of abstractions among Apache Flink APIs allow for implementing custom time-based logic, but require a careful design to achieve accuracy and timely results, alongside extensive testing to validate good performance.

Conclusion

In the journey of adopting Apache Flink, the PostNL team learned how the powerful Apache Flink APIs allow you to implement complex business logic. The team came to appreciate how Apache Flink can be utilized to solve several and diverse problems, and they are now planning to extend it to more stream processing use cases.

With Managed Service for Apache Flink, the team was able to focus on the business value and implementing the required business logic, without worrying about the heavy lifting of setting up and managing an Apache Flink cluster.

To learn more about Managed Service for Apache Flink and choosing the right managed service option and API for your use case, see What is Amazon Managed Service for Apache Flink. To experience hands-on how to develop, deploy, and operate Apache Flink applications on AWS, see the Amazon Managed Service for Apache Flink Workshop.


About the Authors

Çağrı ÇakırÇağrı Çakır is the Lead Software Engineer for the PostNL IoT platform, where he manages the architecture that processes billions of events each day. As an AWS Certified Solutions Architect Professional, he specializes in designing and implementing event-driven architectures and stream processing solutions at scale. He is passionate about harnessing the power of real-time data, and dedicated to optimizing operational efficiency and innovating scalable systems.

Ozge KavalciÖzge Kavalcı works as Senior Solution Engineer for the PostNL IoT platform and loves to build cutting-edge solutions that integrate with the IoT landscape. As an AWS Certified Solutions Architect, she specializes in designing and implementing highly scalable serverless architectures and real-time stream processing solutions that can handle unpredictable workloads. To unlock the full potential of real-time data, she is dedicated to shaping the future of IoT integration.

Amit SinghAmit Singh works as a Senior Solutions Architect at AWS with enterprise customers on the value proposition of AWS, and participates in deep architectural discussions to make sure solutions are designed for successful deployment in the cloud. This includes building deep relationships with senior technical individuals to enable them to be cloud advocates. In his free time, he likes to spend time with his family and learn more about everything cloud.

Lorenzo NicoraLorenzo Nicora works as Senior Streaming Solutions Architect at AWS helping customers across EMEA. He has been building cloud-centered, data-intensive systems for several years, working in the finance industry both through consultancies and for fintech product companies. He has used open-source technologies extensively and contributed to several projects, including Apache Flink.

The UK Bans Default Passwords

Post Syndicated from Bruce Schneier original https://www.schneier.com/blog/archives/2024/05/the-uk-bans-default-passwords.html

The UK is the first country to ban default passwords on IoT devices.

On Monday, the United Kingdom became the first country in the world to ban default guessable usernames and passwords from these IoT devices. Unique passwords installed by default are still permitted.

The Product Security and Telecommunications Infrastructure Act 2022 (PSTI) introduces new minimum-security standards for manufacturers, and demands that these companies are open with consumers about how long their products will receive security updates for.

The UK may be the first country, but as far as I know, California is the first jurisdiction. It banned default passwords in 2018, the law taking effect in 2020.

This sort of thing benefits all of us everywhere. IoT manufacturers aren’t making two devices, one for California and one for the rest of the US. And they’re not going to make one for the UK and another for the rest of Europe, either. They’ll remove the default passwords and sell those devices everywhere.

Another news article.

Using Amazon Verified Permissions to manage authorization for AWS IoT smart home applications

Post Syndicated from Rajat Mathur original https://aws.amazon.com/blogs/security/using-amazon-verified-permissions-to-manage-authorization-for-aws-iot-smart-thermostat-applications/

This blog post introduces how manufacturers and smart appliance consumers can use Amazon Verified Permissions to centrally manage permissions and fine-grained authorizations. Developers can offer more intuitive, user-friendly experiences by designing interfaces that align with user personas and multi-tenancy authorization strategies, which can lead to higher user satisfaction and adoption. Traditionally, implementing authorization logic using role based access control (RBAC) or attribute based access control (ABAC) within IoT applications can become complex as the number of connected devices and associated user roles grows. This often leads to an unmanageable increase in access rules that must be hard-coded into each application, requiring excessive compute power for evaluation. By using Verified Permissions, you can externalize the authorization logic using Cedar policy language, enabling you to define fine-grained permissions that combine RBAC and ABAC models. This decouples permissions from your application’s business logic, providing a centralized and scalable way to manage authorization while reducing development effort.

In this post, we walk you through a reference architecture that outlines an end-to-end smart thermostat application solution using AWS IoT Core, Verified Permissions, and other AWS services. We show you how to use Verified Permissions to build an authorization solution using Cedar policy language to define dynamic policy-based access controls for different user personas. The post includes a link to a GitHub repository that houses the code for the web dashboard and the Verified Permissions logic to control access to the solution APIs.

Solution overview

This solution consists of a smart thermostat IoT device and an AWS hosted web application using Verified Permissions for fine-grained access to various application APIs. For this use case, the AWS IoT Core device is being simulated by an AWS Cloud9 environment and communicates with the IoT service using AWS IoT Device SDK for Python. After being configured, the device connects to AWS IoT Core to receive commands and send messages to various MQTT topics.

As a general practice, when a user-facing IoT solution is implemented, the manufacturer performs administrative tasks such as:

  1. Embedding AWS Private Certificate Authority certificates into each IoT device (in this case a smart thermostat). Usually this is done on the assembly line and the certificates used to verify the IoT endpoints are burned into device memory along with the firmware.
  2. Creating an Amazon Cognito user pool that provides sign-up and sign-in options for web and mobile application users and hosts the authentication process.
  3. Creating policy stores and policy templates in Verified Permissions. Based on who signs up, the manufacturer creates policies with Verified Permissions to link each signed-up user to certain allowed resources or IoT devices.
  4. The mapping of user to device is stored in a datastore. For this solution, you’ll use an Amazon DynamoDB table to record the relationship.

The user who purchases the device (the primary device owner) performs the following tasks:

  1. Signs up on the manufacturer’s web application or mobile app and registers the IoT device by entering a unique serial number. The mapping between user details and the device serial number is stored in the datastore through an automated process that is initiated after sign-up and device claim.
  2. Connects the new device to an existing wireless network, which initiates a registration process to securely connect to AWS IoT Core services within the manufacturer’s account.
  3. Invites other users (such as guests, family members, or the power company) through a referral, invitation link, or a designated OAuth process.
  4. Assign roles to the other users and therefore permissions.
     
Figure 1: Sample smart home application architecture built using AWS services

Figure 1: Sample smart home application architecture built using AWS services

Figure 1 depicts the solution as three logical components:

  1. The first component depicts device operations through AWS IoT Core. The smart thermostat is on site and it communicates with AWS IoT Core and its state is managed through the AWS IoT Device Shadow Service.
  2. The second component depicts the web application, which is the application interface that customers use. It’s a ReactJS-backed single page application deployed using AWS Amplify.
  3. The third component shows the backend application, which is built using Amazon API Gateway, AWS Lambda, and DynamoDB. A Cognito user pool is used to manage application users and their authentication. Authorization is handled by Verified Permissions where you create and manage policies that are evaluated when the web application calls backend APIs. These policies are evaluated against each authorization policy to provide an access decision to deny or allow an action.

The solution flow itself can be broken down into three steps after the device is onboarded and users have signed up:

  1. The smart thermostat device connects and communicates with AWS IoT Core using the MQTT protocol. A classic Device Shadow is created for the AWS IoT thing Thermostat1 when the UpdateThingShadow call is made the first time through the AWS SDK for a new device. AWS IoT Device Shadow service lets the web application query and update the device’s state in case of connectivity issues.
  2. Users sign up or sign in to the Amplify hosted smart home application and authenticate themselves against a Cognito user pool. They’re mapped to a device, which is stored in a DynamoDB table.
  3. After the users sign in, they’re allowed to perform certain tasks and view certain sections of the dashboard based on the different roles and policies managed by Verified Permissions. The underlying Lambda function that’s responsible for handling the API calls queries the DynamoDB table to provide user context to Verified Permissions.

Prerequisites

  1. To deploy this solution, you need access to the AWS Management Console and AWS Command Line Interface (AWS CLI) on your local machine with sufficient permissions to access required services, including Amplify, Verified Permissions, and AWS IoT Core. For this solution, you’ll give the services full access to interact with different underlying services. But in production, we recommend following security best practices with AWS Identity and Access Management (IAM), which involves scoping down policies.
  2. Set up Amplify CLI by following these instructions. We recommend the latest NodeJS stable long-term support (LTS) version. At the time of publishing this post, the LTS version was v20.11.1. Users can manage multiple NodeJS versions on their machines by using a tool such as Node Version Manager (nvm).

Walkthrough

The following table describes the actions, resources, and authorization decisions that will be enforced through Verified Permissions policies to achieve fine-grained access control. In this example, John is the primary device owner and has purchased and provisioned a new smart thermostat device called Thermostat1. He has invited Jane to access his device and has given her restricted permissions. John has full control over the device whereas Jane is only allowed to read the temperature and set the temperature between 72°F and 78°F.

John has also decided to give his local energy provider (Power Company) access to the device so that they can set the optimum temperature during the day to manage grid load and offer him maximum savings on his energy bill. However, they can only do so between 2:00 PM and 5:00 PM.

For security purposes the verified permissions default decision is DENY for unauthorized principals.

Name Principal Action Resource Authorization decision
Any Default Default Default Deny
John john_doe Any Thermostat1 Allow
Jane jane_doe GetTemperature Thermostat1 Allow
Jane jane_doe SetTemperature Thermostat1 Allow only if desired temperature is between 72°F and 78°F.
Power Company powercompany GetTemperature Thermostat1 Allow only if accessed between the hours of 2:00 PM and 5:00 PM
Power Company powercompany SetTemperature Thermostat1 Allow only if the temperature is set between the hours of 2:00 PM and 5:00 PM

Create a Verified Permissions policy store

Verified Permissions is a scalable permissions management and fine-grained authorization service for the applications that you build. The policies are created using Cedar, a dedicated language for defining access permissions in applications. Cedar seamlessly integrates with popular authorization models such as RBAC and ABAC.

A policy is a statement that either permits or forbids a principal to take one or more actions on a resource. A policy store is a logical container that stores your Cedar policies, schema, and principal sources. A schema helps you to validate your policy and identify errors based on the definitions you specify. See Cedar schema to learn about the structure and formal grammar of a Cedar schema.

To create the policy store

  1. Sign in to the Amazon Verified Permissions console and choose Create policy store.
  2. In the Configuration Method section, select Empty Policy Store and choose Create policy store.
     
Figure 2: Create an empty policy store

Figure 2: Create an empty policy store

Note: Make a note of the policy store ID to use when you deploy the solution.

To create a schema for the application

  1. On the Verified Permissions page, select Schema.
  2. In the Schema section, choose Create schema.
     
    Figure 3: Create a schema

    Figure 3: Create a schema

  3. In the Edit schema section, choose JSON mode, paste the following sample schema for your application, and choose Save changes.
    {
        "AwsIotAvpWebApp": {
            "entityTypes": {
                "Device": {
                    "shape": {
                        "attributes": {
                            "primaryOwner": {
                                "name": "User",
                                "required": true,
                                "type": "Entity"
                            }
                        },
                        "type": "Record"
                    },
                    "memberOfTypes": []
                },
                "User": {}
            },
            "actions": {
                "GetTemperature": {
                    "appliesTo": {
                        "context": {
                            "attributes": {
                                "desiredTemperature": {
                                    "type": "Long"
                                },
                                "time": {
                                    "type": "Long"
                                }
                            },
                            "type": "Record"
                        },
                        "resourceTypes": [
                            "Device"
                        ],
                        "principalTypes": [
                            "User"
                        ]
                    }
                },
                "SetTemperature": {
                    "appliesTo": {
                        "resourceTypes": [
                            "Device"
                        ],
                        "principalTypes": [
                            "User"
                        ],
                        "context": {
                            "attributes": {
                                "desiredTemperature": {
                                    "type": "Long"
                                },
                                "time": {
                                    "type": "Long"
                                }
                            },
                            "type": "Record"
                        }
                    }
                }
            }
        }
    }

When creating policies in Cedar, you can define authorization rules using a static policy or a template-linked policy.

Static policies

In scenarios where a policy explicitly defines both the principal and the resource, the policy is categorized as a static policy. These policies are immediately applicable for authorization decisions, as they are fully defined and ready for implementation.

Template-linked policies

On the other hand, there are situations where a single set of authorization rules needs to be applied across a variety of principals and resources. Consider an IoT application where actions such as SetTemperature and GetTemperature must be permitted for specific devices. Using static policies for each unique combination of principal and resource can lead to an excessive number of almost identical policies, differing only in their principal and resource components. This redundancy can be efficiently addressed with policy templates. Policy templates allow for the creation of policies using placeholders for the principal, the resource, or both. After a policy template is established, individual policies can be generated by referencing this template and specifying the desired principal and resource. These template-linked policies function the same as static policies, offering a streamlined and scalable solution for policy management.

To create a policy that allows access to the primary owner of the device using a static policy

  1. In the Verified Permissions console, on the left pane, select Policies, then choose Create policy and select Create static policy from the drop-down menu.
     
    Figure 4: Create static policy

    Figure 4: Create static policy

  2. Define the policy scope:
    1. Select Permit for the Policy effect.
       
      Figure 5: Define policy effect

      Figure 5: Define policy effect

    2. Select All Principals for Principals scope.
    3. Select All Resources for Resource scope.
    4. Select All Actions for Actions scope and choose Next.
       
      Figure 6: Define policy scope

      Figure 6: Define policy scope

  3. On the Details page, under Policy, paste the following full-access policy, which grants the primary owner permission to perform both SetTemperature and GetTemperature actions on the smart thermostat unconditionally. Choose Create policy.
    	permit (principal, action, resource)
    	when { resource.primaryOwner == principal };
    Figure 7: Write and review policy statement

    Figure 7: Write and review policy statement

To create a static policy to allow a guest user to read the temperature

In this example, the guest user is Jane (username: jane_doe).

  1. Create another static policy and specify the policy scope.
    1. Select Permit for the Policy effect.
       
      Figure 8: Define the policy effect

      Figure 8: Define the policy effect

    2. Select Specific principal for the Principals scope.
    3. Select AwsIotAvpWebApp::User and enter jane_doe.
       
      Figure 9: Define the policy scope

      Figure 9: Define the policy scope

    4. Select Specific resource for the Resources scope.
    5. Select AwsIotAvpWebApp::Device and enter Thermostat1.
    6. Select Specific set of actions for the Actions scope.
    7. Select GetTemperature and choose Next.
       
      Figure 10: Define resource and action scopes

      Figure 10: Define resource and action scopes

    8. Enter the Policy description: Allow jane_doe to read thermostat1.
    9. Choose Create policy.

Next, you will create reusable policy templates to manage policies efficiently. To create a policy template for a guest user with restricted temperature settings that limit the temperature range they can set to between 72°F and 78°F. In this case, the guest user is going to be Jane (username: jane_doe)

To create a reusable policy template

  1. Select Policy template and enter Guest user template as the description.
  2. Paste the following sample policy in the Policy body and choose Create policy template.
    permit (
        principal == ?principal,
        action in [AwsIotAvpWebApp::Action::"SetTemperature"],
        resource == ?resource
    )
    when { context.desiredTemperature >= 72 && context.desiredTemperature <= 78 };
Figure 11: Create guest user policy template

Figure 11: Create guest user policy template

As you can see, you don’t specify the principal and resource yet. You enter those when you create an actual policy from the policy template. The context object will be populated with the desiredTemperature property in the application and used to evaluate the decision.

You also need to create a policy template for the Power Company user with restricted time settings. Cedar policies don’t support date/time format, so you must represent 2:00 PM and 5:00 PM as elapsed minutes from midnight.

To create a policy template for the power company

  1. Select Policy template and enter Power company user template as the description.
  2. Paste the following sample policy in the Policy body and choose Create policy template.
    permit (
        principal == ?principal,
        action in [AwsIotAvpWebApp::Action::"SetTemperature", AwsIotAvpWebApp::Action::"GetTemperature"],
        resource == ?resource
    )
    when { context.time >= 840 && context.time < 1020 };

The policy templates accept the user and resource. The next step is to create a template-linked policy for Jane to set and get thermostat readings based on the Guest user template that you created earlier. For simplicity, you will manually create this policy using the Verified Permissions console. In production, application policies can be dynamically created using the Verified Permissions API.

To create a template-linked policy for a guest user

  1. In the Verified Permissions console, on the left pane, select Policies, then choose Create policy and select Create template-linked policy from the drop-down menu.
     
    Figure 12: Create new template-linked policy

    Figure 12: Create new template-linked policy

  2. Select the Guest user template and choose next.
     
    Figure 13: Select Guest user template

    Figure 13: Select Guest user template

  3. Under parameter selection:
    1. For Principal enter AwsIotAvpWebApp::User::”jane_doe”.
    2. For Resource enter AwsIotAvpWebApp::Device::”Thermostat1″.
    3. Choose Create template-linked policy.
       
      Figure 14: Create guest user template-linked policy

      Figure 14: Create guest user template-linked policy

Note that with this policy in place, jane_doe can only set the temperature of the device Thermostat1 to between 72°F and 78°F.

To create a template-linked policy for the power company user

Based on the template that was set up for power company, you now need an actual policy for it.

  1. In the Verified Permissions console, go to the left pane and select Policies, then choose Create policy and select Create template-linked policy from the drop-down menu.
  2. Select the Power company user template and choose next.
  3. Under Parameter selection, for Principal enter AwsIotAvpWebApp::User::”powercompany”, and for Resource enter AwsIotAvpWebApp::Device::”Thermostat1″, and choose Create template-linked policy.

Now that you have a set of policies in a policy store, you need to update the backend codebase to include this information and then deploy the web application using Amplify.

The policy statements in this post intentionally use human-readable values such as jane_doe and powercompany for the principal entity. This is useful when discussing general concepts but in production systems, customers should use unique and immutable values for entities. See Get the best out of Amazon Verified Permissions by using fine-grained authorization methods for more information.

Deploy the solution code from GitHub

Go to the GitHub repository to set up the Amplify web application. The repository Readme file provides detailed instructions on how to set up the web application. You will need your Verified Permissions policy store ID to deploy the application. For convenience, we’ve provided an onboarding script—deploy.sh—which you can use to deploy the application.

To deploy the application

  1. Close the repository.
    git clone https://github.com/aws-samples/amazon-verified-permissions-iot-
    amplify-smart-home-application.git

  2. Deploy the application.
    ./deploy.sh <region> <Verified Permissions Policy Store ID>

After the web dashboard has been deployed, you’ll create an IoT device using AWS IoT Core.

Create an IoT device and connect it to AWS IoT Core

With the users, policies, and templates, and the Amplify smart home application in place, you can now create a device and connect it to AWS IoT Core to complete the solution.

To create Thermostat1” device and connect it to AWS IoT Core

  1. From the left pane in the AWS IoT console, select Connect one device.
     
    Figure 15: Connect device using AWS IoT console

    Figure 15: Connect device using AWS IoT console

  2. Review how IoT Thing works and then choose Next.
     
    Figure 16: Review how IoT Thing works before proceeding

    Figure 16: Review how IoT Thing works before proceeding

  3. Choose Create a new thing and enter Thermostat1 as the Thing name and choose next.
    &bsp;
    Figure 17: Create the new IoT thing

    Figure 17: Create the new IoT thing

  4. Select Linux/macOS as the Device platform operating system and Python as the AWS IoT Core Device SDK and choose next.
     
    Figure 18: Choose the platform and SDK for the device

    Figure 18: Choose the platform and SDK for the device

  5. Choose Download connection kit and choose next.
     
    Figure 19: Download the connection kit to use for creating the Thermostat1 device

    Figure 19: Download the connection kit to use for creating the Thermostat1 device

  6. Review the three steps to display messages from your IoT device. You will use them to verify the thermostat1 IoT device connectivity to the AWS IoT Core platform. They are:
    1. Step 1: Add execution permissions
    2. Step 2: Run the start script
    3. Step 3: Return to the AWS IoT Console to view the device’s message
       
      Figure 20: How to display messages from an IoT device

      Figure 20: How to display messages from an IoT device

Solution validation

With all of the pieces in place, you can now test the solution.

Primary owner signs in to the web application to set Thermostat1 temperature to 82°F

Figure 21: Thermostat1 temperature update by John

Figure 21: Thermostat1 temperature update by John

  1. Sign in to the Amplify web application as John. You should be able to view the Thermostat1 controller on the dashboard.
  2. Set the temperature to 82°F.
  3. The Lambda function processes the request and performs an API call to Verified Permissions to determine whether to ALLOW or DENY the action based on the policies. Verified Permissions sends back an ALLOW, as the policy that was previously set up allows unrestricted access for primary owners.
  4. Upon receiving the response from Verified Permissions, the Lambda function sends ALLOW permission back to the web application and an API call to the AWS IoT Device Shadow service to update the device (Thermostat1) temperature to 82°F.
     
Figure 22: Policy evaluation decision is ALLOW when a primary owner calls SetTemperature

Figure 22: Policy evaluation decision is ALLOW when a primary owner calls SetTemperature

Guest user signs in to the web application to set Thermostat1 temperature to 80°F

Figure 23: Thermostat1 temperature update by Jane

Figure 23: Thermostat1 temperature update by Jane

  1. If you sign in as Jane to the Amplify web application, you can view the Thermostat1 controller on the dashboard.
  2. Set the temperature to 80°F.
  3. The Lambda function validates the actions by sending an API call to Verified Permissions to determine whether to ALLOW or DENY the action based on the established policies. Verified Permissions sends back a DENY, as the policy only permits temperature adjustments between 72°F and 78°F.
  4. Upon receiving the response from Verified Permissions, the Lambda function sends DENY permissions back to the web application and an unauthorized response is returned.
     
    Figure 24: Guest user jane_doe receives a DENY when calling SetTemperature for a desired temperature of 80°F

    Figure 24: Guest user jane_doe receives a DENY when calling SetTemperature for a desired temperature of 80°F

  5. If you repeat the process (still as Jane) but set Thermostat1 to 75°F, the policy will cause the request to be allowed.
     
    Figure 25: Guest user jane_doe receives an ALLOW when calling SetTemperature for a desired temperature of 75°F

    Figure 25: Guest user jane_doe receives an ALLOW when calling SetTemperature for a desired temperature of 75°F

  6. Similarly, jane_doe is allowed run GetTemperature on the device Thermostat1. When the temperature is set to 74°F, the device shadow is updated. The IoT device being simulated by your AWS Cloud9 instance reads desired the temperature field and sets the reported value to 74.
  7. Now, when jane_doe runs GetTemperature, the value of the device is reported as 74 as shown in Figure 26. We encourage you to try different restrictions in the World Settings (outside temperature and time) by adding restrictions to the static policy that allows GetTemperature for guest user.
     
    Figure 26: Guest user jane_doe receives an ALLOW when calling GetTemperature for the reported temperature

    Figure 26: Guest user jane_doe receives an ALLOW when calling GetTemperature for the reported temperature

Power company signs in to the web application to set Thermostat1 to 78°F at 3.30 PM

Figure 27: Thermostat1 temperature set to 78°F by powercompany user at a specified time

Figure 27: Thermostat1 temperature set to 78°F by powercompany user at a specified time

  1. Sign in as the powercompany user to the Amplify web application using an API. You can view the Thermostat1 controller on the dashboard.
  2. To test this scenario, set the current time to 3:30 PM, and try to set the temperature to 78°F.
  3. The Lambda function validates the actions by sending an API call to Verified Permissions to determine whether to ALLOW or DENY the action based on pre-established policies. Verified Permissions returns ALLOW permission, because the policy for powercompany permits device temperature changes between 2:00 PM and 5:00 PM.
  4. Upon receiving the response from Verified Permissions, the Lambda function sends ALLOW permission back to the web application and an API call to the AWS IoT Device Shadow service to update the Thermostat1 temperature to 78°F.
     
    Figure 28: powercompany receives an ALLOW when SetTemperature is called with the desired temperature of 78°F

    Figure 28: powercompany receives an ALLOW when SetTemperature is called with the desired temperature of 78°F

Note: As an optional exercise, we also made jane_doe a device owner for device Thermostat2. This can be observed in the users.json file in the Github repository. We encourage you to create your own policies and restrict functions for Thermostat2 after going through this post. You will need to create separate Verified Permissions policies and update the Lambda functions to interact with these policies.

We encourage you to create policies for guests and the power company and restrict permissions based on the following criteria:

  1. Verify Jane Doe can perform GetTemperature and SetTemperature actions on Thermostat2.
  2. John Doe should not be able to set the temperature on device Thermostat2 outside of the time range of 4:00 PM and 6:00 PM and outside of the temperature range of 68°F and 72°F.
  3. Power Company can only perform the GetTemperature operation, but there are no restrictions on time and outside temperature.

To help you verify the solution, we’ve provided the correct policies under the challenge directory in the GitHub repository.

Clean up

Deploying the Thermostat application in your AWS account will incur costs. To avoid ongoing charges, when you’re done examining the solution, delete the resources that were created. This includes the Amplify hosted web application, API Gateway resource, AWS Cloud 9 environment, the Lambda function, DynamoDB table, Cognito user pool, AWS IoT Core resources, and Verified Permissions policy store.

Amplify resources can be deleted by going to the AWS CloudFormation console and deleting the stacks that were used to provision various services.

Conclusion

In this post, you learned about creating and managing fine-grained permissions using Verified Permissions for different user personas for your smart thermostat IoT device. With Verified Permissions, you can strengthen your security posture and build smart applications aligned with Zero Trust principles for real-time authorization decisions. To learn more, we recommend:

 
If you have feedback about this post, submit comments in the Comments section below. If you have questions about this post, contact AWS Support.

Author

Rajat Mathur

Rajat is a Principal Solutions Architect at Amazon Web Services. Rajat is a passionate technologist who enjoys building innovative solutions for AWS customers. His core areas of focus are IoT, Networking, and Serverless computing. In his spare time, Rajat enjoys long drives, traveling, and spending time with family.

Pronoy Chopra

Pronoy Chopra

Pronoy is a Senior Solutions Architect with the Startups Generative AI team at AWS. He specializes in architecting and developing IoT and Machine Learning solutions. He has co-founded two startups and enjoys being hands-on with projects in the IoT, AI/ML and Serverless domain. His work in Magnetoencephalography has been cited many times in the effort to build better brain-compute interfaces.

Syed Sanoor

Syed Sanoor

Syed serves as a Solutions Architect, assisting customers in the enterprise sector. With a foundation in software engineering, he takes pleasure in crafting solutions tailored to client needs. His expertise predominantly lies in C# and IoT. During his leisure time, Syed enjoys piloting drones and playing cricket.

Serverless IoT email capture, attachment processing, and distribution

Post Syndicated from Stacy Conant original https://aws.amazon.com/blogs/messaging-and-targeting/serverless-iot-email-capture-attachment-processing-and-distribution/

Many customers need to automate email notifications to a broad and diverse set of email recipients, sometimes from a sensor network with a variety of monitoring capabilities. Many sensor monitoring software products include an SMTP client to achieve this goal. However, managing email server infrastructure requires specialty expertise and operating an email server comes with additional cost and inherent risk of breach, spam, and storage management. Organizations also need to manage distribution of attachments, which could be large and potentially contain exploits or viruses. For IoT use cases, diagnostic data relevance quickly expires, necessitating retention policies to regularly delete content.

Solution Overview

This solution uses the Amazon Simple Email Service (SES) SMTP interface to receive SMTP client messages, and processes the message to replace an attachment with a pre-signed URL in the resulting email to its intended recipients. Attachments are stored separately in an Amazon Simple Storage Service (S3) bucket with a lifecycle policy implemented. This reduces the storage requirements of recipient email server receiving notification emails. Additionally, this solution leverages built-in anti-spam and security scanning capabilities to deal with spam and potentially malicious attachments while at the same time providing the mechanism by which pre-signed attachment links can be revoked should the emails be distributed to unintended recipients.

The solution uses:

  • Amazon SES SMTP interface to receive incoming emails.
  • Amazon SES receipt rule on a (sub)domain controlled by administrators, to store raw incoming emails in an Amazon S3 bucket.
  • AWS Lambda function, triggered on S3 ObjectCreated event, to process raw emails, extract attachments, replace each with pre-signed URL with configurable expiry, and send the processed emails to intended recipients.

Solution Flow Details:

  1. SMTP client transmits email content to an email address in a (sub) domain with MX record set to Amazon SES service’s regional endpoint.
  2. Amazon SES SMTP interface receives an email and forwards it to SES Receipt Rule(s) for processing.
  3. A matching Amazon SES Receipt Rule saves incoming email into an Amazon S3 Bucket.
  4. Amazon S3 Bucket emits an S3 ObjectCreated Event, and places the event onto the Amazon Simple Queue Services (SQS) queue.
  5. The AWS Lambda service polls the inbound messages’ SQS queue and feeds events to the Lambda function.
  6. The Lambda function, retrieves email files from the S3 bucket, parses the email sender/subject/body, saves attachments to a separate attachment S3 bucket (7), and replaces attachments with pre-signed URLs in the email body. The Lambda function then extracts intended recipient addresses from the email body. If the body contains properly formatted recipients list, email is then sent using SES API (9), otherwise a notice is posted to a fallback Amazon Simple Notification Service (SNS) Topic (8).
  7. The Lambda function saves extracted attachments, if any, into an attachments bucket.
  8. Malformed email notifications are posted to a fallback Amazon SNS Topic.
  9. The Lambda function invokes Amazon SES API to send the processed email to all intended recipient addresses.
  10. If the Lambda function is unable to process email successfully, the inbound message is placed on to the SQS dead-letter queue (DLQ) queue for later intervention by the operator.
  11. SES delivers an email to each recipients’ mail server.
  12. Intended recipients download emails from their corporate mail servers and retrieve attachments from the S3 pre-signed URL(s) embedded in the email body.
  13. An alarm is triggered and a notification is published to Amazon SNS Alarms Topic whenever:
    • More than 50 failed messages are in the DLQ.
    • Oldest message on incoming SQS queue is older than 3 minutes – unable to keep up with inbound messages (flooding).
    • The incoming SQS queue contains over 180 messages (configurable) over 5 minutes old.

Setting up Amazon SES

For this solution you will need an email account where you can receive emails. You’ll also need a (sub)domain for which you control the mail exchanger (MX) record. You can obtain your (sub)domain either from Amazon Route53 or another domain hosting provider.

Verify the sender email address

You’ll need to follow the instructions to Verify an email address for all identities that you use as “From”, “Source”, ” Sender”, or “Return-Path” addresses. You’ll also need to follow these instructions for any identities you wish to send emails to during initial testing while your SES account is in the “Sandbox” (see next “Moving out of the SES Sandbox” section).

Moving out of the SES Sandbox

Amazon SES accounts are “in the Sandbox” by default, limiting email sending only to verified identities. AWS does this to prevent fraud and abuse as well as protecting your reputation as an email sender. When your account leaves the Sandbox, SES can send email to any recipient, regardless of whether the recipient’s address or domain is verified by SES. However, you still have to verify all identities that you use as “From”, “Source”, “Sender”, or “Return-Path” addresses.
Follow the Moving out of the SES Sandbox instructions in the SES Developer Guide. Approval is usually within 24 hours.

Set up the SES SMTP interface

Follow the workshop lab instructions to set up email sending from your SMTP client using the SES SMTP interface. Once you’ve completed this step, your SMTP client can open authenticated sessions with the SES SMTP interface and send emails. The workshop will guide you through the following steps:

  1. Create SMTP credentials for your SES account.
    • IMPORTANT: Never share SMTP credentials with unauthorized individuals. Anyone with these credentials can send as many SMTP requests and in whatever format/content they choose. This may result in end-users receiving emails with malicious content, administrative/operations overload, and unbounded AWS charges.
  2. Test your connection to ensure you can send emails.
  3. Authenticate using the SMTP credentials generated in step 1 and then send a test email from an SMTP client.

Verify your email domain and bounce notifications with Amazon SES

In order to replace email attachments with a pre-signed URL and other application logic, you’ll need to set up SES to receive emails on a domain or subdomain you control.

  1. Verify the domain that you want to use for receiving emails.
  2. Publish a mail exchanger record (MX record) and include the Amazon SES inbound receiving endpoint for your AWS region ( e.g. inbound-smtp.us-east-1.amazonaws.com for US East Northern Virginia) in the domain DNS configuration.
  3. Amazon SES automatically manages the bounce notifications whenever recipient email is not deliverable. Follow the Set up notifications for bounces and complaints guide to setup bounce notifications.

Deploying the solution

The solution is implemented using AWS CDK with Python. First clone the solution repository to your local machine or Cloud9 development environment. Then deploy the solution by entering the following commands into your terminal:

python -m venv .venv
. ./venv/bin/activate
pip install -r requirements.txt

cdk deploy \
--context SenderEmail=<verified sender email> \
 --context RecipientEmail=<recipient email address> \
 --context ConfigurationSetName=<configuration set name>

Note:

The RecipientEmail CDK context parameter in the cdk deploy command above can be any email address in the domain you verified as part of the Verify the domain step. In other words, if the verified domain is acme-corp.com, then the emails can be [email protected], [email protected], etc.

The ConfigurationSetName CDK context can be obtained by navigating to Identities in Amazon SES console, selecting the verified domain (same as above), switching to “Configuration set” tab and selecting name of the “Default configuration set”

After deploying the solution, please, navigate to Amazon SES Email receiving in AWS console, edit the rule set and set it to Active.

Testing the solution end-to-end

Create a small file and generate a base64 encoding so that you can attach it to an SMTP message:

echo content >> demo.txt
cat demo.txt | base64 > demo64.txt
cat demo64.txt

Install openssl (which includes an SMTP client capability) using the following command:

sudo yum install openssl

Now run the SMTP client (openssl is used for the proof of concept, be sure to complete the steps in the workshop lab instructions first):

openssl s_client -crlf -quiet -starttls smtp -connect email-smtp.<aws-region>.amazonaws.com:587

and feed in the commands (replacing the brackets [] and everything between them) to send the SMTP message with the attachment you created.

EHLO amazonses.com
AUTH LOGIN
[base64 encoded SMTP user name]
[base64 encoded SMTP password]
MAIL FROM:[VERIFIED EMAIL IN SES]
RCPT TO:[VERIFIED EMAIL WITH SES RECEIPT RULE]
DATA
Subject: Demo from openssl
MIME-Version: 1.0
Content-Type: multipart/mixed;
 boundary="XXXXboundary text"

This is a multipart message in MIME format.

--XXXXboundary text
Content-Type: text/plain

Line1:This is a Test email sent to coded list of email addresses using the Amazon SES SMTP interface from openssl SMTP client.
Line2:Email_Rxers_Code:[ANYUSER1@DOMAIN_A,ANYUSER2@DOMAIN_B,ANYUSERX@DOMAIN_Y]:Email_Rxers_Code:
Line3:Last line.

--XXXXboundary text
Content-Type: text/plain;
Content-Transfer-Encoding: Base64
Content-Disposition: attachment; filename="demo64.txt"
Y29udGVudAo=
--XXXXboundary text
.
QUIT

Note: For base64 SMTP username and password above, use values obtained in Set up the SES SMTP interface, step 1. So for example, if the username is AKZB3LJAF5TQQRRPQZO1, then you can obtain base64 encoded value using following command:

echo -n AKZB3LJAF5TQQRRPQZO1 |base64
QUtaQjNMSkFGNVRRUVJSUFFaTzE=

This makes base64 encoded value QUtaQjNMSkFGNVRRUVJSUFFaTzE= Repeat same process for SMTP username and password values in the example above.

The openssl command should result in successful SMTP authentication and send. You should receive an email that looks like this:

Optimizing Security of the Solution

  1. Do not share DNS credentials. Unauthorized access can lead to domain control, potential denial of service, and AWS charges. Restrict access to authorized personnel only.
  2. Do not set the SENDER_EMAIL environment variable to the email address associated with the receipt rule. This address is a closely guarded secret, known only to administrators, and should be changed frequently.
  3. Review access to your code repository regularly to ensure there are no unauthorized changes to your code base.
  4. Utilize Permissions Boundaries to restrict the actions permitted by an IAM user or role.

Cleanup

To cleanup, start by navigating to Amazon SES Email receiving in AWS console, and setting the rule set to Inactive.

Once completed, delete the stack:

cdk destroy

Cleanup AWS SES Access Credentials

In Amazon SES Console, select Manage existing SMTP credentials, select the username for which credentials were created in Set up the SES SMTP interface above, navigate to the Security credentials tab and in the Access keys section, select Action -> Delete to delete AWS SES access credentials.

Troubleshooting

If you are not receiving the email or email is not being sent correctly there are a number of common causes of these errors:

  • HTTP Error 554 Message rejected email address is not verified. The following identities failed the check in region :
    • This means that you have attempted to send an email from address that has not been verified.
    • Please, ensure that the “MAIL FROM:[VERIFIED EMAIL IN SES]” email address sent via openssl matches the SenderEmail=<verified sender email> email address used in cdk deploy.
    • Also make sure this email address was used in Verify the sender email address step.
  • Email is not being delivered/forwarded
    • The incoming S3 bucket under the incoming prefix, contains file called AMAZON_SES_SETUP_NOTIFICATION. This means that MX record of the domain setup is missing. Please, validate that the MX record (step 2) of Verify your email domain with Amazon SES to receive emails section is fully configured.
    • Please ensure after deploying the Amazon SES solution, the created rule set was made active by navigating to Amazon SES Email receiving in AWS console, and set it to Active.
    • This may mean that the destination email address has bounced. Please, navigate to Amazon SES Suppression list in AWS console ensure that recipient’s email is not in the suppression list. If it is listed, you can see the reason in the “Suppression reason” column. There you may either manually remove from the suppression list or if the recipient email is not valid, consider using a different recipient email address.
AWS Legal Disclaimer: Sample code, software libraries, command line tools, proofs of concept, templates, or other related technology are provided as AWS Content or Third-Party Content under the AWS Customer Agreement, or the relevant written agreement between you and AWS (whichever applies). You should not use this AWS Content or Third-Party Content in your production accounts, or on production or other critical data. You are responsible for testing, securing, and optimizing the AWS Content or Third-Party Content, such as sample code, as appropriate for production grade use based on your specific quality control practices and standards. Deploying AWS Content or Third-Party Content may incur AWS charges for creating or using AWS chargeable resources, such as running Amazon EC2 instances or using Amazon S3 storage.

About the Authors

Tarek Soliman

Tarek Soliman

Tarek is a Senior Solutions Architect at AWS. His background is in Software Engineering with a focus on distributed systems. He is passionate about diving into customer problems and solving them. He also enjoys building things using software, woodworking, and hobby electronics.

Dave Spencer

Dave Spencer

Dave is a Senior Solutions Architect at AWS. His background is in cloud solutions architecture, Infrastructure as Code (Iac), systems engineering, and embedded systems programming. Dave’s passion is developing partnerships with Department of Defense customers to maximize technology investments and realize their strategic vision.

Ayman Ishimwe

Ayman Ishimwe

Ayman is a Solutions Architect at AWS based in Seattle, Washington. He holds a Master’s degree in Software Engineering and IT from Oakland University. With prior experience in software development, specifically in building microservices for distributed web applications, he is passionate about helping customers build robust and scalable solutions on AWS cloud services following best practices.

Dmytro Protsiv

Dmytro Protsiv

Dmytro is a Cloud Applications Architect for with Amazon Web Services. He is passionate about helping customers to solve their business challenges around application modernization.

Stacy Conant

Stacy Conant

Stacy is a Solutions Architect working with DoD and US Navy customers. She enjoys helping customers understand how to harness big data and working on data analytics solutions. On the weekends, you can find Stacy crocheting, reading Harry Potter (again), playing with her dogs and cooking with her husband.

Security Vulnerability in Saflok’s RFID-Based Keycard Locks

Post Syndicated from Bruce Schneier original https://www.schneier.com/blog/archives/2024/03/security-vulnerability-in-safloks-rfid-based-keycard-locks.html

It’s pretty devastating:

Today, Ian Carroll, Lennert Wouters, and a team of other security researchers are revealing a hotel keycard hacking technique they call Unsaflok. The technique is a collection of security vulnerabilities that would allow a hacker to almost instantly open several models of Saflok-brand RFID-based keycard locks sold by the Swiss lock maker Dormakaba. The Saflok systems are installed on 3 million doors worldwide, inside 13,000 properties in 131 countries. By exploiting weaknesses in both Dormakaba’s encryption and the underlying RFID system Dormakaba uses, known as MIFARE Classic, Carroll and Wouters have demonstrated just how easily they can open a Saflok keycard lock. Their technique starts with obtaining any keycard from a target hotel—say, by booking a room there or grabbing a keycard out of a box of used ones—then reading a certain code from that card with a $300 RFID read-write device, and finally writing two keycards of their own. When they merely tap those two cards on a lock, the first rewrites a certain piece of the lock’s data, and the second opens it.

Dormakaba says that it’s been working since early last year to make hotels that use Saflok aware of their security flaws and to help them fix or replace the vulnerable locks. For many of the Saflok systems sold in the last eight years, there’s no hardware replacement necessary for each individual lock. Instead, hotels will only need to update or replace the front desk management system and have a technician carry out a relatively quick reprogramming of each lock, door by door. Wouters and Carroll say they were nonetheless told by Dormakaba that, as of this month, only 36 percent of installed Safloks have been updated. Given that the locks aren’t connected to the internet and some older locks will still need a hardware upgrade, they say the full fix will still likely take months longer to roll out, at the very least. Some older installations may take years.

If ever. My guess is that for many locks, this is a permanent vulnerability.

The Insecurity of Video Doorbells

Post Syndicated from Bruce Schneier original https://www.schneier.com/blog/archives/2024/03/the-insecurity-of-video-doorbells.html

Consumer Reports has analyzed a bunch of popular Internet-connected video doorbells. Their security is terrible.

First, these doorbells expose your home IP address and WiFi network name to the internet without encryption, potentially opening your home network to online criminals.

[…]

Anyone who can physically access one of the doorbells can take over the device—no tools or fancy hacking skills needed.

No, Toothbrushes Were Not Used in a Massive DDoS Attack

Post Syndicated from Bruce Schneier original https://www.schneier.com/blog/archives/2024/02/no-toothbrushes-were-not-used-in-a-massive-ddos-attack.html

The widely reported story last week that 1.5 million smart toothbrushes were hacked and used in a DDoS attack is false.

Near as I can tell, a German reporter talking to someone at Fortinet got it wrong, and then everyone else ran with it without reading the German text. It was a hypothetical, which Fortinet eventually confirmed.

Or maybe it was a stock-price hack.