Post Syndicated from Anjani Reddy original https://aws.amazon.com/blogs/devops/streamline-your-github-journey-with-aws-codepipeline-and-aws-devops-agent/
Introduction
When CI/CD deployment failures occur for GitHub hosted applications, AWS DevOps Agent reduces the hours that Development and Site Reliability Engineering (SRE) teams typically spend manually investigating across multiple AWS services, logs, and pipeline stages. This process delays critical deployments and impacts software delivery velocity. This is especially true when teams need to correlate data between GitHub commit histories, AWS CodePipeline execution logs, and Amazon CloudWatch metrics. When continuous integration and continuous delivery (CI/CD) pipelines fail, engineers often find themselves context-switching between GitHub pull requests, code build logs, deployment artifacts, and downstream service health metrics. This process of identifying root causes can extend resolution time from minutes to hours, especially in multi-service architectures.
AWS DevOps Agent reduces this manual investigation by automatically correlating pipeline failures with specific code changes. Rather than spending hours manually tracing deployment failures through multiple systems, engineers can use AWS DevOps Agent to perform this correlation. It identifies which specific code changes caused pipeline failures and provides remediation guidance. The agent analyzes pipeline failures, correlates them with specific commits and pull requests, and identifies root causes across the deployment chain.
AWS CodePipeline combined with AWS DevOps Agent helps address this challenge by creating a streamlined path from GitHub repositories to AWS deployments. This solution reduces manual handoffs, reduces configuration complexity, and provides end-to-end visibility across the entire development lifecycle.
In this post, you learn how to integrate AWS DevOps Agent with your GitHub repositories to automatically correlate deployment failures with specific commits, providing root cause analysis and remediation steps across your entire CI/CD pipeline.
Solution overview
Modern software delivery teams face a persistent challenge: when deployments fail, engineers spend valuable time manually correlating logs, tracing pipeline errors, and diagnosing root causes across disconnected tools. This reactive cycle slows recovery and increases mean time to resolution (MTTR). By integrating the AWS DevOps Agent with GitHub, AWS CodePipeline, Amazon CloudWatch, and AWS Lambda, teams can shift from manual triage to automated incident investigation, directly within their existing GitHub-based workflows.
This solution integrates AWS DevOps Agent with GitHub to automate deployment failure investigation. The following sections explain the architecture and operational benefits.
How it works
The architecture creates an automated monitoring and remediation flow that monitors your deployment pipeline and responds to issues. Your source code resides in a GitHub repository, and AWS CodePipeline orchestrates the build, test, and deployment stages. Amazon CloudWatch continuously monitors pipeline execution metrics and logs and generates alarms when it detects anomalies or failures, such as failed build stages, deployment rollbacks, or threshold breaches in downstream application of health metrics. When a failure occurs, it generates an error metric in CloudWatch. The CloudWatch Alarm detects this error and transitions to an ALARM state, which directly invokes the WebHook Executor Lambda. The WebHook Executor then sends an authenticated HTTP POST request to DevOps Agent, which receives the incident and begins an investigation.
Webhook integration acts as the bridge between the Amazon CloudWatch, the monitoring layer. Lambda parses the alarm payload and extracts contextual metadata and then invokes the DevOps Agent with a structured investigation request.
Integration with Operational Excellence
This solution directly supports the AWS Well-Architected Framework’s Operational Excellence pillar by automating the investigation process and reducing the MTTR. The investigation capability of AWS DevOps Agent aligns with AWS Incident Detection and Response (IDR) best practices, helping teams to detect, diagnose, and develop mitigation plans for pipeline failures faster while maintaining a full audit trail of agent actions and findings. This creates a delivery pipeline that accelerates resolution workflows through automated diagnostics and actionable remediation recommendations, keeping deployments moving and engineering teams focused on building rather than firefighting.
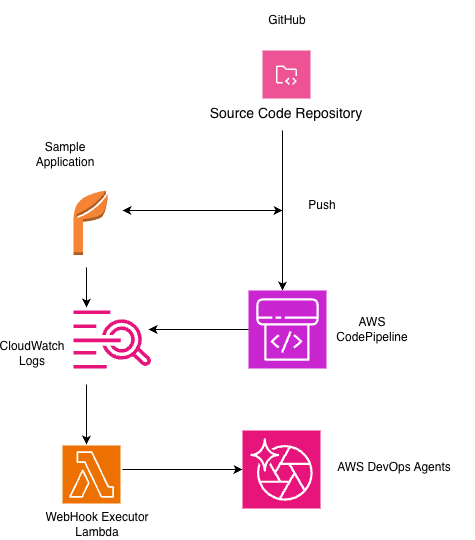
Figure 1: GitHub and DevOps Agent integration
Prerequisites
For this walkthrough, you should have access to and understanding of the following:
- An AWS account with permissions to create AWS Identity and Access Management (IAM) roles:
1. Agent Space role – for basic service operations.
2. Agent Space web app role – for using the Agent Space web app functionality.
3. (Optional) Secondary source account roles if monitoring multiple AWS accounts. Refer to the DevOps Agent user guide for the details on setting up these roles. - A GitHub account:
1. You have a GitHub account with administrative permissions for your repositories, or an organization you belong to.
2. Your repositories contain code that deploys to AWS resources you want to monitor.
3. You have identified the GitHub repositories you want AWS DevOps agent to access. - Access to register DevOps Agent with your GitHub Account or Organization.
- CloudWatch monitoring enabled for your application.
Implementation steps
Note: For this blog we used a sample application from the AWS-samples.
- Create an AWS DevOps Agent Space and configure the webhook
The first step is to create a dedicated Agent Space that serves as the central hub for your automated investigation workflow. The Agent Space connects your monitoring infrastructure to the DevOps Agent’s analysis capabilities.
Create the DevOps Agent space by following the steps outlined in the Getting Started with AWS DevOps Agent guide Navigate to the DevOps Agent console.
Create an Agent Space named after your application (for example, `myhotelapp`)
1) “Auto-create both IAM roles”.
2) “Edit the role names to be descriptive (for example, DevOpsAgentRole-AgentSpace-hotel-app and DevOpsAgentRole-WebappAdmin-hotel-app)”
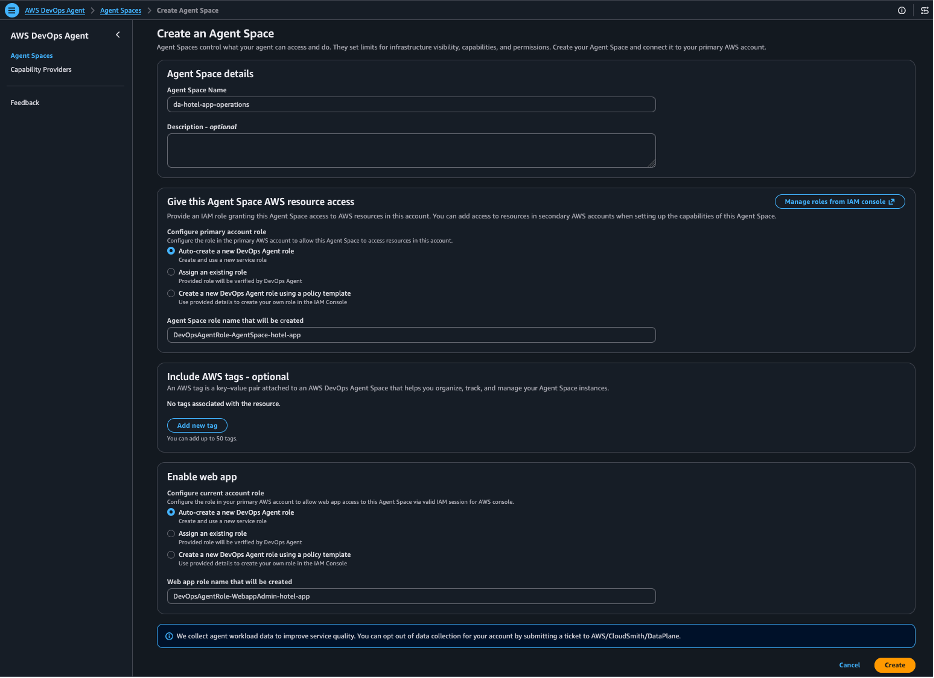
Figure 2: Agent Spaces Screen
On the Capabilities tab, generate a webhook and save the credentials
Store the webhook credentials in AWS Secrets Manager:
```bash
aws secretsmanager create-secret \
--name devops-agent-webhook-credentials \
--secret-string '{"webhookUrl":"YOUR-WEBHOOK-URL","webhookSecret":"YOUR-WEBHOOK-SECRET"}' \
--region us-east-1
```
2. Configure GitHub integration with your AgentSpace
With your Agent Space created and webhook configured, the next step is to connect your GitHub repositories. This integration allows the DevOps Agent to access commit histories, pull request data, and code changes when investigating pipeline failures.
To configure GitHub integration with your AgentSpace:
1. From the Capabilities tab within your configured AgentSpace, navigate to the GitHub Configuration section and choose “Register”
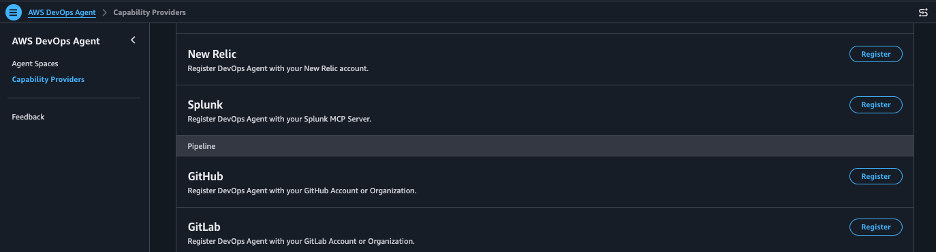
Figure 3: Capability Providers
2. Your GitHub repositories will be listed with their connection status.
3. To connect to a repository, verify that the Status shows “Ready to connect” and choose the + button in the Actions column.
4. Upon successful connection, the Status updates to ‘Connected’.
To automatically trigger AWS DevOps Agent investigations via Webhook when a CloudWatch enters the ALARM state, you can refer to sample-aws-devops-agent-cloudwatch and build based on your use case.
3. Troubleshooting application deployment 5XX errors with CloudWatch and AWS DevOps Agent
When your application encounters 5XX errors during deployment, CloudWatch alarms detect the anomaly and trigger the DevOps Agent investigation workflow. The following dashboard shows the alarm state that initiates the automated investigation process.

Figure 4: CloudWatch Dashboard
4. Resolving deployment/build errors during CI/CD deployment
The following use cases demonstrate how AWS DevOps Agent investigates and resolves common CI/CD pipeline failures. Each scenario walks through the failure trigger, the automated investigation, and the remediation guidance that the agent provides
Use case 1: Push a code change that introduces an invalid DynamoDB table name
Simulate: Push a code change that breaks the DynamoDB table name — e.g., change DYNAMODB_TABLE_NAME env var but don’t update CloudFormation to make the CodePipeline unit testing fail
A – dynamodb_table: process.env.DYNAMODB_TABLE_NAME || “Rooms”,
B + dynamodb_table: “HotelRooms”
The CodePipeline triggers 5xx alarms and the webhook triggers a DevOps Agent investigation.
DevOps Agent analyzes the 500 errors in relation to the configuration change, identifies the invalid DynamoDB endpoint, and shows the timeline: configuration update → service redeployment → requests fail with connection errors.
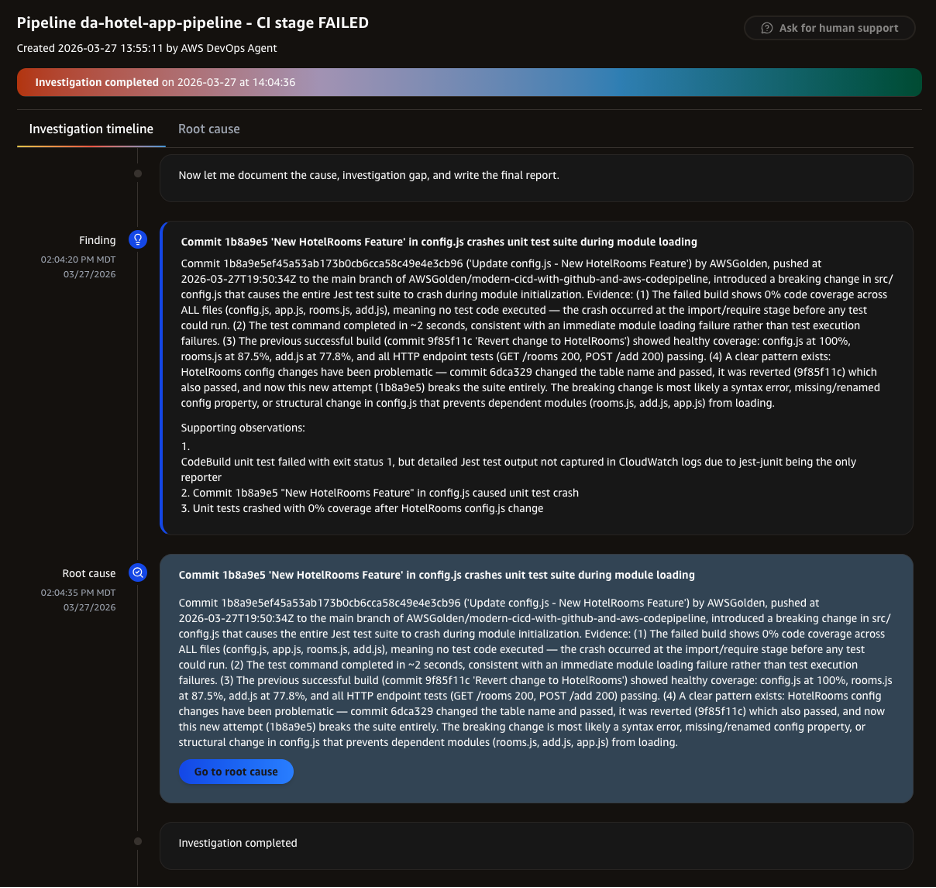
Figure 5: Unit test failed for the CodePipeline
Use case 2: Identifying dependency resolution failures from bad commits
1. Navigate to `package.json`
2. Change any dependency name to something invalid — for example, change `”express”` to `”expresss”` (extra ‘s’)
3. Commit the change directly to `main`
CodePipeline detects the push and starts a new execution. The CI stage runs `npm install`, which fails because the misspelled package doesn’t exist. The Amazon EventBridge rule catches the stage failure and invokes the webhook executor Lambda, which triggers a DevOps Agent investigation.
In the DevOps Agent console, select your Agent Space, then choose Operator access to open the web app. Navigate to the Incident Response tab to view the new investigation.
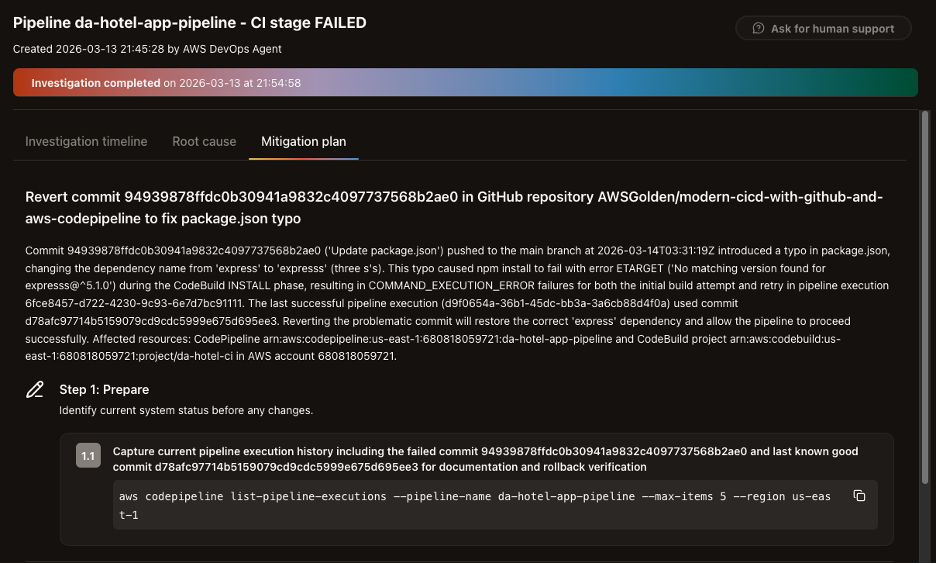
Figure 6: Mitigation plan step1
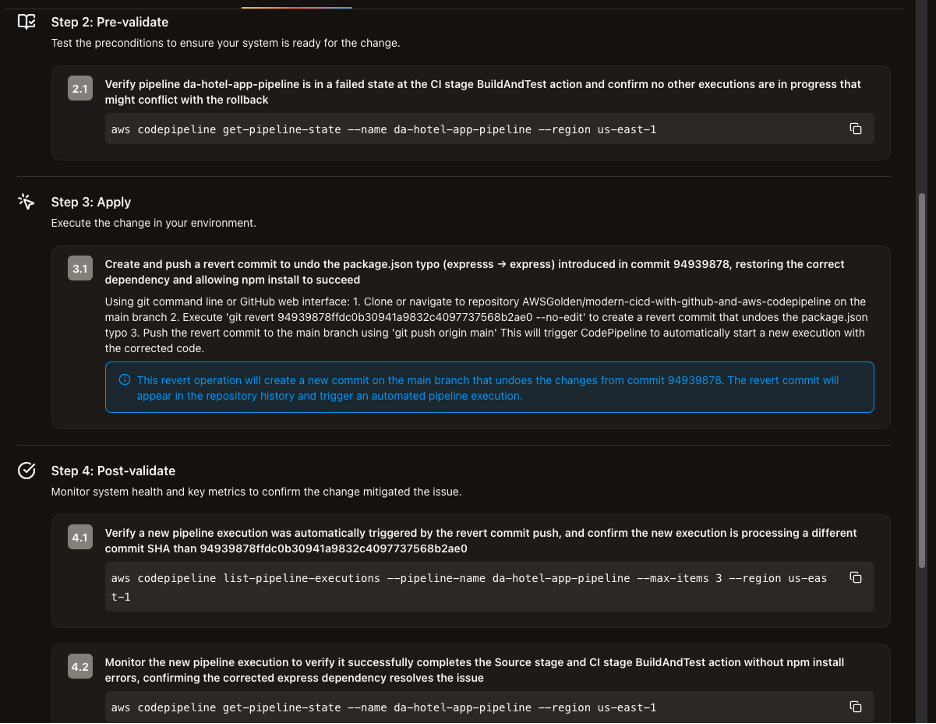
Figure 7: Mitigation plan steps 2-4
DevOps Agent investigates the pipeline failure, examines the CodeBuild logs showing the `npm install` error, and correlates it with the recent commit to the repository. It identifies the root cause as a dependency resolution failure introduced by the latest code change.
Clean up
This walkthrough creates AWS resources that incur charges, including AWS DevOps Agent (pay-per-use), Lambda functions, CodePipeline executions, CloudWatch alarms, and Secrets Manager secrets. Follow the cleanup steps when finished to avoid ongoing charges.
1. Delete the Secrets Manager secret devops-agent-webhook-credentials using: aws secretsmanager delete-secret –secret-id devops-agent-webhook-credentials –region us-east-1
2. Delete your Agent Space from the AWS DevOps Agent console
3. Remove the GitHub pipeline connection from your settings.
4. Delete the IAM roles created for the Agent Space.
5. Delete the Lambda function, EventBridge rule, and CloudWatch alarms created for webhook integration.
6. (Optional) If you created additional source account roles, remove those as well.
Conclusion
The AWS DevOps Agent integration with GitHub fundamentally transforms how engineering teams approach CI/CD reliability by shifting from reactive troubleshooting to proactive incident prevention. By autonomously correlating CodePipeline failures with specific GitHub commits, analyzing root causes across the deployment chain, and providing intelligent remediation recommendations, this solution reduces mean time to resolution from hours to minutes while maintaining the human oversight necessary for production environments.
Organizations implementing this integration gain a resilient software delivery pipeline that combines the collaborative strengths of GitHub source control with AWS’s intelligent automation capabilities. This helps teams maintain deployment velocity, strengthen operational excellence, and focus engineering effort on innovation rather than incident response.
AWS CodePipeline, Amazon CloudWatch, AWS Lambda, and the AWS DevOps Agent integrate natively to provide end-to-end visibility and autonomous investigation capabilities. Together, they accelerate recovery workflows, reduce operational friction, and build the foundation for continuous delivery at scale.
About authors
Anjani Reddy
Anjani is a Sr. Solutions Architect at AWS. She works with Enterprise customers to provide operational guidance to innovate and build a secure, scalable cloud on the AWS platform. Outside of work, she is an Indian classical & salsa dancer, loves to travel and Volunteers for American Red Cross & Hands on Atlanta.
Jared Thompson
Jared Thompson is a Senior Technical Account Manager at AWS, where he partners with strategic enterprise customers to optimize cloud operations and accelerate AI/ML workloads at scale. Jared specializes in GPU-accelerated computing, capacity planning, and cloud observability, with a passion for turning complex infrastructure challenges into automated, self-healing systems. He is a recipient of the AWS Golden Jacket award and when not at work, he can be found on a cruise ship.
Aneesh Varghese is a Senior Technical Account Manager at AWS with more than 19 years of Information Technology industry experience. Aneesh supports enterprise customers in cost optimization strategies, Cloud operations, MLOps, providing advocacy and strategic technical guidance to help plan and build solutions using AWS best practices. Outside of work, Aneesh likes to spend time with family, play Basketball and Badminton.