Tag Archives: cost-efficiency

Reliable GPU compute for large training & inference jobs

Post Syndicated from Netflix Technology Blog original https://netflixtechblog.com/reliable-gpu-compute-for-large-training-inference-jobs-d62b03a96d7a

Authors: Nick Rutigliano, Argha C, Samartha Chandrashekar

How we detect failing GPUs and network fabric, remediate machines automatically, and let long-running jobs survive hardware loss.

Open Netflix, and the home screen is assembled for you: which rows appear, the order they appear in, the titles within them, and the artwork for each title are chosen by machine learning models trained on how hundreds of millions of members watch. Personalization is one of the most widely used things we build, and members feel it every time they open the app. Like a growing share of Netflix, it runs on GPUs, which train those models and increasingly serve them live.

Those GPUs have to stay healthy for that experience to hold up, and keeping them healthy is harder than it sounds. A single large training job can run for weeks across hundreds of GPUs spread over many machines. It runs as a gang: the ranks move in lockstep, exchanging data every step, so the job advances only as fast as its slowest participant and stops entirely if one participant dies. Every GPU, every high-speed network adapter, and every interconnect must keep working throughout the run. At the scale at which modern machine learning runs, individual GPUs and network links can fail during a run, so the underlying platform must be prepared for this and handle it without a person in the loop.

This post describes how we keep our GPU infrastructure healthy for training and inference. We cover how we detect failing hardware before and during jobs, how we automatically remediate a bad machine, and how we let a long job survive the loss of a machine. These training workloads run on our modern Kubernetes-native Compute platform.

Why GPU reliability matters

Netflix aims to entertain the world, and machine learning has been part of how we do that for years, from the recommendations that help members find something to watch to the systems that help produce and promote titles. As generative AI advances, we are investing in it on both sides of the business: for members, through better recommendations and higher-quality promotional assets; and for storytelling, through creative tools for our production partners.

All of this runs on GPUs, for both training and inference, and GPU capacity is among the fastest-growing and most expensive parts of our infrastructure. That makes reliability a business concern on two fronts. — -

  • Availability: a training run that loses a machine, or an inference service that cannot get healthy capacity, delays work that members and creators depend on.
  • Cost efficiency: a GPU sitting idle behind a slow neighbor, or a whole machine pulled from the pool because one device is degraded, becomes capacity we paid for and are not using. Higher reliability and higher utilization mean more useful work per GPU, which is equivalent to spending less to do the same work.

Inference is a growing share of that GPU footprint as more of these AI features reach members, so the reliability and efficiency that matter for multi-week training runs increasingly matter for always-on serving too.

Why basic health checks are not enough

We start from the baseline provided by the cloud provider. Cloud providers run instance status checks on virtual machines: a system status check for the underlying host’s power, network, and hardware reachability; an instance status check to verify that the operating system is up and reachable; and a check on attached storage. It emits scheduled maintenance events when it plans to retire or reboot a host, and it can automatically recover an instance that becomes impaired. We use all of these, and the maintenance events feed one of our own checks. They catch a machine that is down, unreachable, or slated for maintenance, and they stop at the instance level. They confirm the box is up and reachable. They do not verify that each GPU, its on-chip memory, its interconnect, and its network fabric are healthy enough to support distributed training.

The next step most teams take is a GPU-level check to confirm that the driver responds and that the GPUs are visible. That catches a dead or missing GPU, but misses the cases that take the most time.

  • A GPU can answer a status query and still be faulty once a workload touches it. A fault in on-chip memory or in the firmware that manages the device can remain invisible until a job allocates memory or runs sustained compute, at which point the job fails or slows.
  • A high-speed network adapter may be present but show fewer links than expected. Collective operations still run, at a fraction of the bandwidth, so the job does not crash. It crawls, and the cause is easy to miss.
  • A check can fail in ways that leave a faulty machine looking healthy. The diagnostic tool can hang when the driver hangs, and a naive check that waits on it hangs too. A binary that the check depends on can go missing after a driver upgrade, causing the check to stop running and report nothing. A check that can silently stop running is worse than no check, because it gives false confidence while the machine keeps working.

Because a job runs as a gang, any one of these on any one machine can degrade or stop the whole job, and none of them shows up in an instance-level check or a driver-responds check. The health system has to assume the hardware can lie and the tools that inspect it can break.

A machine can pass a basic check and still be faulty. Layered checks, timeouts, a fallback path, and checks that fail when a dependency is missing close these gaps.

Our approach

We treat reliability as four layers, each catching what the layer below cannot:

1/ Node and hardware health: find bad GPUs, network adapters, interconnects, memory errors, and thermal issues, then taint or recycle the machine.

2/ Scheduler and platform: retry at the task & job level, validate a machine before it takes work, and drain & recycle machines safely.

3/ Training loop: checkpoint and use elastic workers so a job survives losing a machine.

4/ Observability: metrics, service-level objectives, and failure attribution across the other three.

The first two layers keep hardware problems away from jobs. The third accepts that some loss is unavoidable and makes it cheap. The fourth tells us whether the first three are working.

Four layers: Each catches what the layer below cannot.

How the health checks work

Checks run in two tiers. Device-level checks look at each GPU. A node-level agent, built on the open-source Kubernetes node-problem-detector, runs on every GPU machine every 30 seconds and turns check results into conditions on the Kubernetes node, the same mechanism Kubernetes uses to mark a node NotReady. Controllers watch those conditions and decide whether the machine can take on work.

GPU device checks are built on NVIDIA’s DCGM for driver-reported error codes, uncorrectable memory errors, interconnect integrity, and thermal state, and networking adapter checks inspect the host state for the count and link state of the Elastic Fabric Adapter interfaces that carry cross-machine traffic. A few of these checks deserve detail.

Two-tier health checking. Device-level and node-level checks become Kubernetes node conditions, which controllers then turn into taints, drains, terminates, and replaces.
  • Failing closed: if the driver or the diagnostic tool is unresponsive, the check times out and marks the machine unhealthy. A check that cannot reach the hardware reports a problem rather than passing, so a wedged driver takes the machine out of rotation rather than letting it hide behind a hung tool.
  • A fallback path: driver error codes are the strongest signal that a GPU has faulted, but the tool that reads them can itself be broken in certain failure modes! When it does, we read the kernel log dmesg directly for those codes, so no Xid or SXid errors are missed.
  • Our own fatal-error map: vendor driver error catalogs lag newer GPU generations and do not always match what we see in production, so we keep our own mapping of which codes are fatal for each GPU family. A code that means reset-the-GPU in one generation can be benign in another, and one GPU generation emits a burst of normally-fatal code on every healthy boot, which we learned to treat as noise rather than drain fresh machines.
  • No silent no-ops: a check fails when a required dependency is missing. This one came from an upgrade that dropped a binary the network-adapter check relied on. The check quietly stopped running, and machines with the wrong number of adapters shipped for days before the slow jobs were traced back to them. Now a missing dependency fails the check.

Turning a bad machine into healthy capacity, automatically

When a check fails, the machine’s node condition changes, and controllers take over. We distinguish two levels. A problem condition blocks new work from landing while jobs are running, because pulling a job off a machine is disruptive, and many problems clear on their own. If the condition persists beyond a tolerance window, it escalates to a failure condition, which evacuates the machine, drains its tasks (overriding the normal disruption limits to move quickly), terminates it, and replaces it.

Karpenter node auto-repair is used on our compute stack. We have customized it with a policy and a controller that maps each node condition to the duration we tolerate it before acting, so a fast-fatal error is actioned within minutes. At the same time, a flaky signal gets a longer window, and a cap limits how much of a cluster we will disrupt at once, so a bad rollout of the checks themselves cannot cascade into tearing down a whole cluster. We plan to upstream this feature to all Karpenter users.

Graded remediation. A problem is tolerated and may clear; a persistent failure escalates to evacuation and draining, then to a fast in-place fix or termination for confirmed hardware faults.

Not every fault requires a full replacement, and replacement is the slowest way to restore capacity. We match the action to the fault. Killing the offending job clears a software wedge. Resetting a single GPU clears many transient device faults. Rebooting the machine clears the firmware state that has drifted over a long uptime. Terminating and replacing is reserved for hardware that fails a test we trust. For that last case, we record the GPU’s immutable hardware identifier, which stays with the physical device across reboots and relaunches even when the instance changes, report it to the cloud provider, and keep our own list, so a device that fails repeatedly does not quietly rejoin the pool under a new instance.

One subtlety sits between detection and scheduling. A freshly checked machine was handed to the scheduler just as its checks were still settling, so a job could land on it a moment before a slow check flagged it. We now hold capacity until the checks have run and settled, which closed that window.

Validating a machine before it takes work

A machine that just booted is not trusted until it proves itself. Before we release its capacity, it passes system checks, confirms the GPUs and their topology are present, and runs a round of GPU diagnostics. We then wait for the health checks to run twice, because the longer checks, such as counting network adapters, take more than one cycle to fire, and releasing after a single pass would let work land before those checks are reported. Only then do we remove the startup taint. On teardown, we run deeper diagnostics and record the GPU identifiers, which feed the same bad-hardware list, so hardware that failed once does not silently cycle back into service.

Letting long jobs survive machine loss

Even with all of the above, some machines are lost mid-job, so we make that cheap. Jobs checkpoint their state, and on a lost machine, they resume from the last healthy checkpoint rather than restarting from the beginning of a multi-week run. Workers are elastic and retryable, and the scheduler automatically retries platform-caused failures.

Attribution is what makes automatic retries safe. If we retried every failure, we would mask genuine bugs in a job and burn GPU hours looping on an error the platform cannot fix, so we classify each failure as platform or application before retrying. One example of why this matters: a class of timeouts in NCCL, the collective communication library GPUs use to exchange data, appeared to be a network fault and was traced to data-loading stalls at high worker counts. The GPUs and the network were fine, and the fix was in the data pipeline. Treated as hardware failures, those timeouts would have cycled healthy machines without fixing the cause.

Measuring whether it works

We track GPU reliability along three service-level objectives, each split by cause, so a miss points at the layer responsible:

  • Availability: the amount of GPU capacity available for scheduling at any given moment.
  • Job-start success: whether a job starts promptly once its capacity is available.
  • Job success: whether a job finishes without a platform-caused failure.

Each objective is split into hardware, driver, platform, and user causes. Hence, an availability dip from bad hardware reads differently from one caused by a scheduler change or a user misconfiguration. We optimize for goodput, the useful work the fleet completes, because a job held back by one slow GPU can look healthy on an uptime chart while getting almost nothing done. Specific targets for each objective are provided here for illustrative purposes.

A closed remediation loop

These pieces form a loop. Hardware is validated at allocation, before a job starts, with a short collective communication run and pairwise network tests. Hence, any machine that fails within the first minute fails before the job is admitted. During the job, we watch passively for driver errors, memory errors, thermal events, and more. We view each job as a distributed system, which lets us identify a single slow rank dragging the rest, rather than only whole-machine failures. When something is wrong, remediation is automatic and graded. The loop is the same whether a job runs through our batch scheduler, Kueue, or Ray.

The reliability loop: validate, watch, actively check, view the job as a system, remediate, then repeat.

Sharing GPUs safely

Not every workload needs a whole GPU, and leaving small inference jobs on dedicated GPUs wastes capacity. We partition GPUs with MIG for memory-level isolation between tenants, so a fault or a memory hog in one partition does not affect another. We also reconfigure those partitions without restarting the machine, so that a pool can shift between many small slices and a few large ones as demand changes. GPU and network adapter allocation is device-plugin-based today, to move to Kubernetes Dynamic Resource Allocation once it is supported in Karpenter. This matters because a GPU talking to a network adapter or working with a CPU on the wrong PCIE root of the machine incurs a bandwidth penalty.

On a multi-GPU machine, we isolate a single faulty GPU, keep the rest in service, and partition healthy GPUs across multiple tenants with memory-level isolation.

Device-level allocation also changes how we handle a single bad GPU. With DRA support, instead of losing the whole machine, we could isolate the one faulty device and keep the others serving, which matters most for inference, where many small jobs share a machine. And because allocation is expressive, a job can request the capabilities it needs, such as memory or tensor-core support, and the platform matches a suitable GPU type, so users are not pinned to a model they had to choose in advance.

Results

Moving from basic checks and manual draining to layered checks and automatic remediation changed two things users feel. More of the GPU fleet is available for scheduling at any time because bad machines are caught and cycled quickly, rather than sitting in the pool or waiting on an on-call engineer. And fewer jobs fail due to platform issues because most faults are caught before a job lands, and the rest are automatically remediated and retried. Graded remediation also returns capacity in minutes for faults that only require a job kill, a GPU reset, or a reboot, rather than the longer wait for a replacement machine.

Since the above improvements have landed, we’ve seen:

  • Consistently achieving >99.95% availability of our GPU nodes
  • Job success rate has gone from ~98% to above 99.5%

What is next

We are extending active checks to cover additional failure modes under load, widening burn-in so more classes of failures can be cleared before a user encounters them, and making remediation more granular so more error types are cleared in place rather than requiring a full node replacement loop for certain Xid errors. Additionally, we want to do more periodic diagnostics between jobs.

We are working to make placement more topology-aware using Kubernetes Dynamic Resource Allocation (DRA) once it lands in Karpenter, for example, by aligning on Compute/IMEX Domains, PCIe roots, and NUMA nodes.

More on the performance side for multi-GPU training, we plan to run a custom Linux scheduler built on sched_ext. Firstly, we can prioritize processes during collective coordination, such as when GPUs exchange results before the next round of compute, thereby reducing overall GPU idle time by establishing a fleet-wide priority for these tasks. The effect is small on one machine but grows across hundreds of machines, where a few percent of throughput amounts to a large amount of capacity. Secondly, we can prioritize data-loading processes to minimize the bottleneck that sometimes occurs when data is not loaded onto GPUs quickly enough to maintain steady progress.

While we already monitor throttling events, GPUs do not have to report throttling for it to hurt a job. One running ten to fifteen degrees hotter than its peers, even within healthy limits, sets the pace for the gang, so we can treat a large temperature gap as a fault, stop the job, and move it to cooler GPUs.

Additionally, we plan to expand our NCCL RAS (reliability, availability, serviceability) monitoring to identify NCCL issues sooner, such as mismatched collectives or hangs, to more quickly resume work.

Closing

Hardware fails, and at this scale, it fails often enough that the platform has to treat failure as normal. Detecting problems before and during jobs, automatically remediating machines, and allowing long jobs to resume after a loss lets teams run large-scale training and inference without babysitting the hardware. If you like these kinds of problems, we are hiring.


Reliable GPU compute for large training & inference jobs was originally published in Netflix TechBlog on Medium, where people are continuing the conversation by highlighting and responding to this story.
Evolving from Rule-based Classifier: Machine Learning Powered Auto Remediation in Netflix Data…

Post Syndicated from Netflix Technology Blog original https://netflixtechblog.com/evolving-from-rule-based-classifier-machine-learning-powered-auto-remediation-in-netflix-data-039d5efd115b

Evolving from Rule-based Classifier: Machine Learning Powered Auto Remediation in Netflix Data Platform

by Binbing Hou, Stephanie Vezich Tamayo, Xiao Chen, Liang Tian, Troy Ristow, Haoyuan Wang, Snehal Chennuru, Pawan Dixit

This is the first of the series of our work at Netflix on leveraging data insights and Machine Learning (ML) to improve the operational automation around the performance and cost efficiency of big data jobs. Operational automation–including but not limited to, auto diagnosis, auto remediation, auto configuration, auto tuning, auto scaling, auto debugging, and auto testing–is key to the success of modern data platforms. In this blog post, we present our project on Auto Remediation, which integrates the currently used rule-based classifier with an ML service and aims to automatically remediate failed jobs without human intervention. We have deployed Auto Remediation in production for handling memory configuration errors and unclassified errors of Spark jobs and observed its efficiency and effectiveness (e.g., automatically remediating 56% of memory configuration errors and saving 50% of the monetary costs caused by all errors) and great potential for further improvements.

Introduction

At Netflix, hundreds of thousands of workflows and millions of jobs are running per day across multiple layers of the big data platform. Given the extensive scope and intricate complexity inherent to such a distributed, large-scale system, even if the failed jobs account for a tiny portion of the total workload, diagnosing and remediating job failures can cause considerable operational burdens.

For efficient error handling, Netflix developed an error classification service, called Pensive, which leverages a rule-based classifier for error classification. The rule-based classifier classifies job errors based on a set of predefined rules and provides insights for schedulers to decide whether to retry the job and for engineers to diagnose and remediate the job failure.

However, as the system has increased in scale and complexity, the rule-based classifier has been facing challenges due to its limited support for operational automation, especially for handling memory configuration errors and unclassified errors. Therefore, the operational cost increases linearly with the number of failed jobs. In some cases–for example, diagnosing and remediating job failures caused by Out-Of-Memory (OOM) errors–joint effort across teams is required, involving not only the users themselves, but also the support engineers and domain experts.

To address these challenges, we have developed a new feature, called Auto Remediation, which integrates the rule-based classifier with an ML service. Based on the classification from the rule-based classifier, it uses an ML service to predict retry success probability and retry cost and selects the best candidate configuration as recommendations; and a configuration service to automatically apply the recommendations. Its major advantages are below:

  • Integrated intelligence. Instead of completely deprecating the current rule-based classifier, Auto Remediation integrates the classifier with an ML service so that it can leverage the merits of both: the rule-based classifier provides static, deterministic classification results per error class, which is based on the context of domain experts; the ML service provides performance- and cost-aware recommendations per job, which leverages the power of ML. With the integrated intelligence, we can properly meet the requirements of remediating different errors.
  • Fully automated. The pipeline of classifying errors, getting recommendations, and applying recommendations is fully automated. It provides the recommendations together with the retry decision to the scheduler, and particularly uses an online configuration service to store and apply recommended configurations. In this way, no human intervention is required in the remediation process.
  • Multi-objective optimizations. Auto Remediation generates recommendations by considering both performance (i.e., the retry success probability) and compute cost efficiency (i.e., the monetary costs of running the job) to avoid blindly recommending configurations with excessive resource consumption. For example, for memory configuration errors, it searches multiple parameters related to the memory usage of job execution and recommends the combination that minimizes a linear combination of failure probability and compute cost.

These advantages have been verified by the production deployment for remediating Spark jobs’ failures. Our observations indicate that Auto Remediation can successfully remediate about 56% of all memory configuration errors by applying the recommended memory configurations online without human intervention; and meanwhile reduce the cost of about 50% due to its ability to recommend new configurations to make memory configurations successful and disable unnecessary retries for unclassified errors. We have also noted a great potential for further improvement by model tuning (see the section of Rollout in Production).

Rule-based Classifier: Basics and Challenges

Basics

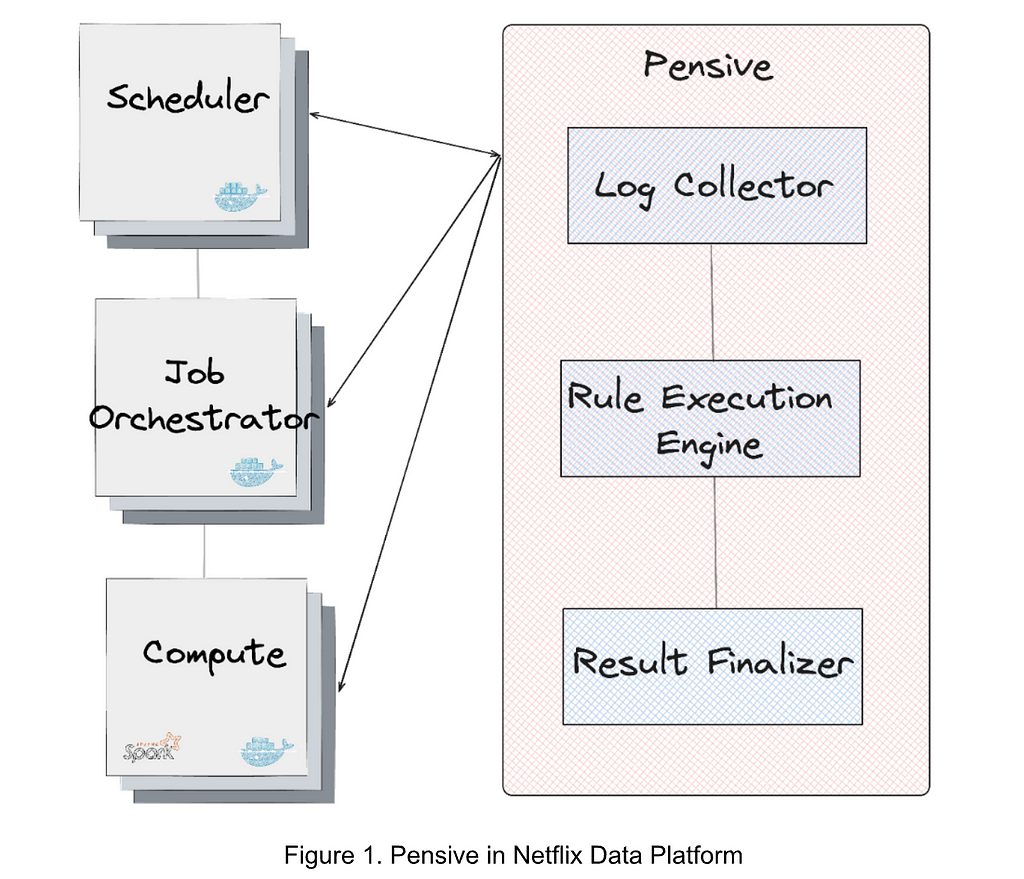
Figure 1 illustrates the error classification service, i.e., Pensive, in the data platform. It leverages the rule-based classifier and is composed of three components:

  • Log Collector is responsible for pulling logs from different platform layers for error classification (e.g., the scheduler, job orchestrator, and compute clusters).
  • Rule Execution Engine is responsible for matching the collected logs against a set of predefined rules. A rule includes (1) the name, source, log, and summary, of the error and whether the error is restartable; and (2) the regex to identify the error from the log. For example, the rule with the name SparkDriverOOM includes the information indicating that if the stdout log of a Spark job can match the regex SparkOutOfMemoryError:, then this error is classified to be a user error, not restartable.
  • Result Finalizer is responsible for finalizing the error classification result based on the matched rules. If one or multiple rules are matched, then the classification of the first matched rule determines the final classification result (the rule priority is determined by the rule ordering, and the first rule has the highest priority). On the other hand, if no rules are matched, then this error will be considered unclassified.

Challenges

While the rule-based classifier is simple and has been effective, it is facing challenges due to its limited ability to handle the errors caused by misconfigurations and classify new errors:

  • Memory configuration errors. The rules-based classifier provides error classification results indicating whether to restart the job; however, for non-transient errors, it still relies on engineers to manually remediate the job. The most notable example is memory configuration errors. Such errors are generally caused by the misconfiguration of job memory. Setting an excessively small memory can result in Out-Of-Memory (OOM) errors while setting an excessively large memory can waste cluster memory resources. What’s more challenging is that some memory configuration errors require changing the configurations of multiple parameters. Thus, setting a proper memory configuration requires not only the manual operation but also the expertise of Spark job execution. In addition, even if a job’s memory configuration is initially well tuned, changes such as data size and job definition can cause performance to degrade. Given that about 600 memory configuration errors per month are observed in the data platform, timely remediation of memory configuration errors alone requires non-trivial engineering efforts.
  • Unclassified errors. The rule-based classifier relies on data platform engineers to manually add rules for recognizing errors based on the known context; otherwise, the errors will be unclassified. Due to the migrations of different layers of the data platform and the diversity of applications, existing rules can be invalid, and adding new rules requires engineering efforts and also depends on the deployment cycle. More than 300 rules have been added to the classifier, yet about 50% of all failures remain unclassified. For unclassified errors, the job may be retried multiple times with the default retry policy. If the error is non-transient, these failed retries incur unnecessary job running costs.

Evolving to Auto Remediation: Service Architecture

Methodology

To address the above-mentioned challenges, our basic methodology is to integrate the rule-based classifier with an ML service to generate recommendations, and use a configuration service to apply the recommendations automatically:

  • Generating recommendations. We use the rule-based classifier as the first pass to classify all errors based on predefined rules, and the ML service as the second pass to provide recommendations for memory configuration errors and unclassified errors.
  • Applying recommendations. We use an online configuration service to store and apply the recommended configurations. The pipeline is fully automated, and the services used to generate and apply recommendations are decoupled.

Service Integrations

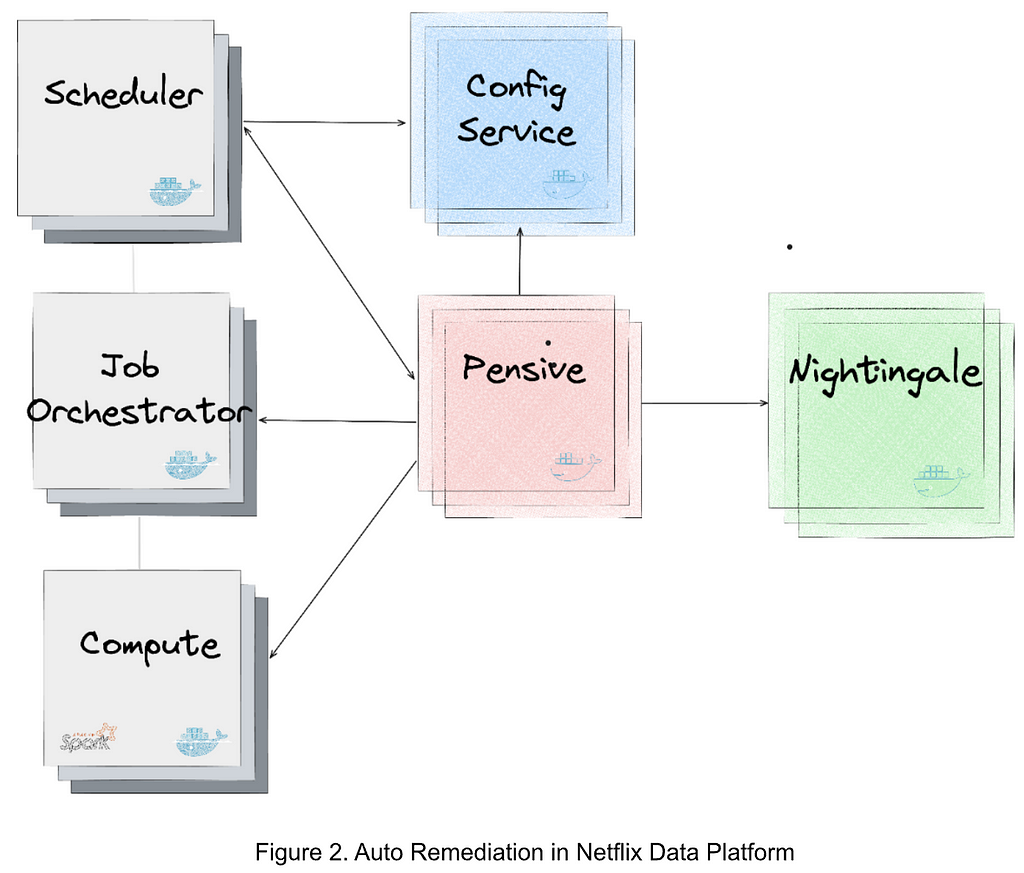
Figure 2 illustrates the integration of the services generating and applying the recommendations in the data platform. The major services are as follows:

  • Nightingale is a service running the ML model trained using Metaflow and is responsible for generating a retry recommendation. The recommendation includes (1) whether the error is restartable; and (2) if so, the recommended configurations to restart the job.
  • ConfigService is an online configuration service. The recommended configurations are saved in ConfigService as a JSON patch with a scope defined to specify the jobs that can use the recommended configurations. When Scheduler calls ConfigService to get recommended configurations, Scheduler passes the original configurations to ConfigService and ConfigService returns the mutated configurations by applying the JSON patch to the original configurations. Scheduler can then restart the job with the mutated configurations (including the recommended configurations).
  • Pensive is an error classification service that leverages the rule-based classifier. It calls Nightingale to get recommendations and stores the recommendations to ConfigService so that it can be picked up by Scheduler to restart the job.
  • Scheduler is the service scheduling jobs (our current implementation is with Netflix Maestro). Each time when a job fails, it calls Pensive to get the error classification to decide whether to restart a job and calls ConfigServices to get the recommended configurations for restarting the job.

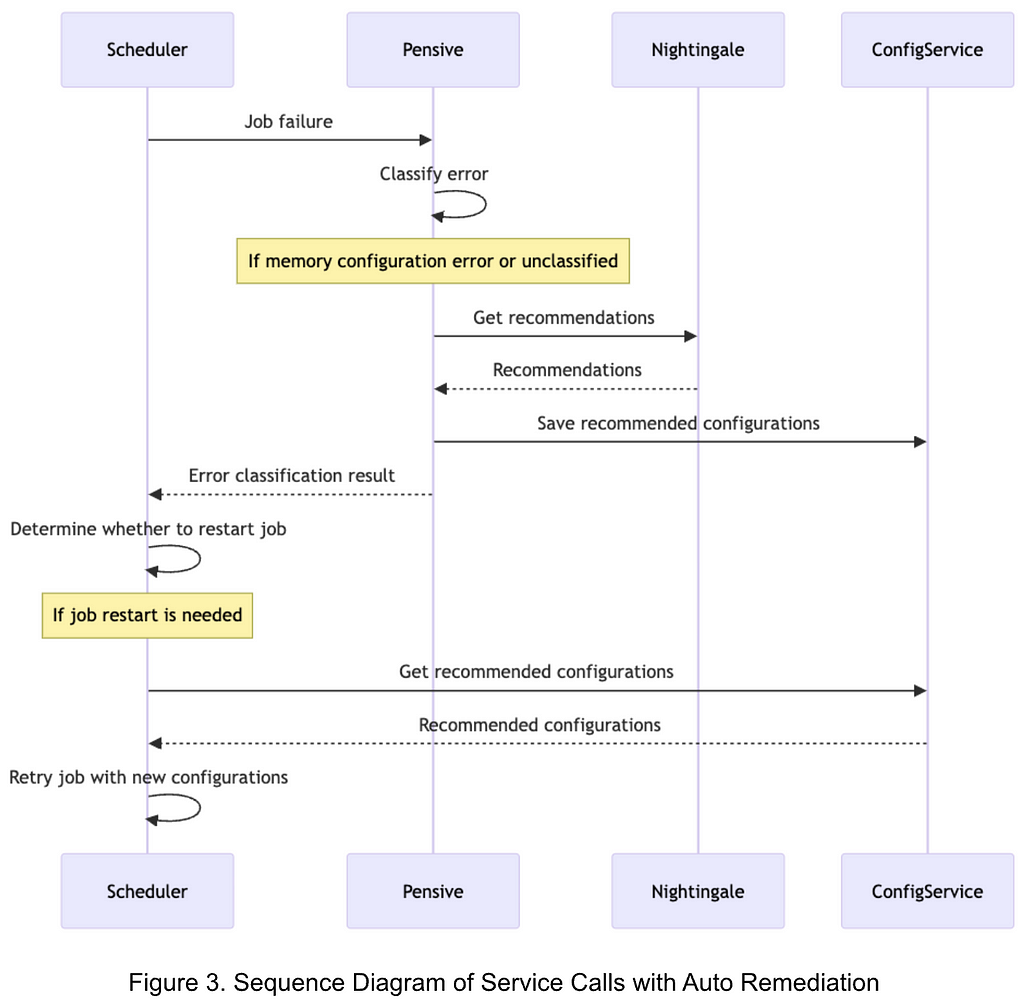
Figure 3 illustrates the sequence of service calls with Auto Remediation:

  1. Upon a job failure, Scheduler calls Pensive to get the error classification.
  2. Pensive classifies the error based on the rule-based classifier. If the error is identified to be a memory configuration error or an unclassified error, it calls Nightingale to get recommendations.
  3. With the obtained recommendations, Pensive updates the error classification result and saves the recommended configurations to ConfigService; and then returns the error classification result to Scheduler.
  4. Based on the error classification result received from Pensive, Scheduler determines whether to restart the job.
  5. Before restarting the job, Scheduler calls ConfigService to get the recommended configuration and retries the job with the new configuration.

Evolving to Auto Remediation: ML Service

Overview

The ML service, i.e., Nightingale, aims to generate a retry policy for a failed job that trades off between retry success probability and job running costs. It consists of two major components:

  • A prediction model that jointly estimates a) probability of retry success, and b) retry cost in dollars, conditional on properties of the retry.
  • An optimizer which explores the Spark configuration parameter space to recommend a configuration which minimizes a linear combination of retry failure probability and cost.

The prediction model is retrained offline daily, and is called by the optimizer to evaluate each candidate set of configuration parameter values. The optimizer runs in a RESTful service which is called upon job failure. If there is a feasible configuration solution from the optimization, the response includes this recommendation, which ConfigService uses to mutate the configuration for the retry. If there is no feasible solution–in other words, it is unlikely the retry will succeed by changing Spark configuration parameters alone–the response includes a flag to disable retries and thus eliminate wasted compute cost.

Prediction Model

Given that we want to explore how retry success and retry cost might change under different configuration scenarios, we need some way to predict these two values using the information we have about the job. Data Platform logs both retry success outcome and execution cost, giving us reliable labels to work with. Since we use a shared feature set to predict both targets, have good labels, and need to run inference quickly online to meet SLOs, we decided to formulate the problem as a multi-output supervised learning task. In particular, we use a simple Feedforward Multilayer Perceptron (MLP) with two heads, one to predict each outcome.

Training: Each record in the training set represents a potential retry which previously failed due to memory configuration errors or unclassified errors. The labels are: a) did retry fail, b) retry cost. The raw feature inputs are largely unstructured metadata about the job such as the Spark execution plan, the user who ran it, and the Spark configuration parameters and other job properties. We split these features into those that can be parsed into numeric values (e.g., Spark executor memory parameter) and those that cannot (e.g., user name). We used feature hashing to process the non-numeric values because they come from a high cardinality and dynamic set of values. We then create a lower dimensionality embedding which is concatenated with the normalized numeric values and passed through several more layers.

Inference: Upon passing validation audits, each new model version is stored in Metaflow Hosting, a service provided by our internal ML Platform. The optimizer makes several calls to the model prediction function for each incoming configuration recommendation request, described in more detail below.

Optimizer

When a job attempt fails, it sends a request to Nightingale with a job identifier. From this identifier, the service constructs the feature vector to be used in inference calls. As described previously, some of these features are Spark configuration parameters which are candidates to be mutated (e.g., spark.executor.memory, spark.executor.cores). The set of Spark configuration parameters was based on distilled knowledge of domain experts who work on Spark performance tuning extensively. We use Bayesian Optimization (implemented via Meta’s Ax library) to explore the configuration space and generate a recommendation. At each iteration, the optimizer generates a candidate parameter value combination (e.g., spark.executor.memory=7192 mb, spark.executor.cores=8), then evaluates that candidate by calling the prediction model to estimate retry failure probability and cost using the candidate configuration (i.e., mutating their values in the feature vector). After a fixed number of iterations is exhausted, the optimizer returns the “best” configuration solution (i.e., that which minimized the combined retry failure and cost objective) for ConfigService to use if it is feasible. If no feasible solution is found, we disable retries.

One downside of the iterative design of the optimizer is that any bottleneck can block completion and cause a timeout, which we initially observed in a non-trivial number of cases. Upon further profiling, we found that most of the latency came from the candidate generated step (i.e., figuring out which directions to step in the configuration space after the previous iteration’s evaluation results). We found that this issue had been raised to Ax library owners, who added GPU acceleration options in their API. Leveraging this option decreased our timeout rate substantially.

Rollout in Production

We have deployed Auto Remediation in production to handle memory configuration errors and unclassified errors for Spark jobs. Besides the retry success probability and cost efficiency, the impact on user experience is the major concern:

  • For memory configuration errors: Auto remediation improves user experience because the job retry is rarely successful without a new configuration for memory configuration errors. This means that a successful retry with the recommended configurations can reduce the operational loads and save job running costs, while a failed retry does not make the user experience worse.
  • For unclassified errors: Auto remediation recommends whether to restart the job if the error cannot be classified by existing rules in the rule-based classifier. In particular, if the ML model predicts that the retry is very likely to fail, it will recommend disabling the retry, which can save the job running costs for unnecessary retries. For cases in which the job is business-critical and the user prefers always retrying the job even if the retry success probability is low, we can add a new rule to the rule-based classifier so that the same error will be classified by the rule-based classifier next time, skipping the recommendations of the ML service. This presents the advantages of the integrated intelligence of the rule-based classifier and the ML service.

The deployment in production has demonstrated that Auto Remediation can provide effective configurations for memory configuration errors, successfully remediating about 56% of all memory configuration without human intervention. It also decreases compute cost of these jobs by about 50% because it can either recommend new configurations to make the retry successful or disable unnecessary retries. As tradeoffs between performance and cost efficiency are tunable, we can decide to achieve a higher success rate or more cost savings by tuning the ML service.

It is worth noting that the ML service is currently adopting a conservative policy to disable retries. As discussed above, this is to avoid the impact on the cases that users prefer always retrying the job upon job failures. Although these cases are expected and can be addressed by adding new rules to the rule-based classifier, we consider tuning the objective function in an incremental manner to gradually disable more retries is helpful to provide desirable user experience. Given the current policy to disable retries is conservative, Auto Remediation presents a great potential to eventually bring much more cost savings without affecting the user experience.

Beyond Error Handling: Towards Right Sizing

Auto Remediation is our first step in leveraging data insights and Machine Learning (ML) for improving user experience, reducing the operational burden, and improving cost efficiency of the data platform. It focuses on automating the remediation of failed jobs, but also paves the path to automate operations other than error handling.

One of the initiatives we are taking, called Right Sizing, is to reconfigure scheduled big data jobs to request the proper resources for job execution. For example, we have noted that the average requested executor memory of Spark jobs is about four times their max used memory, indicating a significant overprovision. In addition to the configurations of the job itself, the resource overprovision of the container that is requested to execute the job can also be reduced for cost savings. With heuristic- and ML-based methods, we can infer the proper configurations of job execution to minimize resource overprovisions and save millions of dollars per year without affecting the performance. Similar to Auto Remediation, these configurations can be automatically applied via ConfigService without human intervention. Right Sizing is in progress and will be covered with more details in a dedicated technical blog post later. Stay tuned.

Acknowledgements

Auto Remediation is a joint work of the engineers from different teams and organizations. This work would have not been possible without the solid, in-depth collaborations. We would like to appreciate all folks, including Spark experts, data scientists, ML engineers, the scheduler and job orchestrator engineers, data engineers, and support engineers, for sharing the context and providing constructive suggestions and valuable feedback (e.g., John Zhuge, Jun He, Holden Karau, Samarth Jain, Julian Jaffe, Batul Shajapurwala, Michael Sachs, Faisal Siddiqi).


Evolving from Rule-based Classifier: Machine Learning Powered Auto Remediation in Netflix Data… was originally published in Netflix TechBlog on Medium, where people are continuing the conversation by highlighting and responding to this story.