Post Syndicated from Sheila Busser original https://aws.amazon.com/blogs/compute/optimizing-gpu-utilization-for-ai-ml-workloads-on-amazon-ec2/
This blog post is written by Ben Minahan, DevOps Consultant, and Amir Sotoodeh, Machine Learning Engineer.
Machine learning workloads can be costly, and artificial intelligence/machine learning (AI/ML) teams can have a difficult time tracking and maintaining efficient resource utilization. ML workloads often utilize GPUs extensively, so typical application performance metrics such as CPU, memory, and disk usage don’t paint the full picture when it comes to system performance. Additionally, data scientists conduct long-running experiments and model training activities on existing compute instances that fit their unique specifications. Forcing these experiments to be run on newly provisioned infrastructure with proper monitoring systems installed might not be a viable option.
In this post, we describe how to track GPU utilization across all of your AI/ML workloads and enable accurate capacity planning without needing teams to use a custom Amazon Machine Image (AMI) or to re-deploy their existing infrastructure. You can use Amazon CloudWatch to track GPU utilization, and leverage AWS Systems Manager Run Command to install and configure the agent across your existing fleet of GPU-enabled instances.
Overview
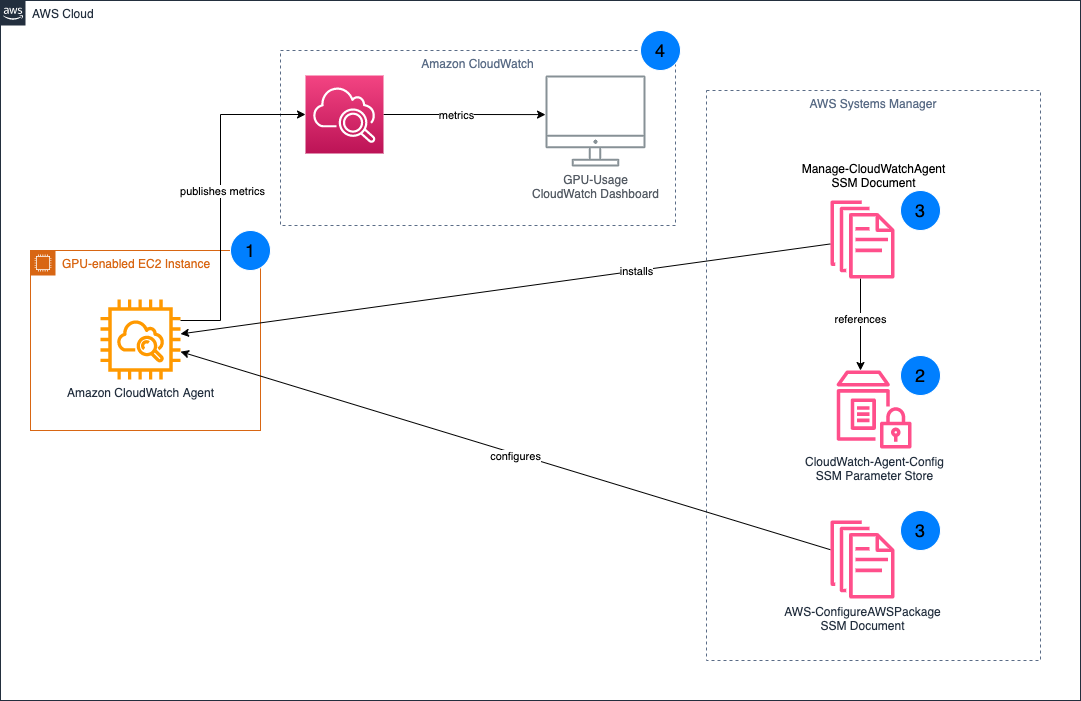
First, make sure that your existing Amazon Elastic Compute Cloud (Amazon EC2) instances have the Systems Manager Agent installed, and also have the appropriate level of AWS Identity and Access Management (IAM) permissions to run the Amazon CloudWatch Agent. Next, specify the configuration for the CloudWatch Agent in Systems Manager Parameter Store, and then deploy the CloudWatch Agent to our GPU-enabled EC2 instances. Finally, create a CloudWatch Dashboard to analyze GPU utilization.

- Install the CloudWatch Agent on your existing GPU-enabled EC2 instances.
- Your CloudWatch Agent configuration is stored in Systems Manager Parameter Store.
- Systems Manager Documents are used to install and configure the CloudWatch Agent on your EC2 instances.
- GPU metrics are published to CloudWatch, which you can then visualize through the CloudWatch Dashboard.
Prerequisites
This post assumes you already have GPU-enabled EC2 workloads running in your AWS account. If the EC2 instance doesn’t have any GPUs, then the custom configuration won’t be applied to the CloudWatch Agent. Instead, the default configuration is used. For those instances, leveraging the CloudWatch Agent’s default configuration is better suited for tracking resource utilization.
For the CloudWatch Agent to collect your instance’s GPU metrics, the proper NVIDIA drivers must be installed on your instance. Several AWS official AMIs including the Deep Learning AMI already have these drivers installed. To see a list of AMIs with the NVIDIA drivers pre-installed, and for full installation instructions for Linux-based instances, see Install NVIDIA drivers on Linux instances.
Additionally, deploying and managing the CloudWatch Agent requires the instances to be running. If your instances are currently stopped, then you must start them to follow the instructions outlined in this post.
Preparing your EC2 instances
You utilize Systems Manager to deploy the CloudWatch Agent, so make sure that your EC2 instances have the Systems Manager Agent installed. Many AWS-provided AMIs already have the Systems Manager Agent installed. For a full list of the AMIs which have the Systems Manager Agent pre-installed, see Amazon Machine Images (AMIs) with SSM Agent preinstalled. If your AMI doesn’t have the Systems Manager Agent installed, see Working with SSM Agent for instructions on installing based on your operating system (OS).
Once installed, the CloudWatch Agent needs certain permissions to accept commands from Systems Manager, read Systems Manager Parameter Store entries, and publish metrics to CloudWatch. These permissions are bundled into the managed IAM policies AmazonEC2RoleforSSM, AmazonSSMReadOnlyAccess, and CloudWatchAgentServerPolicy. To create a new IAM role and associated IAM instance profile with these policies attached, you can run the following AWS Command Line Interface (AWS CLI) commands, replacing <REGION_NAME> with your AWS region, and <INSTANCE_ID> with the EC2 Instance ID that you want to associate with the instance profile:
aws iam create-role --role-name CloudWatch-Agent-Role --assume-role-policy-document  '{"Statement":{"Effect":"Allow","Principal":{"Service":"ec2.amazonaws.com"},"Action":"sts:AssumeRole"}}'
aws iam attach-role-policy --role-name CloudWatch-Agent-Role --policy-arn arn:aws:iam::aws:policy/service-role/AmazonEC2RoleforSSM
aws iam attach-role-policy --role-name CloudWatch-Agent-Role --policy-arn arn:aws:iam::aws:policy/AmazonSSMReadOnlyAccess
aws iam attach-role-policy --role-name CloudWatch-Agent-Role --policy-arn arn:aws:iam::aws:policy/CloudWatchAgentServerPolicy
aws iam create-instance-profile --instance-profile-name CloudWatch-Agent-Instance-Profile
aws iam add-role-to-instance-profile --instance-profile-name CloudWatch-Agent-Instance-Profile --role-name CloudWatch-Agent-Role
aws ec2 associate-iam-instance-profile --region <REGION_NAME> --instance-id <INSTANCE_ID> --iam-instance-profile Name=CloudWatch-Agent-Instance-Profile
Alternatively, you can attach the IAM policies to your existing IAM role associated with an existing IAM instance profile.
aws iam attach-role-policy --role-name <ROLE_NAME> --policy-arn arn:aws:iam::aws:policy/service-role/AmazonEC2RoleforSSM
aws iam attach-role-policy --role-name <ROLE_NAME> --policy-arn arn:aws:iam::aws:policy/AmazonSSMReadOnlyAccess
aws iam attach-role-policy --role-name <ROLE_NAME> --policy-arn arn:aws:iam::aws:policy/CloudWatchAgentServerPolicy
aws ec2 associate-iam-instance-profile --region <REGION_NAME> --instance-id <INSTANCE_ID> --iam-instance-profile Name=<INSTANCE_PROFILE>
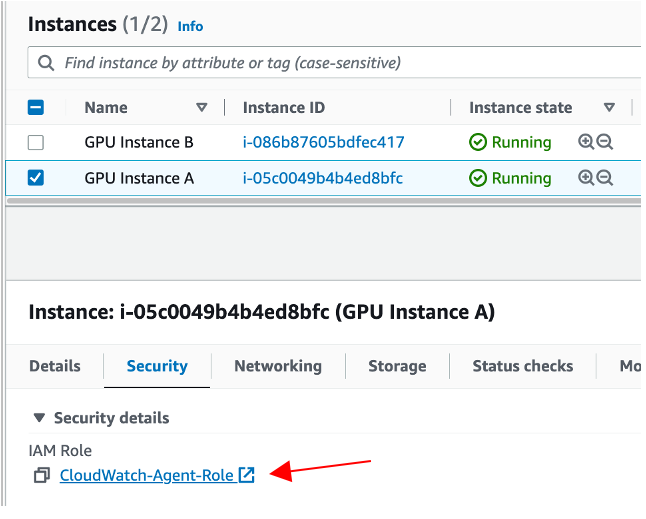
Once complete, you should see that your EC2 instance is associated with the appropriate IAM role.

This role should have the AmazonEC2RoleforSSM, AmazonSSMReadOnlyAccess and CloudWatchAgentServerPolicy IAM policies attached.

Configuring and deploying the CloudWatch Agent
Before deploying the CloudWatch Agent onto our EC2 instances, make sure that those agents are properly configured to collect GPU metrics. To do this, you must create a CloudWatch Agent configuration and store it in Systems Manager Parameter Store.
Copy the following into a file cloudwatch-agent-config.json:
{
    "agent": {
        "metrics_collection_interval": 60,
        "run_as_user": "cwagent"
    },
    "metrics": {
        "aggregation_dimensions": [
            [
                "InstanceId"
            ]
        ],
        "append_dimensions": {
            "AutoScalingGroupName": "${aws:AutoScalingGroupName}",
            "ImageId": "${aws:ImageId}",
            "InstanceId": "${aws:InstanceId}",
            "InstanceType": "${aws:InstanceType}"
        },
        "metrics_collected": {
            "cpu": {
                "measurement": [
                    "cpu_usage_idle",
                    "cpu_usage_iowait",
                    "cpu_usage_user",
                    "cpu_usage_system"
                ],
                "metrics_collection_interval": 60,
                "resources": [
                    "*"
                ],
                "totalcpu": false
            },
            "disk": {
                "measurement": [
                    "used_percent",
                    "inodes_free"
                ],
                "metrics_collection_interval": 60,
                "resources": [
                    "*"
                ]
            },
            "diskio": {
                "measurement": [
                    "io_time"
                ],
                "metrics_collection_interval": 60,
                "resources": [
                    "*"
                ]
            },
            "mem": {
                "measurement": [
                    "mem_used_percent"
                ],
                "metrics_collection_interval": 60
            },
            "swap": {
                "measurement": [
                    "swap_used_percent"
                ],
                "metrics_collection_interval": 60
            },
            "nvidia_gpu": {
                "measurement": [
                    "utilization_gpu",
                    "temperature_gpu",
                    "utilization_memory",
                    "fan_speed",
                    "memory_total",
                    "memory_used",
                    "memory_free",
                    "pcie_link_gen_current",
                    "pcie_link_width_current",
                    "encoder_stats_session_count",
                    "encoder_stats_average_fps",
                    "encoder_stats_average_latency",
                    "clocks_current_graphics",
                    "clocks_current_sm",
                    "clocks_current_memory",
                    "clocks_current_video"
                ],
                "metrics_collection_interval": 60
            }
        }
    }
}
Run the following AWS CLI command to deploy a Systems Manager Parameter CloudWatch-Agent-Config, which contains a minimal agent configuration for GPU metrics collection. Replace <REGION_NAME> with your AWS Region.
aws ssm put-parameter \
--region <REGION_NAME> \
--name CloudWatch-Agent-Config \
--type String \
--value file://cloudwatch-agent-config.json
Now you can see a CloudWatch-Agent-Config parameter in Systems Manager Parameter Store, containing your CloudWatch Agent’s JSON configuration.

Next, install the CloudWatch Agent on your EC2 instances. To do this, you can leverage Systems Manager Run Command, specifically the AWS-ConfigureAWSPackage document which automates the CloudWatch Agent installation.
- Run the following AWS CLI command, replacing <REGION_NAME> with the Region into which your instances are deployed, and <INSTANCE_ID> with the EC2 Instance ID on which you want to install the CloudWatch Agent.
aws ssm send-command \
--query 'Command.CommandId' \
--region <REGION_NAME> \
--instance-ids <INSTANCE_ID> \
--document-name AWS-ConfigureAWSPackage \
--parameters '{"action":["Install"],"installationType":["In-place update"],"version":["latest"],"name":["AmazonCloudWatchAgent"]}'
2. To monitor the status of your command, use the get-command-invocation AWS CLI command. Replace <COMMAND_ID> with the command ID output from the previous step, <REGION_NAME> with your AWS region, and <INSTANCE_ID> with your EC2 instance ID.
aws ssm get-command-invocation --query Status --region <REGION_NAME> --command-id <COMMAND_ID> --instance-id <INSTANCE_ID>
3.Wait for the command to show the status Success before proceeding.
$ aws ssm send-command \
	 --query 'Command.CommandId' \
    --region us-east-2 \
    --instance-ids i-0123456789abcdef \
    --document-name AWS-ConfigureAWSPackage \
    --parameters '{"action":["Install"],"installationType":["Uninstall and reinstall"],"version":["latest"],"additionalArguments":["{}"],"name":["AmazonCloudWatchAgent"]}'

"5d8419db-9c48-434c-8460-0519640046cf"

$ aws ssm get-command-invocation --query Status --region us-east-2 --command-id 5d8419db-9c48-434c-8460-0519640046cf --instance-id i-0123456789abcdef

"Success"
Repeat this process for all EC2 instances on which you want to install the CloudWatch Agent.
Next, configure the CloudWatch Agent installation. For this, once again leverage Systems Manager Run Command. However, this time the AmazonCloudWatch-ManageAgent document which applies your custom agent configuration is stored in the Systems Manager Parameter Store to your deployed agents.
- Run the following AWS CLI command, replacing <REGION_NAME> with the Region into which your instances are deployed, and <INSTANCE_ID> with the EC2 Instance ID on which you want to configure the CloudWatch Agent.
aws ssm send-command \
--query 'Command.CommandId' \
--region <REGION_NAME> \
--instance-ids <INSTANCE_ID> \
--document-name AmazonCloudWatch-ManageAgent \
--parameters '{"action":["configure"],"mode":["ec2"],"optionalConfigurationSource":["ssm"],"optionalConfigurationLocation":["/CloudWatch-Agent-Config"],"optionalRestart":["yes"]}'
2. To monitor the status of your command, utilize the get-command-invocation AWS CLI command. Replace <COMMAND_ID> with the command ID output from the previous step, <REGION_NAME> with your AWS region, and <INSTANCE_ID> with your EC2 instance ID.
aws ssm get-command-invocation --query Status --region <REGION_NAME> --command-id <COMMAND_ID> --instance-id <INSTANCE_ID>
3. Wait for the command to show the status Success before proceeding.
$ aws ssm send-command \
    --query 'Command.CommandId' \
    --region us-east-2 \
    --instance-ids i-0123456789abcdef \
    --document-name AmazonCloudWatch-ManageAgent \
    --parameters '{"action":["configure"],"mode":["ec2"],"optionalConfigurationSource":["ssm"],"optionalConfigurationLocation":["/CloudWatch-Agent-Config"],"optionalRestart":["yes"]}'

"9a4a5c43-0795-4fd3-afed-490873eaca63"

$ aws ssm get-command-invocation --query Status --region us-east-2 --command-id 9a4a5c43-0795-4fd3-afed-490873eaca63 --instance-id i-0123456789abcdef

"Success"
Repeat this process for all EC2 instances on which you want to install the CloudWatch Agent. Once finished, the CloudWatch Agent installation and configuration is complete, and your EC2 instances now report GPU metrics to CloudWatch.
Visualize your instance’s GPU metrics in CloudWatch
Now that your GPU-enabled EC2 Instances are publishing their utilization metrics to CloudWatch, you can visualize and analyze these metrics to better understand your resource utilization patterns.
The GPU metrics collected by the CloudWatch Agent are within the CWAgent namespace. Explore your GPU metrics using the CloudWatch Metrics Explorer, or deploy our provided sample dashboard.
- Copy the following into a file, cloudwatch-dashboard.json, replacing instances of <REGION_NAME> with your Region:
{
    "widgets": [
        {
            "height": 10,
            "width": 24,
            "y": 16,
            "x": 0,
            "type": "metric",
            "properties": {
                "metrics": [
                    [{"expression": "SELECT AVG(nvidia_smi_utilization_gpu) FROM SCHEMA(\"CWAgent\", InstanceId) GROUP BY InstanceId","id": "q1"}]
                ],
                "view": "timeSeries",
                "stacked": false,
                "region": "<REGION_NAME>",
                "stat": "Average",
                "period": 300,
                "title": "GPU Core Utilization",
                "yAxis": {
                    "left": {"label": "Percent","max": 100,"min": 0,"showUnits": false}
                }
            }
        },
        {
            "height": 7,
            "width": 8,
            "y": 0,
            "x": 0,
            "type": "metric",
            "properties": {
                "metrics": [
                    [{"expression": "SELECT AVG(nvidia_smi_utilization_gpu) FROM SCHEMA(\"CWAgent\", InstanceId)", "label": "Utilization","id": "q1"}]
                ],
                "view": "gauge",
                "stacked": false,
                "region": "<REGION_NAME>",
                "stat": "Average",
                "period": 300,
                "title": "Average GPU Core Utilization",
                "yAxis": {"left": {"max": 100, "min": 0}
                },
                "liveData": false
            }
        },
        {
            "height": 9,
            "width": 24,
            "y": 7,
            "x": 0,
            "type": "metric",
            "properties": {
                "metrics": [
                    [{ "expression": "SEARCH(' MetricName=\"nvidia_smi_memory_used\" {\"CWAgent\", InstanceId} ', 'Average')", "id": "m1", "visible": false }],
                    [{ "expression": "SEARCH(' MetricName=\"nvidia_smi_memory_total\" {\"CWAgent\", InstanceId} ', 'Average')", "id": "m2", "visible": false }],
                    [{ "expression": "SEARCH(' MetricName=\"mem_used_percent\" {CWAgent, InstanceId} ', 'Average')", "id": "m3", "visible": false }],
                    [{ "expression": "100*AVG(m1)/AVG(m2)", "label": "GPU", "id": "e2", "color": "#17becf" }],
                    [{ "expression": "AVG(m3)", "label": "RAM", "id": "e3" }]
                ],
                "view": "timeSeries",
                "stacked": false,
                "region": "<REGION_NAME>",
                "stat": "Average",
                "period": 300,
                "yAxis": {
                    "left": {"min": 0,"max": 100,"label": "Percent","showUnits": false}
                },
                "title": "Average Memory Utilization"
            }
        },
        {
            "height": 7,
            "width": 8,
            "y": 0,
            "x": 8,
            "type": "metric",
            "properties": {
                "metrics": [
                    [ { "expression": "SEARCH(' MetricName=\"nvidia_smi_memory_used\" {\"CWAgent\", InstanceId} ', 'Average')", "id": "m1", "visible": false } ],
                    [ { "expression": "SEARCH(' MetricName=\"nvidia_smi_memory_total\" {\"CWAgent\", InstanceId} ', 'Average')", "id": "m2", "visible": false } ],
                    [ { "expression": "100*AVG(m1)/AVG(m2)", "label": "Utilization", "id": "e2" } ]
                ],
                "sparkline": true,
                "view": "gauge",
                "region": "<REGION_NAME>",
                "stat": "Average",
                "period": 300,
                "yAxis": {
                    "left": {"min": 0,"max": 100}
                },
                "liveData": false,
                "title": "GPU Memory Utilization"
            }
        }
    ]
}
2. run the following AWS CLI command, replacing <REGION_NAME> with the name of your Region:
aws cloudwatch put-dashboard \
    --region <REGION_NAME> \
    --dashboard-name My-GPU-Usage \
    --dashboard-body file://cloudwatch-dashboard.json
View the My-GPU-Usage CloudWatch dashboard in the CloudWatch console for your AWS region..

Cleaning Up
To avoid incurring future costs for resources created by following along in this post, delete the following:
- My-GPU-Usage CloudWatch Dashboard
- CloudWatch-Agent-Config Systems Manager Parameter
- CloudWatch-Agent-Role IAM Role
Conclusion
By following along with this post, you deployed and configured the CloudWatch Agent across your GPU-enabled EC2 instances to track GPU utilization without pausing in-progress experiments and model training. Then, you visualized the GPU utilization of your workloads with a CloudWatch Dashboard to better understand your workload’s GPU usage and make more informed scaling and cost decisions. For other ways that Amazon CloudWatch can improve your organization’s operational insights, see the Amazon CloudWatch documentation.