Post Syndicated from Netflix Technology Blog original https://medium.com/netflix-techblog/the-data-canary-how-netflix-validates-catalog-metadata-18b699d58e36
At Netflix, our catalog metadata is crucial to our member experience, and a single corrupted data state can impact millions of viewers immediately. To protect streaming reliability, we built an automated data canary system that validates data transformations using production traffic. This canary detects issues in under 10 minutes, and blocks bad data from reaching our members.
Intro
Catalog metadata is what makes Netflix functional. It defines what titles exist, where they’re available, whether they can be played, and more. This data gets transformed and distributed across our vast infrastructure near-continuously, powering everything that helps members find what they want to watch. Accurate catalog data delivers moments of joy. Corrupted catalog data breaks streaming.
What Went Wrong
A production incident revealed a critical gap in our resilience strategy. No code had been deployed. No configuration had changed. But, a manual mitigation action taken during a previous incident had inadvertently corrupted a data feed, rendering it empty for a subset of titles.
The impact was immediate: missing metadata prevented manifest generation, causing failures in our catalog service and playback issues.
Engineers were alerted immediately, but identifying the root cause took time. After intense triaging, responders pinpointed the corrupted data feed and pinned services back to a known-good state, restoring playback.
The problem? Our sophisticated code canary deployments had caught nothing. No code had changed — the data had.
This incident exposed a fundamental gap in our resiliency capabilities: we can validate code deployments, but we had no equivalent for our high-velocity data pipelines. Our catalog metadata, consisting of titles, artwork, availability, and more, was continuously transformed from multiple upstream sources and published at a regular cadence. Each upstream source had its own validation, but these checks didn’t catch corruption in the final transformed output.
We needed to treat data deployments with the same rigor as code deployments.
The Challenge: Validating Data at Short Intervals
Our catalog metadata service operates as a high-velocity data pipeline: it processes multiple input feeds, transforms them, and publishes the final catalog state that gets distributed across our infrastructure.
This creates unique validation challenges that our traditional canary analysis tools aren’t designed to handle:
Time Constraints: Our existing canary analysis tools require 30–60 minutes to reach statistical confidence. We had a much shorter window between data cycles; we needed to detect issues, make a decision, and block publishing all within a single cycle.
Emergent Issues: While each upstream data source has independent validation, problems often only manifest in the final transformed state. We needed to validate the actual output that clients would consume, not just the inputs, as close to the clients as possible.
Production Traffic is Essential: We initially considered shadow traffic, but quickly realized it was insufficient. Shadow traffic can only replay requests to our catalog metadata service; it can’t simulate the entire playback lifecycle across multiple services and domains. To detect real customer impact, we needed real production traffic.
Limit Blast Radius: Despite using production traffic for validation, we couldn’t allow customers to experience widespread issues during the validation process. Any regression needed to be detected and contained immediately.
Our Solution: The Data Canary Orchestrator Pattern
After evaluating several architectural approaches, we developed a solution built around three key innovations:
1. Dedicated Orchestrator Pattern
We created a dedicated cluster for the purposes of canarying new catalog metadata that separates concerns, avoids self-testing, and provides a pattern for extensibility. Here’s how it works:
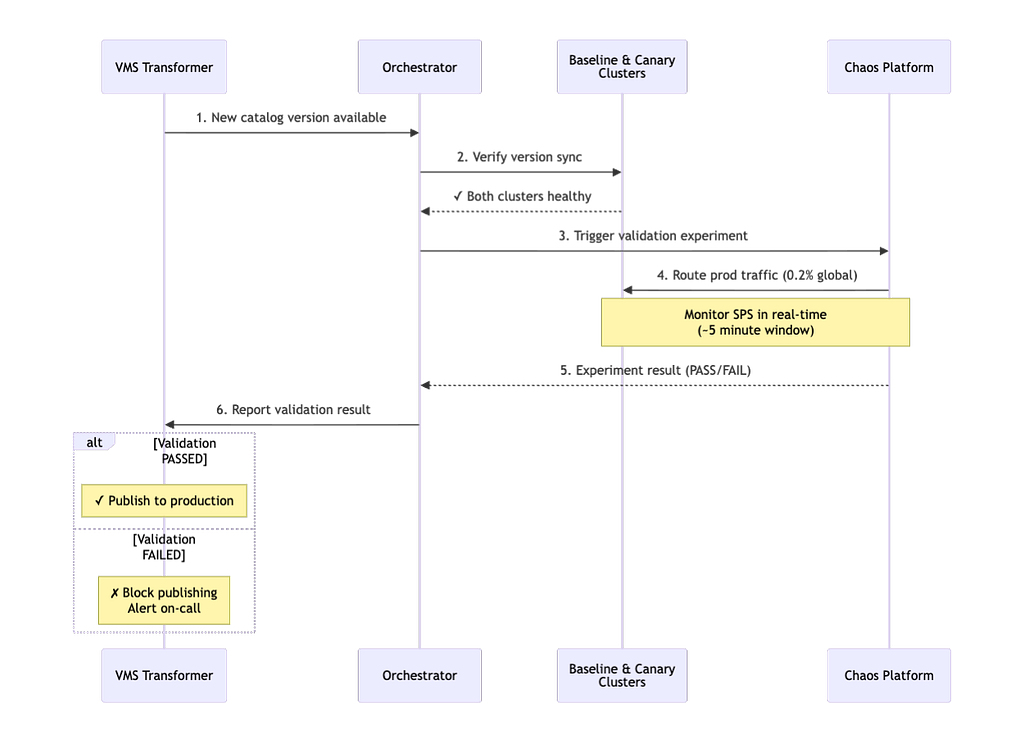
Orchestrator Instance: A dedicated orchestrator instance of our catalog metadata service coordinates the data canary flow. When a new catalog version is published to the canary environment, the orchestrator validates that both baseline and canary clusters are healthy and version-synchronized, then triggers a chaos experiment.
Permanent Baseline & Canary Clusters: Two dedicated service clusters run continuously in our canary region. The baseline cluster always serves the latest production catalog version, while the canary cluster receives new versions for validation.
Generic Integration Point: Upon chaos experiment completion, the orchestrator reports results back to the transformer service via a REST endpoint. This generic interface means new data sources can implement their own orchestrator patterns without requiring transformer code changes.
This pattern can now be adopted by other teams at Netflix for validating different data sources, which is exactly the kind of extensibility we designed for.
2. Utilizing and Extending our Chaos Platform
Meeting the 10-minute constraint required not only leaning on our chaos platform, but also extending it to meet our needs:
Custom Threshold Tuning: We worked with our Resilience team to customize experiment thresholds for our use case. Standard chaos experiment thresholds were too conservative for our time constraints.
Multi-Tenant Testing: Our catalog service supports multiple client types with different traffic patterns and downstream dependencies. We ran separate experiments for major client types and discovered that running traffic through the tenant that handles playback requests consistently identified failures fastest.
Sticky Canaries: To isolate experiment traffic, sticky canaries use session affinity to guarantee that once a user’s traffic is routed to the baseline or canary clusters, it stays there for the duration of the experiment window. This prevents cross-contamination from concurrent chaos experiments, ensuring a clean apples-to-apples comparison between data versions.
Behavioral Metrics Over Technical Metrics: We focused on Starts Per Second (SPS), or actual customer playback attempts, as our primary signal. SPS proved more reliable than latency or error rates for detecting catalog corruption because it directly measures customer impact, and data errors may not always manifest as application errors to our catalog metadata service.
Immediate Abort on Regression: Instead of collecting data for post-hoc analysis, we stream metrics in real-time and abort experiments the moment we detect regression. This trades some statistical confidence for speed, but our tight thresholds and clear signal make this not only acceptable, but necessary.
3. Production-Hardened Edge Case Handling
Building a system that runs in production every 10 minutes taught us that the devil is in the details:
In-Flight Experiments During Redeployment: When the orchestrator restarts, it must detect and continue polling any ongoing experiments, as we can’t abandon a validation cycle mid-flight.
Leader Election: During orchestrator deployments, multiple instances might be running simultaneously. We implemented safeguards to ensure only one experiment is triggered per version announcement.
Version Synchronization: In a multi-tenant service where different clients consume data at different cadences, we track version state to ensure baseline and canary clusters are properly aligned before triggering experiments.
Validating the Validator: Controlled Failure Injection
To prove the system worked, we needed to break things on purpose. We ran a series of controlled experiments where we deliberately corrupted catalog data — denylisting high-profile titles and simulating real data corruption scenarios — to validate that the canary could detect issues and block publication.
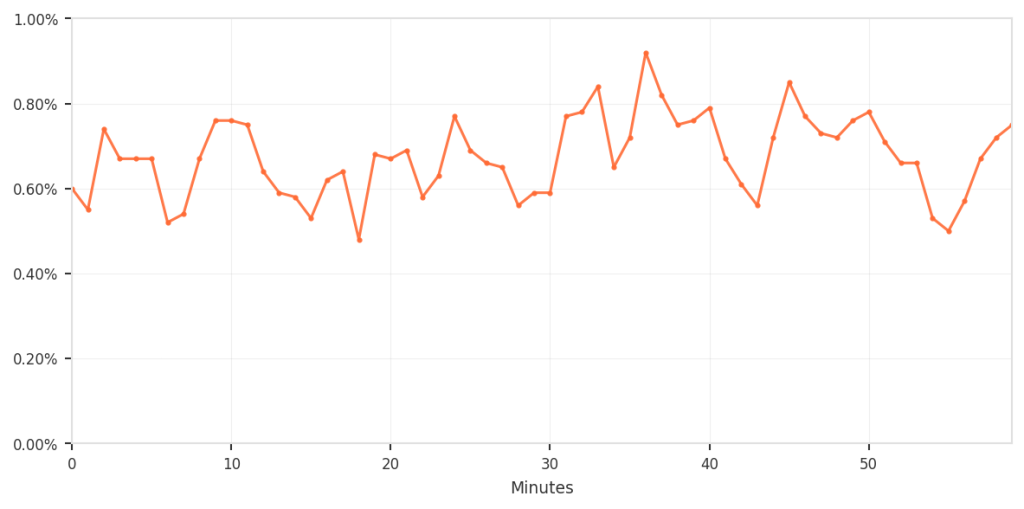
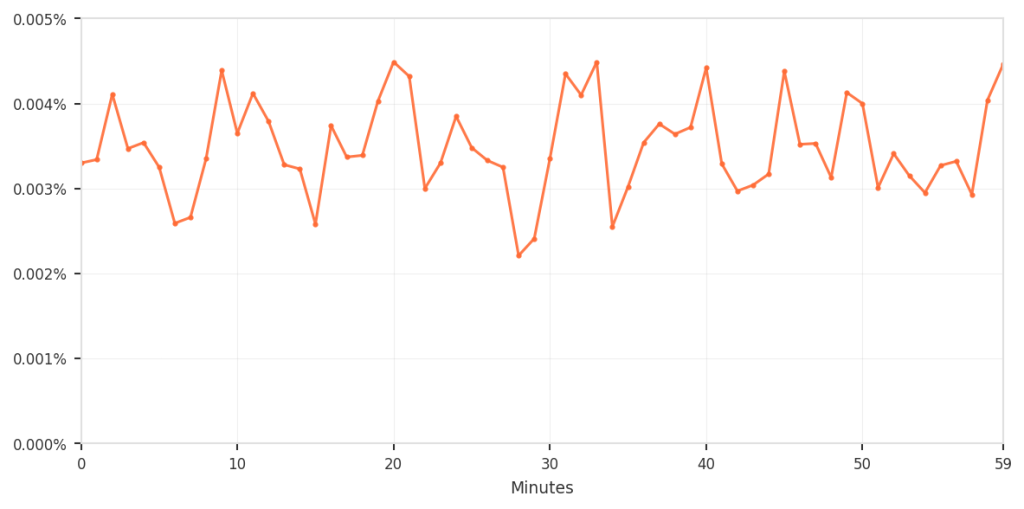
These experiments were coordinated as proactive incidents during business hours, with product operations teams on standby. We routed approximately 0.2% of global traffic through the validation flow, minimizing blast radius while still generating meaningful signal.
Key Results:
- Detection Speed: Issues identified in 2.5–4 minutes depending on client type
- Clear Signal: 10x error differential between canary and baseline
- Automatic Blocking: Publishing workflow blocked as designed when regressions detected
The experiments validated our end-to-end workflow and revealed important operational insights: different client traffic patterns detect failures at different speeds, and threshold tuning requires careful refinement based on the magnitude of impact we want this system to detect. Most importantly, they proved that even with a 10-minute validation window, far shorter than traditional 30–60 minute canary analysis, we had sufficient signal to catch high-impact catalog corruption.
Bringing Code Validation Principles to Data
This effort wasn’t just about building a validation system, it was about recognizing that data deployments deserve the same rigor as code deployments. Just because something isn’t a binary doesn’t mean it can’t break production. The patterns we landed on aren’t specific to catalog metadata, and can be applied to systems with high-velocity data pipelines more broadly.
If you’re working with data that changes frequently and impacts customers directly, ask yourself:
- What’s your MTTD for data corruption?
- Can you validate with production traffic safely?
- How would you detect emergent issues in transformed data?
- What behavioral metric most closely indicates customer impact in your domain?
Today, the failure mode that caused the aforementioned incident would be caught and mitigated in under 10 minutes. We all know outages aren’t a question of if, but when. The next time you find yourself faced with bad data, how fast will you be able to respond?
Acknowledgments
This work was a collaborative effort across multiple teams at Netflix. Special thanks to Jongyoon Lee, David Su, and Zubeen Lalani of the Catalog Foundations & Distribution team for their contributions to the design, and to Ales Plsek of the Resilience team for their support in customizing our chaos platform for our unique use case.

The Data Canary: How Netflix Validates Catalog Metadata was originally published in Netflix TechBlog on Medium, where people are continuing the conversation by highlighting and responding to this story.