Tag Archives: Digital Experience Monitoring

Understanding end user-connectivity and performance with Digital Experience Monitoring, now available in beta

Post Syndicated from Shruti Pokalori Nejad original http://blog.cloudflare.com/digital-experience-monitoring-beta/

Understanding end user-connectivity and performance with Digital Experience Monitoring, now available in beta

Understanding end user-connectivity and performance with Digital Experience Monitoring, now available in beta

Organizations that replace their corporate network and security appliances with a cloud-based solution trust that provider with how their employees work each and every day. Cloudflare One, our comprehensive Secure Access Service Edge (SASE) offering, helps more than 10,000 organizations deploy a remote access and Internet security solution that is faster than industry competitors. Starting today, administrators can measure that experience on their own and hold us accountable to that standard.

Cloudflare’s Digital Experience Monitoring (DEX) product gives teams of any size the same toolkit that we use to measure our own global network that powers nearly one-fourth of the Internet each day. Customers of Cloudflare One can now measure the experience that their team members have connecting to the Internet – whether they need that data for troubleshooting, evaluating carrier and ISP performance, or just understanding how their employees work.

We are excited to share today that DEX is now in open beta for all Cloudflare One customers. Administrators can begin running tests and evaluating network performance with any device enrolled using the Cloudflare One agent. Today’s announcement opens up these tools to every customer, but we are just getting started – we want your feedback to help us continue to improve the experience as we build more observability into Cloudflare’s SASE solution.

Monitor performance & availability of public or private applications with Synthetic Application Monitoring

Picture this: you're at the helm of a diverse team, using Google Mail as their main communication hub. When everyone worked from the same office, spotting a slowdown with Google Mail or its provider was relatively straightforward. But in today's remote environment, ensuring the consistent performance of such a critical resource can become a labyrinthine task.

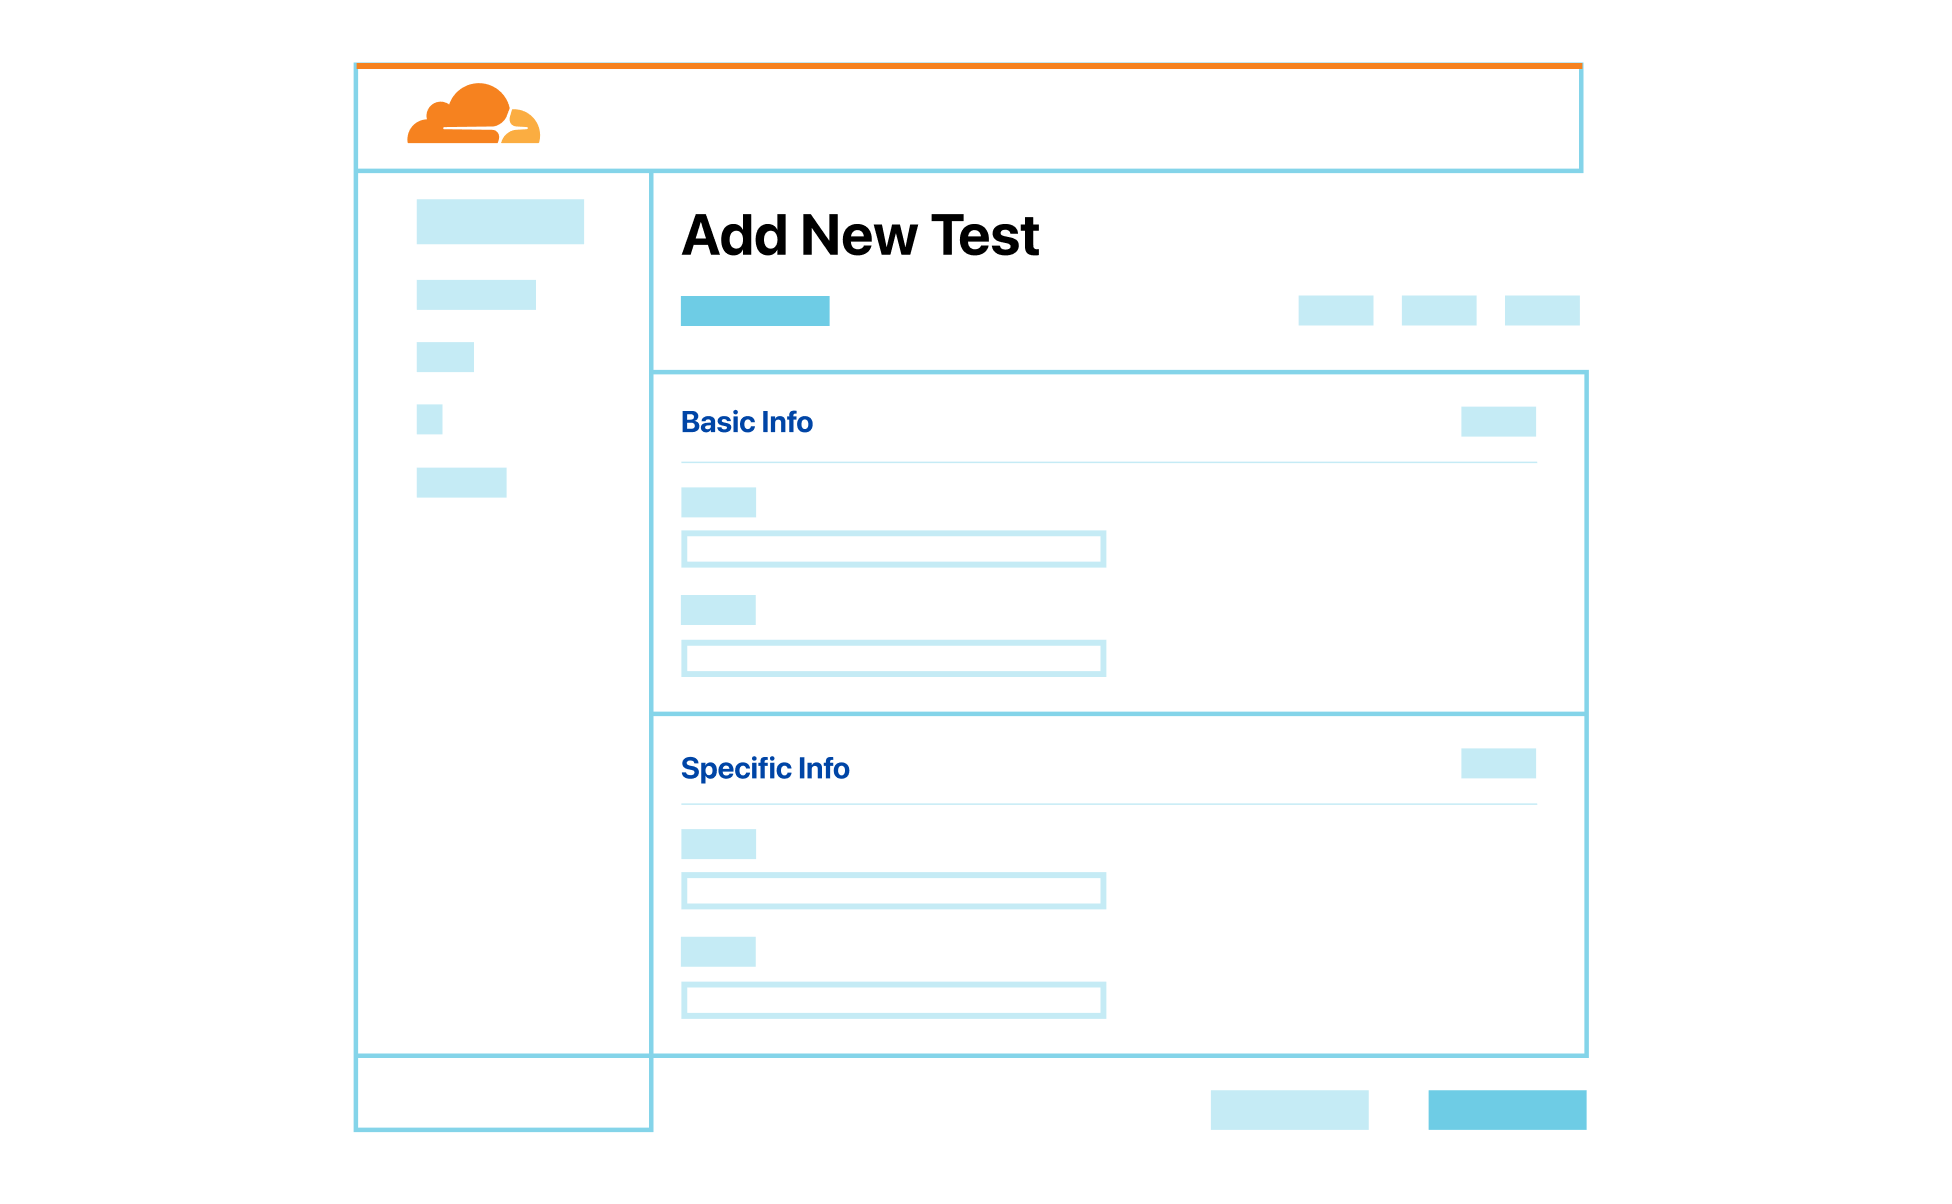
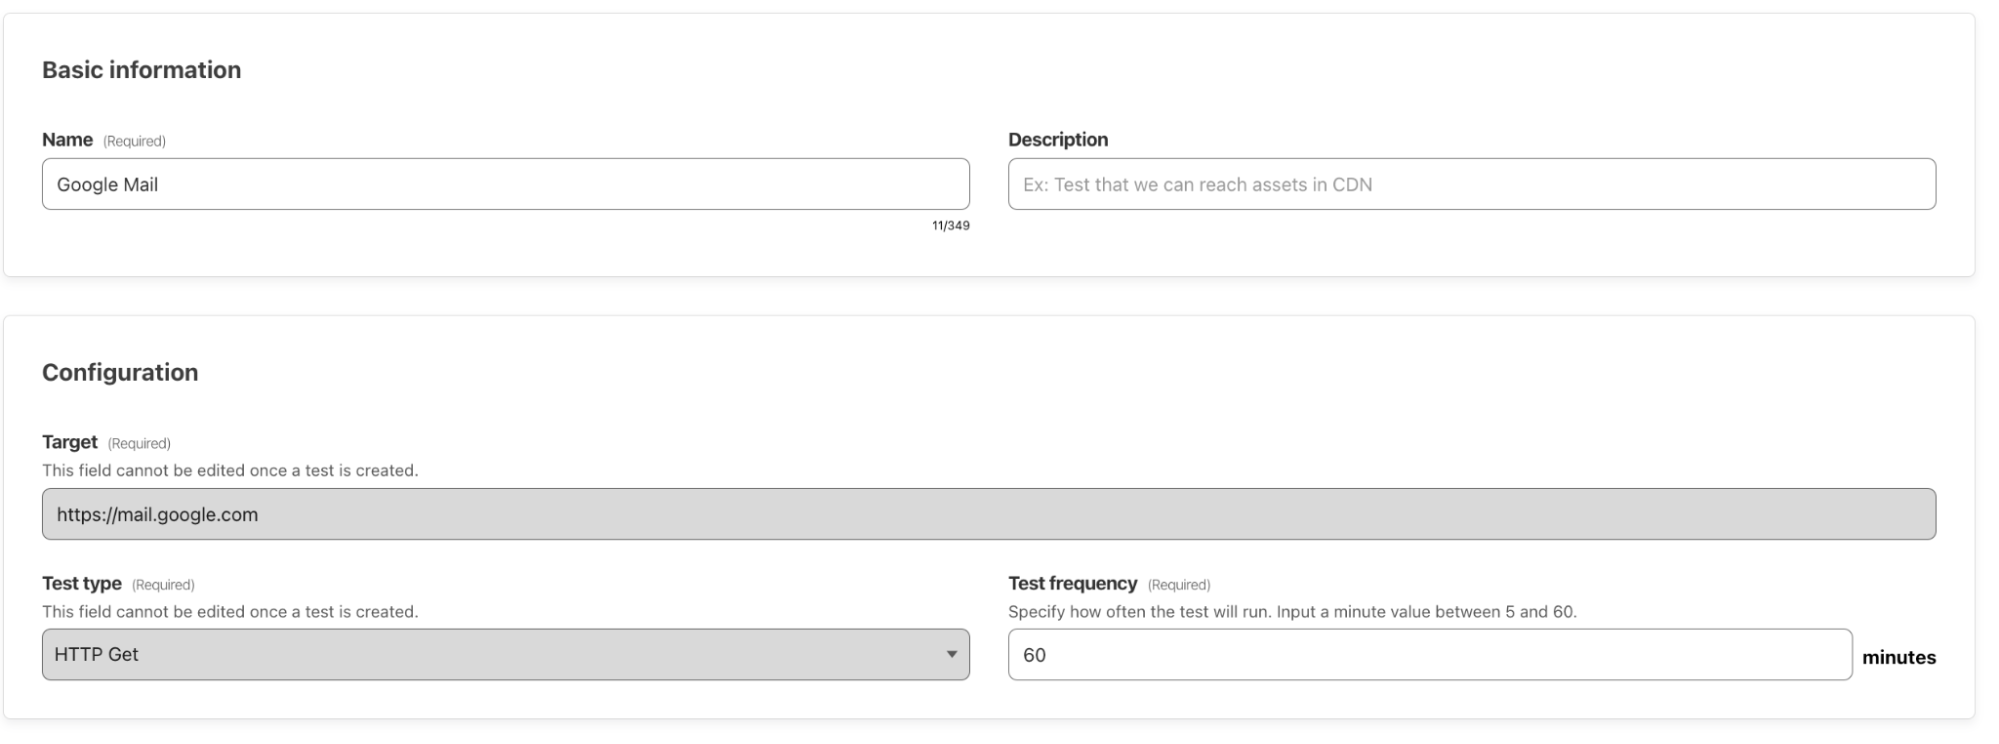
Synthetic Application Monitoring shines a light through this maze. With the ability to schedule HTTP GET tests that target Gmail at specified intervals, you're not merely monitoring performance — you're safeguarding your team's access to crucial communication lines, irrespective of their global locations.

Understanding end user-connectivity and performance with Digital Experience Monitoring, now available in beta

What sets Synthetic Application Monitoring apart isn't just its user-friendly setup, but the powerful insights derived from Cloudflare's extensive network. With our network's global reach, you can track response time averages from various locations, painting a realistic picture of your application's performance as experienced by your users worldwide.

Understanding end user-connectivity and performance with Digital Experience Monitoring, now available in beta

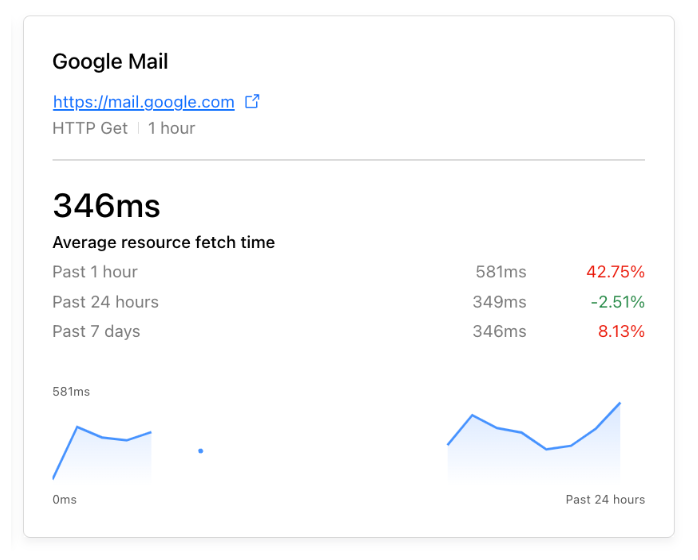
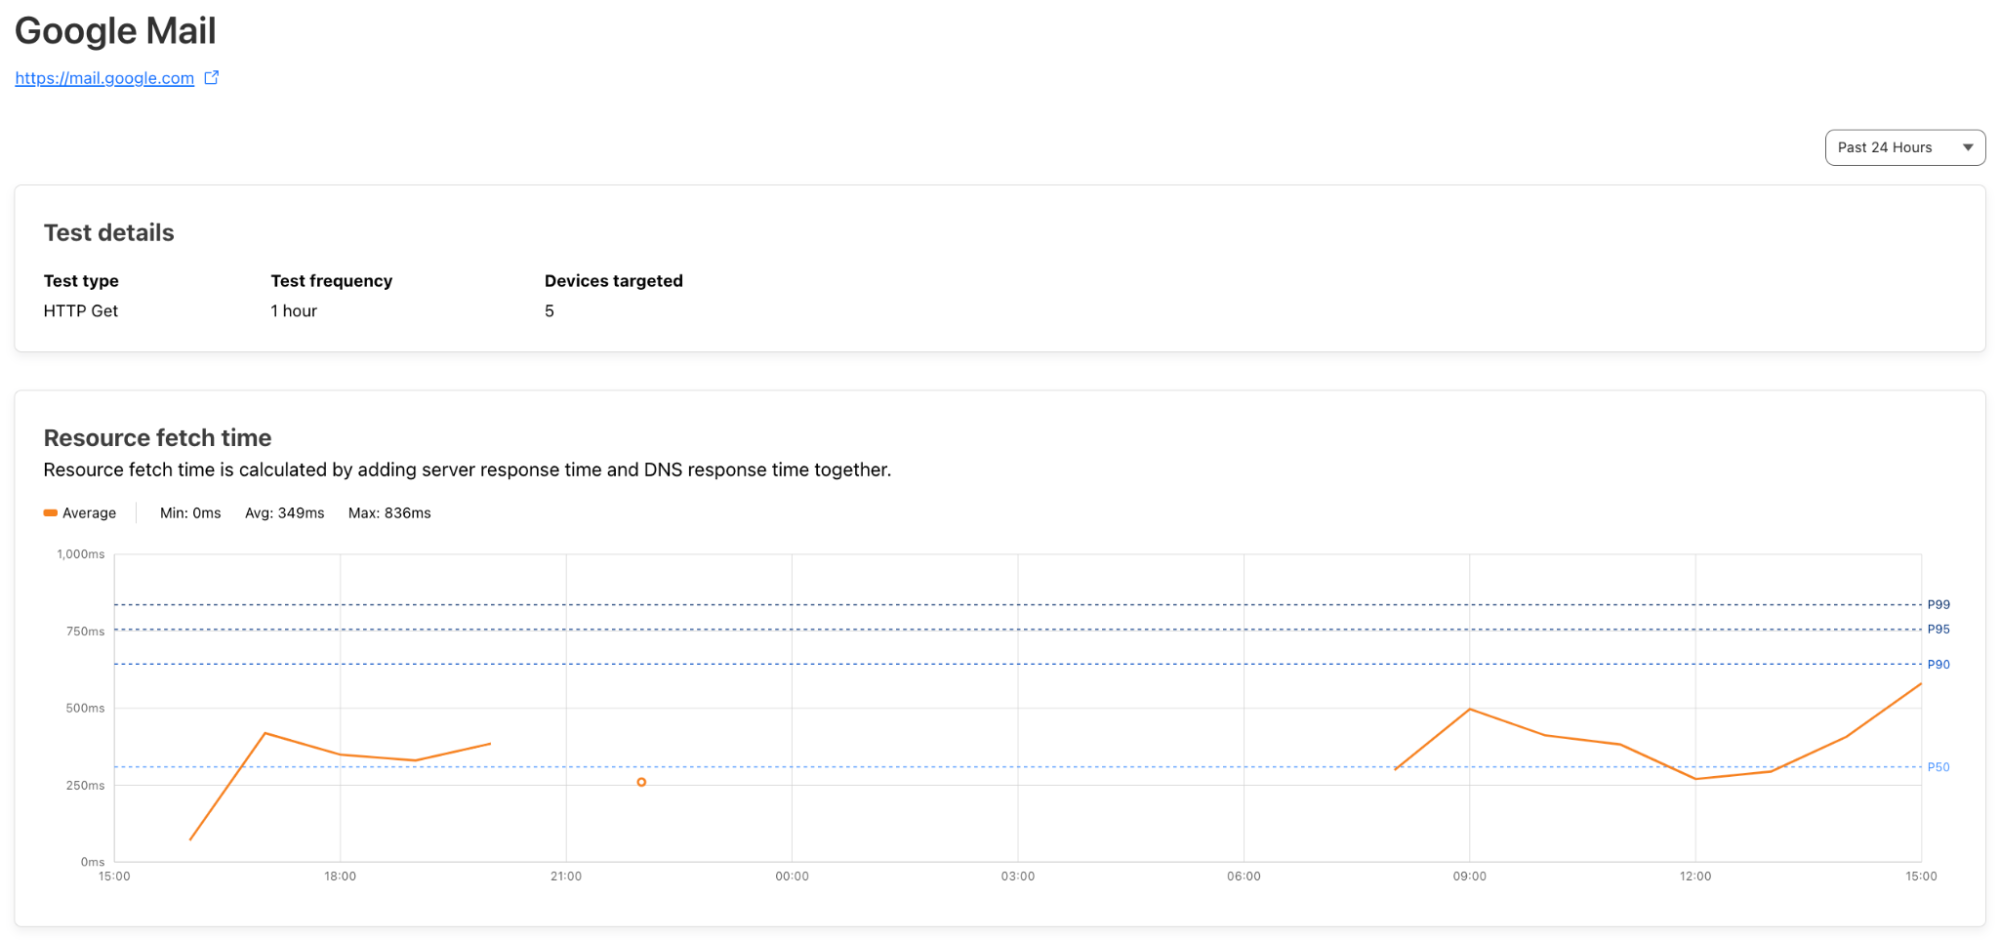
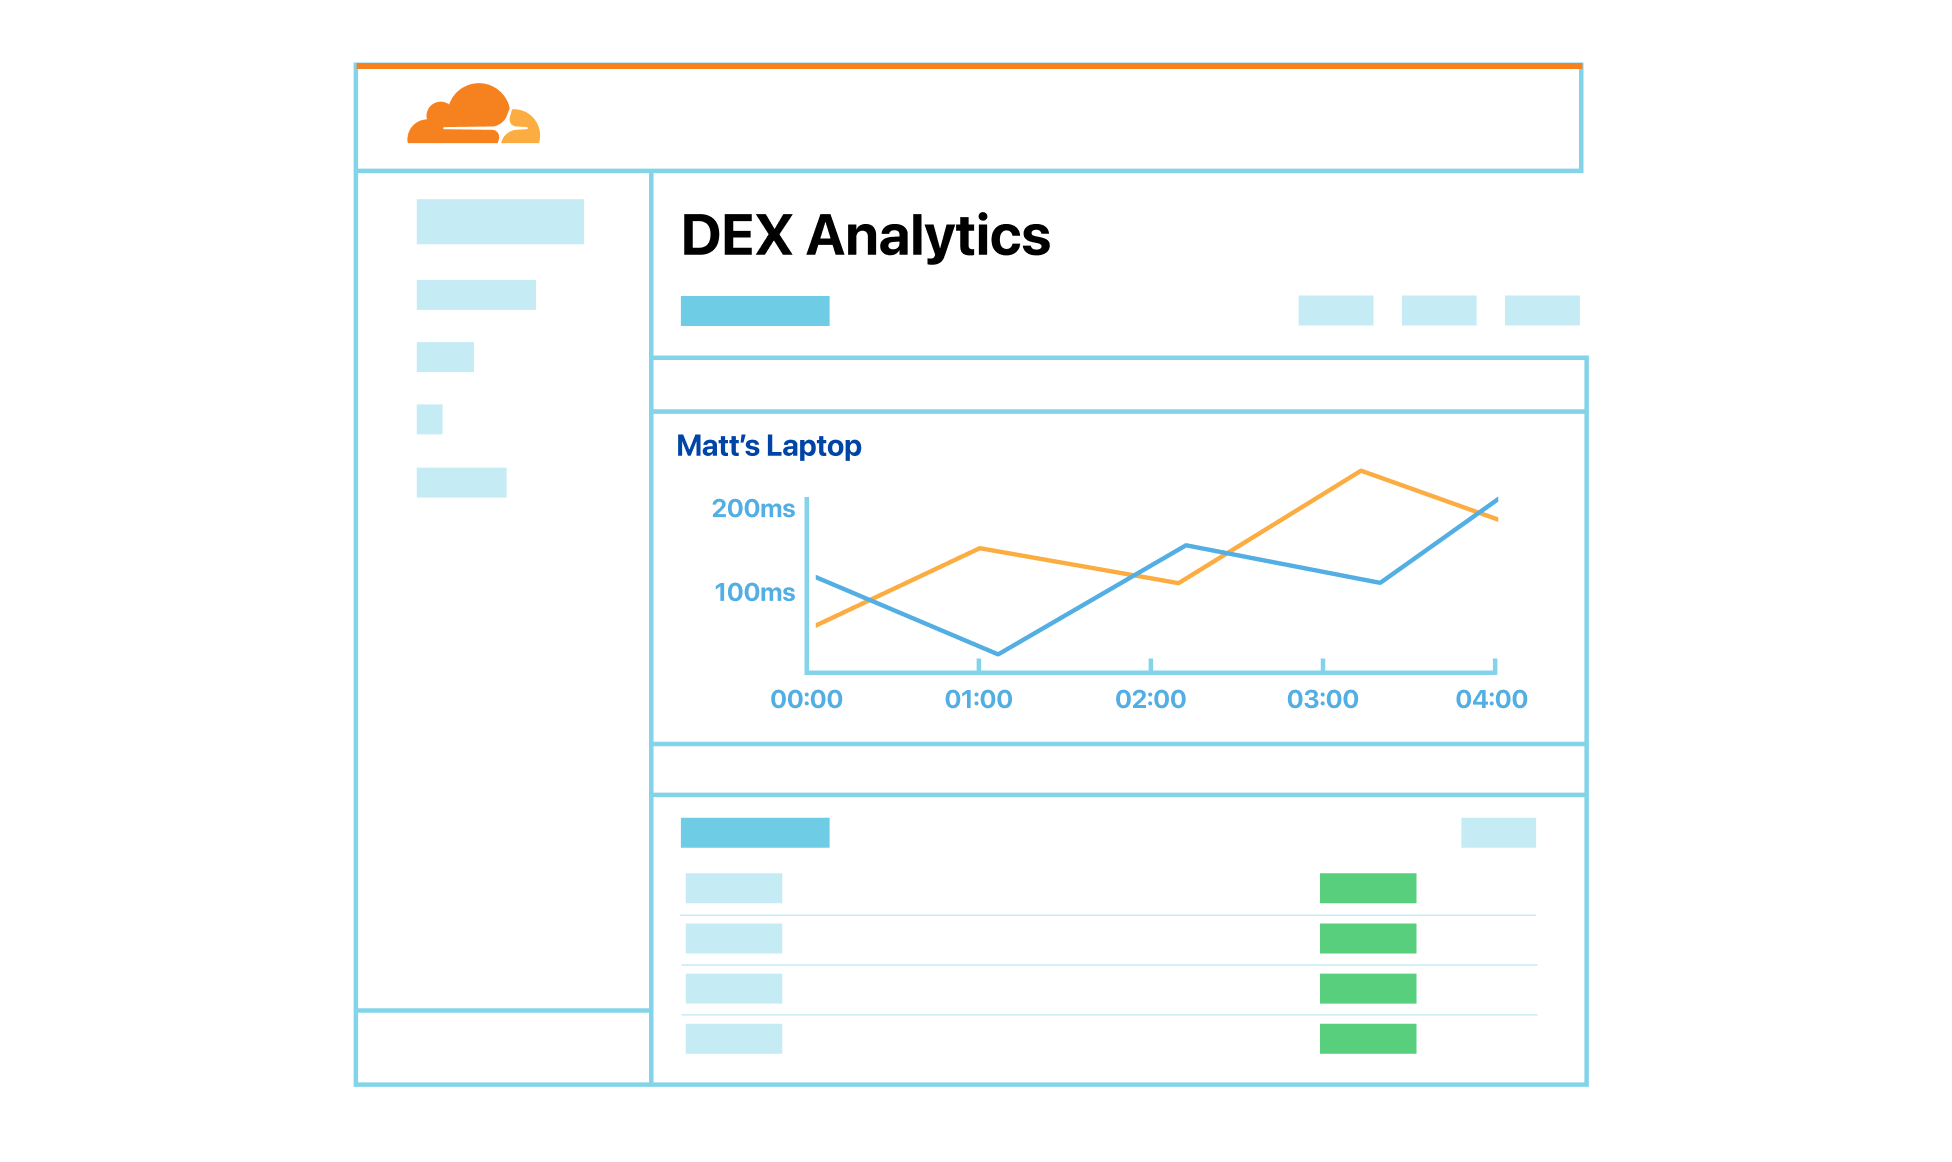
Test results visualize resource fetch times, exemplifying the unique strengths of Cloudflare's expansive network. The HTTP GET tests harness the speed and reliability of the nearest data center in our network, providing an accurate reflection of your users' experiences. This graph translates raw data into an easy-to-read timeline, helping you identify trends, spot anomalies, and optimize application performance using the insights garnered.

Understanding end user-connectivity and performance with Digital Experience Monitoring, now available in beta

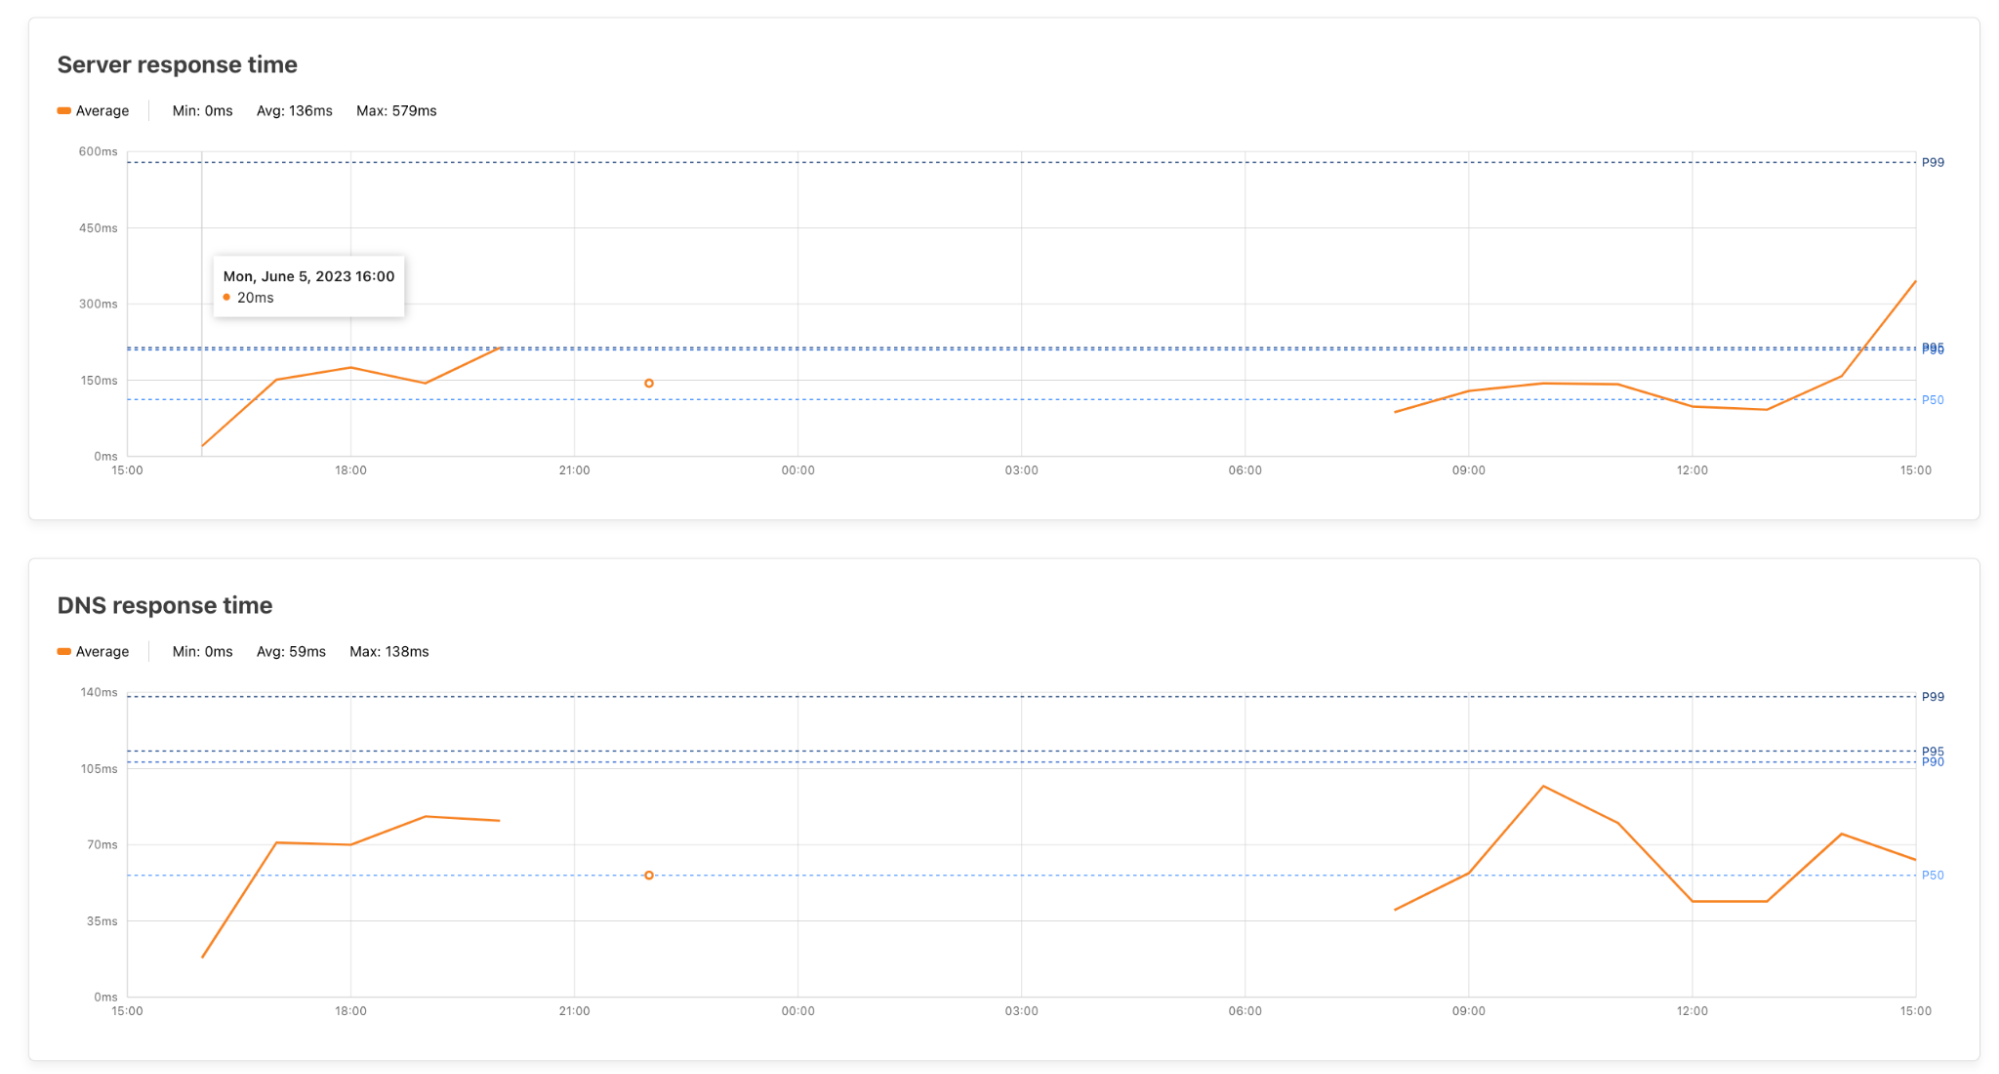
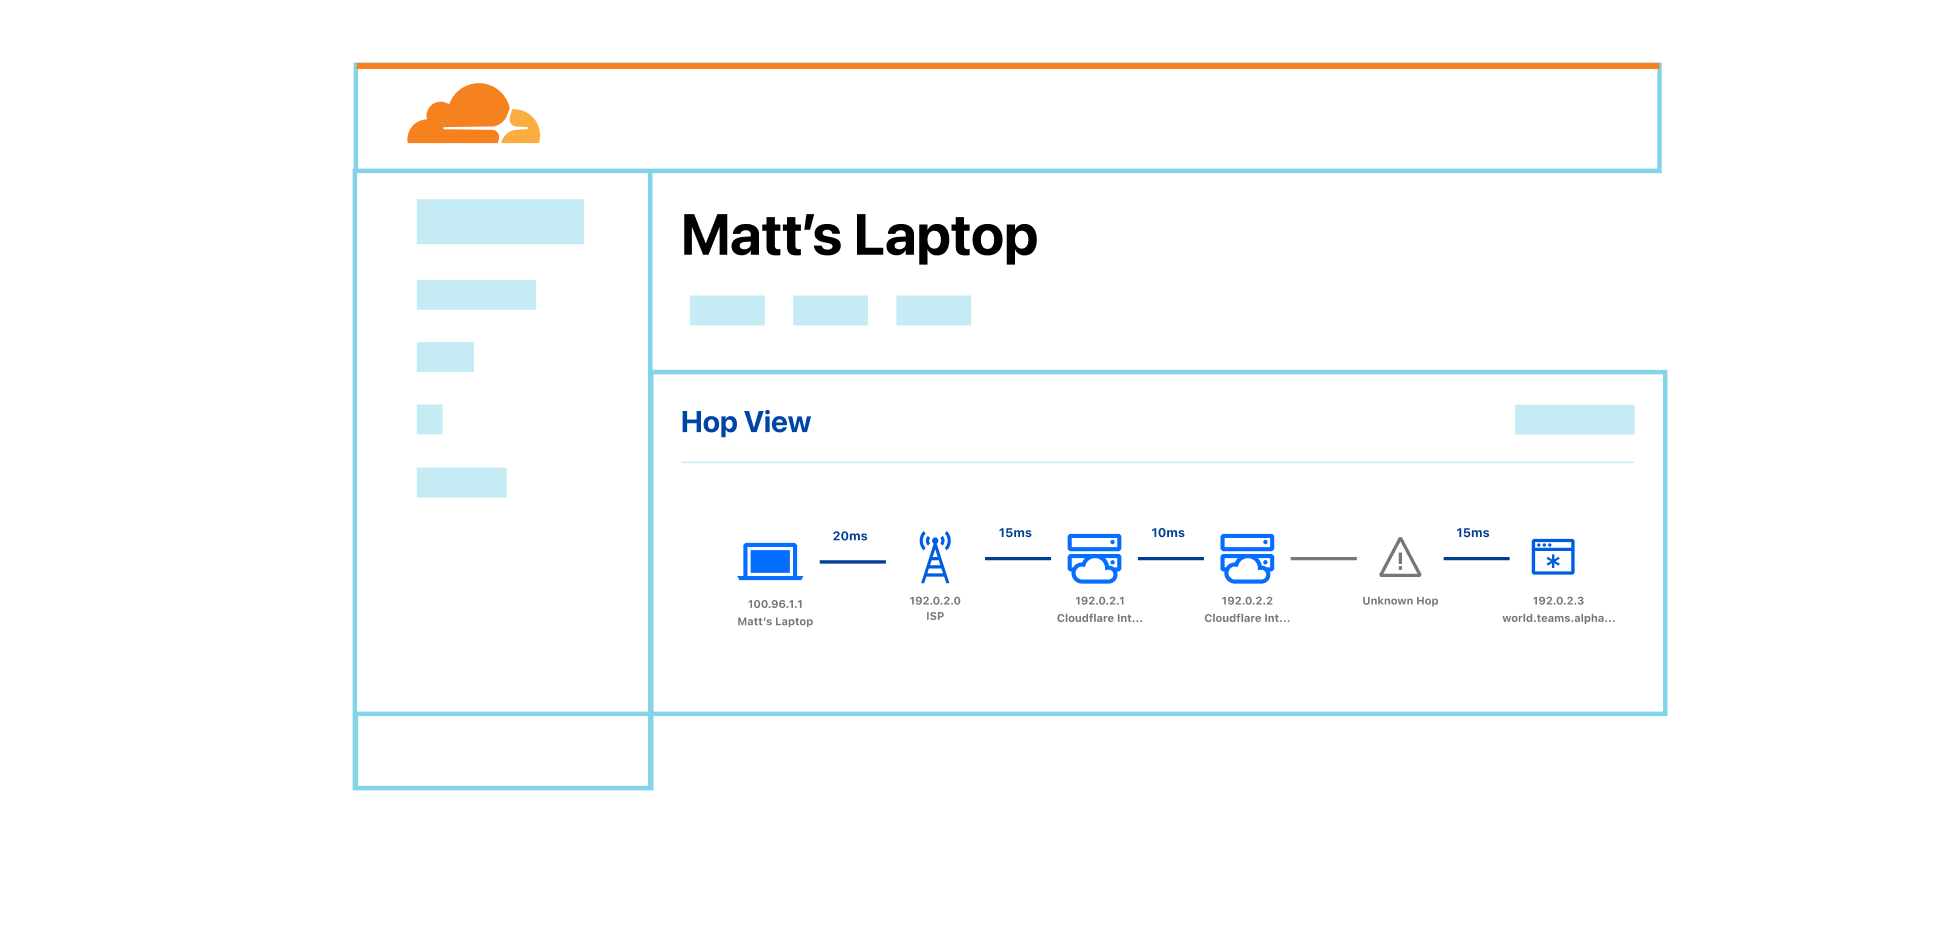
With DEX, you get a reliable and precise view of server and DNS response times from around the world. The time series format allows you to spot trends, identify peak periods, and pinpoint potential issues with ease. This isn't just data—it's actionable intelligence that helps you optimize server configurations, DNS settings, and ultimately, your users' digital experience. Essentially, these charts are more than visual aids; they are strategic tools, using Cloudflare's network to enhance your application's performance management.

Understanding end user-connectivity and performance with Digital Experience Monitoring, now available in beta

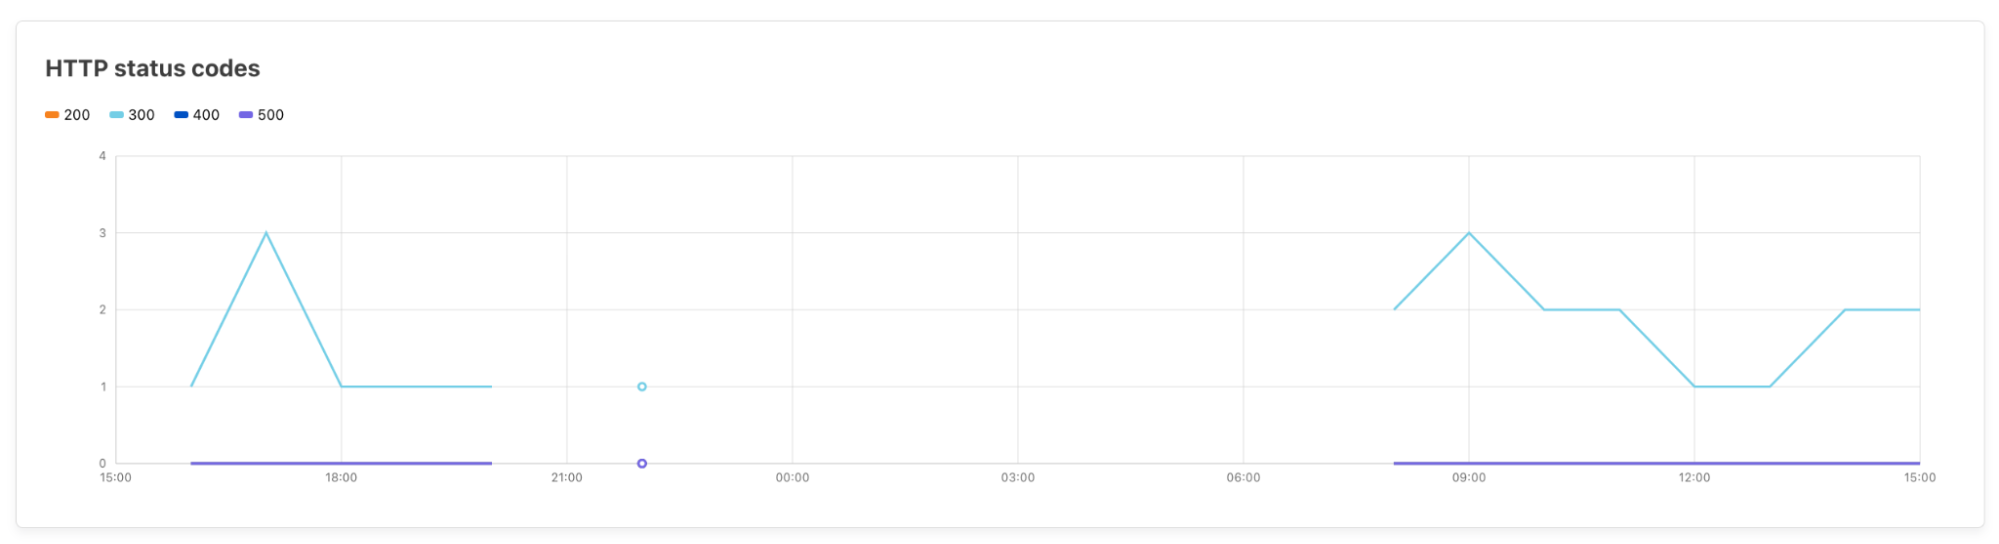
The time series chart depicting HTTP status codes is another powerful tool in the DEX arsenal. Drawing from the wealth of data traversing our globally distributed network, it lets you quickly visualize the frequency of each status code over time. This granular perspective allows you to detect and investigate anomalies, such as a sudden surge of client or server errors. By making HTTP status codes more comprehensible, it equips you to swiftly identify and troubleshoot potential issues that can impact user experience.

Synthetic Application Monitoring is more than a product; it's a strategic ally that harnesses the might of Cloudflare's network, ensuring your applications deliver the reliable, high-quality experience your users expect and deserve.

Understand the state of WARP-enrolled devices with Fleet Status

Zero Trust solutions replace legacy private networks with a model that assumes all connection attempts are suspicious. A Zero Trust network denies access attempts by default and forces every connection or request to prove that access should be granted.

A large component of proof is the identity of the end user, but the device itself also provides a signal about access rights. Whether the device is managed by the enterprise, healthy and patched, or assigned to a given user can determine permissions within Cloudflare One. For customers who rely on Cloudflare One to give their users a secure path to the rest of the Internet, the device also becomes an on-ramp for those team members connecting through Cloudflare.

We kept hearing from customers who wanted to better understand their device fleet using the data that Cloudflare could gather.

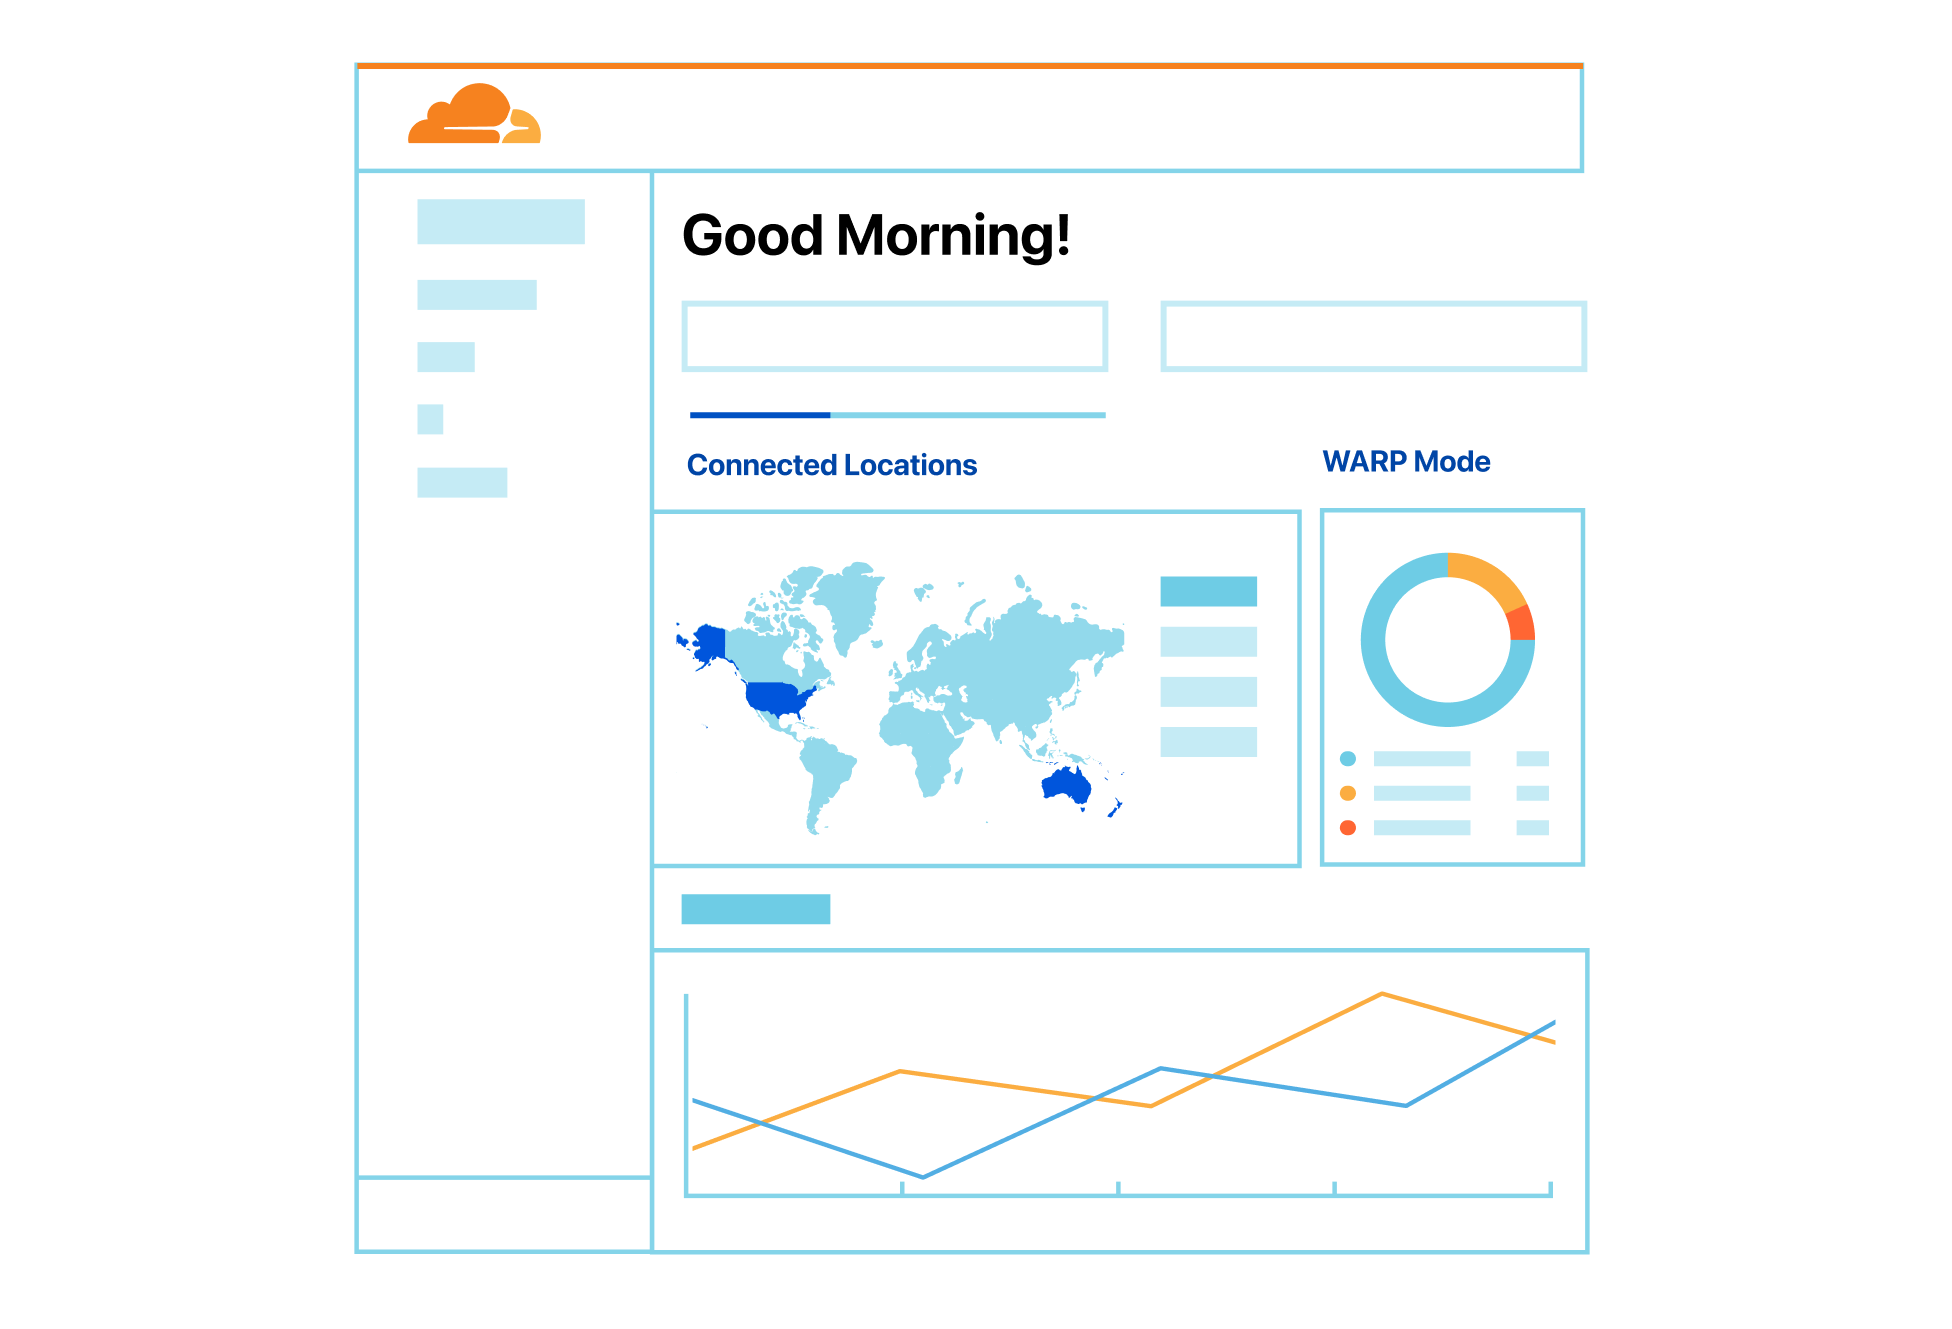
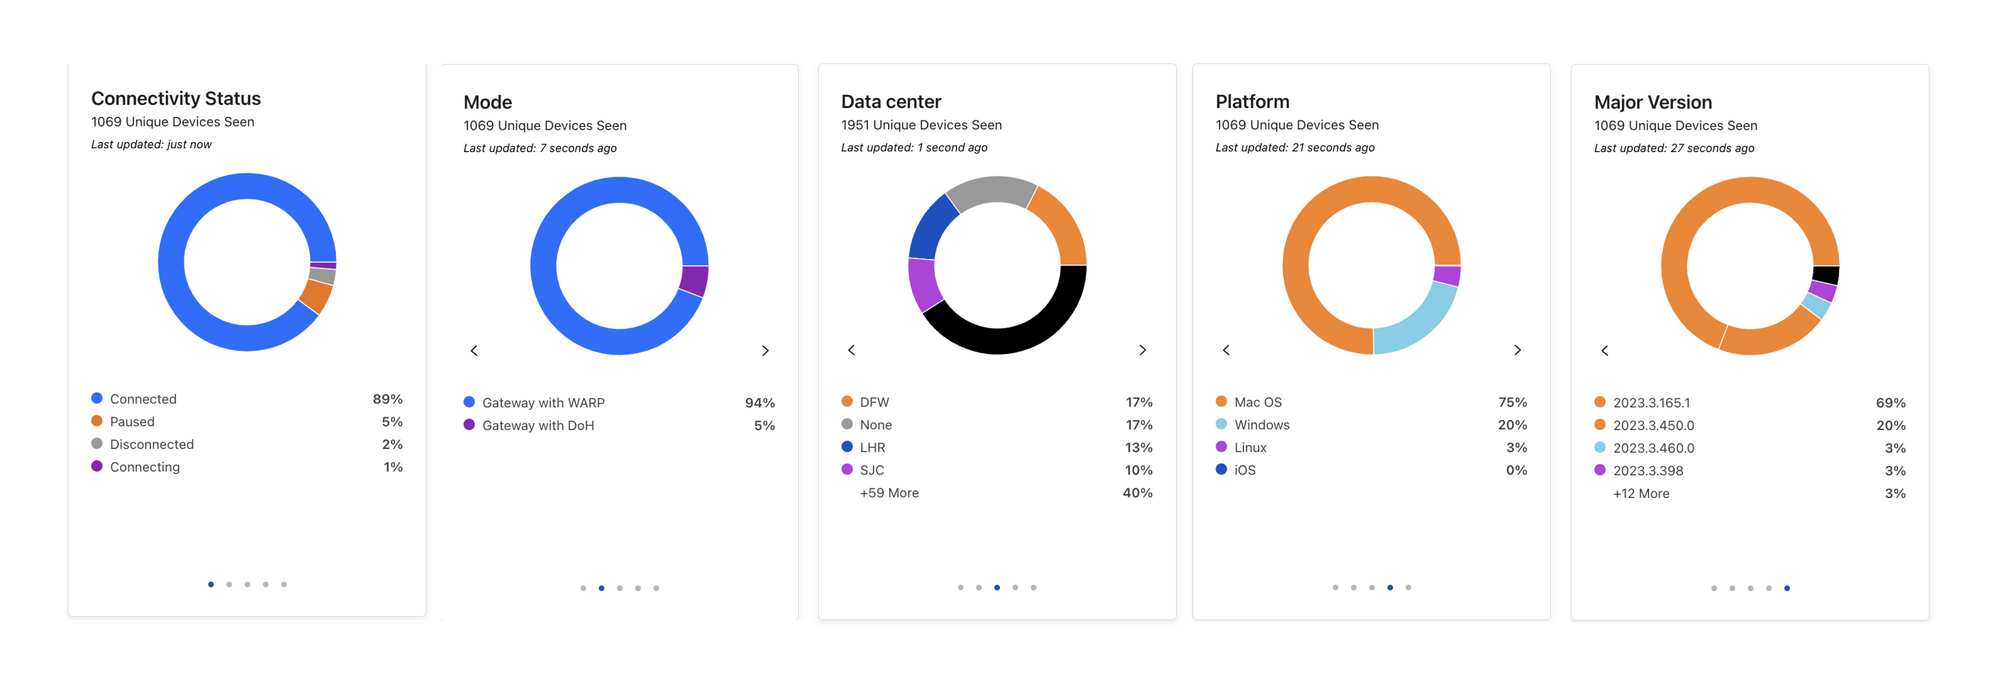
As part of today’s launch, we are introducing Fleet Status. Fleet Status provides real-time insights into the status of all of your client devices’ connection, mode, and location on both a global and per-device basis. This is achieved via Cloudflare WARP. Cloudflare WARP is a client which allows companies to protect corporate devices by securely and privately sending traffic from those devices to Cloudflare’s global network, where Cloudflare Gateway can apply advanced web filtering. The WARP client also makes it possible to apply advanced Zero Trust policies that check for a device’s health before it connects to corporate applications.

Understanding end user-connectivity and performance with Digital Experience Monitoring, now available in beta

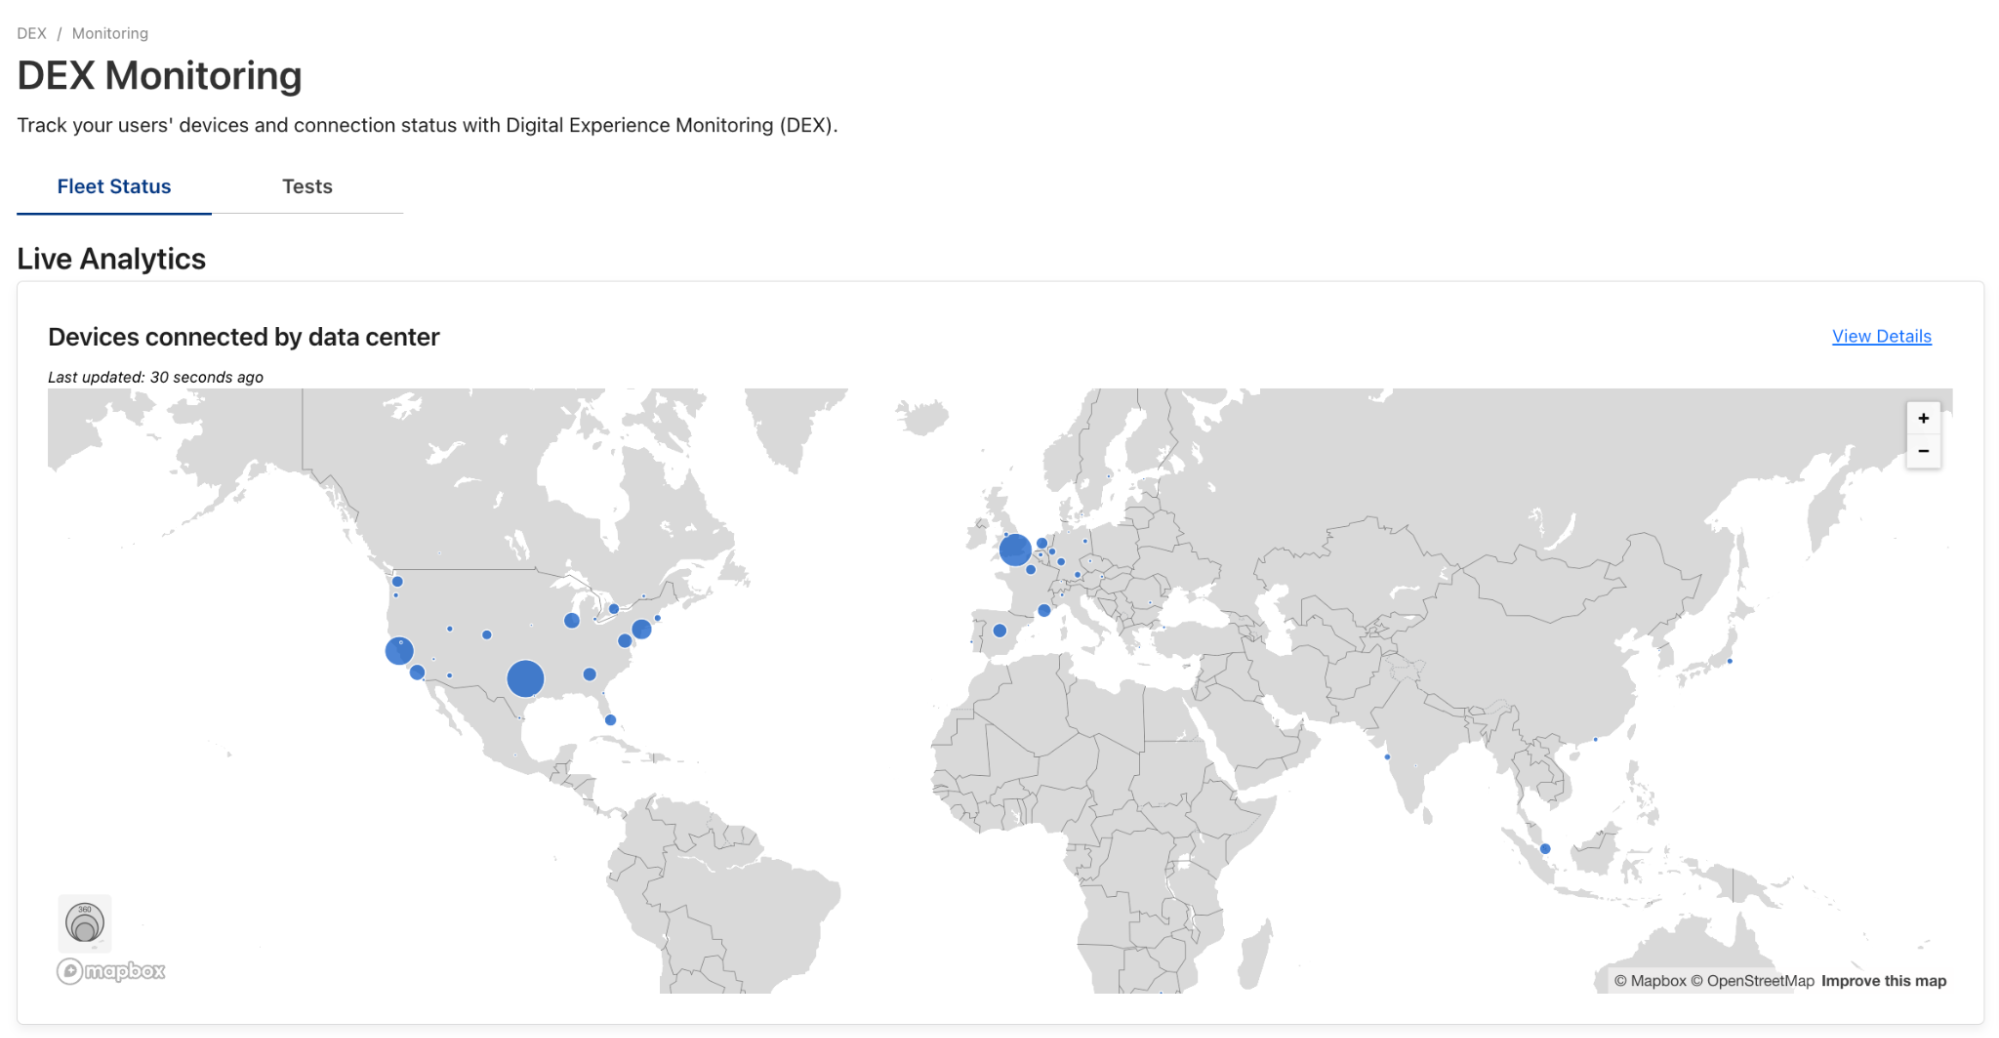
Fleet Status, with its data visualizations, detailed per-device views, and time-series charts, transforms the way administrators understand their deployment. Picture a network administrator who oversees a fleet of WARP-enrolled devices scattered worldwide, each contributing to the organization's vital operations. Suddenly, an issue arises. A group of devices in a specific location is unexpectedly disconnecting or changing connection methods.

Understanding end user-connectivity and performance with Digital Experience Monitoring, now available in beta

With traditional methods, identifying the issue itself would be a time-consuming endeavor. However, Fleet Status enables real-time insights to be at the administrator's fingertips, quickly providing a global snapshot of devices, highlighting the ones experiencing anomalies.

The per-device view allows further investigation into these specific devices, presenting granular details like device location, client platform, version, client connection state, and connection methods. Meanwhile, time-series charts plot data over time, helping to identify if the disconnects or changes are an anomaly or a part of a recurring pattern.

Armed with these insights, the administrator can work proactively to ensure connectivity issues are addressed, leading to minimal disruption and maximum productivity. Fleet Status isn't just about presenting data; it's about empowering administrators with actionable insights when they need them most.

What’s next

Our journey doesn't end here. As we continue to build DEX, we are committed to adding more visibility and refining test customization. These enhancements will equip you with the resources to proactively troubleshoot issues and understand your Zero Trust Deployment.

Getting started with DEX is a breeze. If you're an existing Cloudflare One user, simply log in to your dashboard and navigate to the DEX beta section – no activation needed. We can’t wait for you to build tests and start leveraging DEX’s insights immediately!

If you're new to Cloudflare One, we've got you covered. Sign up for our free plan, which provides DEX for up to 50 users at no cost. For our Enterprise Plan users, ten synthetic application tests are part of your package. If you're on any other plan, you can create up to five tests.

We also need your feedback. Want to tell us more about what you would like to see next? Let us know at this form or this community forum post.

Introducing Digital Experience Monitoring

Post Syndicated from Abe Carryl original https://blog.cloudflare.com/introducing-digital-experience-monitoring/

Introducing Digital Experience Monitoring

This post is also available in 简体中文, 日本語, Français and Español.

Introducing Digital Experience Monitoring

Today, organizations of all shapes and sizes lack visibility and insight into the digital experiences of their end-users. This often leaves IT and network administrators feeling vulnerable to issues beyond their control which hinder productivity across their organization. When issues inevitably arise, teams are left with a finger-pointing exercise. They’re unsure if the root cause lies within the first, middle or last mile and are forced to file a ticket for the respective owners of each. Ideally, each team sprints into investigation to find the needle in the haystack. However, once each side has exhausted all resources, they once again finger point upstream. To help solve this problem, we’re building a new product, Digital Experience Monitoring, which will enable administrators to pinpoint and resolve issues impacting end-user connectivity and performance.

To get started, sign up to receive early access. If you’re interested in learning more about how it works and what else we will be launching in the near future, keep scrolling.

Our vision

Over the last year, we’ve received an overwhelming amount of feedback that users want to see the intelligence that Cloudflare possesses from our unique perspective, helping power the Internet embedded within our Zero Trust platform. Today, we’re excited to announce just that. Throughout the coming weeks, we will be releasing a number of features for our Digital Experience Monitoring product which will provide you with unparalleled visibility into the performance and connectivity of your users, applications, and networks.

With data centers in more than 275 cities across the globe, Cloudflare handles an average of 39 million HTTP requests and 22 million DNS requests every second. And with more than one billion unique IP addresses connecting to our network we have one of the most representative views of Internet traffic on the planet. This unique point of view on the Internet will be able to provide you deep insight into the digital experience of your users. You can think of Digital Experience Monitoring as the air traffic control tower of your Zero Trust deployment providing you with the data-driven insights you need to help each user arrive at their destination as quickly and smoothly as possible.

What is Digital Experience Monitoring?

When we began to research Digital Experience Monitoring, we started with you: the user. Users want a single dashboard to monitor user, application, and network availability and performance. Ultimately, this dashboard needs to help users cohesively understand the minute-by-minute experiences of their end-users so that they can quickly and easily resolve issues impacting productivity. Simply put, users want hop by hop visibility into the network traffic paths of each and every user in their organization.

From our conversations with our users, we understand that providing this level of insight has become even more critical and challenging in an increasingly work-from-anywhere world.

With this product, we want to empower you to answer the hard questions. The questions in the kind of tickets we all wish we could avoid when they appear in the queue like “Why can’t the CEO reach SharePoint while traveling abroad?”. Could it have been a poor Wi-Fi signal strength in the hotel? High CPU on the device? Or something else entirely?

Without the proper tools, it’s nearly impossible to answer these questions. Regardless, it’s all but certain that this investigation will be a time-consuming endeavor whether it has a happy ending or not. Traditionally, the investigation will go something like this. IT professionals will start their investigation by looking into the first-mile which may include profiling the health of the endpoint (i.e. CPU or RAM utilization), Wi-Fi signal strength, or local network congestion. With any luck at all, the issue is identified, and the pain stops here.

Unfortunately, teams rarely have the tools required to prove these theories out so, frustrated, they move on to everything in between the user and the application. Here we might be looking for an outage or a similar issue with a local Internet Service Provider (ISP). Again, even if we do have reason to believe that this is the issue it can be difficult to prove this beyond a reasonable doubt.

Reluctantly, we move onto the last mile. Here we’ll be looking to validate that the application in question is available and if so, how quickly we can establish a meaningful connection (Time to First Byte, First Contentful Paint, packet loss) to this application. More often than not, the lead investigator is left with more questions than answers after attempting to account for the hop by hop degradation. Then, by the time the ticket can be closed, the CEO has boarded a flight back home and the issue is no longer relevant.

With Digital Experience Monitoring, we’ve set out to build the tools you need to quickly find the needle in the haystack and resolve issues related to performance and connectivity. However, we also understand that availability and performance are just shorthand measures for gauging the complete experience of our customers. Of course, there is much more to a good user experience than just insights and analytics. We will continue to pay close attention to other key metrics around the volume of support tickets, contact rate, and time to resolution as other significant indicators of a healthy deployment. Internally, when shared with Cloudflare, this telemetry data will help enable our support teams to quickly validate and report issues to continuously improve the overall Zero Trust experience.

“As CIO, I am focused on outfitting Cintas with technology and systems that help us deliver on our promises for the 1 million plus businesses we serve across North America.  As we leverage more cloud based technology to create differentiated experiences for our customers, Cloudflare is an integral part of delivering on that promise.”  
Matthew Hough, CIO, Cintas

A look ahead

In the coming weeks, we’ll be launching three new features. Here is a look ahead at what you can expect when you sign up for early access.

Zero Trust Fleet Status

One of the common challenges of deploying software is understanding how it is performing in the wild. For Zero Trust, this might mean trying to answer how many of your end-users are running our device agent, Cloudflare WARP, for instance. Then, of those users, you may want to see how many users have enabled, paused, or disabled the agent during the early phases of a deployment. Shortly after finding these answers, you may want to see if there is any correlation between the users who pause their WARP agent and the data center through which they are connected to Cloudflare. These are the kinds of answers you will be able to find with Zero Trust Fleet Status. These insights will be available at both an organizational and per-user level.

Introducing Digital Experience Monitoring

Synthetic Application Monitoring

Oftentimes, the issues being reported to IT professionals will fall outside their control. For instance, an outage for a popular SaaS application can derail an otherwise perfectly productive day. But, these issues would become much easier to address if you knew about them before your users began to report them. For instance, this foresight would allow you to proactively communicate issues to the organization and get ahead of the flood of IT tickets destined for your inbox. With Synthetic Application Monitoring, we’ll be providing Zero Trust administrators the ability to create synthetic application tests to public-facing endpoints.

Introducing Digital Experience Monitoring

With this tool, users can initiate periodic traceroute and HTTP GET requests destined for a given public IP or hostname. In the dashboard, we’ll then surface global and user-level analytics enabling administrators to easily identify trends across their organization. Users will also have the ability to filter results down to identify individual users or devices who are most impacted by these outages.

Introducing Digital Experience Monitoring

Network Path Visualization

Once an issue with a given user or device is identified through the Synthetic Application Monitoring reports highlighted above, administrators will be able to view hop-by-hop telemetry data outlining the critical path to public facing endpoints. Administrators will have the ability to view this data represented graphically and export any data which may be relevant outside the context of Zero Trust.

Introducing Digital Experience Monitoring

What’s next

According to Gartner®, “by 2026 at least 60% of I&O leaders will use Digital Experience Monitoring (DEM) to measure application, services and endpoint performance from the user’s viewpoint, up from less than 20% in 2021.” The items at the top of our roadmap will be just the beginning to Cloudflare’s approach to bringing our intelligence into your Zero Trust deployments.

Perhaps what we’re most excited about with this product is that users on all Zero Trust plans will be able to get started at no additional cost and then upgrade their plans for more advanced features and usage moving forward. Join our waitlist to be notified when these initial capabilities are available and receive early access.

Gartner Market Guide for Digital Experience Monitoring, 03/28/2022, Mrudula Bangera, Padraig Byrne, Gregg Siegfried.
GARTNER is the registered trademark and service mark of Gartner Inc., and/or its affiliates in the U.S. and/or internationally and has been used herein with permission. All rights reserved.