Tag Archives: HBase

Amazon EMR HBase on Amazon S3 transitioning to EMR S3A with comparable EMRFS performance

Post Syndicated from Dong Li original https://aws.amazon.com/blogs/big-data/amazon-emr-hbase-on-amazon-s3-transitioning-to-emr-s3a-with-comparable-emrfs-performance/

Starting with version 7.10, Amazon EMR is transitioning from EMR File System (EMRFS) to EMR S3A as the default file system connector for Amazon Simple Storage Service (Amazon S3) access. This transition brings HBase on Amazon S3 to a new level, offering performance parity with EMRFS while delivering substantial improvements, including better standardization, improved portability, stronger community support, improved performance through non-blocking I/O, asynchronous clients, and better credential management with AWS SDK V2 integration.

In this post, we discuss this transition and its benefits.

Understanding file system usage in HBase with Amazon EMR

HBase on Amazon S3 uses Amazon S3 as the primary storage layer instead of HDFS. When the memstore gets flushed, HBase writes HFiles directly to Amazon S3 using the file system connector. The Write Ahead Logs (WALs) and other operational files are still maintained in HDFS on the local cluster for performance and durability reasons. Amazon EMR also provides durable off-cluster EMR WAL implementation to improve the durability of the data.

With the HBase on Amazon S3 architecture, you can take advantage of the virtually unlimited storage capacity and cost-effectiveness of Amazon S3 while maintaining acceptable read/write performance. When data is read, HBase retrieves the HFiles directly from Amazon S3, and the block cache in memory helps optimize frequent read operations. This design alleviates the need for a large HDFS cluster for data storage, reducing operational costs and management overhead. The Amazon S3 file system connector handles the communication between HBase and Amazon S3, managing aspects like authentication, retry logic, and consistency. However, this setup might have slightly higher latency compared to traditional HBase on HDFS due to the network calls to Amazon S3, but the trade-off is justified by the benefits of scalability, caching layer, and cost-effectiveness that Amazon S3 provides.

Performance comparison of EMR S3A with EMRFS and OSS S3A from 7.3 release

Amazon EMR is transitioning how it connects to Amazon S3 storage. Through Amazon EMR 7.9, Amazon EMR has used EMRFS as its primary connector to interact with Amazon S3 for HBase storage. HBase on Amazon S3 significantly improved its performance with EMR S3A starting from the 7.3 release comparing to OSS S3A and matching the performance levels of EMRFS. This enhancement was thoroughly tested using Yahoo! Cloud Serving Benchmark (YCSB) workloads with 100 million rows in Amazon EMR 7.3 (using Hadoop 3.3 with AWS SDK V1) and Amazon EMR 7.10 (using Hadoop 3.4 with AWS SDK V2).

YCSB includes various workloads with different read and write proportions and data distribution patterns, such as:

  • Workload A (50% reads, 50% writes) – Simulates a scenario with equal read and write operations (50% each). This is ideal for applications requiring frequent updates and reads, such as session stores.
  • Workload B (95% reads, 5% writes) – Models a read-heavy application with 95% reads and 5% writes. This is well-suited for scenarios where retrieval operations dominate, like content delivery networks.
  • Workload C (100% reads) – Simulates user profile cache patterns and serves as a content delivery system.
  • Workload D (read latest data) – Simulates user status updates where users want to read the latest status.
  • Workload E (scan heavy) – Simulates threaded conversations where users scan through message threads.
  • Workload F (read/modify/write operations) – Simulates user record update patterns such as online gaming platforms where player scores are frequently read and updated based on game outcomes.

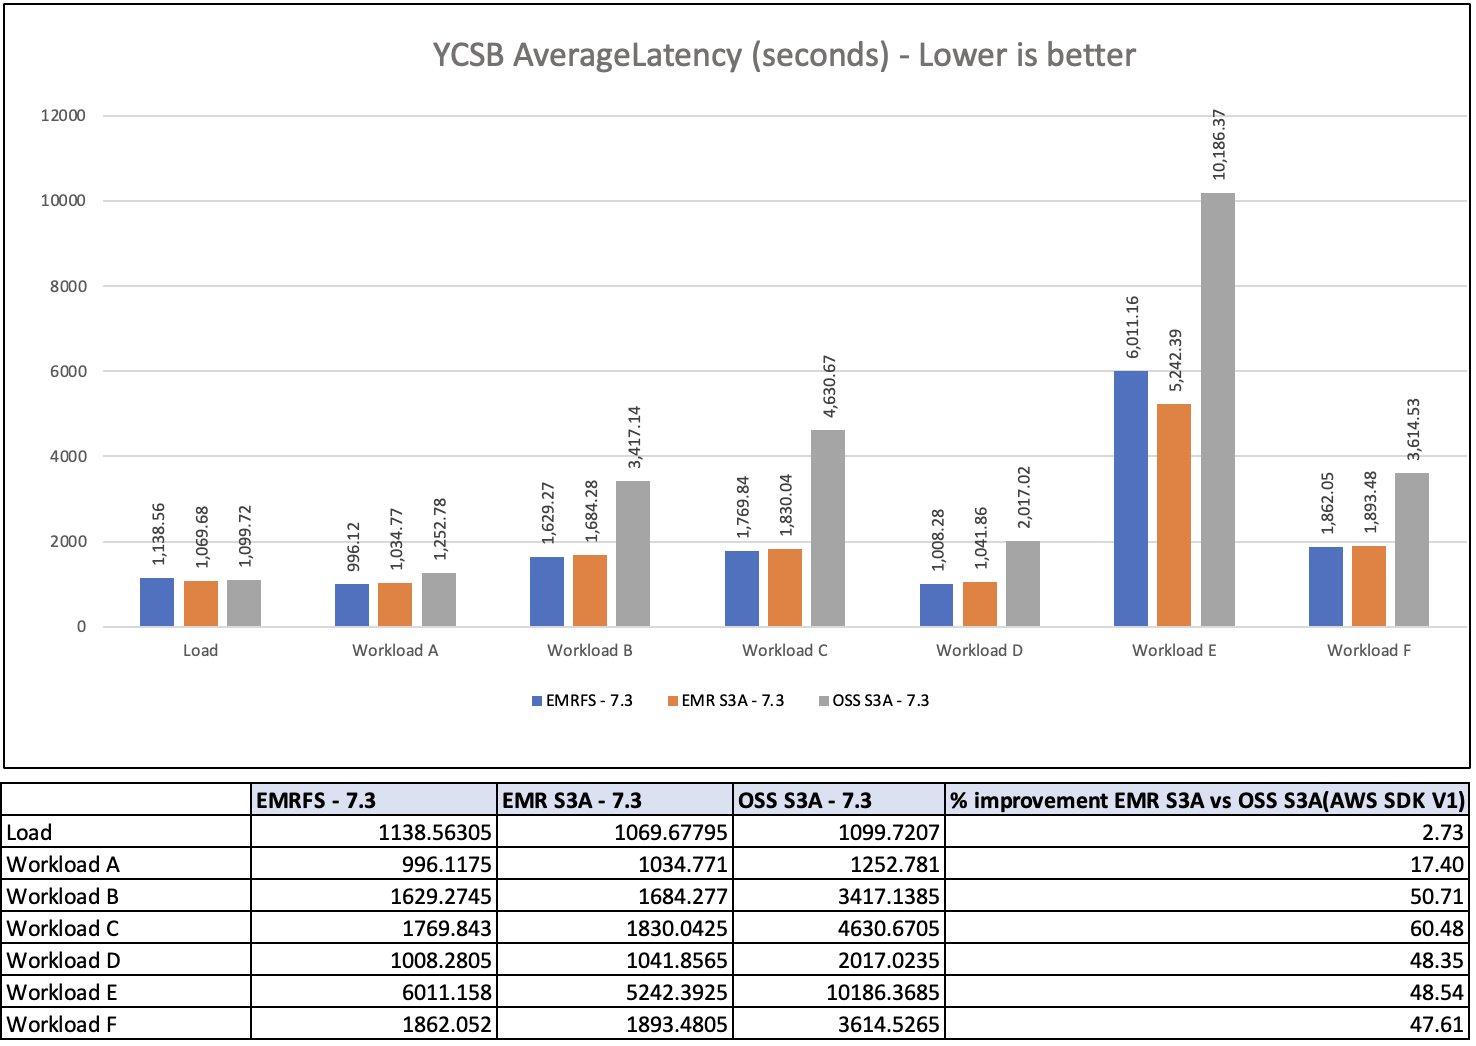
The performance comparison between EMRFS, EMR S3A, and OSS S3A for Amazon EMR 7.3 (AWS SDK V1) and 7.10 (AWS SDK V2) are illustrated in the following graphs, showing substantial improvements across different workload types. The graphs demonstrate how Amazon EMR 7.3 and 7.10 with EMR S3A achieve performance metrics comparable with EMRFS and up to 65% faster than OSS S3A, especially in read-heavy and mixed read/write workloads.
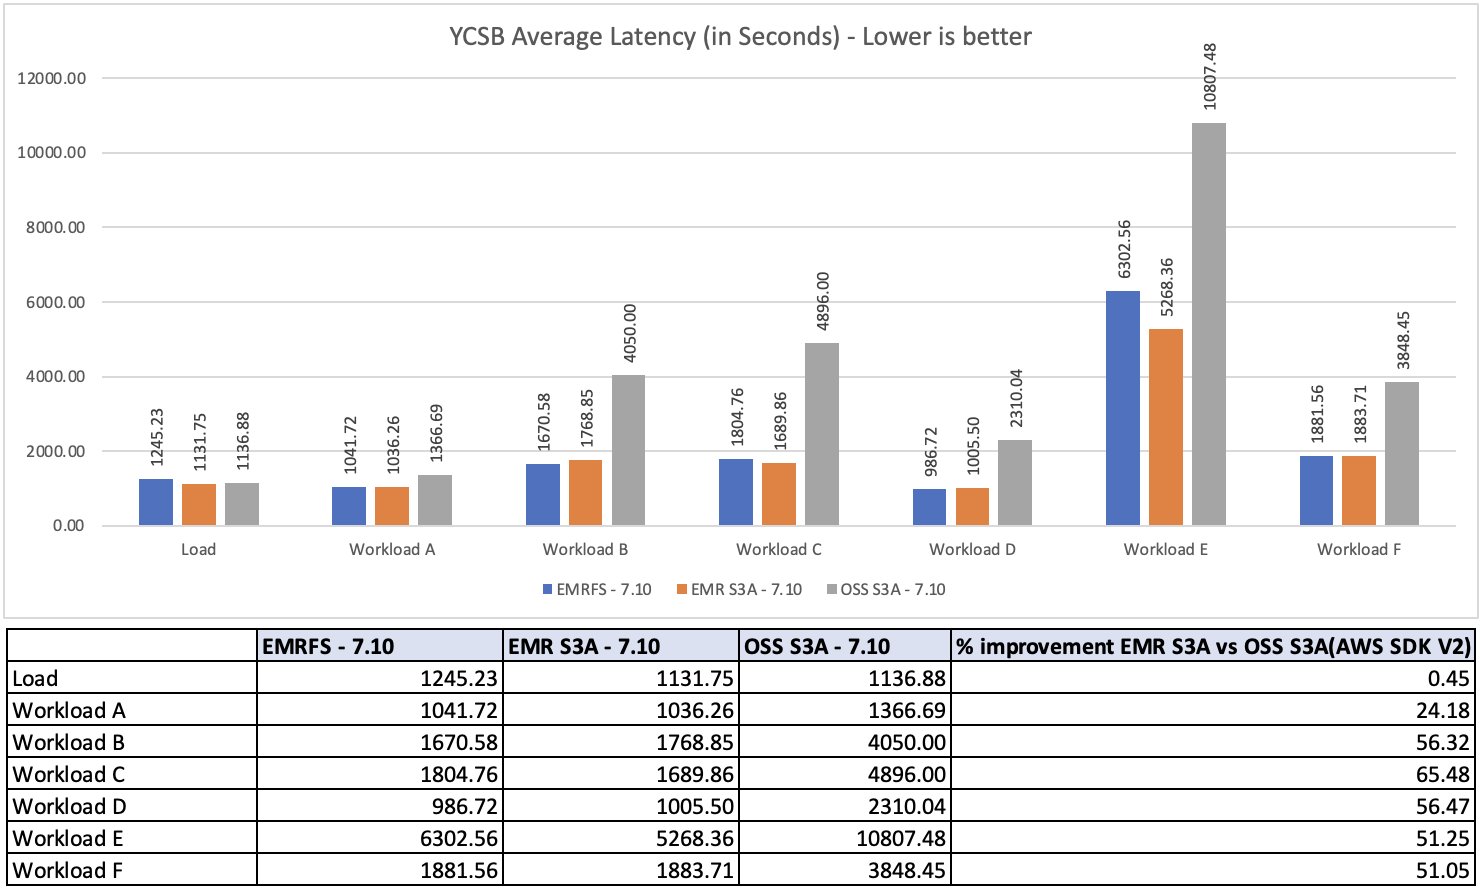
EMR S3A as the default file system from Amazon EMR 7.10

These performance improvements demonstrate a significant evolution in the capabilities of Amazon EMR. Well before EMR S3A became the default file system in version 7.10, EMR HBase users were already experiencing enhanced Amazon S3 access performance through EMR S3A. The critical enhancements implemented in Amazon EMR 7.3 successfully minimized the performance differential between EMRFS and EMR S3A for HBase operations. This achievement delivered optimal performance to users while preserving EMR S3A’s distinct benefits within the analytics ecosystem, including improved standardization, better community integration, and enhanced portability.

Amazon EMR 7.10 marks a significant change for HBase on Amazon S3 users. EMR S3A becomes the default file system connector automatically, independent of how your root directory’s file system is configured. This seamless transition enables EMR HBase customers to use EMR S3A’s expanding feature set and improvements without manual intervention.

Conclusion

The evolution of file system connectors in EMR HBase demonstrates AWS’s commitment to delivering high-performance, scalable solutions for big data workloads. Starting with EMR S3A, which achieved performance parity with EMRFS in Amazon EMR 7.3 (as validated through extensive YCSB benchmark tests with 100 million rows) and improvement over OSS S3A, to the upcoming transition to S3A as the default connector in Amazon EMR 7.10, AWS continues to enhance its storage interface capabilities.

The transition represents more than just a technical upgrade; it delivers a trifecta of benefits: enhanced standardization across Hadoop ecosystems, improved workload portability, and robust community support. Most importantly, this advancement maintains the high-performance standards established by EMRFS while positioning EMR HBase for future innovations in storage interface capabilities. AWS’s strategic evolution of file system connectors demonstrates its commitment to providing enterprise-grade solutions that combine performance, scalability, and architectural excellence.

As big data workloads continue to grow and evolve, this foundation of reliable, high-performance storage access will become increasingly crucial for organizations using EMR HBase for their data processing needs. We recommend that you stay up to date with the latest Amazon EMR release to take advantage of the latest performance and feature benefits.
About the Authors

Dong Li

Dong Li

Dong is a Senior Software development engineer for Amazon EMR at Amazon Web Services. His expertise is in big data systems, including Hadoop, HBase, and Hive. His customer obsession and dedication towards solving big data system problems helps Amazon EMR achieve more performance improvements.

Ramesh Kandasamy

Ramesh Kandasamy

Ramesh is an Engineering Manager for Amazon EMR at Amazon Web Services. He is a long tenured Amazonian dedicated to solving distributed system problems.

Giovanni Matteo Fumarola

Giovanni Matteo Fumarola

Giovanni is the Senior Manager for the Amazon EMR Spark and Iceberg group. He is an Apache Hadoop Committer and PMC member. He has been focusing on the big data analytics space since 2013.

Improve Amazon EMR HBase availability and tail latency using generational ZGC

Post Syndicated from Vishal Chaudhary original https://aws.amazon.com/blogs/big-data/improve-amazon-emr-hbase-availability-and-tail-latency-using-generational-zgc/

At Amazon EMR, we constantly listen to our customers’ challenges with running large-scale Amazon EMR HBase deployments. One consistent pain point that kept emerging is unpredictable application behavior due to garbage collection (GC) pauses on HBase. Customers running critical workloads on HBase were experiencing occasional latency spikes due to varying GC pauses, particularly impacting when they occurred during peak business hours.

To reduce this unpredictable impact to business-critical applications running on HBase, we turn to Oracle’s Z Garbage Collector (ZGC), specifically it’s generational support introduced in JDK 21. Generational ZGC delivers consistent sub-millisecond pause times that dramatically reduce tail latency.

In this post, we examine how unpredictable GC pauses affect business-critical workloads, benefits of enabling generational ZGC in HBase. We also cover additional GC tuning techniques to improve the application throughput and reduce tail latency. Amazon EMR 7.10.0 introduces new configuration parameters that allow you to seamlessly configure and tune the garbage collector for HBase RegionServers.

By incorporating generational collection into ZGC’s ultra-low pause architecture, it efficiently handles both short-lived and long-lived objects, making it exceptionally well-suited to HBase’s workload characteristics:

  • Handling mixed object lifetimes – HBase operations create a mix of short-lived objects (such as temporary buffers for read/write operations) and long-lived objects (such as cached data blocks and metadata). Generational ZGC can efficiently manage both, reducing overall GC frequency and impact.
  • Adapting to workload patterns – As workload patterns change throughout the day — for instance, from write-heavy ingestion to read-heavy analytics — generational ZGC adapts its collection strategy, maintaining optimal performance.
  • Scaling with heap size – As data volumes grow and HBase clusters require larger heaps, generational ZGC maintains it’s sub-millisecond pause times, providing consistent performance even as you scale up.

Understanding the impact of GC pauses on HBase

When running HBase RegionServers, the JVM heap can accumulate a large number of objects, both short-lived (temporary objects created during operations) and long-lived (cached data, metadata). Traditional garbage collectors like Garbage-First Garbage Collector (G1 GC) need to pause application threads during certain phases of garbage collection, particularly during “stop-the-world” (STW) events. GC pauses can have several impacts on HBase :

  • Latency spikes – GC pauses introduce latency spikes, often impacting tail latencies (p99.9 and p99.99) of the application which can lead to timeout for client requests and inconsistent response times..
  • Application availability – All application threads are halted during STW events and it negatively impacts overall application availability.
  • RegionServer failures – If GC pauses exceed the configured ZooKeeper session timeout, they might lead to RegionServer failures.

HBase RegionServer reports whenever there is an unusually long GC pause time using the JvmPauseMonitor. The following log entry shows an example of GC pauses reported by HBase RegionServer. During YCSB benchmarking, G1 GC exhibited 75 such pauses over a 7-hour period, whereas generational ZGC showed no long pauses under identical workload and testing conditions.

INFO  [JvmPauseMonitor] util.JvmPauseMonitor: Detected pause in JVM or host machine (eg GC): pause of approximately 2839ms
INFO  [JvmPauseMonitor] util.JvmPauseMonitor: Detected pause in JVM or host machine (eg GC): pause of approximately 3021ms

G1 GC pauses are proportional to the pressure on the heap and the object allocation patterns. As a result, the pauses might get worse if the heap is under too much load, whereas generational ZGC maintains it’s pause times goals even under high pressure.

Pause time and availability (uptime) comparison: Generational ZGC vs. G1GC in Amazon EMR HBase

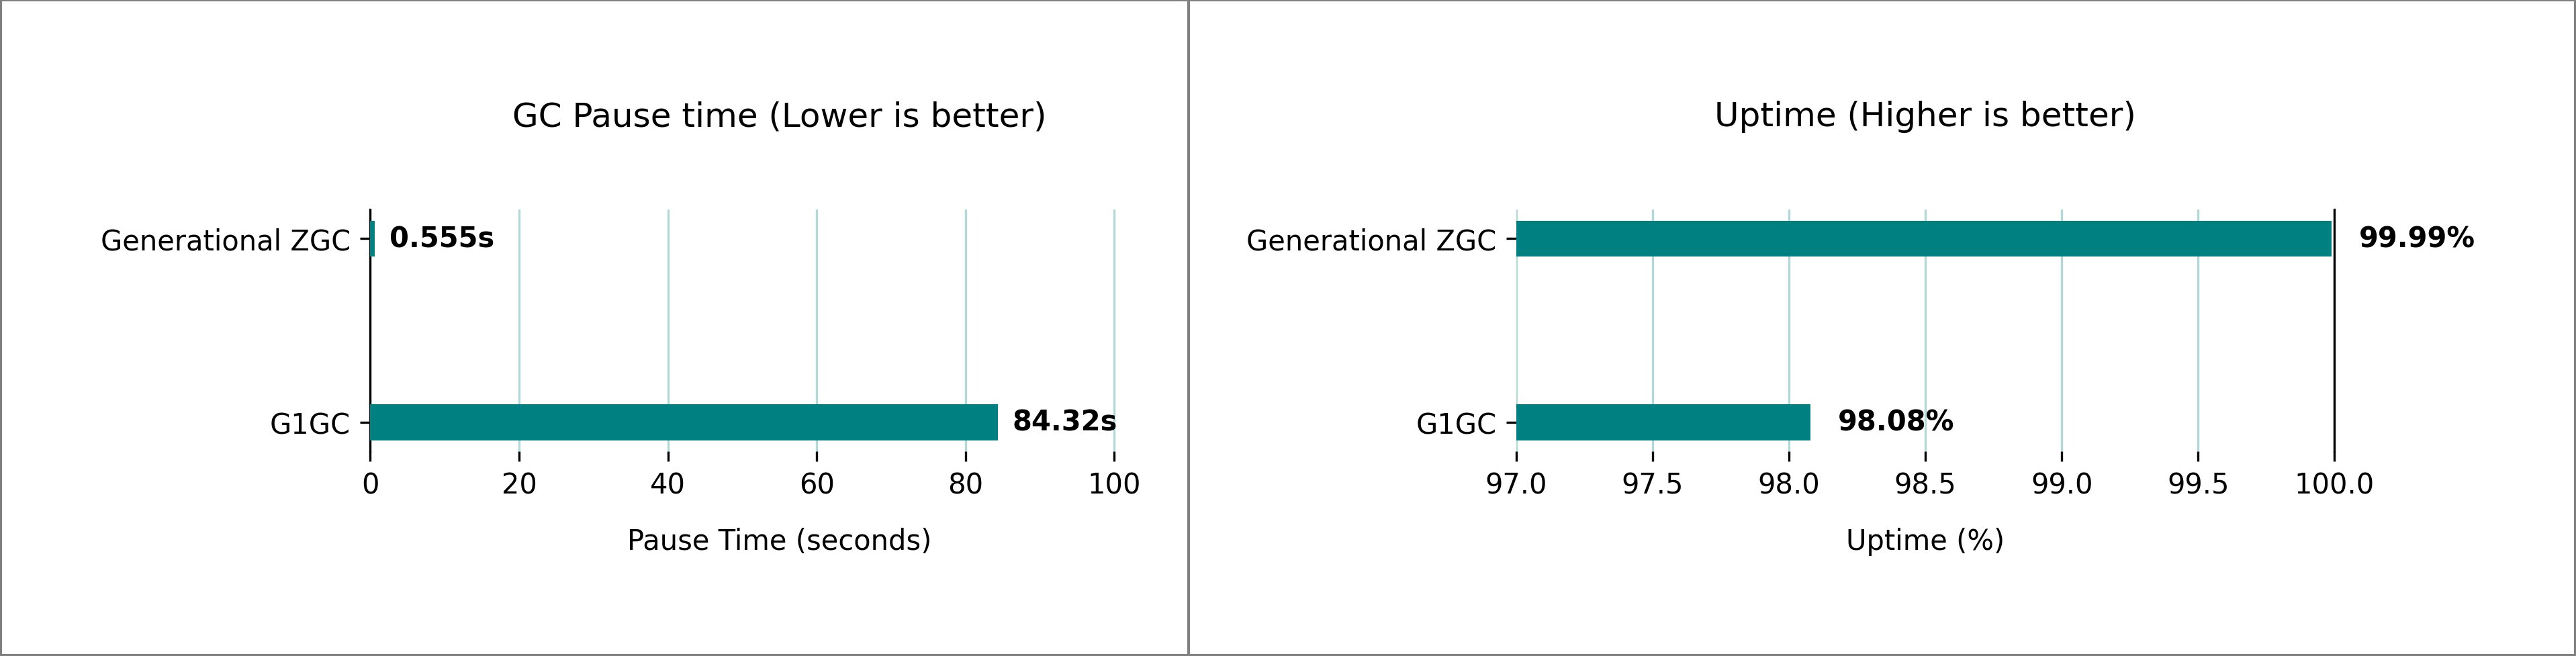
Our testing revealed significant differences in GC pause time between the generational ZGC and G1 GC for HBase on Amazon EMR 7.10. We used 1 m5.4xlarge (primary), 5 m5.4xlarge (core) nodes cluster settings and ran multiple iterations of 1-billion rows YCSB workloads to compare the GC pauses and uptime percentage. Based on our test cluster, we observed a GC pause time improvement from over 1 minute, 24 seconds, to under 1 seconds for over an hour-long execution, improving the application uptime from 98.08% to 99.99%.

We conducted extensive performance testing comparing G1 GC and generational ZGC on HBase clusters running on Amazon EMR, using the default heap settings automatically configured based on Amazon Elastic Compute Cloud (Amazon EC2) instance type. The following image shows the comparison in both GC pause time and uptime percentage at a peak load of 3,00,000 requests per second (data sampled over 1 hour).

Side-by-side comparison of Java garbage collectors showing Generational ZGC's superior pause time and uptime metrics versus G1GC

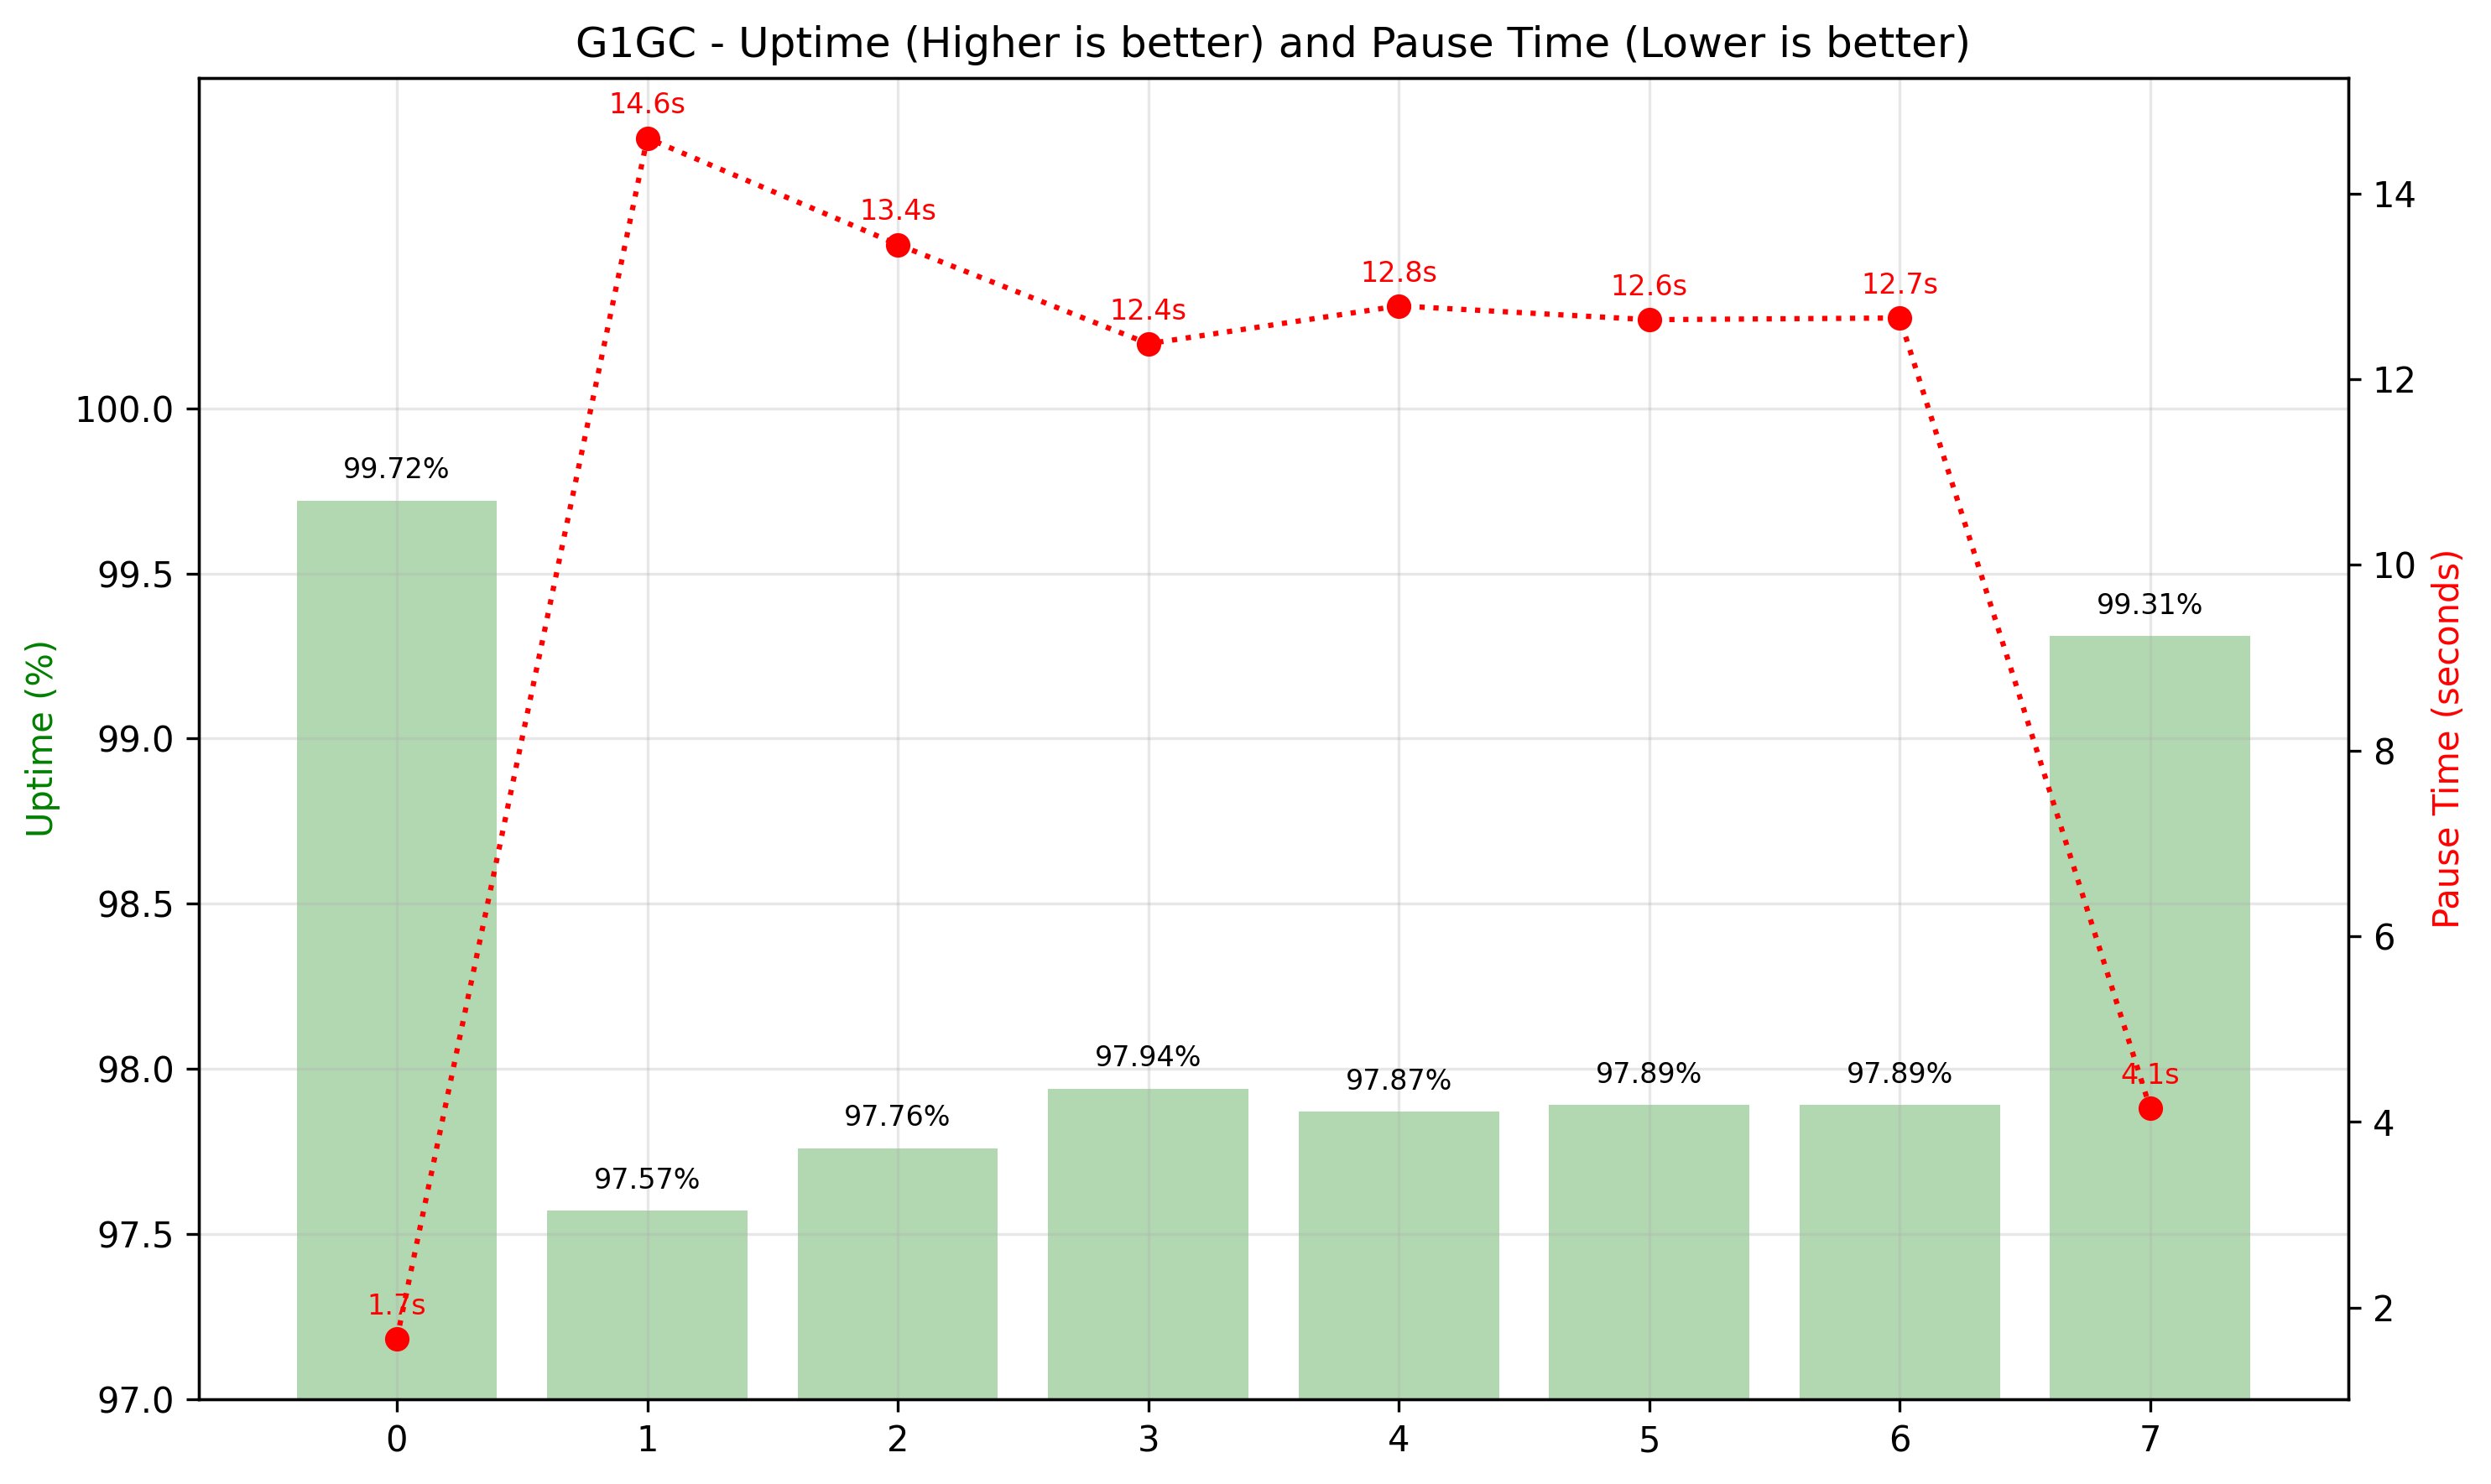
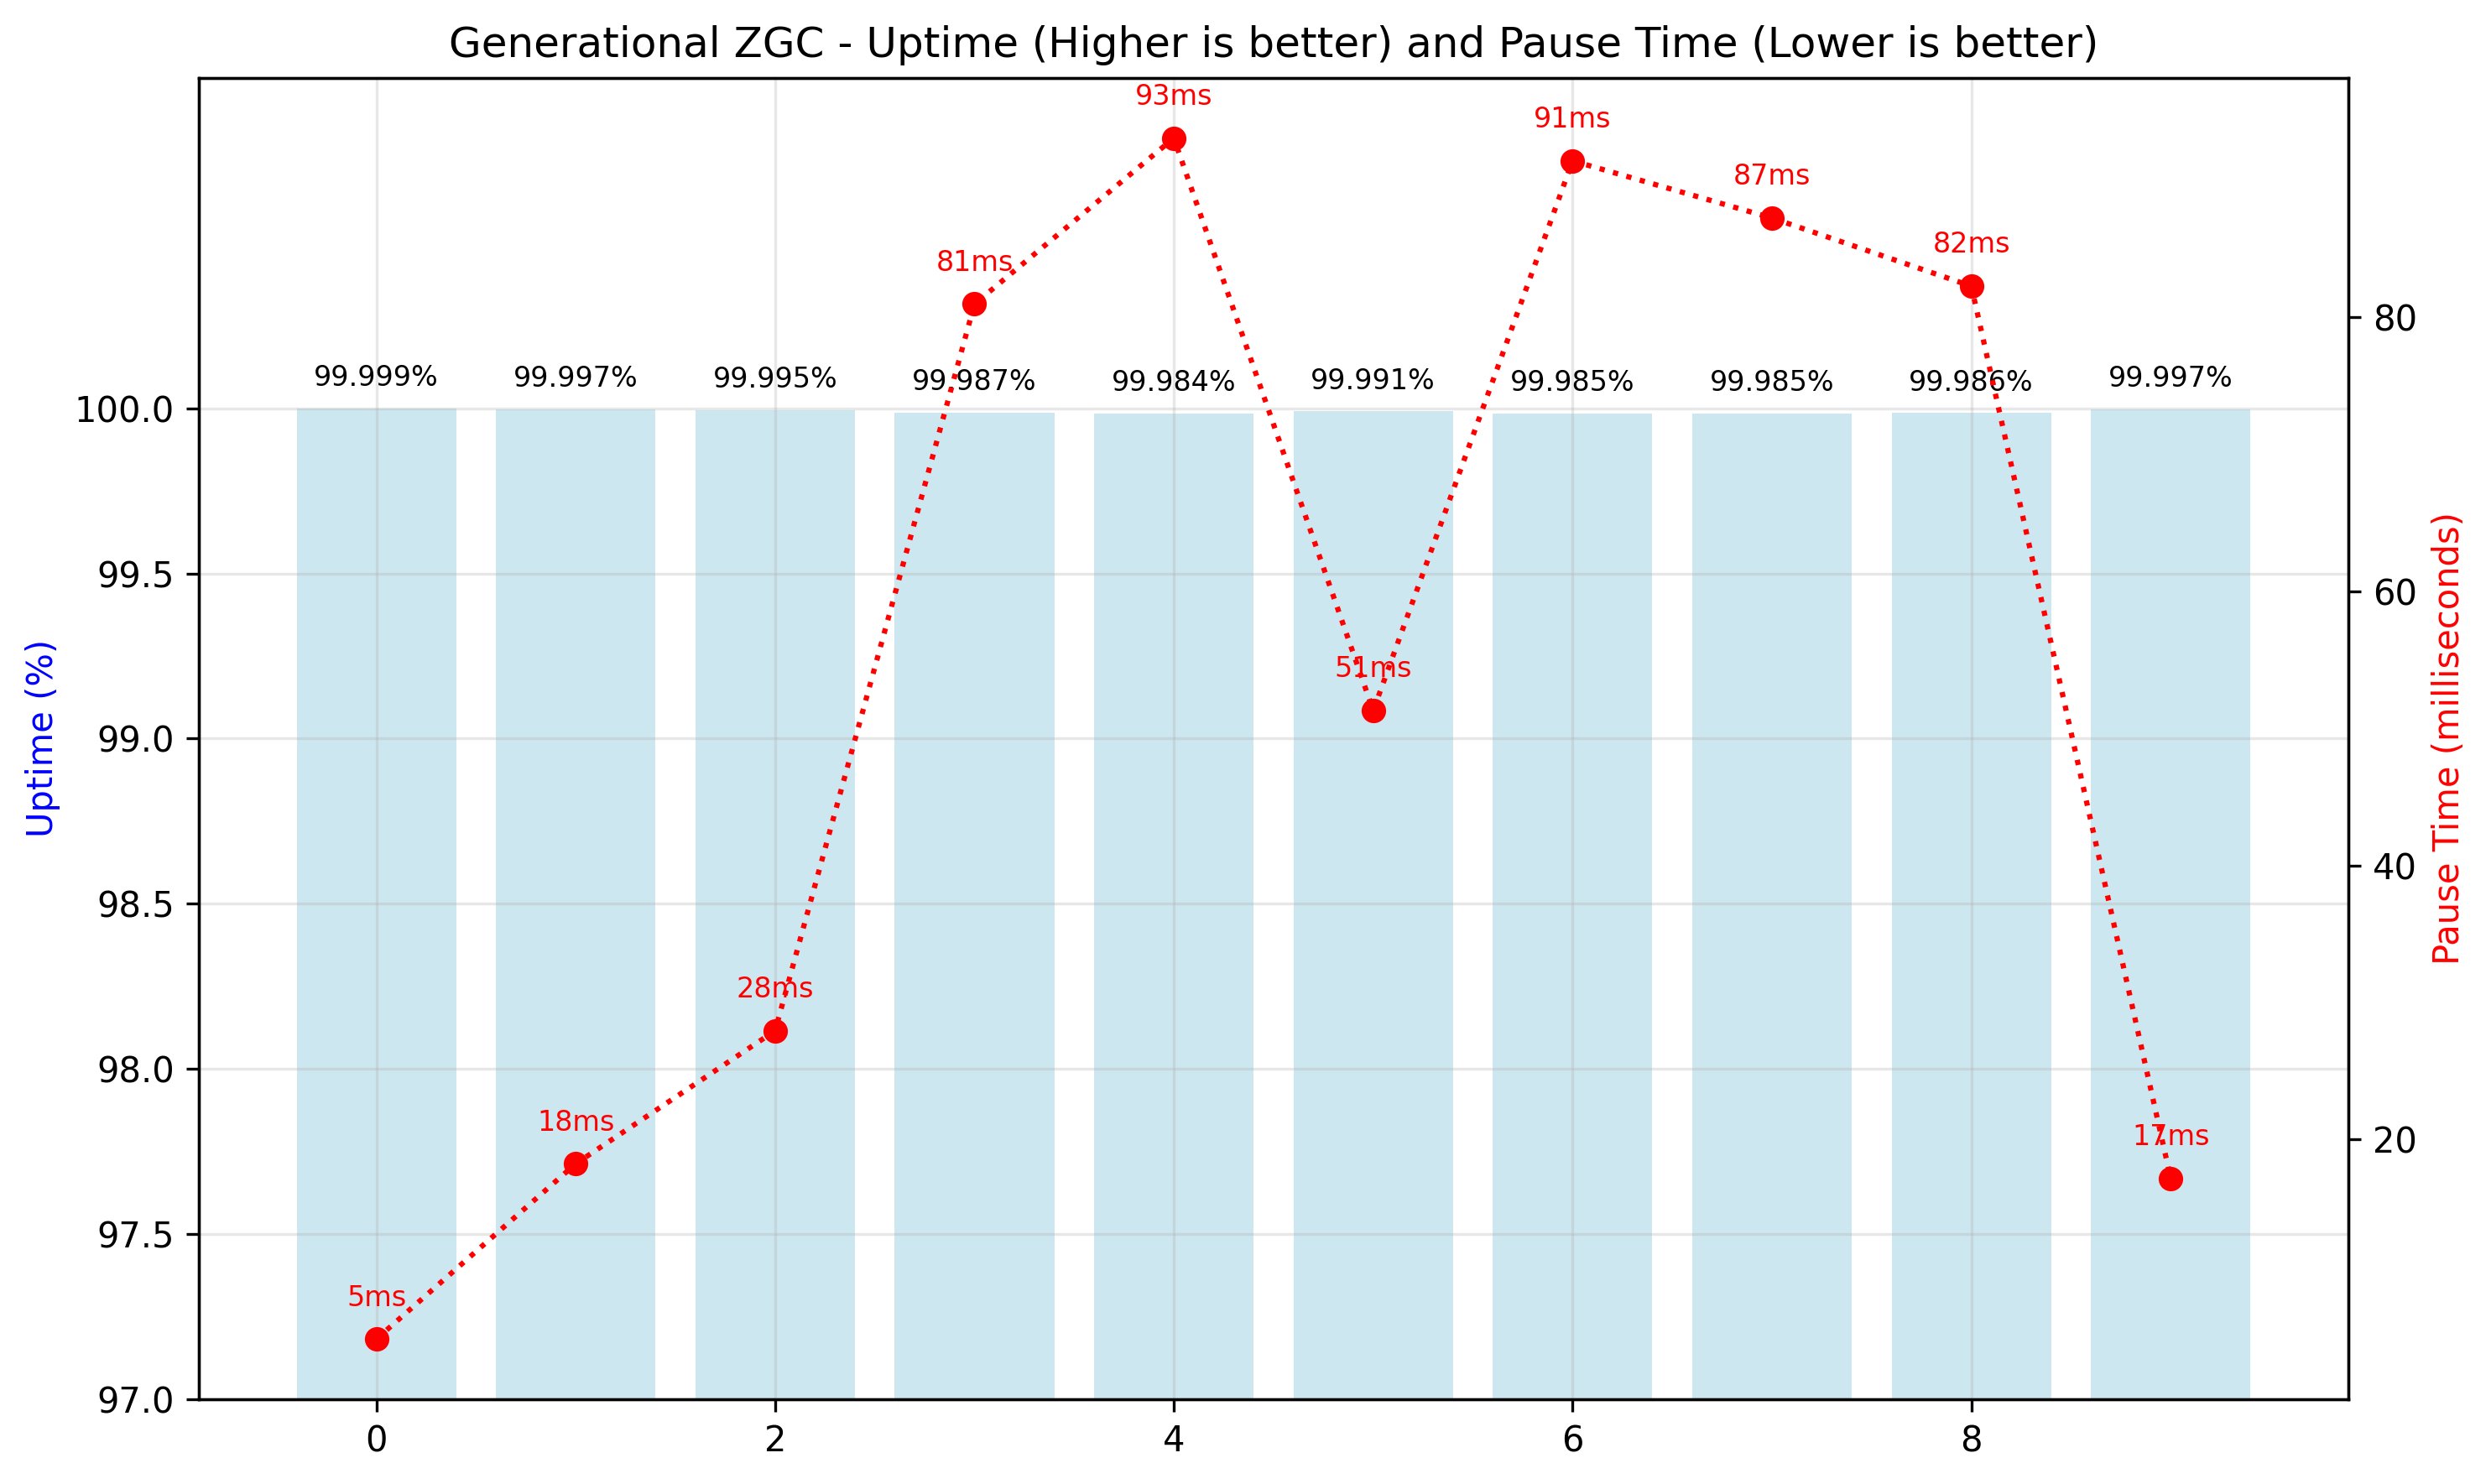
The following figures show the breakdown of the 1-hour runtime in 10-minute intervals. The left vertical axis measures the uptime, the right vertical axis measures the GC pause time, and the horizontal axis shows the interval. The generational ZGC maintained consistent uptime and pause time in milliseconds, and G1 GC demonstrated inconsistent and decreased uptime, pause times in seconds.

G1GC performance chart with dual y-axes: uptime percentage bars declining from 99.72% to 99.31%, and pause time trend peaking at 14.6s

Generational ZGC performance visualization with consistent uptime above 99.98% and fluctuating pause times peaking at 93ms

Tail latency comparison: Generational ZGC vs. G1GC in Amazon EMR HBase

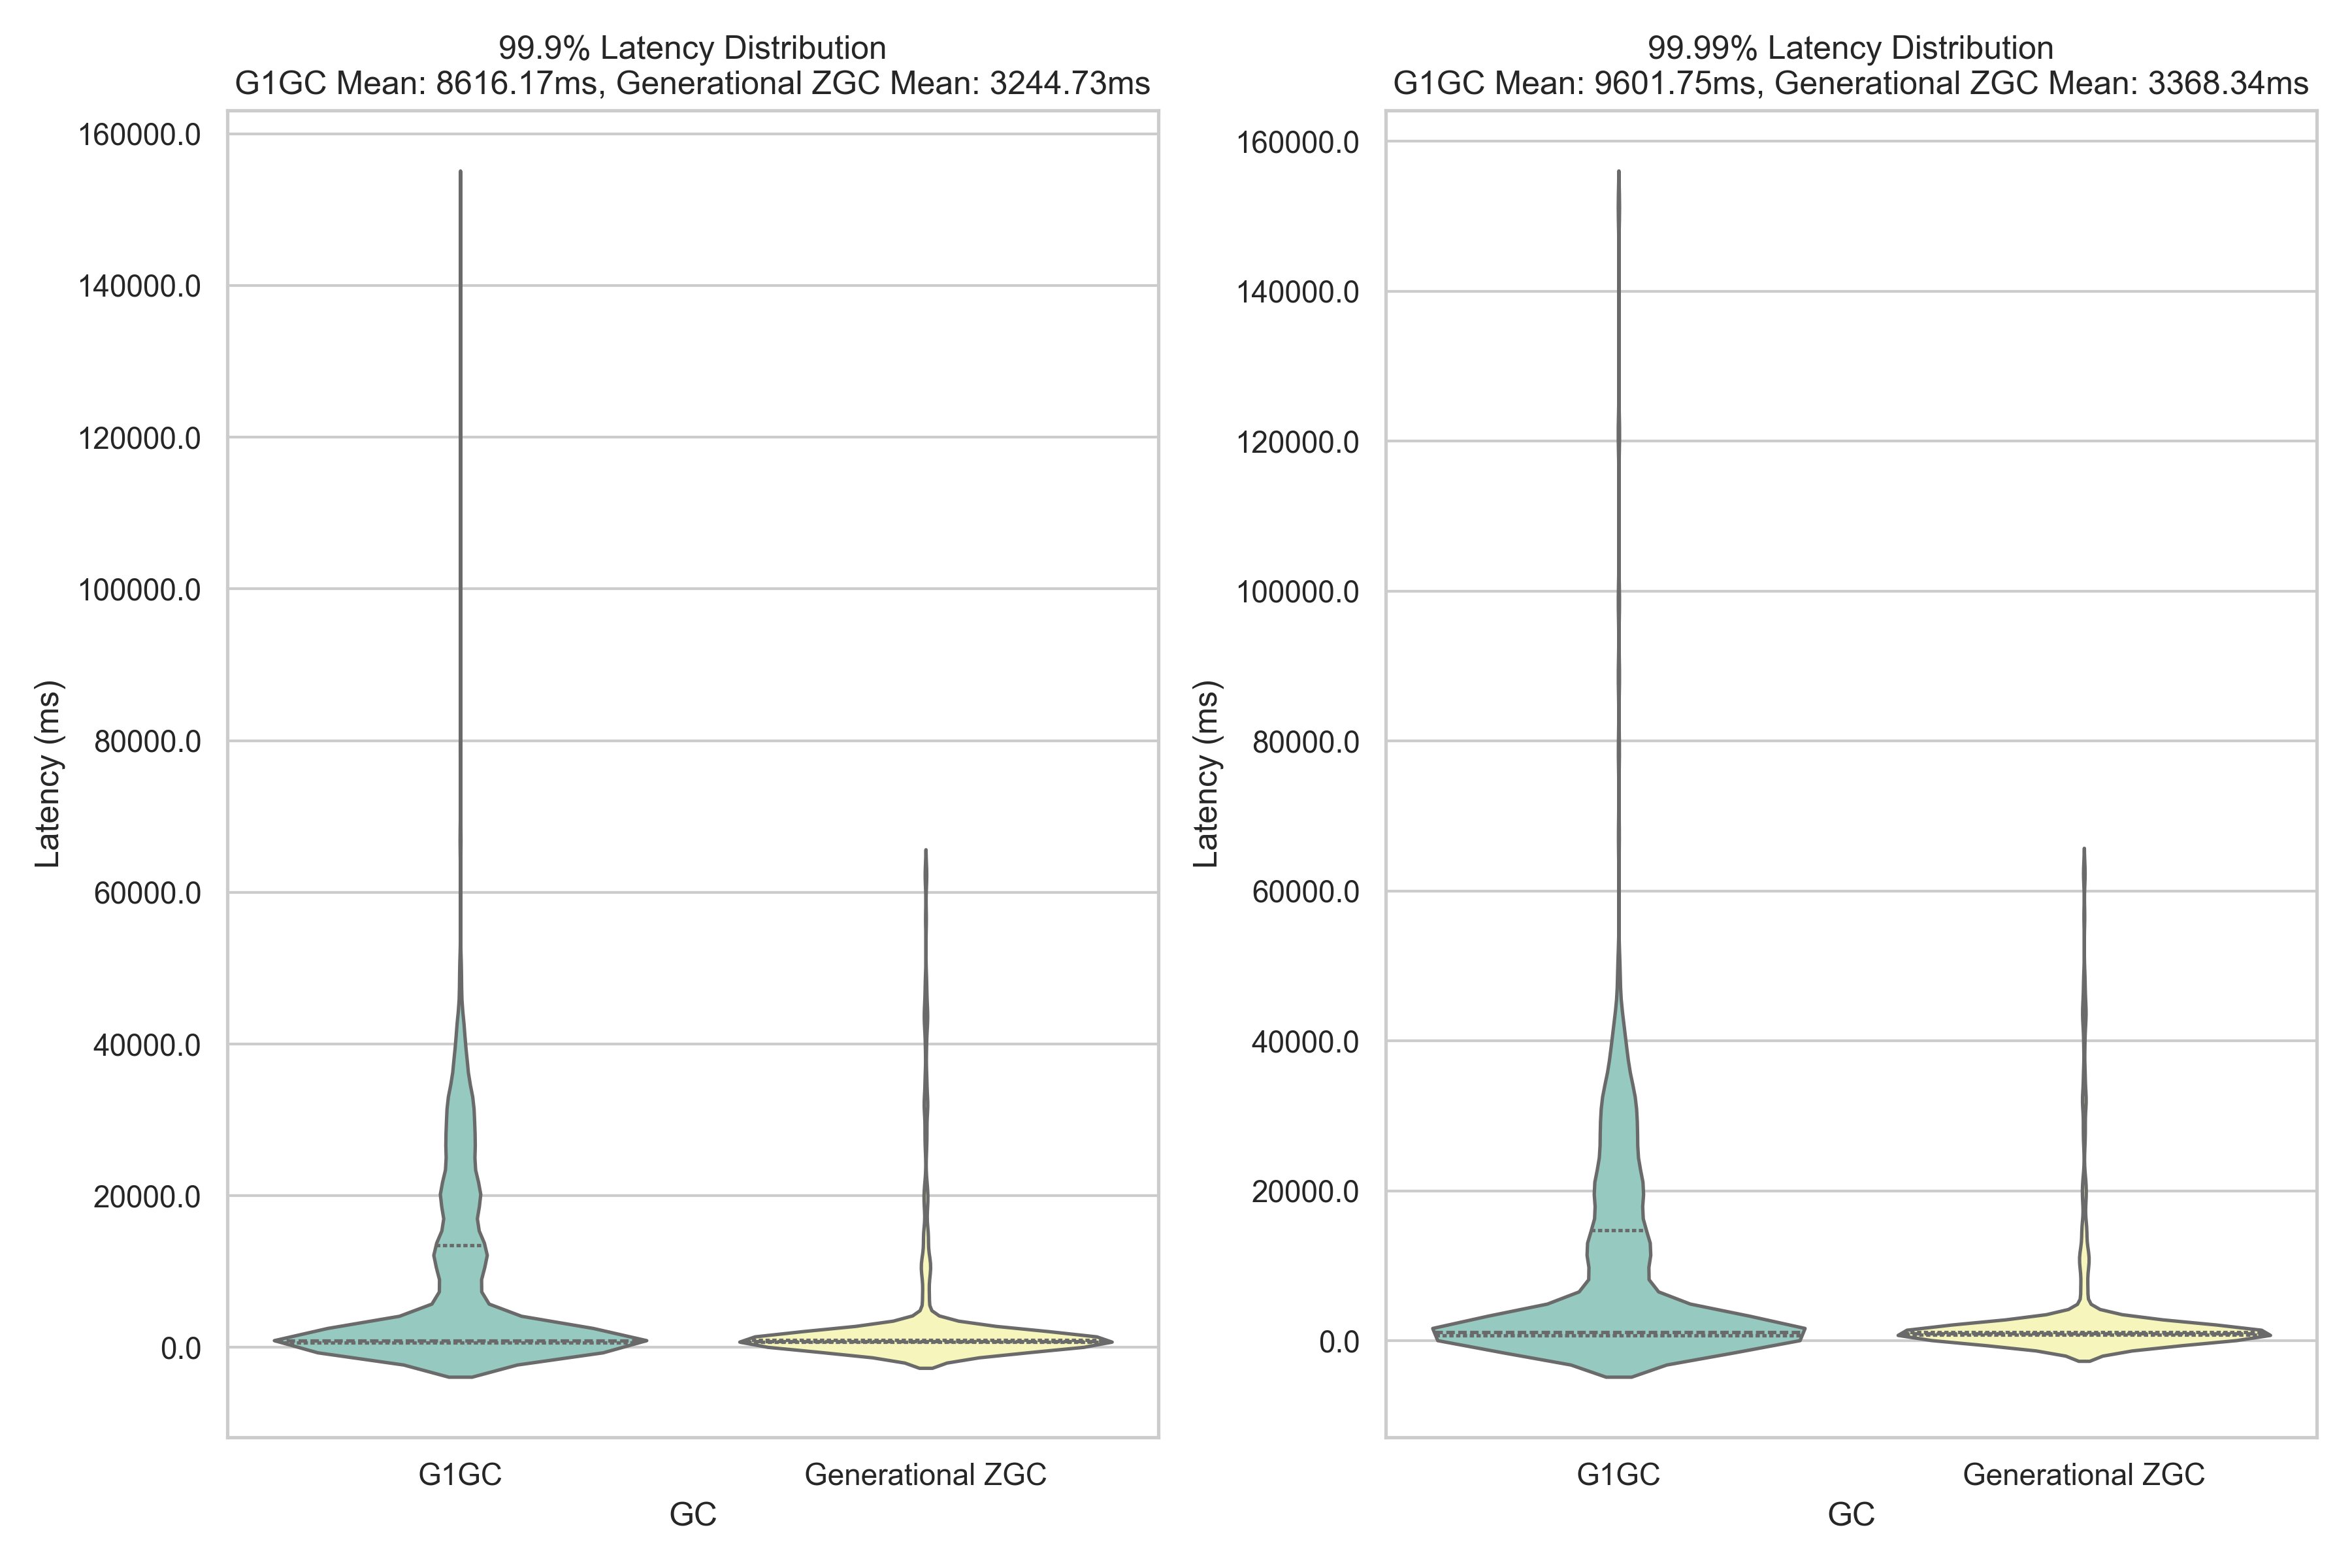
One of the most compelling advantages of generational ZGC over G1 GC is its predictable garbage collection behavior and the impact on application tail latency. G1 GC’s collection triggers are non-deterministic, meaning pause times can vary significantly and occur at unpredictable intervals. These unexpected pauses, though generally manageable, can create latency spikes that particularly affect the slowest percentile of operations. In contrast, generational ZGC maintains consistent, sub-millisecond pause times throughout its operation. This predictability proves crucial for applications requiring stable performance, especially at the highest percentiles of latency (99.9th and 99.99th percentiles). Our YCSB benchmark testing reveals the real-world impact of these different approaches. The following graph illustrates tail latency distribution between G1 GC and generational ZGC over a 2-hour sampling period :

Dual violin plot visualization comparing garbage collector latency distributions, demonstrating Generational ZGC's superior performance with lower mean latencies and tighter distribution

Improvements to BucketCache

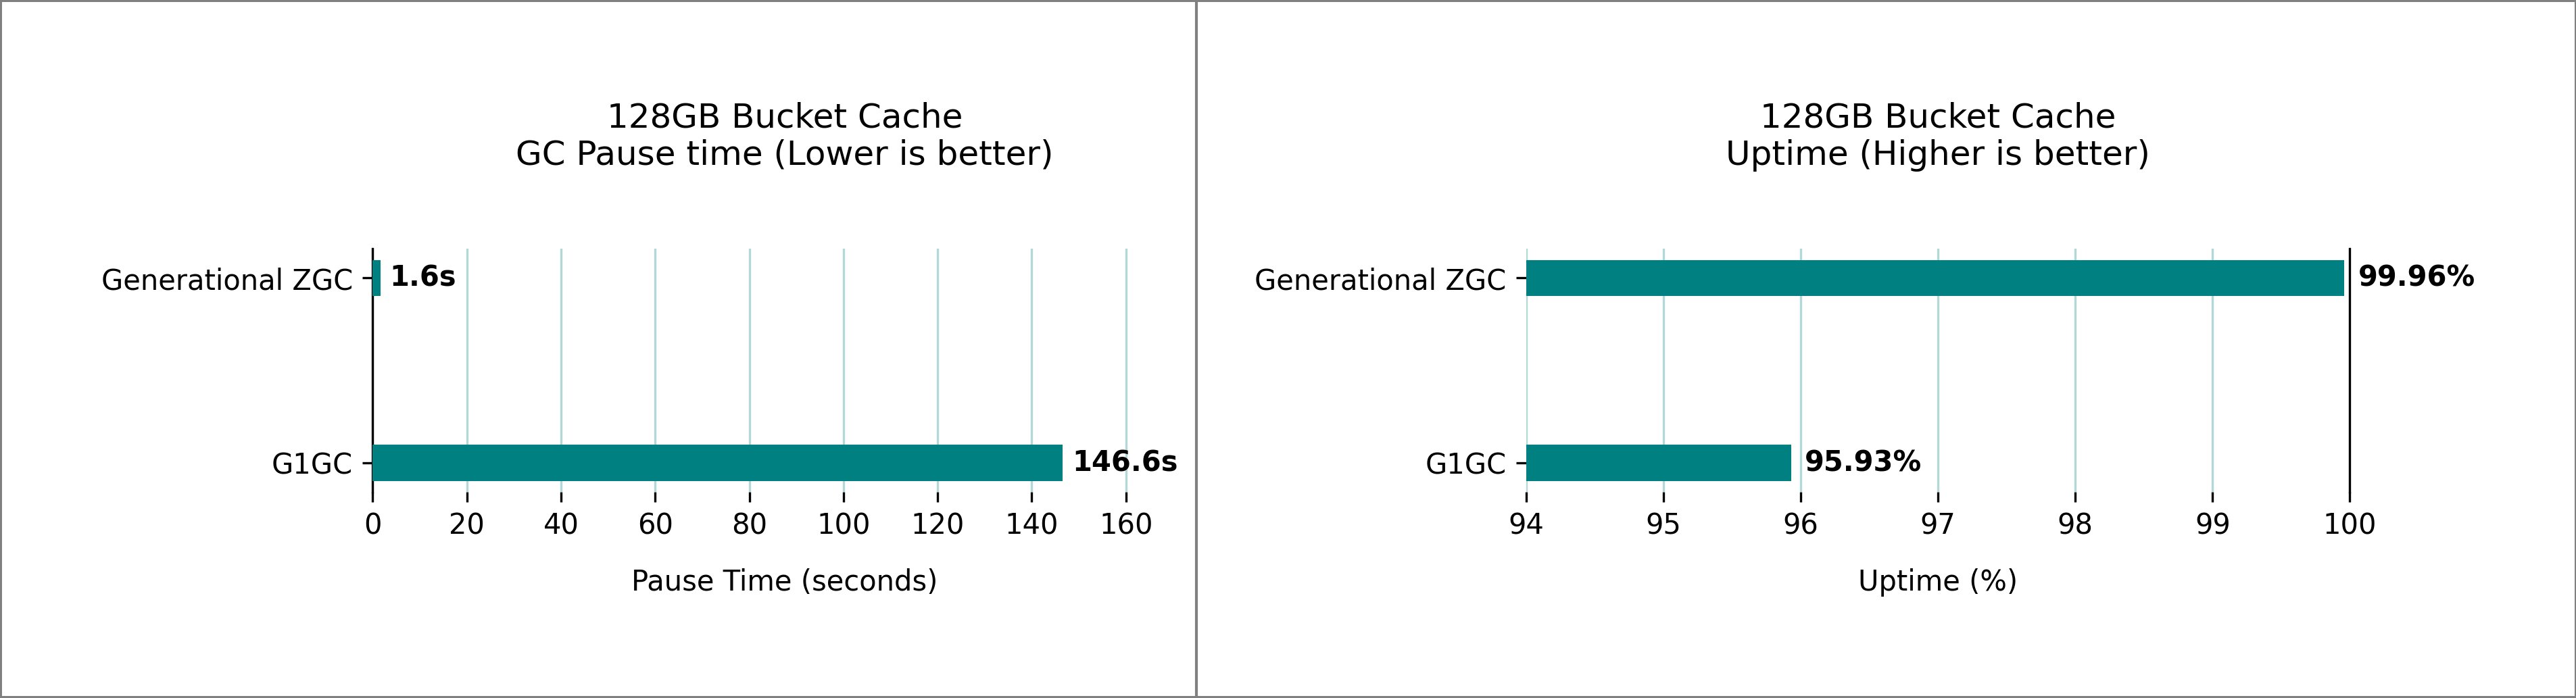
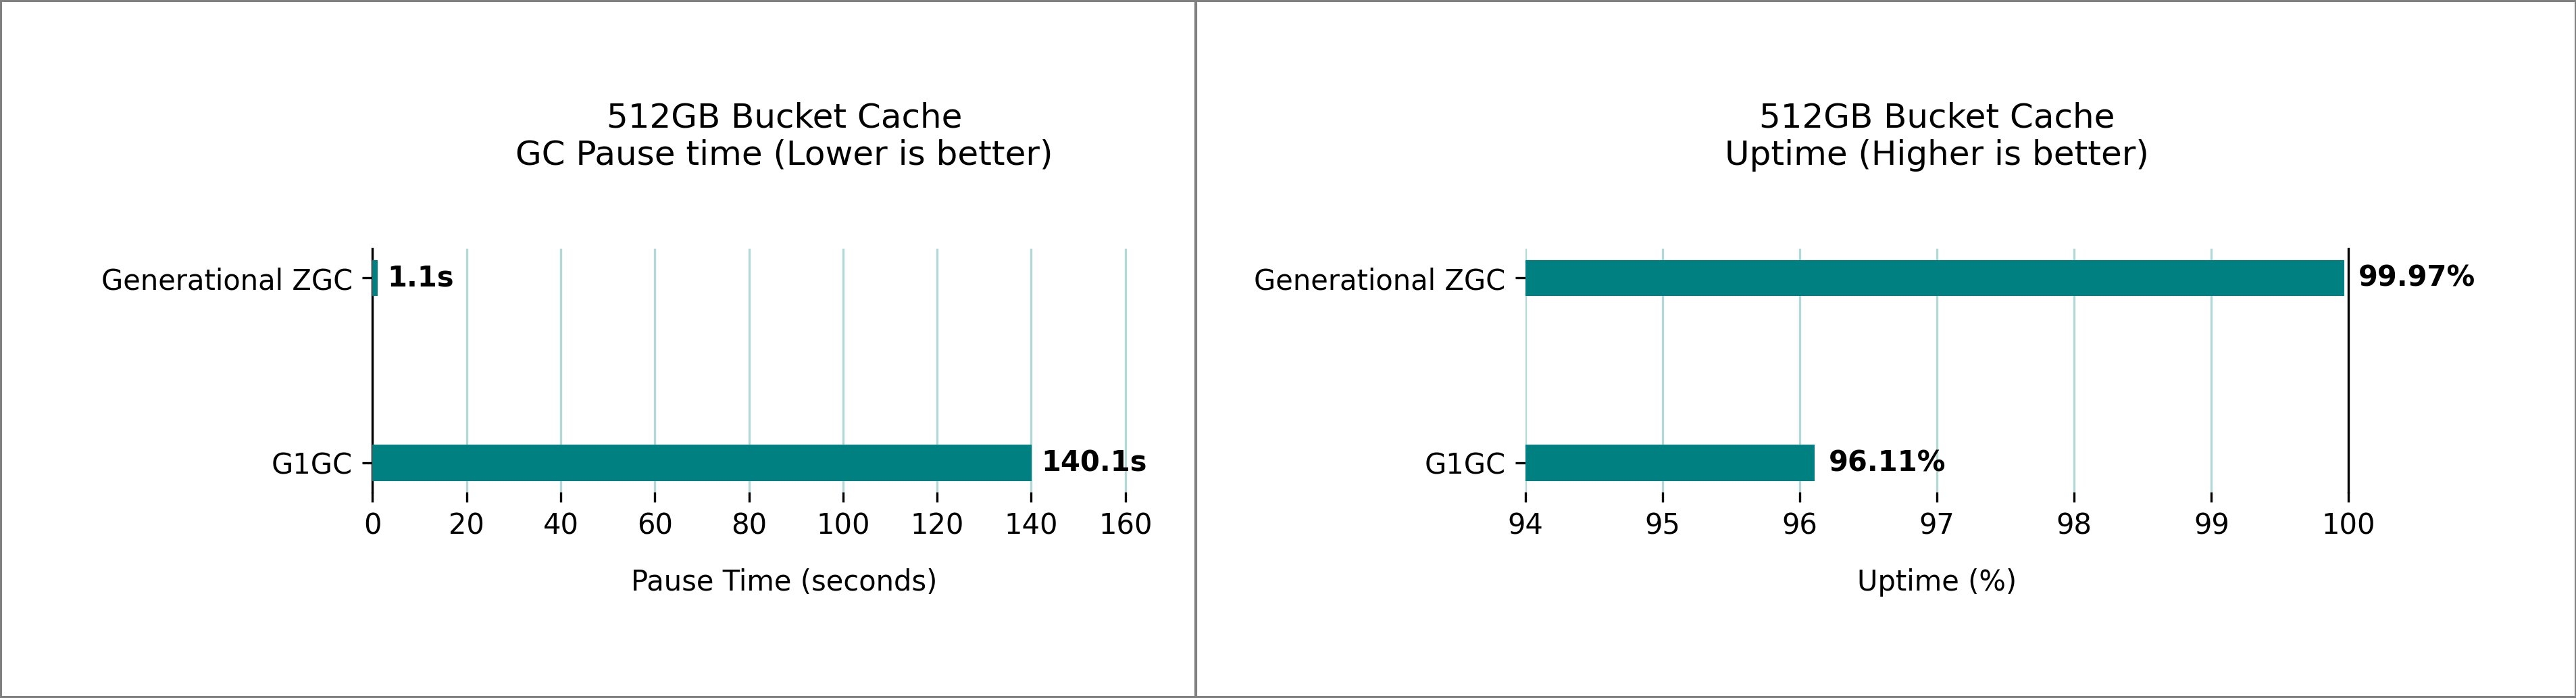
BucketCache is an off-heap cache in HBase that is used to cache the frequently accessed data blocks and minimize disk I/O. Bucket cache and heap memory works in conjunction and might increase the contention on the heap depending on the workload. Generational ZGC maintains it’s pause time goals even with a terabyte-sized bucket cache. We benchmarked multiple HBase clusters with varying bucket cache sizes and 32 GB RegionServer heap. The following figures show the peak pause times observed over a 1-hour sampling period, comparing G1 GC and generational ZGC performance.

128GB Bucket Cache performance metrics displaying Generational ZGC's superior pause times and uptime compared to G1GC implementation

Side-by-side performance metrics showing Generational ZGC's 1.1s pause time and 99.97% uptime versus G1GC's longer pauses and lower uptime

Enabling this feature and additional fine-tuning parameters

To enable this feature, follow the configurations mentioned in the Performance Considerations. In the following sections, we discuss additional fine-tuning parameters to tailor the configuration for your specific use case.

Fixed JVM heap 

Batch processing jobs and short-lived applications benefit from dynamic allocation’s ability to adapt to varying input sizes and processing demands when multiple applications co-exist on the same cluster and run with resource constraints. The memory footprint can expand during peak processing and contract when the workload diminishes. However, for production HBase deployments without any co-existing applications in the same fixed heap allocation offers stable, reliable performance.

Dynamic heap allocation is when the JVM flexibly grows and shrinks its memory usage between minimum (-Xms) and maximum (-Xmx) limits based on application needs, returning unused memory to the operating system. However, this flexibility comes at the cost of performance overhead and memory fragmentation. Dynamic allocation seemed flexible, but it created constant disruptions. The JVM was always negotiating with the operating system for memory, leading to performance overhead and fragmentation. On the other hand, fixed heap allocation pre-allocates a constant amount of memory for the JVM at startup and maintains it throughout runtime, providing better performance by reducing memory negotiation overhead with the operating system. To enable this feature, use the following configuration: :

[
    {
        "Classification": "hbase",
        "Properties": {
            "hbase.regionserver.fixed.heap.enabled": "true"
        }
    }
]

Enable pre-touch

Applications with large heaps can experience more significant pauses when the JVM needs to allocate and fault in new memory pages. Pre-touch (-XX:+AlwaysPreTouch) instructs the JVM to physically touch and commit all memory pages during heap initialization, rather than waiting until they’re first accessed during runtime. This early commitment reduces the latency of on-demand page faults and memory mappings that occur when pages are first accessed, resulting in more predictable performance especially during heavy load situations. By pre-touching memory pages at startup, you trade a slightly longer JVM startup time for more consistent runtime performance. To enable pre-touch for your HBase cluster, use the following configuration :

[
    {
        "Classification": "hbase-env",
        "Properties": {},
        "Configurations": [
            {
                "Classification": "export",
                "Properties": {
                    "JAVA_HOME": "/usr/lib/jvm/jre-21",
                    "HBASE_REGIONSERVER_GC_OPTS": "\"-XX:+UseZGC -XX:+ZGenerational -XX:+AlwaysPreTouch\""
                }
            }
        ]
    }
]

Increasing memory mappings for large heaps

Depending on the workload and scale, you might need to increase the Java heap size to accommodate large data in memory. When using the generational ZGC with a large heap setup, it’s critical to also increase the operating system’s memory mapping limit (vm.max_map_count).

When a ZGC-enabled application starts, the JVM proactively checks the system’s vm.max_map_count value. If the limit is too low to support the configured heap, it will issue the following warning :

[warning] The system limit on number of memory mappings per process might be too low for the given
[warning] max Java heap size (131072M). Please adjust /proc/sys/vm/max_map_count to allow for at
[warning] least 235929 mappings (current limit is 65530). Continuing execution with the current
[warning] limit could lead to a premature OutOfMemoryError being thrown, due to failure to map memory.

To increase the memory mappings, use the following configuration and adjust the count value in the command based on the heap size of the application.

echo "vm.max_map_count = 262144" | sudo tee -a /etc/sysctl.conf
sudo sysctl -p

sudo systemctl restart hbase-regionserver

Conclusion

The introduction of generational ZGC and fixed heap allocation for HBase on Amazon EMR marks a significant leap forward in the predictable performance and tail latency reduction. By addressing the long-standing challenges of GC pauses and memory management, these features unlock new levels of efficiency and stability for Amazon EMR HBase deployments. Although the performance improvements vary depending on workload characteristics, you can expect to see significant enhancements in your Amazon EMR HBase clusters’ responsiveness and stability. As data volumes continue to grow and low-latency requirements become increasingly stringent, features like generational ZGC and fixed heap allocation become indispensable. We encourage HBase users on Amazon EMR to enable these features and experience the benefits firsthand. As always, we recommend testing in a staging environment that mirrors your production workload to fully understand the impact and optimize configurations for your specific use case.

Stay tuned for more innovations as we continue to push the boundaries of what’s possible with HBase on Amazon EMR.


About the authors

Vishal Chaudhary is a Software Development Engineer at Amazon EMR. His expertise is in Amazon EMR, HBase and Hive Query Engine. His dedication towards solving distributed system problems is helping Amazon EMR to achieve higher performance improvements.

Ramesh Kandasamy is an Engineering Manager at Amazon EMR. He is a long tenured Amazonian dedicated to solve distributed systems problems.