Tag Archives: predictive analytics

Predicting Risk in Content Launches: How Data-Driven Insights can Transform Launch Planning

Post Syndicated from Netflix Technology Blog original https://medium.com/netflix-techblog/predicting-risk-in-content-launches-how-data-driven-insights-can-transform-launch-planning-587b1f2de928

by Emily Gill

Each year, we bring the Analytics Engineering community together for an Analytics Summit — a multi-day internal conference to share analytical deliverables across Netflix, discuss analytic practice, and build relationships within the community. This post is one of several topics presented at the Summit highlighting the breadth and impact of Analytics work across different areas of the business.

Understanding Risk in Content Launches

Every title you see on Netflix goes through several key phases: Development, Pre-Production, Production/Principal Photography, Post-Production, and finally, Launch Preparation, all leading up to the Title Launch. Once Principal Photography wraps, the focus shifts in Post-Production from content creation to quality assurance and visual effects (if needed).

At the end of Post Production, Netflix receives the final audio and video files — often delivered as an IMF (Interoperable Master Format) — which triggers a flurry of Launch Preparation activities, focused on tasks such as the development of artwork and trailers, creation of subtitles, maturity ratings & quality control, that happen within a tight window and rely on having the finalized media assets in hand.

Some of this work can be kicked off earlier using a non-final version of the media called the Locked Cut, but since it’s not the absolute final deliverable, this presents a tradeoff: should our teams who prepare content for service wait for the more finalized IMF to begin their work, or start sooner with the unfinal Locked Cut? Waiting for the IMF risks a compressed timeline if it arrives late, while starting with the Locked Cut means teams may need to do additional conformance work if there are significant changes between the Locked Cut and the final IMF.

Identifying Gaps in Schedule Accuracy

To help navigate the decision of when to start launch preparation, our teams rely on estimated delivery dates for both the Locked Cut and IMF media assets, which are manually provided by content partners in production schedules. However, these schedules often have gaps in coverage and lack accuracy for both asset types (see Figure 1).
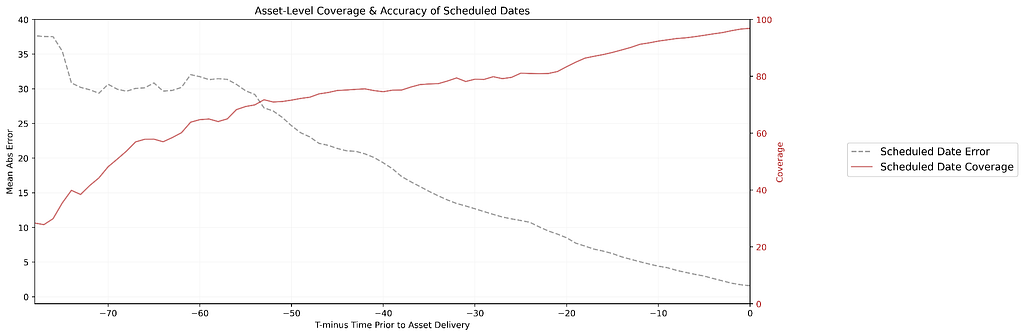
Figure 1. At an asset-level we generally see that scheduled date accuracy and coverage are lower at horizons further from asset delivery. As we approach delivery (moving towards the right on this plot) schedules become more accurate (errors decrease) adn coverage improves.

This isn’t unexpected — productions are dynamic, facing frequent changes, scheduling conflicts, and unforeseen obstacles that can shift timelines without warning. As a result, there’s a clear opportunity to leverage the wealth of production data we collect to predict the risk of schedule slips. By developing a predictive model, we aim to both fill in ETA gaps (providing asset delivery estimates when none exist) and improve the accuracy of existing ETAs compared to traditional manual schedules.

Correlation between Schedule Accuracy and Launch Misses

Our analysis reveals a strong correlation between scheduled inaccuracies and launch misses — instances where a title experiences delays. To quantify schedule inaccuracy, we created a metric called Accumulated Error Days (AED), which measures the cumulative deviation between estimated (scheduled or predicted) delivery dates and actual delivery dates over time. AED is calculated retrospectively as the area between the scheduled (grey line) or predicted (blue line) delivery dates and the actual delivery date (green line).

When we compare titles with at least one launch miss to those without, we find that mean AED is significantly higher in the group with launch misses. Notably, this effect is even more pronounced when we focus on the period closer to delivery — indicating that high AED (i.e., inaccurate schedules) in the final stretch before launch is especially correlated with launch misses, more so than AED accumulated over a longer timeline. These findings further motivate our efforts to improve schedule accuracy and reduce AED by leveraging rich production data and predictive modeling.

Modeling Time-to-Delivery

Our predictive models are designed as boosted tree regression models that predict the “days until” either media asset delivery for in-progress productions.

To power these models, we leverage a range of upstream data sources including production-level signals of progress, title metadata, and seasonal signals. We are able to predict the days until media asset delivery using daily update snapshots, allowing us to generate up-to-date predictions that reflect the latest state of each in-progress production. This means that we have each feature and what its value was as of each day of a production. Modeling with this snapshotted data enables us to generate up-to-date predictions as new information becomes available, build a flexible model that works across all production phases, and seamlessly incorporate dynamic features that evolve over time (Figure 2).
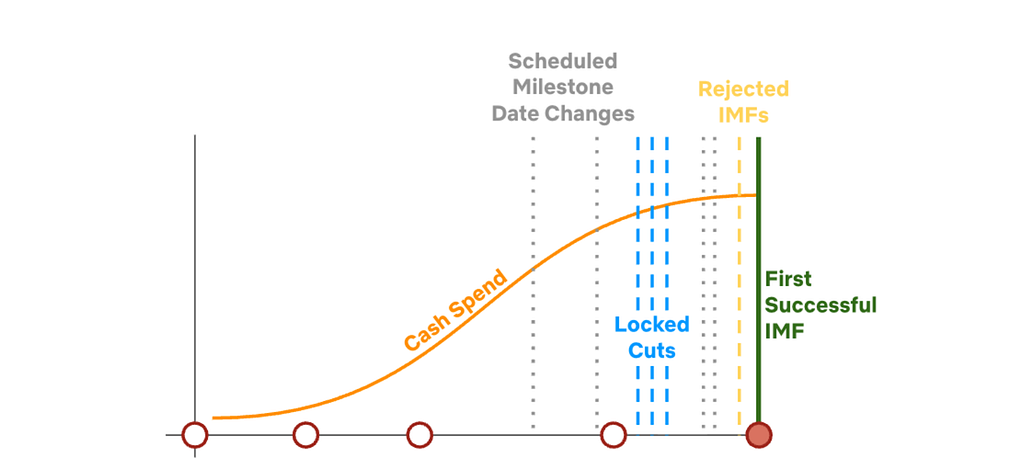
Figure 2. Hypothetical illustration of the evolving nature of production-related signals used in our models. Some signals are present throughout but dynamic, others are present at single moments in time during specific production phases. By capturing data in a snapshotted form, we’re able to build a flexible phase-agnostic model that leverages many different types of progress signals. This figure is illustrative only and does not depict actual Netflix financial or production data.

Evaluating Our Approach

Building a Comprehensive Metrics Suite

When evaluating the performance of the predictive models, we look across a suite of metrics to try to understand where and when predicted dates outperform scheduled dates. Among these are mean and median absolute error, relative to actual delivery, to understand the accuracy of our estimated dates. We also consider bias metrics, such as mean and median error, to understand if we are consistently over- or under-predicting the actual delivery. We calculate the standard deviation of our errors to understand if there are large shifts in the bulk of the distribution of errors. For the tails of our error distributions, we calculate the percentage of our absolute errors that are greater than x days to delivery.

For scheduled dates, we calculate coverage across various horizons to delivery. This is a value prop of the model; we’ve built the model in such a way that we can always provide a predicted date and recoup any coverage gaps that exist from scheduled dates alone.

Benchmarking Against Manual Scheduling

In a backtest, we observed significant improvements across all of our metrics and across most horizons from delivery. As an example, see Figure 3 which plots global mean absolute error (MAE) and shows large reductions in errors (greater accuracy) in predicted IMF and Locked dates as compared to scheduled dates. Additionally, we see large reductions in outliers from scheduled to predicted dates as well.
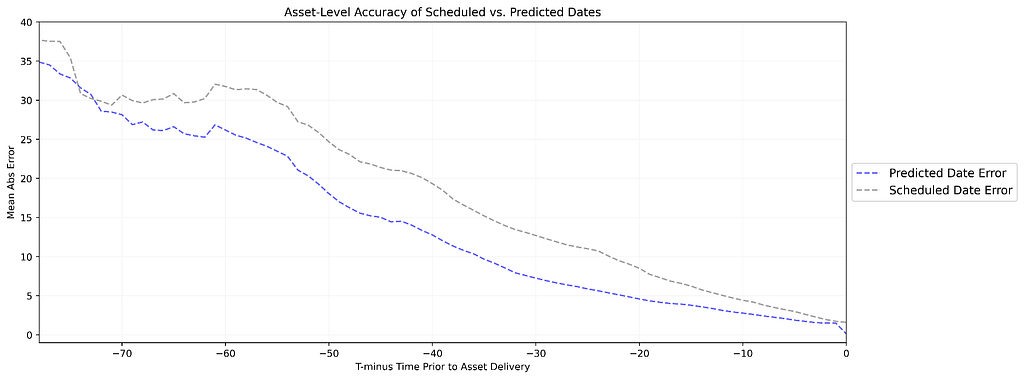
Figure 3. This plot compares accuracy (measured as Mean Absolute Error) between predicted and scheduled dates. The horizontal axis plots time prior to delivery, which decreases from left to right until you reach the moment of delivery at the bottom right. For this particular asset, the predicted delivery dates on average are much more accurate than manually scheduled delivery dates throughout the full horizon to delivery.

Since our teams use these dates over a period of time and not at a single point in time, there is an additional benefit that we’re describing as an Earlier Accuracy Signal. By leveraging predictive dates, our teams benefit from a level of accuracy that they would otherwise have to wait x amount of time for if using scheduled dates. As an example, 6 months out from Locked Cut delivery the predicted dates are better than scheduled dates on 76% of titles and have a level of accuracy (6.1 wks MAE) that scheduled dates don’t reach until 11 weeks later.

Circling back to AED, which we mentioned earlier is correlated to launch misses, we find that in our backtested titles globally, and across most buying orgs and content types (i.e., series versus standalones), predicted IMF and Locked Cut dates reduce AED from scheduled dates when calculated across the 6 months leading up to delivery. We see similar patterns when we repeat this for shorter horizons to delivery as well.

Streamlining Workflows with Improved Scheduling

A key advantage of this predictive model is that estimated delivery dates are already integral to our stakeholders’ workflows — meaning we can introduce predictive dates without overhauling existing processes. However, this creates a new challenge: with both scheduled and predicted dates available, teams need to determine which is more reliable. While predictive dates are often more accurate on average, there are situations where scheduled dates perform better. To address this, we’ve built serving logic that defaults to scheduled dates in buying orgs where the model underperforms. Elsewhere, teams can view both dates side by side in dashboards, allowing them to apply their own judgment. Additionally, our predictive models leverage features that are tied to scheduled dates, which has emphasized the need and impact of ensuring our upstream teams continue to input and update scheduled dates even in the presence of our predictions. We’re piloting these predictive signals in multiple ways, tailoring the approach to fit the diverse needs and tools of our various launch prep functions.


Predicting Risk in Content Launches: How Data-Driven Insights can Transform Launch Planning was originally published in Netflix TechBlog on Medium, where people are continuing the conversation by highlighting and responding to this story.

New Amazon Virtual Andon 3.0 – Automate Issue Resolution via APIs and Predictive Services

Post Syndicated from Ajay Swamy original https://aws.amazon.com/blogs/architecture/new-amazon-virtual-andon-3-0-automate-issue-resolution-via-apis-and-predictive-services/

Developing a modern manufacturing enterprise requires careful thought and attention to several priorities. Predictive maintenance and issue resolution automation are likely high on your list. Maximizing your operational efficiency and optimizing output are critical in this competitive global market. As demand grows, manufacturers are under pressure to fulfill increased production needs.

A recent report from McKinsey on Industry 4.0 technologies discusses pandemic implementations such as digital issue detection and resolution. These solutions are critical for crisis response in the COVID-19 era. 30% of manufacturers have highlighted increased operational productivity, reduced time-to-market, and reduction in cost as major strategic imperatives for their Industry 4.0 transformation.

Amazon Virtual Andon 3.0 (AVA) is an Amazon Web Services (AWS) Solution that provides a scalable, digital Andon system to help detect and resolve issues. It optimizes processes, supports your transition to predictive maintenance, and helps prevent future equipment failures.

Overview of new features

AVA provides factory and fulfillment center associates with an intuitive, responsive web interface and workflow. This can be used to raise issues, route those issues to the appropriate engineers, and resolve them in a timely way. With AVA, you can associate explanatory root causes with resolved issues for more insightful reporting. Issue raising and resolution happen digitally. There’s no need for manual intervention (such as raising a manual alarm at a factory workstation.)

AVA introduces the capability to raise issues directly from devices and automated APIs. Flexible integrations can be made directly with your factory devices and systems. Additionally, the APIs integrate with Amazon Machine Learning (ML) services, such as Amazon Lookout for Equipment and Amazon Lookout for Vision. This enables you to automate ML inference into your AVA-based workflows.

With AVA 3.0, you can now monitor your factory floors for disruptions in near-real-time. You can respond and resolve issues quickly, minimizing production disruption. AVA 3.0 provides users with an analytics pipeline so you can create dashboards and custom reports.

Introducing GraphQL APIs

The solution introduces GraphQL APIs via AWS AppSync, secured through AWS Identity and Access Management (IAM) policies. This powers the web interface and functionality to create, route, and manage issues. With AVA GraphQL APIs, you can create and manage site hierarchies, devices, events, and raise and manage issues. For example, you can create an issue by calling the createIssue API to raise issues and track them to completion automatically.

createIssue
{
    id: "<string>",
    siteName: "<string>",
    areaName: "<string>",
    stationName: "<string>",
    deviceName: "<string>",
    processName: "<string>",
    eventId: "<string>",
    eventDescription: "<string>",
    eventType: "<string>",
    issueSource: "<string>",
    priority: "<string>",
    status: "<string>",
    created: "AWSDateTime",
    acknowledged: "AWSDateTime",
    closed: "AWSDateTime",
    acknowledgedTime: "<number>",
    resolutionTime: "<number>",
    createdBy: "<string>",
    additionalDetails: "<string>"
  }

Integration with Amazon Machine Learning services to raise issues automatically

With AVA APIs, you can integrate with predictive services like Amazon Lookout for Equipment (L4E). AVA provides an AWS Lambda function for detecting anomalies generated via L4E. It automatically calls the APIs to create issues for abnormal events.

When L4E detects anomalies in your machinery or production line, AVA can automatically raise issues for those anomalies (Figure 1). This gives you the visibility and tracking mechanism to ensure anomalies are resolved. You can create automated events and issues via APIs by integrating with Amazon Lookout for Equipment. You’re able to track anomalies with their details in near-real-time.

Figure 1. AVA displays anomalies raised from L4E. A prediction score of > 0 indicates that an anomaly has been detected, and AVA will raise an issue with the underlying sensor details.” width=”1063″ height=”611″></p>
<p id=Figure 1. AVA displays anomalies raised from L4E. A prediction score of > 0 indicates that an anomaly has been detected, and AVA will raise an issue with the underlying sensor details.

Direct device integration

AVA provides the capability to integrate with IoT devices via AWS IoT Core. You can configure your IoT devices to send data to the ava/issues AWS IoT Core topic. Additionally, AVA can send messages to the ava/devices AWS IoT Core topic to automatically raise issues via MQTT or HTTPS. It maps your machine name to an AVA device and a tag/value combination to an AVA event.

{
  "id": <ID!>,
  "eventId": String,
  "eventDescription": String,
  "type": String,
  "priority": String,
  "siteName": String,
  "processName": String,
  "areaName":" String,
  "stationName": String,
  "deviceName": String,
  "created": AWSDateTime,
  "acknowledged": AWSDateTime,
  "closed": AWSDateTime,
  "status": "open"
}

Analytics pipeline for custom dashboards

AVA uses Amazon DynamoDB to store factory configuration and issues data. All AVA data is exported from the DynamoDB database to an Amazon S3 bucket via an AWS Glue workflow. You can then use Amazon Athena to query underlying data and create custom reports using business intelligence (BI) solutions like Amazon QuickSight (Figure 2). With the analytics pipeline, you can create custom dashboards and monitor your factory operations holistically.

Figure 2. Custom dashboard generated via Amazon QuickSight

Figure 2. Custom dashboard generated via Amazon QuickSight

Architecture and workflow

Figure 3. AVA 3.0 architecture

Figure 3. AVA 3.0 architecture

The AWS CloudFormation template deploys the following infrastructure, shown in Figure 3:

  1. The AWS CloudFormation template provides an Amazon CloudFront web interface that deploys into an Amazon Simple Storage Service (Amazon S3) bucket configured for web hosting.
  2. An Amazon Cognito user pool allows this solution’s administrators to register users and groups using the web interface.
  3. AWS AppSync GraphQL APIs and AWS Amplify power the web interface. Amazon DynamoDB tables store the factory data.
  4. An AWS IoT rule engine helps you monitor manufacturing workstations or devices for events. It then routes the event to the correct engineer for resolution in real time.
  5. Authorized users can interact with and receive notifications from this solution. An AWS Lambda function and Amazon Simple Notification Service (Amazon SNS) send emails and SMS notifications.
  6. Issues created, acknowledged, and closed in the web interface are recorded and updated using AWS AppSync and DynamoDB.
  7. The AWS AppSync GraphQL APIs can be called directly with HTTP POST requests.
  8. If you are using L4E to monitor your machines, enter the name of the Amazon S3 bucket where inference files will be delivered in the Anomaly Detection Output Bucket CloudFormation parameter. This solution can be configured to automatically raise issues if an anomaly is detected.
  9. When the Activate Glue Workflow CloudFormation parameter is set to “Yes”, an AWS Glue workflow will be created to extract data from DynamoDB. It delivers this data via an AWS Glue Data Catalog into Amazon S3. For more information, refer to the Data Analysis section.
  10. You can use an existing SAML provider as an additional identity provider for access to this solution. You can configure the Amazon Cognito Domain Prefix, SAML Provider Name, and SAML Provider Metadata URL CloudFormation parameters. For more information, refer to SAML identity provider.

An intuitive UI with nested events

With AVA, you also can create nested events / issues, so you can more easily get to the root of the problem and resolve issues quickly. The solution builds upon the same intuitive UI as highlighted in this previous Amazon Virtual Andon blog post. In addition, it allows you to manage events granularly, create subevents, raise, and resolve issues and sub issues (Figure 4).

Figure 4. AVA allows you to raise issues and sub issues (for example, ‘Out of boxes’ allows you to specify the kind of boxes you need to resolve the issue)

Figure 4. AVA allows you to raise issues and sub issues (for example, ‘Out of boxes’ allows you to specify the kind of boxes you need to resolve the issue)

Conclusion

Amazon Virtual Andon (AVA) is a self-deployable solution that provides you the digital capability to create, route, manage, and resolve issues. With AVA, you can monitor your overall enterprise for issues and engage with the right engineers to resolve them promptly. It offers a clear, intuitive user interface and straightforward workflow to help team members resolve issues.

Get started with Amazon Virtual Andon today.