Post Syndicated from Mahesh Goyal original https://aws.amazon.com/blogs/big-data/analyzing-amazon-s3-server-access-logs-using-amazon-es/
When you use Amazon Simple Storage Service (Amazon S3) to store corporate data and host websites, you need additional logging to monitor access to your data and the performance of your application. An effective logging solution enhances security and improves the detection of security incidents. With the advent of increased data storage needs, you can rely on Amazon S3 for a range of use cases and simultaneously looking for ways to analyze your logs to ensure compliance, perform the audit, and discover risks.
Amazon S3 lets you monitor the traffic using the server access logging feature. With server access logging, you can capture and monitor the traffic to your S3 bucket at any time, with detailed information about the source of the request. The logs are stored in the S3 bucket you own in the same Region. This addresses the security and compliance requirements of most organizations. The logs are critical for establishing baselines, analyzing access patterns, and identifying trends. For example, the logs could answer a financial organization’s question about how many requests are made to a bucket and who is making what type of access requests to the objects.
You can discover insights from server access logs through several different methods. One common option is by using Amazon Athena or Amazon Redshift Spectrum and query the log files stored in Amazon S3. However, this solution poses high latency with an exponential growth in volume. It requires further integration with Amazon QuickSight to add visualization capabilities.
You can address this by using Amazon Elasticsearch Service (Amazon ES). Amazon ES is a managed service that makes it easier to deploy, operate, and scale Elasticsearch clusters in the AWS Cloud. Elasticsearch is a popular open-source search and analytics engine for use cases such as log analytics, real-time application monitoring, and clickstream analysis. The service provides support for open-source Elasticsearch APIs, managed Kibana, and integration with other AWS services such as Amazon S3 and Amazon Kinesis for loading streaming data into Amazon ES.
This post walks you through automating ingestion of server access logs from Amazon S3 into Amazon ES using AWS Lambda and visualizing the data in Kibana.
Architecture overview
Server access logging is enabled on source buckets, and logs are delivered to access log bucket. The access log bucket is configured to send an event to the Lambda function when a log file is created. On an event trigger, the Lambda function reads the file, processes the access log, and sends it to Amazon ES. When the logs are available, you can use Kibana to create interactive visuals and analyze the logs over a time period.
When designing a log analytics solution for high-frequency incoming data, you should consider buffering layers to avoid instability in the system. Buffering helps you streamline processes for unpredictable incoming log data. For such use cases, you can take advantage of managed services like Amazon Kinesis Data Streams, Amazon Kinesis Data Firehose, and Amazon Managed Streaming for Apache Kafka (Amazon MSK).
Streaming services buffer data before delivering it to Amazon ES. This helps you avoid overwhelming your cluster with spiky ingestion events. Kinesis Data Firehose can reliably load data into Amazon ES. Kinesis Data Firehose lets you choose a buffer size of 1–100 MiBs and a buffer interval of 60–900 seconds when Amazon ES is selected as the destination. Kinesis Data Firehose also scales automatically to match the throughput of your data and requires no ongoing administration. For more information, see Ingest streaming data into Amazon Elasticsearch Service within the privacy of your VPC with Amazon Kinesis Data Firehose.
The following diagram illustrates the solution architecture.

Prerequisites
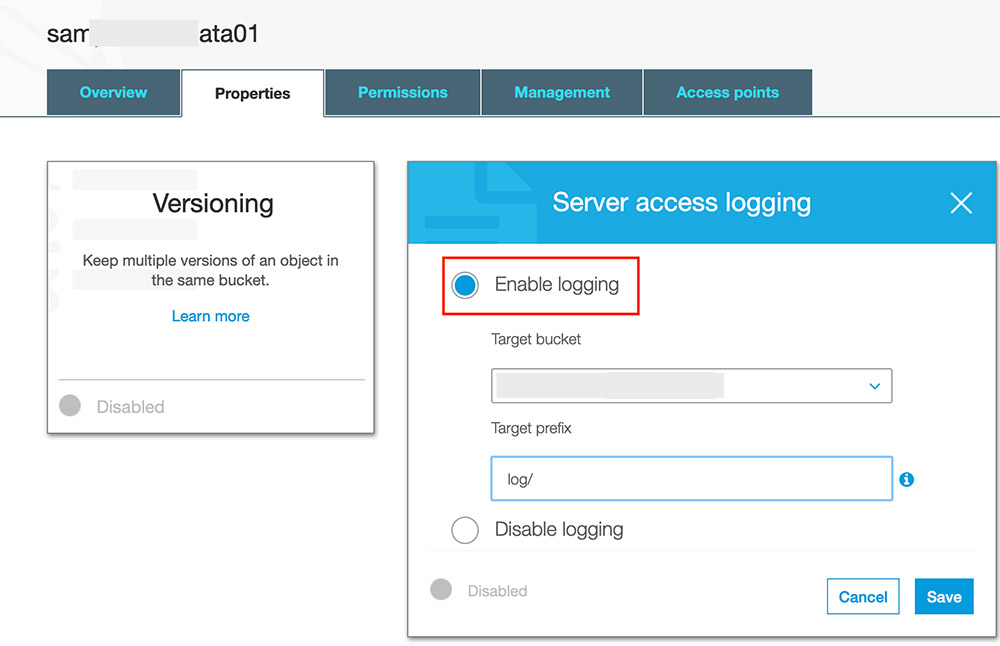
Before creating resources in AWS CloudFormation, you must enable server access logging on the source bucket. Open the S3 bucket properties and look for Amazon S3 access and delivery bucket. See the following screenshot.
You also need an AWS Identity and Access Management (IAM) user with sufficient permissions to interact with the AWS Management Console and related AWS services. The user must have access to create IAM roles and policies via the CloudFormation template.
Setting up the resources with AWS CloudFormation
First, deploy the CloudFormation template to create the core components of the architecture. AWS CloudFormation automates the deployment of technology and infrastructure in a safe and repeatable manner across multiple Regions and multiple accounts with the least amount of effort and time.
- Sign in to the console and choose the Region of the bucket storing the access log. For this post, I use
us-east-1. - Launch the stack:

- Choose Next.
- For Stack name, enter a name.
- On the Parameters page, enter the following parameters:
- VPC Configuration – Select any VPC that has at least two private subnets. The template deploys the Amazon ES service domain and Lambda within the VPC.
- Private subnets – Select two private subnets of the VPC. The route tables associated with subnets must have a NAT gateway configuration and VPC endpoint for Amazon S3 to privately connect the bucket from Lambda.
- Access log S3 bucket – Enter the S3 bucket where access logs are delivered. The template configures event notification on the bucket to trigger the Lambda function.
- Amazon ES domain name – Specify the Amazon ES domain name to be deployed through the template.
- Choose Next.

- On the next page, choose Next.
- Acknowledge resource creation under Capabilities and transforms and choose Create.

The stack takes about 10–15 minutes to complete. The CloudFormation stack does the following:
- Creates an Amazon ES domain with fine-grained access control enabled on it. Fine-grained access control is configured with a primary user in the internal user database.
- Creates IAM role for the Lambda function with required permission to read from S3 bucket and write to Amazon ES.
- Creates Lambda within the same VPC of Amazon ES elastic network interfaces (ENI). Amazon ES places an ENI in the VPC for each of your data nodes. The communication from Lambda to the Amazon ES domain is via this ENI.
- Configures file create event notification on Access log S3 bucket to trigger the Lambda function. The function code segments are discussed in detail in this GitHub project.
You must make several considerations before you proceed with a production-grade deployment. For this post, I use one primary shard with no replicas. As a best practice, we recommend deploying your domain into three Availability Zones with at least two replicas. This configuration lets Amazon ES distribute replica shards to different Availability Zones than their corresponding primary shards and improves the availability of your domain. For more information about sizing your Amazon ES, see Get started with Amazon Elasticsearch Service: T-shirt-size your domain.
We recommend setting the shard count based on your estimated index size, using 50 GB as a maximum target shard size. You should also define an index template to set the primary and replica shard counts before index creation. For more information about best practices, see Best practices for configuring your Amazon Elasticsearch Service domain.
For high-frequency incoming data, you can rotate indexes either per day or per week depending on the size of data being generated. You can use Index State Management to define custom management policies to automate routine tasks and apply them to indexes and index patterns.
Creating the Kibana user
With Amazon ES, you can configure fine-grained users to control access to your data. Fine-grained access control adds multiple capabilities to give you tighter control over your data. This feature includes the ability to use roles to define granular permissions for indexes, documents, or fields and to extend Kibana with read-only views and secure multi-tenant support. For more information on granular access control, see Fine-Grained Access Control in Amazon Elasticsearch Service.
For this post, you create a fine-grained role for Kibana access and map it to a user.
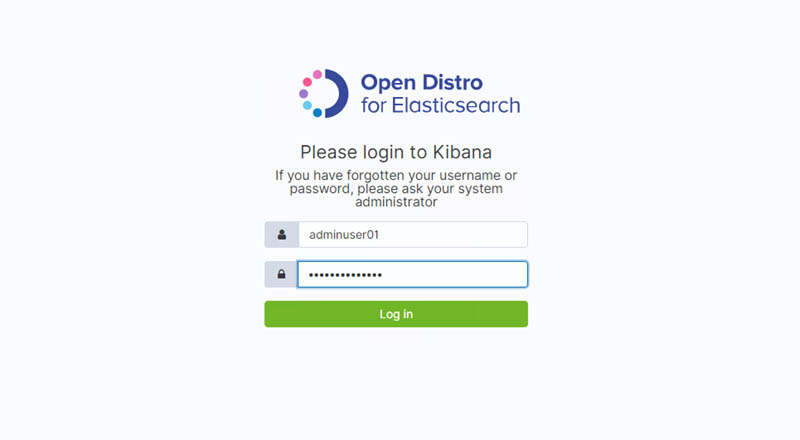
- Navigate to Kibana and enter the primary user credentials:
- User name –
adminuser01 - Password –
StrongP@ssw0rd
- User name –
To access Kibana, you must have access to the VPC. For more information about accessing Kibana, see Controlling Access to Kibana.
- Choose Security, Roles.
- For Role name, enter
kibana_only_role.

- For Cluster-wide permissions, choose
cluster_composite_ops_ro.

- For Index patterns, enter
access-logandkibana. - For Permissions: Action Groups, choose read, delete, index, and manage.

- Choose Save Role Definition.
- Choose Security, Internal User Database, and Create a New User.
- For Open Distro Security Roles, choose Kibana_only_role (created earlier).

- Choose Submit.


The user kibanauser01 now has full access to Kibana and access-logs indexes. You can log in to Kibana with this user and create the visuals and dashboards.
Building dashboards
You can use Kibana to build interactive visuals and analyze the trends and combine the visuals for different use cases in a dashboard. For example, you may want to see the number of requests made to the buckets in the last two days.
- Log in to Kibana using
kibanauser01.

- Create an index pattern and set the time range
- On the Visualize section of your Kibana dashboard, add a new visualization.
- Choose Vertical Bar.


You can select any time range and visual based on your requirements.
- Choose the index pattern and then configure your graph options.
- In the Metrics pane, expand Y-Axis.
- For Aggregation, choose Count.
- For Custom Label, enter
Request Count.

- Expand the X-Axis
- For Aggregation, choose Terms.
- For Field, choose bucket.
- For Order By, choose metric: Request Count.

- Choose Apply changes.
- Choose Add sub-bucket and expand the Split Series
- For Sub Aggregation, choose Date Histogram.
- For Field, choose requestdatetime.
- For Interval, choose Daily.

- Apply the changes by choosing the play icon at the top of the page.


You should see the visual on the right side, similar to the following screenshot.

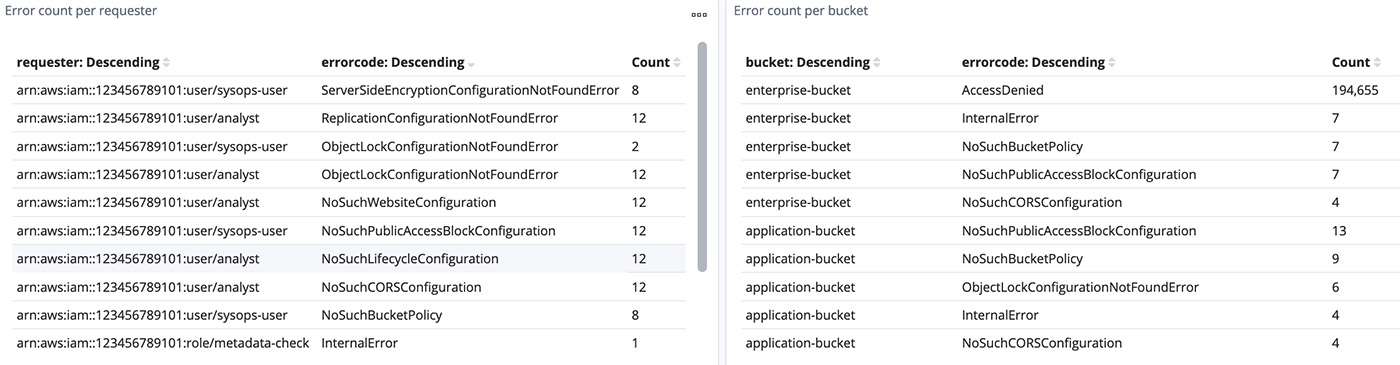
You can combine graphs of different use cases into a dashboard. I have built some example graphs for general use cases like the number of operations per bucket, user action breakdown for buckets, HTTPS status rate, top users, and tabular formatted error details. See the following screenshots.

Cleaning up
Delete all the resources deployed through the CloudFormation template to avoid any unintended costs.
- Disable the access log on source bucket.
- On to the CloudFormation console, identify the stacks appropriately, and delete
Summary
This post detailed a solution to visualize and monitor Amazon S3 access logs using Amazon ES to ensure compliance, perform security audits, and discover risks and patterns at scale with minimal latency. To learn about best practices of Amazon ES, see Amazon Elasticsearch Service Best Practices. To learn how to analyze and create a dashboard of data stored in Amazon ES, see the AWS Security Blog.
About the Authors
 Mahesh Goyal is a Data Architect in Big Data at AWS. He works with customers in their journey to the cloud with a focus on big data and data warehouses. In his spare time, Mahesh likes to listen to music and explore new food places with his family.