Post Syndicated from Mahesh Goyal original https://aws.amazon.com/blogs/big-data/streaming-data-from-amazon-s3-to-amazon-kinesis-data-streams-using-aws-dms/
Stream processing is very useful in use cases where we need to detect a problem quickly and improve the outcome based on data, for example production line monitoring or supply chain optimizations.
This blog post walks you through process of streaming existing data files and ongoing changes from Amazon Simple Storage Service (Amazon S3) to Amazon Kinesis. You achieve this by using AWS Database Migration Service (AWS DMS). AWS DMS enables you to seamlessly migrate data from supported sources to relational databases, data warehouses, streaming platforms, and other data stores in AWS cloud.
Many SaaS, third-party applications already integrate with Amazon S3 and can deliver records to S3 buckets. In certain use cases, you need to further process this data in near-real-time to generate alerts. Use cases like threat detection and application monitoring require generating insights in seconds. Waiting for batch processes often leads to a delay in data analysis and reduces the ability of systems to respond quickly to critical situations. For such use cases, you need a way to convert batch to stream processing by expanding the existing integrations of your applications with Amazon S3.
You can use AWS DMS for such data-processing requirements. AWS DMS lets to expand your existing application into Amazon S3 to produce data in Amazon Kinesis Data Streams for real-time analytics without writing and maintaining new code. AWS DMS supports specifying Amazon S3 as the source and streaming services like Kinesis and Amazon Managed Streaming of Kafka (Amazon MSK) as the target. AWS DMS allows migration of full and change data capture (CDC) files to these services. AWS DMS performs this task out of box without any complex configuration or code development. You can also configure an AWS DMS replication instance to scale up or down depending on the workload.
For this post, we focus on streaming data to Kinesis. We deploy an AWS CloudFormation template to get started in minutes and explore the streaming pipeline.
Architecture overview
Third-party applications such as web, API, and data-integration services produce data and log files in S3 buckets. Data lakes built on AWS process and store data in Amazon S3 at different stages. AWS DMS supports Amazon S3 as the source and Kinesis as the target, so data stored in an S3 bucket is streamed to Kinesis. Several consumers, such as AWS Lambda, Amazon Kinesis Data Firehose, Amazon Kinesis Data Analytics, and the Kinesis Consumer Library (KCL), can consume the data concurrently to perform real-time analytics on the dataset. Each AWS service in this architecture can scale independently as needed.
The following diagram shows the architecture of this solution.

Deploying AWS CloudFormation
To get started, you first deploy the CloudFormation template to create the core components of the architecture. AWS CloudFormation automates the deployment of technology and infrastructure in a safe and repeatable manner across multiple Regions and accounts with the least amount of effort and time. To create these resources, complete the following steps:
- Sign in to the AWS Management Console and choose the
us-west-2Region. - Choose Launch Stack:

- Choose Next.
This automatically launches AWS CloudFormation in your AWS account with a template. It prompts you to sign in as needed. You can view the CloudFormation template on the console.
- For Stack name, enter a stack name.
- On the next screen, choose your VPC and subnet IDs.
- For Does DMS VPC and Cloudwatch role Exists?, enter Y if the managed AWS Identity and Access Management (IAM) roles
dms-vpc-roleanddms-cloudwatch-logs-roleexist in your account. Otherwise, leave at the default N.
If you want to deploy the AWS DMS endpoint in a private subnet, enable the VPC endpoints for Kinesis and Amazon S3 before deploying the template.
- Choose Next.

- Acknowledge resource creation under Capabilities on the final screen and choose Create.

The stack takes 5–10 minutes to complete, during which it performs the following:
- Creates a source S3 bucket and target Kinesis data stream with two shards.
- Creates an AWS DMS replication instance, Amazon S3 source endpoint, and Kinesis target.
- Maps the S3 bucket and data steam to their respective endpoints.
- Configures a replication task with the required parameters.
- Creates an AWS Lambda function with a trigger to consume records from Kinesis. For more information, see Using AWS Lambda with Amazon Kinesis.
The files required for this demo don’t come with the template. Download blog_sample_file.zip and upload it to the source bucket before starting the AWS DMS task.
Using Amazon S3 as the source
When you use Amazon S3 as the source, the data files (full load and CDC) must be in comma-separated value (CSV) format.
In addition to the data files, AWS DMS also requires an external table definition. An external table definition is a JSON document that describes how AWS DMS should interpret the data from Amazon S3.
Amazon S3 file paths for full load and CDC files are required for AWS DMS to run the task. Make sure that files names are sequentially numbered to replicate the data in the correct order. In addition, AWS DMS allows you to specify the column delimiter, row delimiter, and other parameters using extra connection attributes.
AWS DMS can identify the operation to perform for each load record in two ways: from the record’s keyword value INSERT or I.
For more information, see Using Amazon S3 as a source for AWS DMS.
Using Amazon Kinesis as the target
AWS publishes records to a Kinesis data stream as JSON. During conversion, AWS DMS serializes each record from the source Amazon S3 files into an attribute-value pair in JSON format.
AWS DMS publishes each record in the source Amazon S3 file as one JSON data record in a data stream regardless of the action specified in the source file.
Additionally, AWS DMS allows object mapping to migrate data from source files to a data stream. Object mapping determines the structure of data records in the stream.
AWS DMS also supports multi-threaded migration for full load and CDC with task settings. You can promote the performance by setting multiple threads, buffer size, and parallel queue.
For more information, see Using Amazon Kinesis Data Streams as a target for AWS Database Migration Service.
Walkthrough
The AWS CloudFormation deployment takes care of all the infrastructure. Now you need files to complete this use case.
- Download blog_sample_file.zip, which contains full and CDC load files in CSV format.
If your source files aren’t in CSV, convert the file format to CSV. One conversion method is by using AWS Glue. For more information, see Format Options for ETL Inputs and Outputs in AWS Glue.
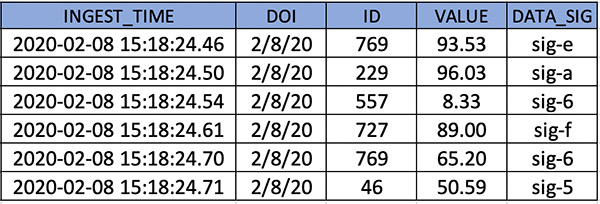
The following screenshot shows the sample records of the full load files that you use for this use case.
CDC files require additional attributes for AWS DMS to identify the action, table, and schema.
- Reformat the files as follows:
- Operation – The change operation to be performed: INSERT or I, UPDATE or U, or DELETE or D.
- Table name – The name of the source table.
- Schema name – The name of the source schema.
- Data – One or more columns that represent the data to be changed.
The following screenshot shows sample records of the CDC file.

External table definition is required in the source endpoint configuration. For this post, the definition is embedded in AWS CloudFormation.
- Enter the following code for the table definition for the full and CDC files:
- Create folder structures under the source S3 bucket created through the CloudFormation template.
- Create folders
schema01/table01/for full load andcdcfile/for CDC data files. - Also, file names should be in incremental, as listed in the following CLI output.
- Create folders
- After the files are copied, on the AWS DMS console, choose Replication.
- Validate the instance status and configuration.

- Choose Endpoints.
- Validate the status and configuration of the Amazon S3 source endpoint and make sure that the connection to the replication instance is successful.

- Similarly, validate the status and configuration of Kinesis target endpoint and make sure that the connection to the replication instance is successful.

- Choose Database migration task.
- Verify that the source and target are mapped correctly.

- After validating all the configurations, restart the AWS DMS task. Because the task has been created and never started, choose Restart/Resume to start full load and CDC.


After data migration starts, you can see it listed under Table statistics. For more information, see How do I use table statistics to monitor an AWS DMS task?

AWS DMS completes the full load first and migrates change data as files are uploaded to the bucket location specified in the cdcPath parameter.
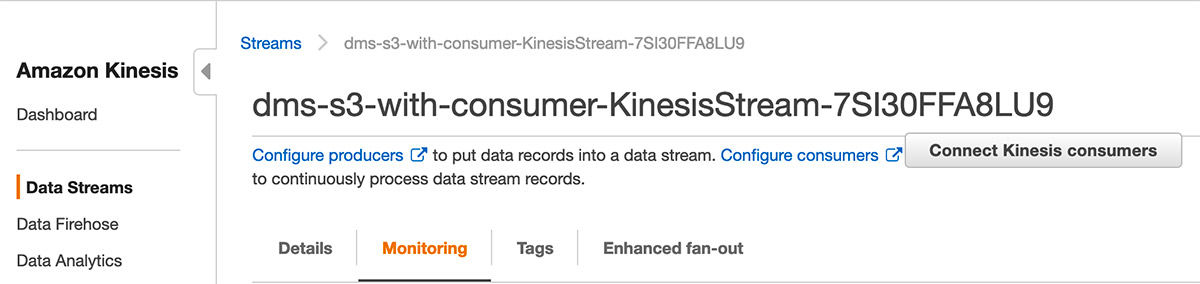
- While the migration is in progress, on the Kinesis console, check the IncomingBytes metrics on the Monitoring tab to confirm the data is streaming to Kinesis Data Streams.
- To confirm that the data streamed is being consumed by the Lambda consumer, use the GetRecords.Bytes metric.
You’re now ready to validate the records in Lambda. Lambda is configured to read from Kinesis through a trigger.

The Lambda consumer for this post is a sample function that consumes the records from the Kinesis data stream, decodes the base64 encoded data, and prints the records to the Amazon CloudWatch log group.
- On the Monitoring tab, open the recent logstream under CloudWatch Log Insights to see the printed records.


For more information about monitoring, see Monitoring functions in the AWS Lambda console.
You can add processing logic to the Lambda function as per your requirements to aggregate or process the records. You can also configure a Lambda destination for further processing. Lambda asynchronous invocations can put an event or message on Amazon Simple Notification Service (Amazon SNS), Amazon Simple Queue Service (Amazon SQS), or Amazon EventBridge. For more information, see Introducing AWS Lambda Destinations.
Best practice considerations
When implementing this solution, consider the following best practices:
- Full load allows to you stream existing data from an S3 bucket to Kinesis. You can use full load to migrate previously stored data before streaming CDC data. The full load data should already exist before the task starts. For new CDC files, the data is streamed to Kinesis on a file delivery event in real-time.
- For loading multiple tables, you can specify the table count and table properties in an external table definition file. The CDC path remains the same and AWS DMS maps the records to tables based on the metadata fields.
- During a heavy workload, the AWS DMS instance can be constrained to resources like CPU, memory, storage, and I/O. For optimal transfer speed, monitor the CloudWatch metrics and scale the replication instance.
- For migrating a large number of tables, you can speed up the transfer by setting the multi-threading parameter to higher values.
- The CloudFormation template creates a data stream with two shards. As the data flow rate to the stream increases, you can scale the number of shards in the stream to adapt to changes. Monitoring Kinesis with CloudWatch metrics for IncomingRecords and WriteProvisionedThroughputExceeded provides insights on how to scale the shards.
- Object mapping in the AWS DMS task defines the partition key. This partition key is used to group data by shard within a stream. The default partition key AWS DMS uses is TableName. You can use attribute mapping to change the partition key to a value of one of the fields in the JSON, or the primary key of the table in the source database. You can also set the partition key to a constant value to stream all the data to a single shard in the stream.
- By default, Lambda invokes the function as soon as records are available in the stream. To avoid invoking the function with a small number of records, configure the event source to buffer records for up to 5 minutes by configuring a batch window. For more information, see Using AWS Lambda with Amazon Kinesis.
- When Kinesis is configured as a trigger for Lambda, you can increase the concurrency to process multiple batches from each shard in parallel. Lambda can process up to 10 batches in each shard simultaneously. For more information about concurrency, see New AWS Lambda scaling controls for Kinesis and DynamoDB event sources.
Cleaning up
After successful testing and validation, you should delete all the resources deployed through the CloudFormation template to avoid any unwanted costs. First empty the S3 bucket and stop the AWS DMS task. Then delete the appropriate stacks on the AWS CloudFormation console.
Summary
This post describes a solution for converting batch processing to near real-time using AWS DMS. This solution greatly simplifies the process of migrating records from Amazon S3 to Kinesis for analysis. Kinesis as an AWS DMS target allows multiple systems to consume data simultaneously. Having a near-steaming pipeline allows you to make sense of all the changes in near-real time, which ultimately expands your organization’s ability for better decision-making. All the resources used in this solution scale seamlessly and allow you to focus on analysis, alerting, reporting, and fraud detection instead of focusing on platform setup and maintenance. This promotes cost-effectiveness while reducing operational burden.
About the Author
 Mahesh Goyal is a Data Architect in Big Data at AWS. He works with customers in their journey to the cloud with a focus on big data and data warehouses. In his spare time, Mahesh likes to listen to music and explore new food places with his family.
 Charishma Makineni is a Technical Account Manager at AWS. She works with enterprise customers to help them build secure and scalable solutions on the AWS cloud. She is focused on Big data and Analytics technologies. Outside of work, Charishma enjoys being outdoors, gardening and experimenting with cooking.
 Suresh Patnam is a Solutions Architect at AWS. He helps customers innovate on the AWS platform by building highly available, scalable, and secure architectures on Big Data and AI/ML. In his spare time, Suresh enjoys playing tennis and spending time with his family.