Post Syndicated from Vikas Omer original https://aws.amazon.com/blogs/big-data/part-2-data-monetization-and-customer-experience-optimization-using-telco-data-assets/
Part 1 of this series explains the importance of building and implementing a customer experience (CX) management and data monetization strategy for telecom service providers (TSPs), and the major challenges driving these initiatives. It also includes an AWS CloudFormation template to set up a demonstration of the solution using AWS services. It covers transforming and enriching multiple datasets, and offers information about data standardization, baselining an analytics data model to marry different datasets like deep packet inspection (DPI) engine embedded Packet Switch (PS) probe, CRM, subscriptions, media, carrier, device, and network configuration management in the data warehouse with AWS Glue, AWS Lambda, and Amazon Redshift.
In this post, I demonstrate how you can enable data analysts, scientists, and advanced business users to query data from Amazon Redshift or Amazon Simple Storage Service (Amazon S3) directly. I also demonstrate configuring a simple drag-and-drop interface for self-service analytics so you can prepare and publish insights based on enriched data stored in Amazon Redshift or Amazon S3 through Amazon QuickSight.
Solution overview
The following diagram illustrates the workflow of the solution.
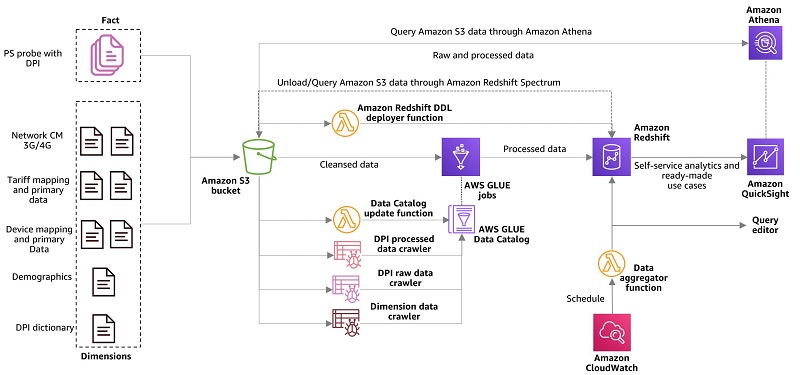
In part 1 of this series, we discuss the overall workflow. In this post, we focus on the following steps:
- Catalog the processed raw, aggregate, and dimension data in the AWS Glue Data Catalog using the DPI processed data crawler.
- Interactively query data directly from Amazon S3 using Amazon Athena and visualize in QuickSight.
- Enable self-service analytics using QuickSight to prepare and publish insights based on data residing in the Amazon Redshift cluster.
Querying data using Amazon Redshift
After creating your Amazon Redshift cluster, you can immediately run queries by using the query editor on the Amazon Redshift console. Complete the following steps:
- On the Amazon Redshift console, in the navigation pane, choose Clusters.
A cluster with the identifier <redshift database name>-<cloudformation stack> should be present. For this example, the cluster is cemdm-telco.

- Choose Editor.
- Enter the required credentials to connect to the Amazon Redshift query editor. (Database name, Database user, and Database password are the ones you entered while creating the CloudFormation stack.)

- Choose Connect to database.
Upon successful authentication, you’re directed to the query editor.
- Run a few queries to check if data is in the tables.
In the following code, <table-name> is the Amazon Redshift table name:
select count(1) from cemdm.<table-name>;
The following query extracts the number of unique subscriber count by age group with Apple devices browsing retail domain websites or apps in or around shopping malls. You can also extract the list of subscribers and micro-segment them by consumption (total data volume) or by adding KPIs like recency and frequency.
The following screenshot shows the output.

Unloading processed and enriched data from Amazon Redshift to Amazon S3
Amazon Redshift also includes Amazon Redshift Spectrum, which allows you to directly run SQL queries against exabytes of unstructured data in Amazon S3 data lakes. No loading or transformation is required, and you can use open data formats, including Avro, CSV, Ion, JSON, ORC, and Parquet. Amazon Redshift Spectrum automatically scales query compute capacity based on the data being retrieved, so queries against Amazon S3 run quickly, regardless of dataset size.
Amazon Redshift Spectrum gives you the freedom to store your data where you want, in the format you want, and have it available for processing when you need it. This is particularly helpful if you need to offload cold or historical data on Amazon Redshift to Amazon S3 in open data format. You can still access this data through Amazon Redshift via Amazon Redshift Spectrum plus any other application.
TSP data assets also include a lot of unstructured event data. This data is transient, and only valuable for a short amount of time. Therefore, you can leave it on Amazon S3 and access it from Amazon Redshift directly through Amazon Redshift Spectrum. You can use a lake house architecture approach, where hot, mostly static, and corporate data is in the warehouse, and the events data is in the data lake.
Alternatively, you can analyze data on Amazon S3 using Athena.
- Use the queries in the following table (in the Unload Statement column) in the Amazon Redshift query editor to unload data from Amazon Redshift to Amazon S3. For instructions, see Unloading data to Amazon S3. Provide the following information:
- <aws-stack-name> – The name of the CloudFormation stack
- <aws-region> – The Region in which you deployed the stack (for example, us-east-1)
- <s3-bucket-name> – The bucket that you created while deploying the stack
- <aws-account-id> – The AWS account ID in which you deployed the stack
- <table-name> – The name of the Amazon Redshift table
| Amazon Redshift Table | Unload Statement |
|
|
|
f_daily_dpi |
|
|
|
Alternatively, you can copy the Amazon Redshift AWS Identity and Access Management (IAM) role ARN to unload data to Amazon S3 from the console under the cluster’s properties.
- Verify that the data has been unloaded to Amazon S3 under
<s3-bucket-name>/dpi/processed/. - On the AWS Glue console, in the navigation pane, choose Crawlers.
- Select DPIProcessedDataCrawler.
- Choose Run crawler.

- Wait for the crawler to show the status Stopping.
The tables added against the DPIProcessedDataCrawler crawlers should show 11.
- Under Databases, choose Tables.
- Verify the following 11 tables are created under the cemdm database:
processed_f_raw_dpiprocessed_f_hourly_dpiprocessed_f_daily_dpiprocessed_d_customer_demographicsprocessed_d_deviceprocessed_d_dpi_dictionaryprocessed_d_locationprocessed_d_operator_plmnprocessed_d_tacprocessed_d_tariff_planprocessed_d_tariff_plan_desc

Visualizing data using QuickSight
QuickSight is a business analytics service you can use to build visualizations, perform one-time analysis, and get business insights from your data. For more information, see What Is Amazon QuickSight?
To connect QuickSight to Amazon Redshift as your data source, complete the following steps:
These steps involve creating a new private subnet that the CloudFormation stack already created. Use the private subnet that isn’t used by Amazon Redshift cluster for your QuickSight connection.
QuickSight provides out-of-the-box integration with Amazon Redshift, making it simple to query and visualize your Redshift data. For more information, see Creating a Dataset from an Autodiscovered Amazon Redshift Cluster or Amazon RDS Instance.

- For Schema, choose cdmdm.
- For Tables, select f_daily_dpi.
- Choose Edit/Preview data.

- Add data and prepare the following table relationships in the Data Prep Use the information provided to create the relationships between different tables:
| Table A Name | Table A Attribute | Join Type | Table B Name | Table B Attribute |
f_daily_dpi |
customer_id |
LEFT |
d_tariff_plan |
customer_id |
f_daily_dpi |
tac_code |
INNER |
d_tac |
tac_sid |
f_daily_dpi |
sgsn_plmn_sid |
INNER |
d_operator_plmn |
plmn_sid |
f_daily_dpi |
location_id |
LEFT |
d_location |
location_id |
f_daily_dpi |
protocol_id |
INNER |
d_dpi_dictionary |
app_id |
f_daily_dpi |
customer_id |
LEFT |
d_customer_demographics |
customer_id |
d_tariff_plan |
tariff_plan_id |
INNER |
d_tariff_plan_desc |
tariff_plan_id |
d_tac |
device_sid |
INNER |
d_device |
device_sid |
You can join d_operator_plmn with sgsn_plmn_sid and home_plmn_sid, but because the sample data only contains home subscriber data, a second join of f_raw_dpi data with d_operator_plmn on home_plmn_sid and plmn_sid is not present in the given relationship of tables.
The following screenshot shows the table relationships.

- Name your analysis CEMDM.
- Choose Save & visualize.
The following screenshots demonstrate a few QuickSight analyses created from the dataset we created. For more information about creating analyses in QuickSight, see Working with Analyses. You can divide all analyses across all the available attributes. We use the use case from part 1 of this series.
The following screenshot shows visualizations of user demographics on the Demographics tab.

The following screenshot shows visualizations of user interest on the Interest Analysis tab.

The following screenshot shows visualizations of user locations on the Location tab.

The following screenshot shows visualizations of device information on the Device tab.

The following screenshot shows visualizations of subscription information on the Subscriptions tab.

The following screenshot shows visualizations of roaming users on the Roaming tab.

The following screenshot shows visualizations on the Sub Details tab. You can drill down to subscriber-level details from any dashboard across any dimension or apply global-level filters to narrow down the desired segment.

You can also build these reports using Athena as a data connector. QuickSight provides out-of-the-box integration with Athena, which lets you run SQL queries on top of the metadata in your AWS Glue Data Catalog. For more information, see Creating a Dataset Using Amazon Athena Data.
You can also use Amazon Redshift metadata as a business glossary and visualize it using QuickSight with the following custom SQL:
The following screenshot shows a sample visualization which you can build on QuickSight.

For more information about running custom Amazon Redshift SQL using Amazon QuickSight, see Using the Query Editor.
QuickSight allows creating template from existing analysis. You can use the resulting template to create a dashboard. For more information, see Evolve your analytics with Amazon QuickSight’s new APIs and theming capabilities. You can also embed QuickSight dashboards into your own apps, websites, and wikis without the need to provision and manage users (readers) in QuickSight. For more information, see New in Amazon QuickSight – session capacity pricing for large scale deployments, embedding in public websites, and developer portal for embedded analytics.”
Cleaning up
To avoid incurring future charges, delete the resources you created. Manually delete anything created outside of the CloudFormation stack and then the stack itself.
Conclusion
In this post, I demonstrated how data analysts, data scientists, and advanced business users can easily query multiple data sources and generate actionable insights including user interest profiles, segments, and micro-segments. Downstream systems like campaign management systems, customer care portals, and customer-facing applications; internal teams like retention, marketing, CX, and network; and workloads like machine learning can greatly benefit from the insights generated from this solution. You can automate these insights and integrate them with northbound systems, and trigger them based on a schedule or an event.
I also demonstrated how business users are empowered with self-service analytics to help them perform data exploration and publish ready-made insights in the form of dashboards. You can also create stories to drive data-heavy conversations based on enriched data stored in Amazon Redshift or Amazon S3.
Perceiving customer behavior across multiple touchpoints is the key for any business to thrive. And the essence of this solution is to capitalize on data and drive CX and monetization initiatives holistically across your organization. This framework allows you to accelerate your journey towards improving CX and generating new revenue streams by using existing data assets.
You can progressively augment this solution by adding additional data sources to evolve into a customer data platform hosting 360° profiles of individual subscribers correlated from multiple data sources. This solution can further support new and existing marketing, partnerships, loyalty, retention, network planning, and network optimization initiatives to drive revenue growth and improve profitability while keeping subscribers happy and loyal. It also helps you define an organization-wide standard for data visualization, self-service analytics, metadata discovery, and data marketplace.
For more ways to expand this solution, consider the following services:
- AWS Data Exchange makes it easy to find, subscribe to, and use third-party data in the cloud. You can merge it with in-house data assets to span existing insights across multiple domains.
- Amazon Pinpoint is a flexible and scalable outbound and inbound marketing communications service. You can connect with customers over channels like email, SMS, push, or voice. You can segment and micro-segment your campaign audience for the right customer and personalize your messages with the right content.
As always, AWS welcomes feedback. This is a wide-open space to explore, so reach out to us if you want to dive deep into understanding how you can build this solution and more on AWS. Please submit comments or questions in the comments section.
About the Author
 Vikas Omer is an analytics specialist solutions architect at Amazon Web Services. Vikas has a strong background in analytics, customer experience management (CEM) and data monetization, with over 11 years of experience in the telecommunications industry globally. With six AWS Certifications, including Analytics Specialty, he is a trusted analytics advocate to AWS customers and partners. He loves traveling, meeting customers, and helping them become successful in what they do.