Post Syndicated from Dennis Ananiev original https://blog.zabbix.com/zabbix-5-0-my-happiness-and-disenchantment/14107/
Zabbix is an open-source solution, and all features are available out of the box for free. You don’t have to pay for the pro, or business, or community versions. You can download Zabbix source files or packages from the official site and use them in your enterprise or your home lab, test and apply or even suggest your changes. Zabbix offers many new features in every release, and it’s an excellent approach to interact with the community. This post will share my experience with Zabbix and my opinion of improvements made in Zabbix 5.2.
Contents
Pros
Global view Dashboard
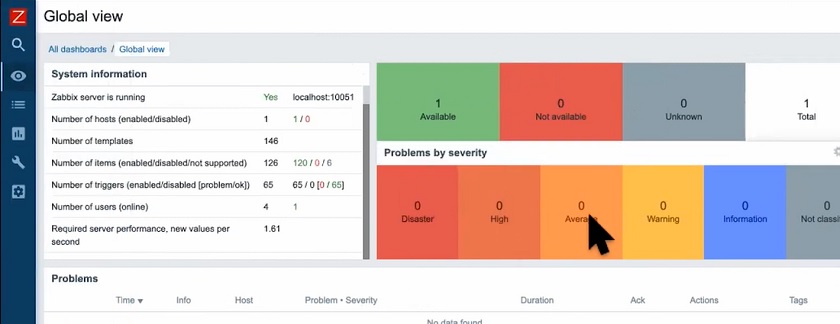
Improvements start from the central Zabbix 5.2 dashboard — it’s totally different from the earlier versions. Now it looks more clear and user-friendly.
 Global view Dashboard
Now, we have a hiding vertical menu. Since this is a Global view dashboard, we can see hosts by availability and problems by the severity level (we didn’t have this opportunity in earlier versions), as well as system information.
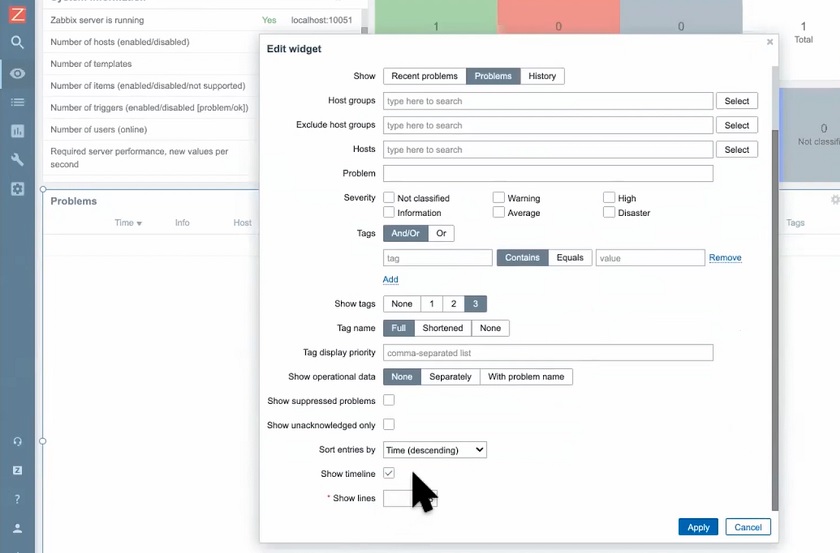
From the Global view dashboard, you can configure the widgets. For instance, you can choose how many lines you can see in the problems panel.
 Configuring widgets in the Dashboard
In earlier versions, you could see only 20 problems in your Dashboard, and you could change this parameter only in the Zabbix source code if you had some PHP knowledge. Now you can choose how many problems you display in the Show line field. This is really convenient as you might have a really enormous infrastructure and almost 200 problems per day filling in the Dashboard. In earlier versions, if the Zabbix Server was down, you could not see the previous problems without opening the menu “Last values”. Now you can choose the number of problems to display. In addition, you can choose to display the problems of a certain severity level only or to display only tags. For duty admins, it’s pretty good to see operational data with problems and show unacknowledged only.
This is convenient to Zabbix engineers or admins as sometimes admins monitor only certain parts of the infrastructure: some servers, databases, or middleware levels. In this case, you can choose to display Host groups or Tags for different layers. Then all you need is to click Apply.
Host configuration
There are many other configuration options that make the life of an engineer more comfortable. For instance, in Configuration > Hosts, new features are available.
 New Hosts configuration
- Here, as opposed to the earlier Zabbix versions, you can filter hosts by a specific proxy or specific tags. This made it hard to understand, which proxy was monitoring a specific host, especially if you were monitoring, for instance, one or two thousand hosts. The new feature saves you a lot of time as you don’t have to open other pages and try to find the necessary information.
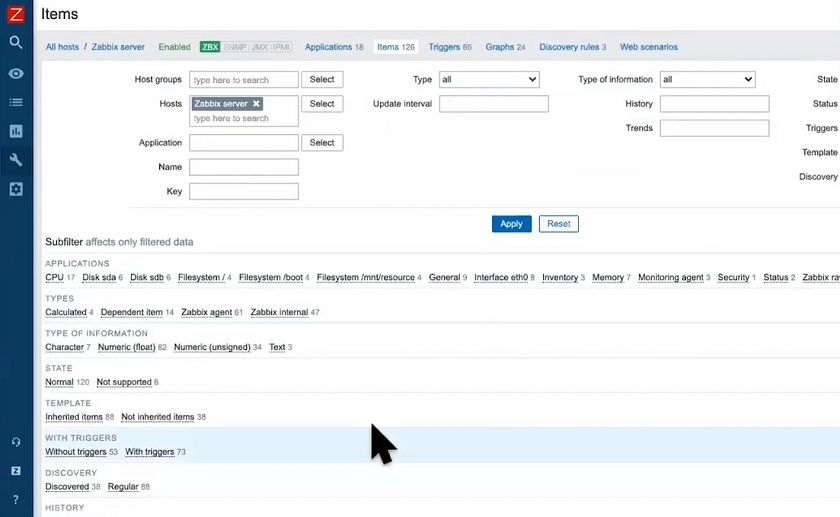
- Another new feature in the Hosts dashboard is the improved Items configuration.
Improved Items configuration
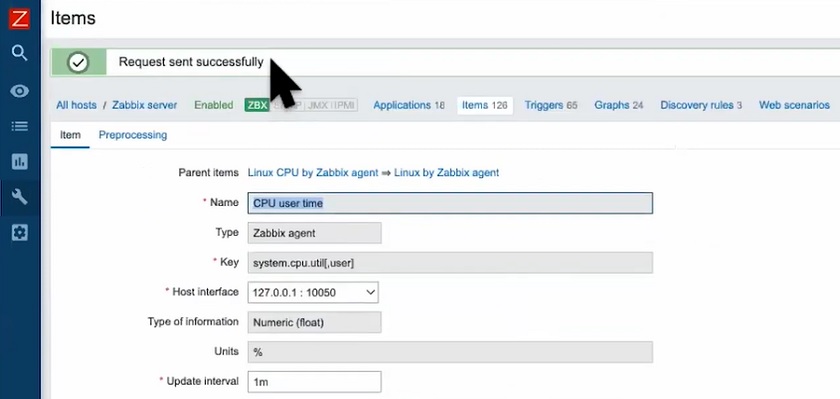
Here, if you click any item, for instance, the one collecting CPU data, you can now use the new Execute now and Test buttons to test values without waiting for an update interval.
 New Execute now and Test buttons
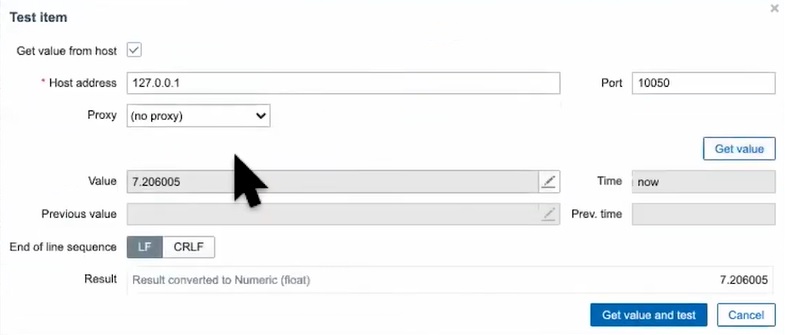
So, if you click Test > Get value and test, you can get the value from a remote host immediately.
 Using Get value and test button
Clicking the Test button, you can also check the correct Type for your data collection. Execute now allows you to pull a request to the remote host and return data back without waiting for a response, and immediately find the required information in the Latest data without waiting for an update interval.
 Requesting data without waiting for update interval
You normally don’t need to collect data such as hostname or OS name very often. Such data is collected once per day or once per hour. However, you might not want to stay online waiting for collection. So, you can click Execute now and collect the data immediately.
NOTE. Execute now and Test buttons are available only starting from Zabbix 5.x.
Discovery rules
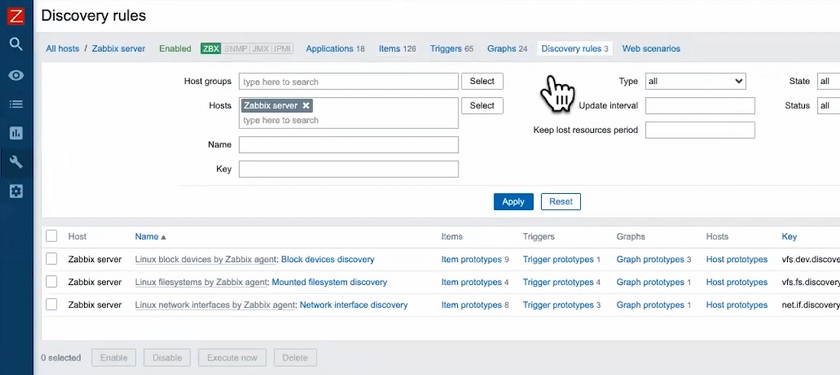
- Another Zabbix configuration tool — Discovery rules were also improved. Previously, if we needed to discover some data, for instance, from a Linux server, such as Mounted filesystem discovery or Network interface discovery, we had to stay online and wait for the data to be collected. Now with Execute now and Test buttons, you don’t have to wait for the stated update interval and get values immediately.
 New Discovery rules options
So, if you click Get value and test, you immediately get all data Types and all file system names for all partitions on the server, as well s JSON array. Here, you can check what data you do and don’t need and then exclude certain data using regular expressions. It’s a really big achievement to add the ability Test and Execute Now button everywhere because it makes system more complex and dynamic.
- In earlier Zabbix versions, in Item prototypes, we couldn’t change anything in bulk. You had to open each of the items, for instance, Free nodes or Space utilization, and change what you need for each of them. Now, you can check All items box and use Mass update button.
 Mass update for Items prototype
For instance, we can change all update intervals for all items at once.
 Changing all update intervals at once
Previously, we could mass update only items and some triggers, while now we can use Mass update for item prototypes as well. Item prototypes are used very often in our everyday operations, for instance, to discover data by SNMP as SNMP is collecting data for network or storage devices where item prototypes are really important. For instance, NetApp storage may have about 1,500 items, and it is really difficult to change update interval history for such an enormous number of items. Now, you just click Mass update, change parameters for item prototypes, and apply changes to all items at once.
Maintenance
Maintenance has been a headache for many Zabbix engineers and administrators for ages. In Zabbix 4.2, we had three Maintenance menus: Maintenance, Periods, and Hosts and groups.

Maintenance settings in earlier Zabbix versions
Windows or Linux administrators using Zabbix only for monitoring their stuff could just select the period using Active since and Active till and didn’t know what to do if data collection and maintenance didn’t work correctly. For instance, if we started replacing RAM in the data center at 8 a.m. and spent two hours, we could set Active till to 10 a.m. However, surprisingly, it didn’t work.
In Zabbix 5.x, the team used a different approach — a separate menu for all items, which previously was displayed in three separate tabs.

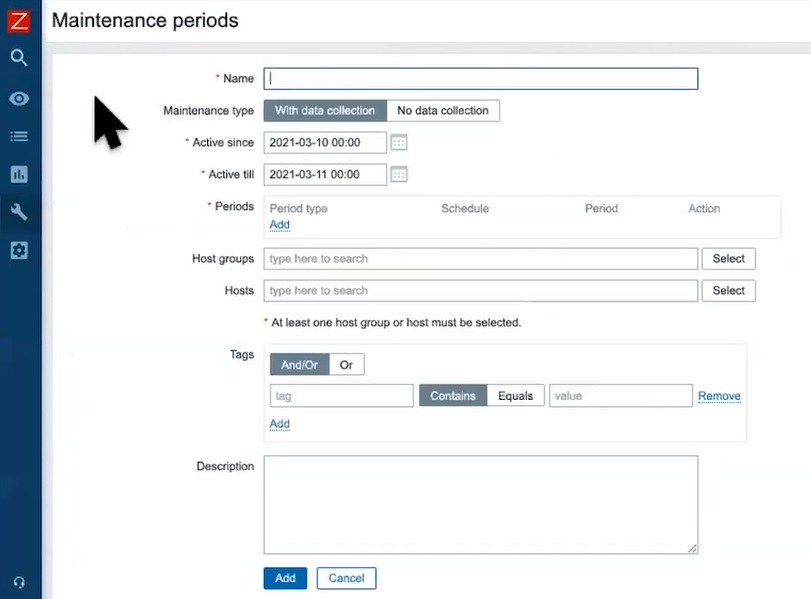
Now you can set up all parameters in one window.
Improved Maintenance settings
NOTE. In most cases, Active since and Active till don’t work correctly for setting up downtime. To set up the downtime, the Period field should be used to choose Period type, date, and the number of days or hours needed to fix RAM in our example.
 Maintenance period settings
 Setting downtime period due to maintenance
This change is not intuitive; however, you should put attention to your Maintenance period settings when receiving calls from your admins and engineers about maintenance alerts. In addition, Maintenance period settings are more detailed, so you just need to practice selecting the required parameters. However, this is the question to the Zabbix team to make these parameter settings more user-friendly.
Cons
Unfortunately, some problems have been inherited from the earlier Zabbix versions.
- For instance, in Administration > Users you still can’t change any parameters or clone users with the same characteristics, you have to create each user separately. If you have a thousand users, this will give you a headache to create all of them manually if you don’t know much about Zabbix API or Ansible.

Limited Users setting options
- In addition, Zabbix doesn’t have any mechanisms for importing LDAP/SAML users and LDAP?SAML groups. It is still hard to create and synchronize this account with, for instance, Active Directory or other service directories. Active Directory administrator might change the users’ surname and move them to some other department, and Zabbix administrator won’t know about this due to this synchronization gap.
- There are obvious drawbacks to the Zabbix menu. For instance, Hosts are still available under Monitoring, Inventory, and Configuration sections, which might be messy for the newbies as it is difficult to decide, which menu should be used. So, merging these menus will be a step forward to usability.
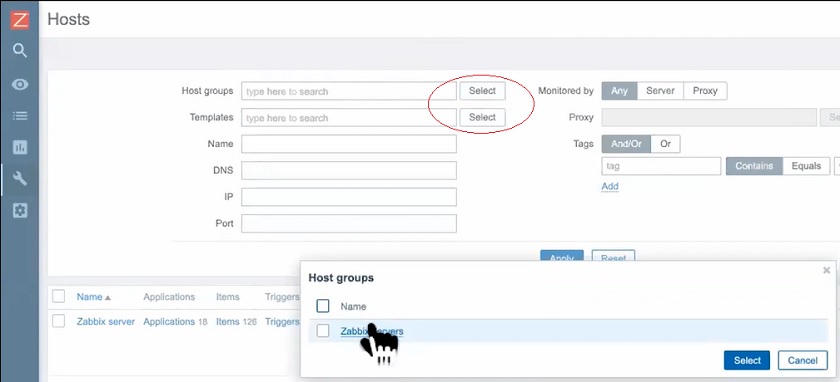
- Lastly, in the Configuration > Hosts menu there was a drop-down list for host groups and templates, but in the newest Zabbix only the Select button is left. Now, without the drop-down list, it is tricky for newbies to choose host groups and templates.
 Selecting host groups and templates