Post Syndicated from Wolfgang Alper original https://blog.zabbix.com/zabbix-meets-television-clever-use-of-zabbix-features-by-wolfgang-alper-zabbix-summit-online-2021/19181/
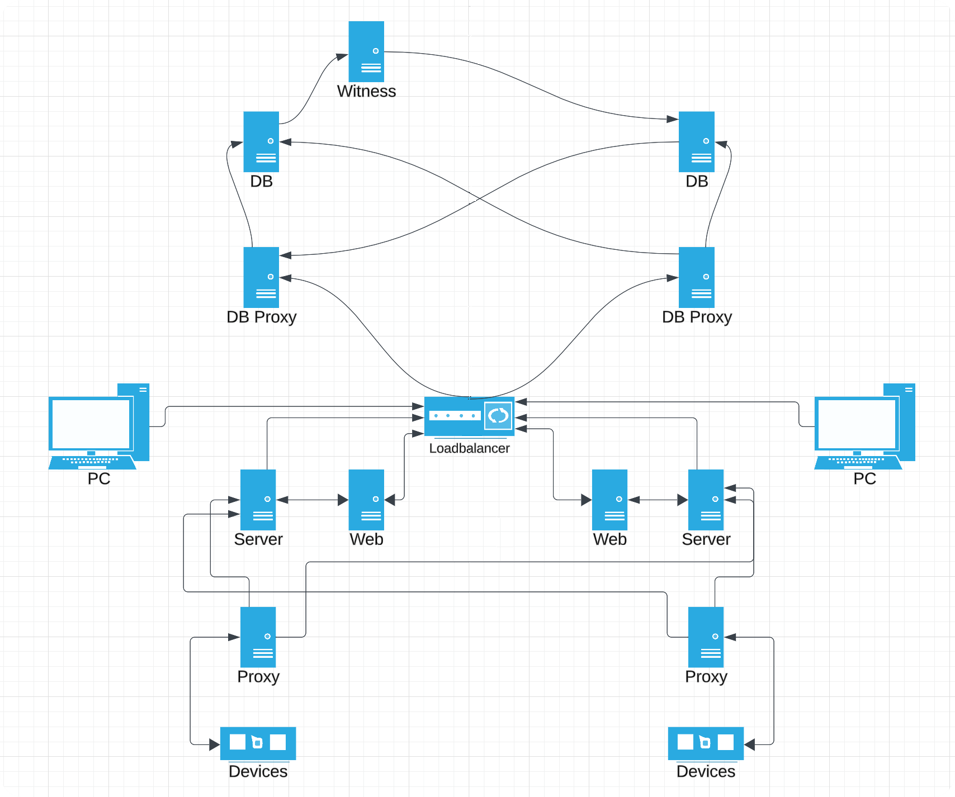
TV broadcasting infrastructures have seen many great paradigm shifts over the years. From TV to live streaming – the underlying architecture consists of many moving parts supplied by different vendors and solutions. Any potential problems can cause critical downtimes, which are simply not acceptable. Let’s look at how Zabbix fits right into such a dynamic and ever-changing environment.
The full recording of the speech is available on the official Zabbix Youtube channel.
In this post, I will talk about how Zabbix is used in ZDF – Zweites Deutsche Fernsehen (Second German Television). I will specifically focus on the most unique and interesting use cases, and I hope that you will be able to use this knowledge in your next project.
ZDF – Some history
Before we move on with our unique use cases, I would like to introduce you to the history of ZDF. This will help you understand the scope and the potential complexity and scale of the underlying systems and company policies.
- In 1961, the federal states established a central non-profit television broadcaster – Zweites Deutsches Fernsehen
- In 1963 on April 1, ZDF officially went on air and had reached 61 percent of television viewers
- On the Internet, a selection of programs is offered via live stream or video-on-demand through the ZDFmediathek, which has been in existence since 2001
- Since February 2013, ZDF has been broadcasting its programs around the clock as an internet live stream
- As of today, ZDF is one of the largest public broadcasters in Europe with permanent bureaus worldwide and is also present on various platforms like Youtube, Facebook, etc.
Here we can see that over the years, ZDF has made some major leaps – from a television broadcaster with the majority percentage of viewers to offering on-demand video service and moving to 24/7 internet live streams. ZDF has also scaled up its presence along with multiple different digital platforms as well as its physical presence all over the globe.
Integrating Zabbix with an external infrastructure monitoring system
In our first use case, we will cover integrating Zabbix with an external infrastructure monitoring system. As opposed to monitoring IT metrics like hard drive space, memory usage, or CPU loads – this external system is responsible for monitoring devices like power generators, transmission stations, and other similar components. The idea was to pass the states of these components to Zabbix. This way, Zabbix would serve as a central “Umbrella” monitoring system.
In addition, the components that are monitored by the external system have states and severities, but the severities are not static and can vary depending on the monitored component. What this means is that each component could generate problems of varying severities. We had to figure out a way to assign the correct severities to each of the external components. Our approach was split into multiple steps:
- Use Zabbix built-in HTTP check to get LLD discovery data
- The external monitoring system provides an API, which we can use to obtain the necessary LLD information by using the HTTP checks
- Zabbix-sender was used for testing since the HTTP items support receiving data from it
- Use Zabbix built-in HTTP check as a collector to obtain the component status metrics
- Define item prototypes as dependant items to extract data from collector item
- Create “smart “trigger prototypes to respect severity information from the LLD data

The JSON below is an example of the LLD data that we are receiving from the external monitoring systems. In addition to component names, descriptions, and categories, we are also providing the severity information. The severities that have a value of -1 are not used, while other severities are cross-checked with the status value retrieved from the returned metrics:
{
"{#NAME}": "generator-secondary",
"{#DISPLAYNAME}": "Secondary power generator",
"{#DESCRIPTION}": "Secondary emergency power generator",
"{#CATEGORY}": "Powersupply",
"{#PRIORITY.INFORMATION}": -1,
"{#PRIORITY.WARNING}": -1,
"{#PRIORITY.AVERAGE}": -1,
"{#PRIORITY.HIGH}": 1,
"{#PRIORITY.DISASTER}": 2
}
Below we can see the returned metrics – the component name and its current status. For example, status = 1 value references the {#PRIORITY.HIGH} from the LLD JSON data.
"generator-primary": {
"status": 0,
"message": "Generator is healthy."
},
"generator-secondary": {
"status": 1,
"message": "Generator is not working properly."
},
We can see that the first generator returns status = 0, which means that the generator is healthy and there are no problems, while the secondary generator is currently not working properly – status = 1 and should generate a problem with severity High.
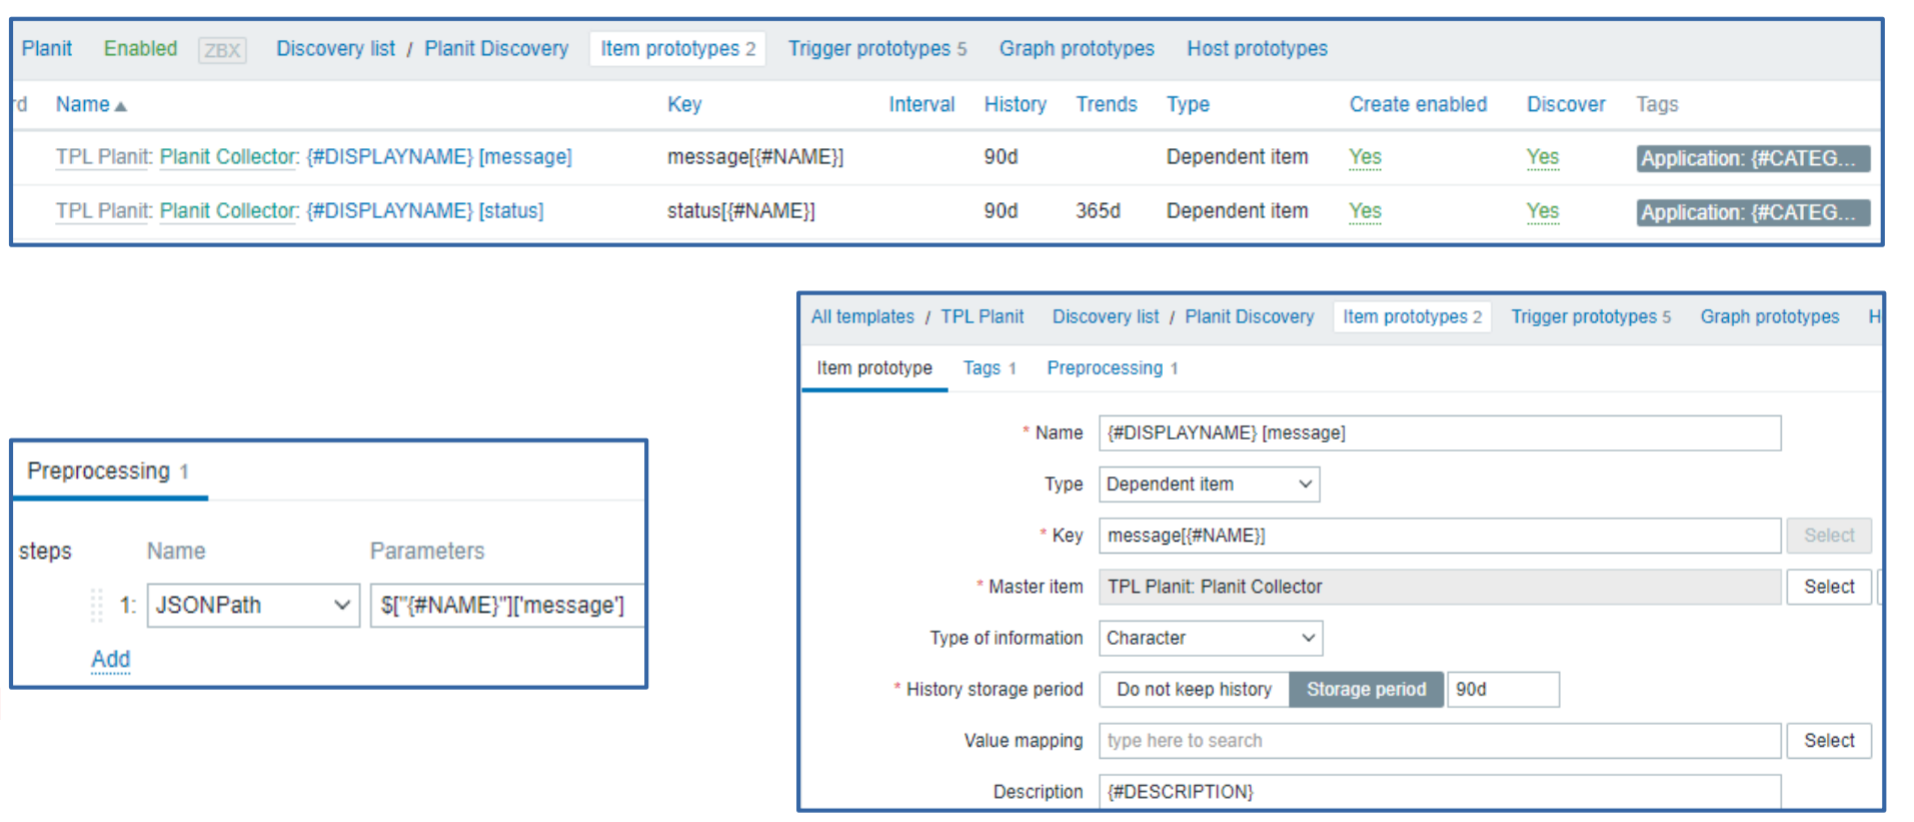
Below we can see how the item prototypes are created for each of the components – one item prototype collects the message information, while the other collects the current status of the component. We use JSONPath preprocessing to obtain these values from our master item.
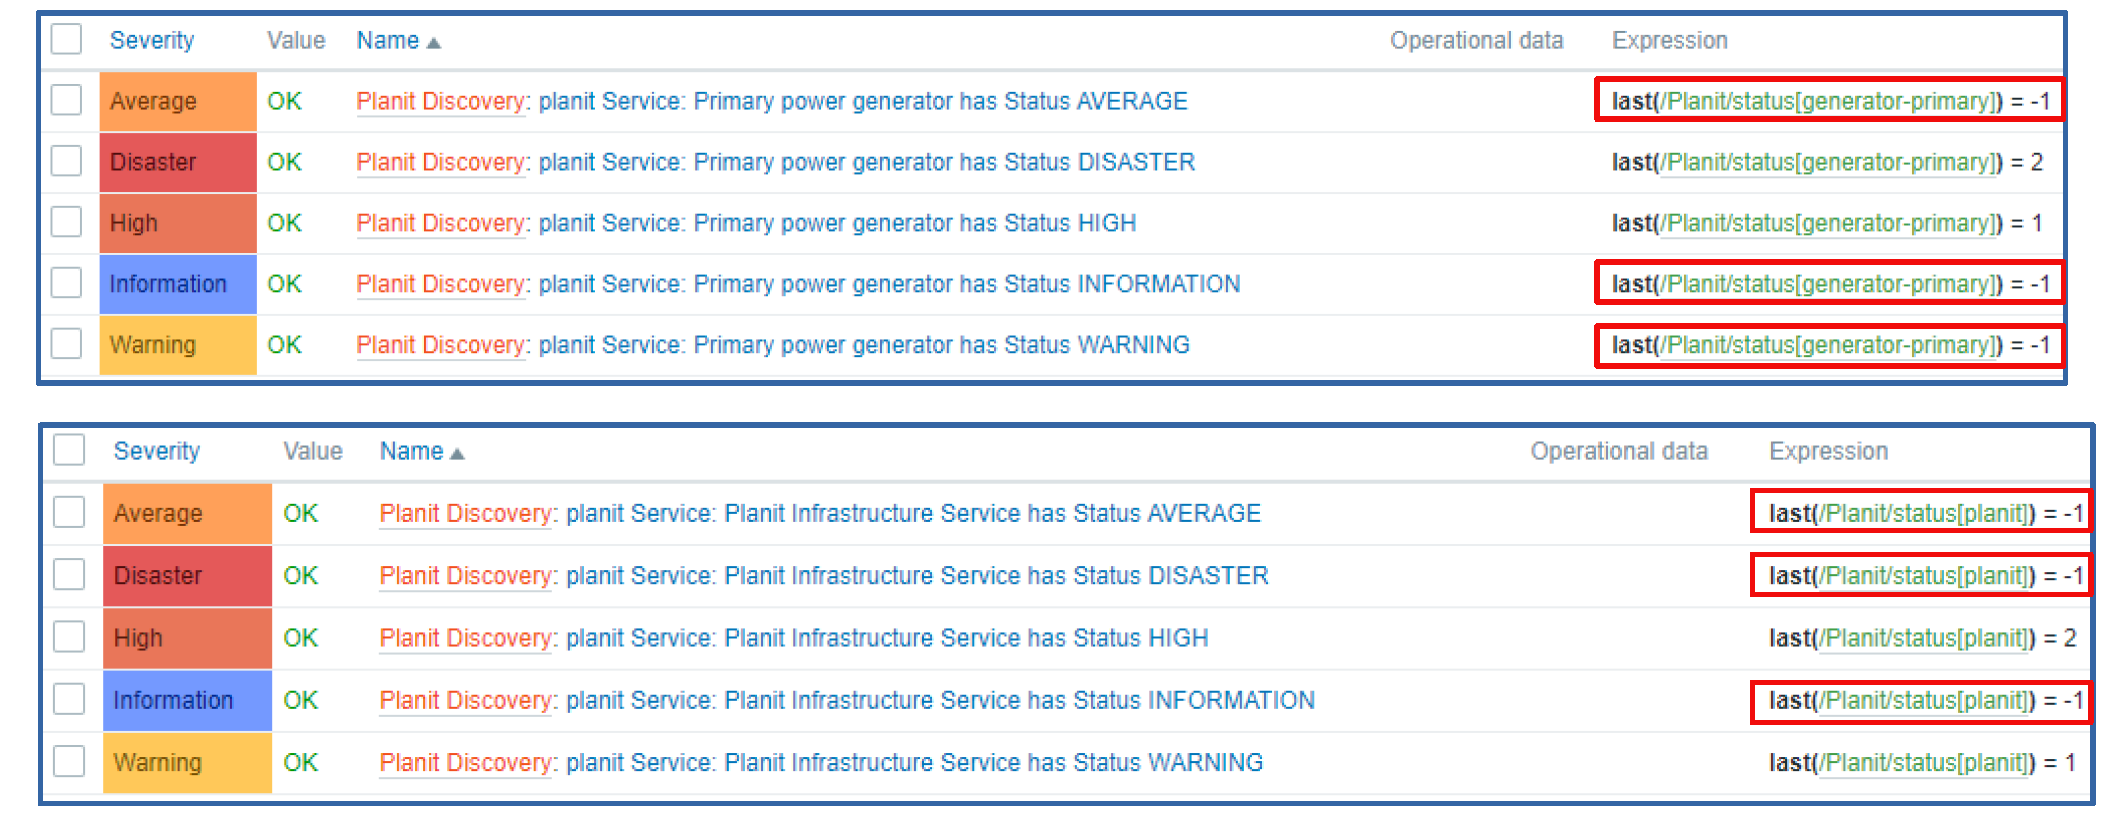
As for the trigger prototypes – we have defined a trigger prototype for each of the trigger severities. The trigger prototypes will then create triggers depending on the information contained in the LLD macros for a given component.
As you can see, the trigger expressions are also quite simple – each trigger simply checks if the last received component status matches the specific trigger threshold status value.
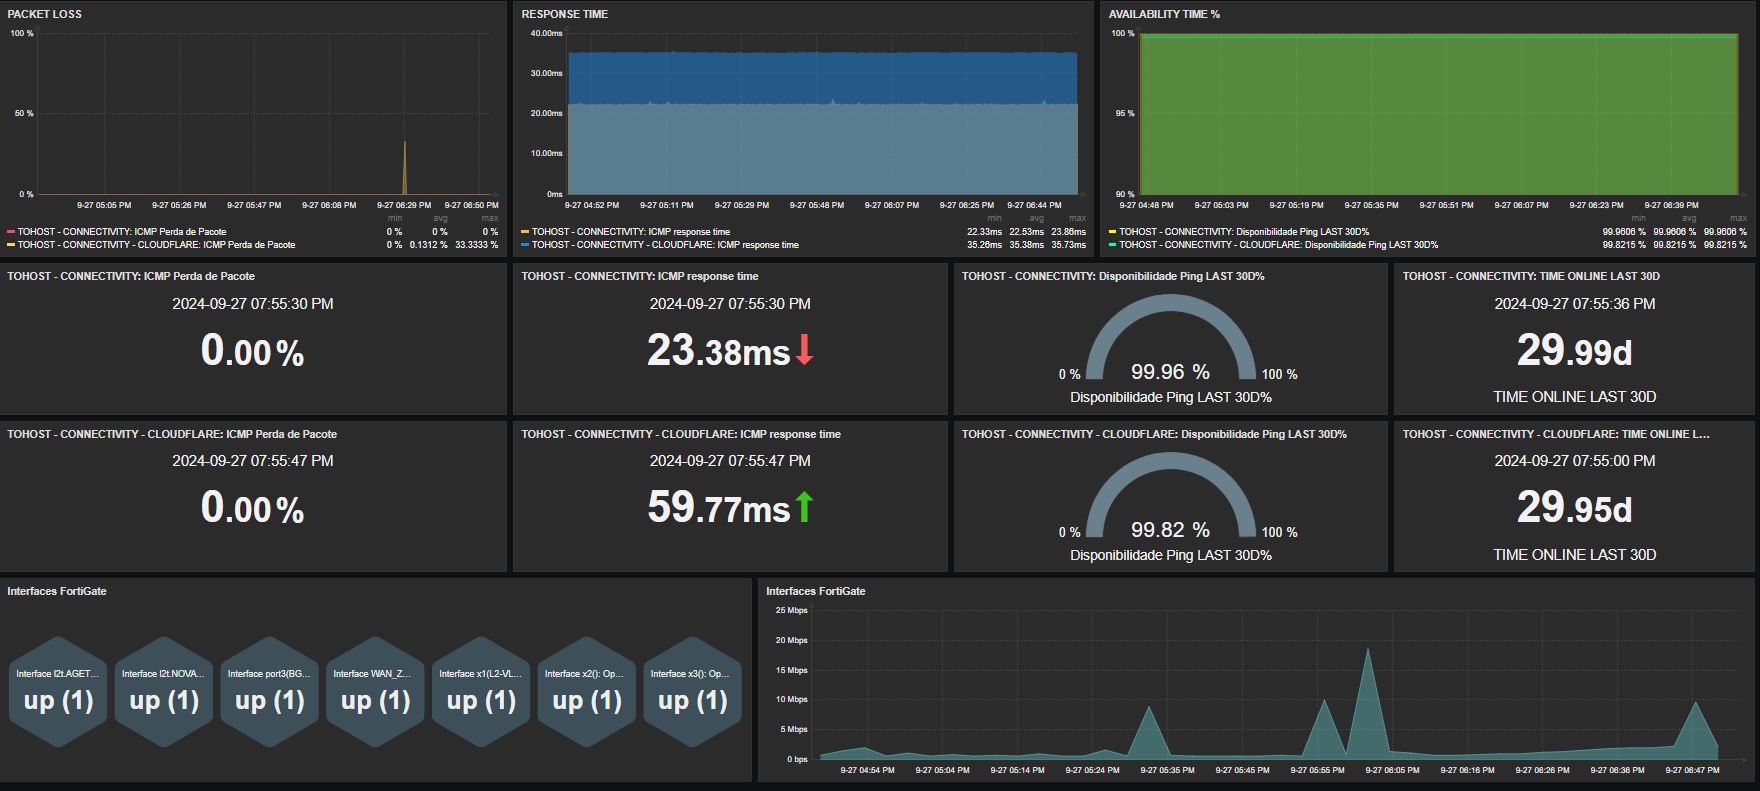
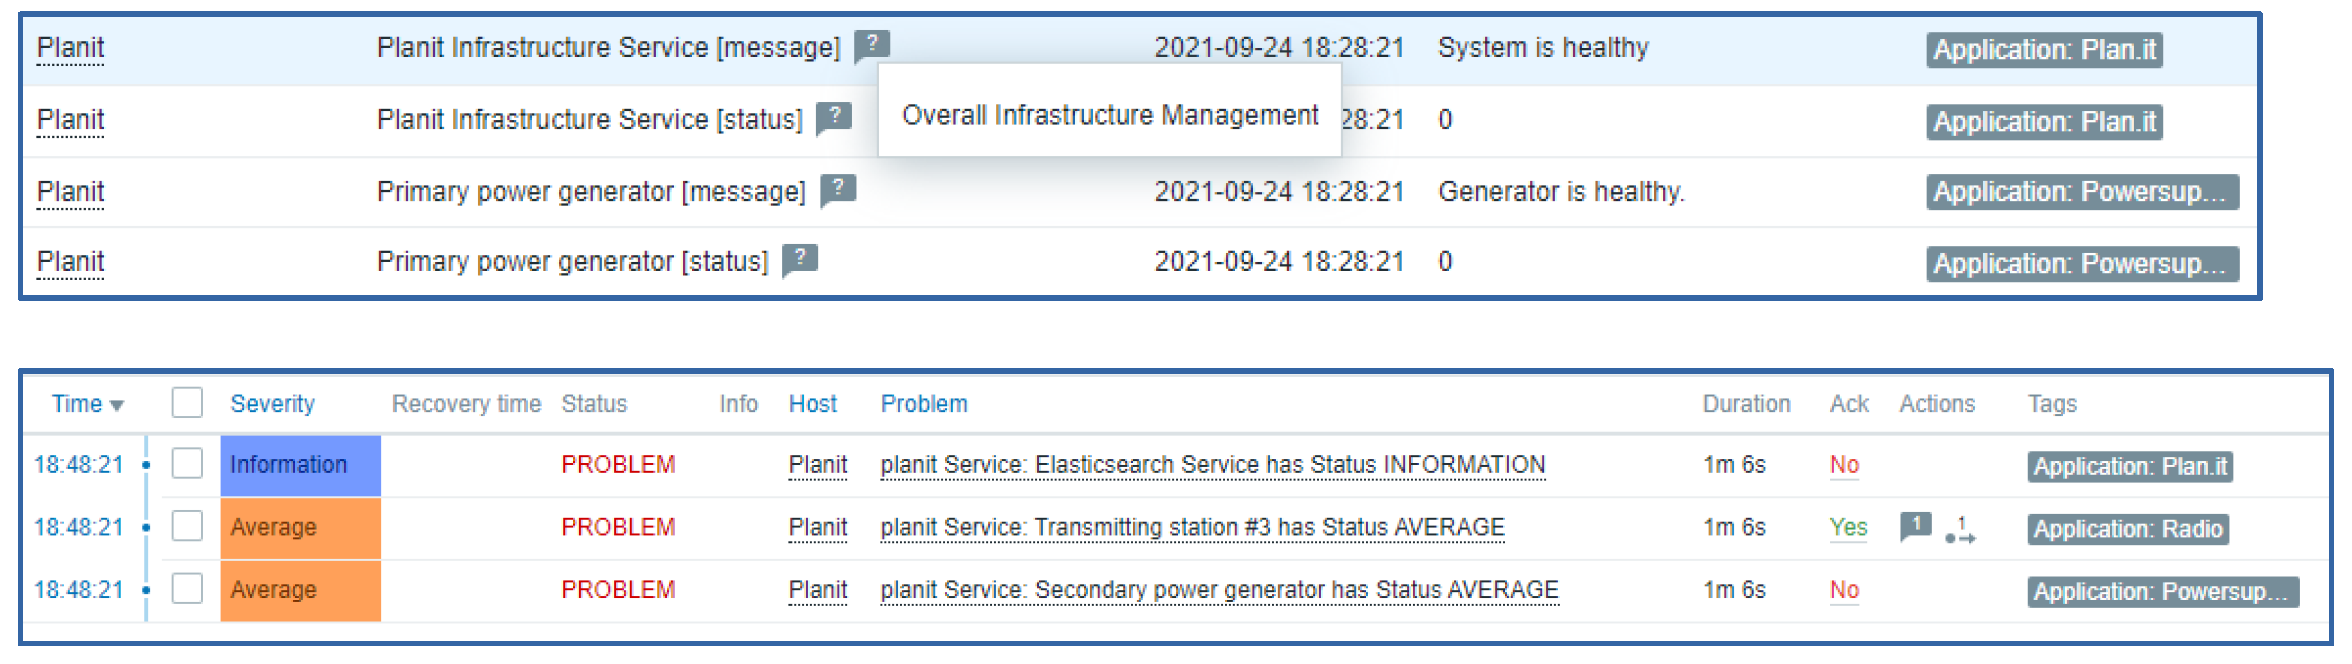
The resulting metrics provide us both the status value and the component status message. As we can see, the triggers are also generating problems with dynamic severities.
Improving the solution with LLD overrides
The solution works – but we can do better! You might have already guessed the underlying issue with this approach: our LLD rule creates triggers for every severity, even if it isn’t used. The threshold value for these unused triggers will use value -1, which we will never receive, so the unused triggers will always stay in the OK state. Effectively – we have created 5 trigger definitions, while in our example, we require only 2 triggers.
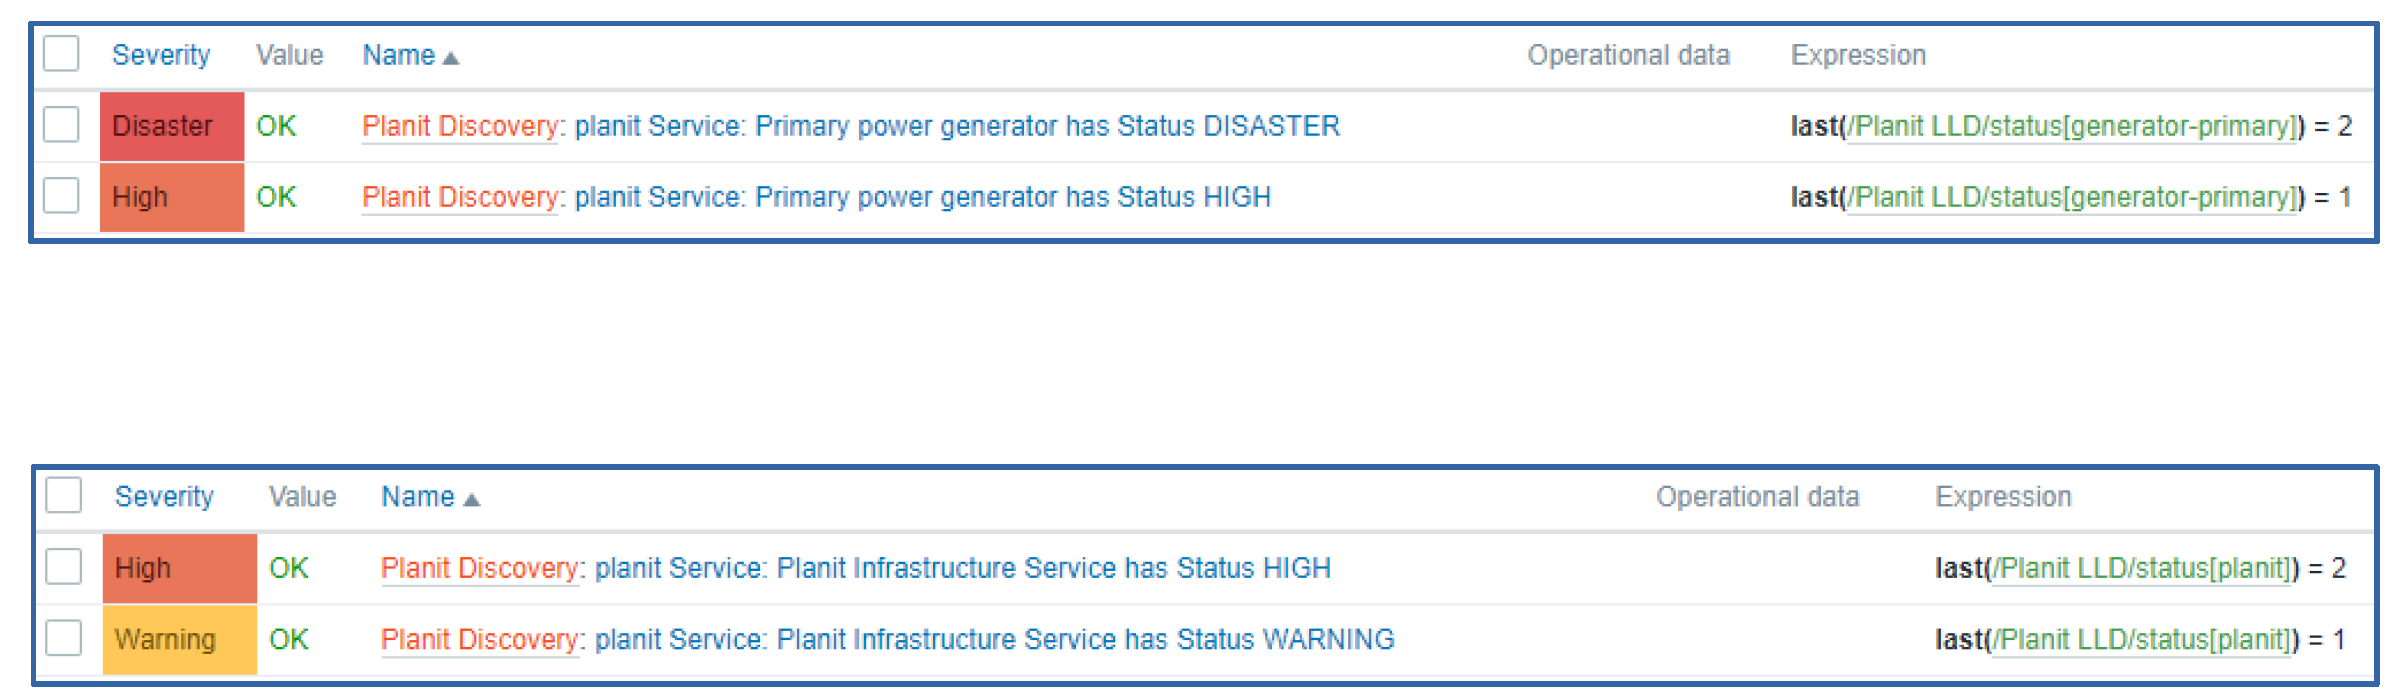
How can we resolve this? Thankfully, Zabbix provides just the right tool for the job – LLD Overrides! We have created 5 overrides on our discovery rule – one for each severity:
In the override conditions, we will specify that if the value contained in the priority LLD macros is equal to -1, we will not be discovering the trigger of the specific severity.
The final result looks much cleaner – now we have only two trigger definitions instead of five. 
This is a good example of how we can use LLD together with master items obtaining data from external APIs and also improve the LLD logic by using LLD overrides.
“Sphinx” application monitoring using Graylog REST API
For our second example, we will be monitoring the Sphinx application by using the Graylog REST API. Graylog is a log management tool that we use for log collection – it is not used for any kind of alerting. We also have an application called Sphinx, which consists of three components – a Web component, an App component, and a WCF Gateway component. Our goal here is to:
- Use Zabbix for evaluating error messages related to Sphinx from Graylog
- Monitor the number of errors in user-defined time intervals for different components and alert when a threshold is exceeded
- Analyze the incoming error message and prepare them for a user-friendly output sorted by error types
The main challenges posed by this use-case are:
- How to obtain Sphinx component information from Graylog
- How to handle certificate problems (DH_KEY_TOO_SMALL / Diffie-Hellman key) due to an outdated version of the installed Graylog server
- How to sort the error messages coming in “Free form” without explicit error types
Collecting the data from Graylog
Since the Graylog application used in the current scenario was outdated, we had to work around the certificate issues by using the Zabbix external check item type. Once again, we will be using master and dependent item logic – we will create three master items (one for each component) and retrieve the component data. All additional information will be retrieved by the dependent items as to not cause extra performance impact by flooding the Graylog API endpoint. The data itself was parsed and sorted by using Javascript preprocessing. The dependent item prototypes are used here to create the items for the obtained stats and the data used for visualizing each error type on a user-friendly dashboard.
Let’s take a look at the detailed workflow for this use case:
- An External check for scanning the Graylog stream Sphinx App Raw
- A dependent item which analyzes and filters the raw data by using preprocessing Sphinx App Raw Filtered
- This dependent item is used as a master item for our LLD Sphinx App Error LLD
- The same dependent item is also used as a master item for our item prototypes – Sphinx App Error count and Sphinx App Error List

Effectively this means that we perform only a single call to the Graylog API, and all of the heavy lifting is done by the dependent item in the middle of our workflow.
The following workflow is used to obtain the information only about the App component – remember, we have two other components where this will have to be implemented – Web and Gateway.
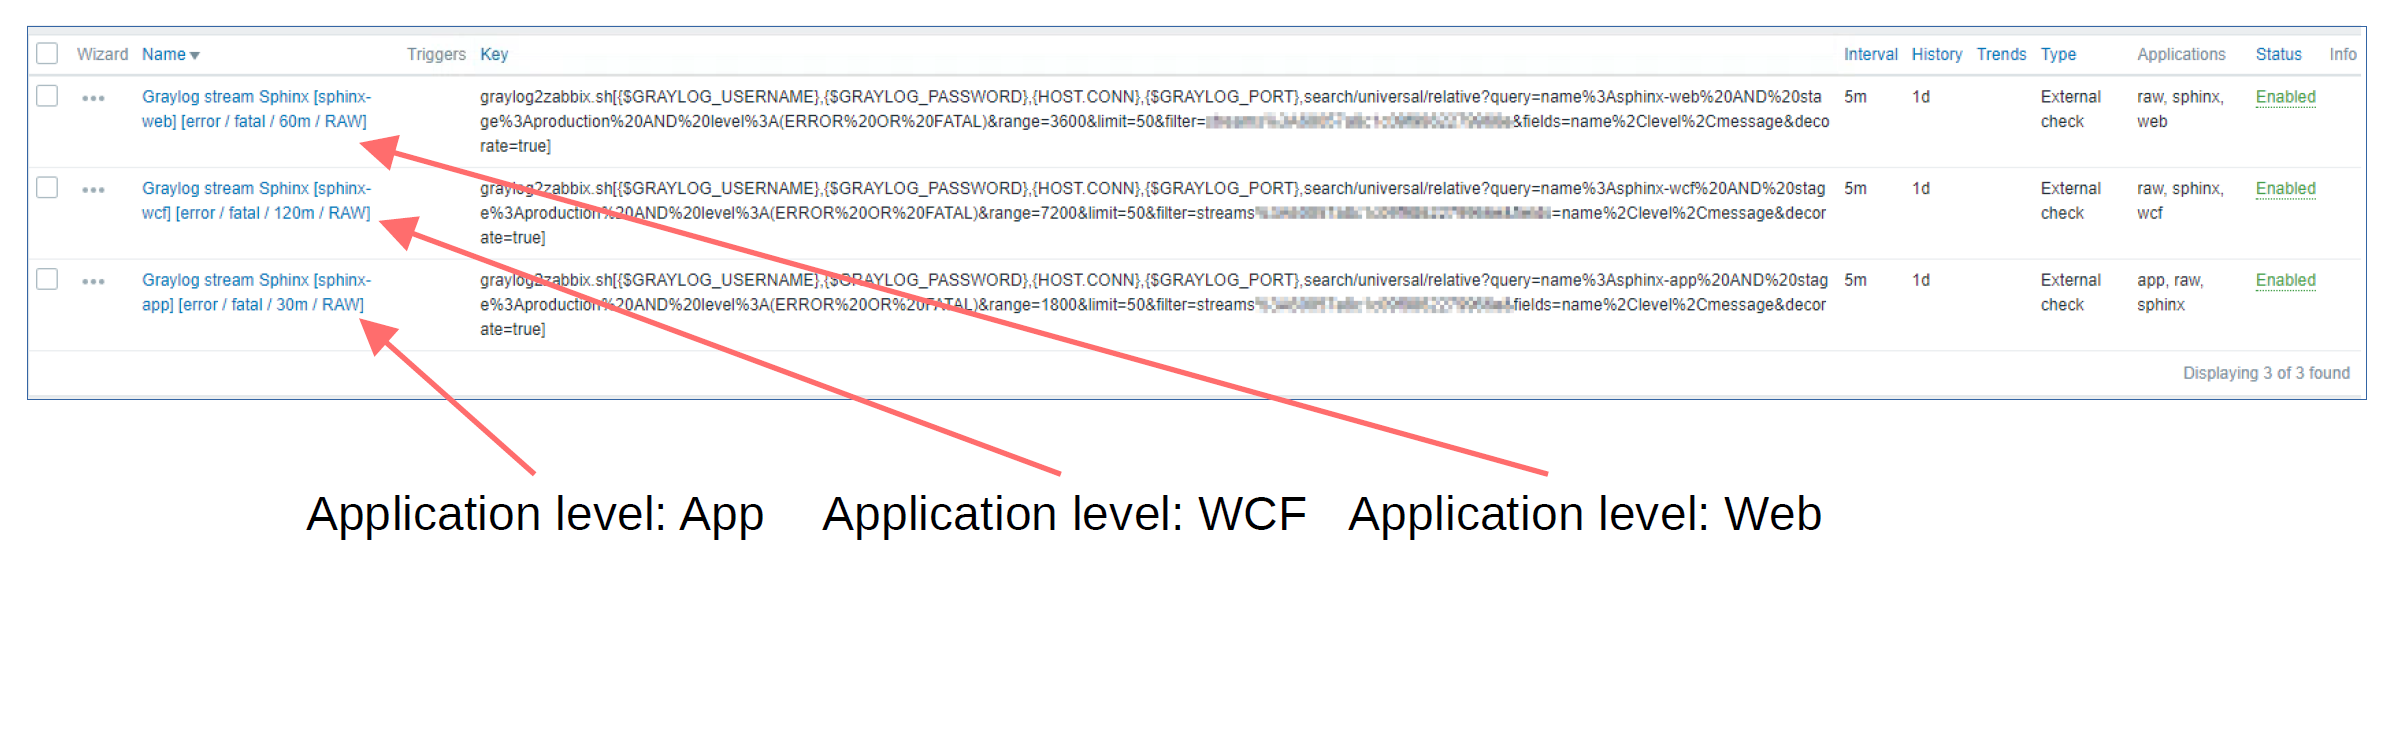
In total, we will have three master items for each of the APP components:

They will use the following shell script to execute the REST API call to the Graylog API:
graylog2zabbix.sh[{$GRAYLOG_USERNAME},{$GRAYLOG_PASSWORD},{HOST.CONN},{$GRAYLOG_PORT},search/universal/relative?
query=name%3Asphinx-app%20AND%20stage%3Aproduction%20AND%20level%3A(ERROR%20OR
%20FATAL)&range=1800&limit=50&filter=streams%3A60000a8c1c09f9862279966e&fields=name%2Clevel
%2Cmessage&decorate=true]
The data that we obtain this way is extremely hard to work with without any additional processing. It very much looks like a set of regular log entries – this complicates the execution of any kind of logic in reaction to receiving this kind of data:
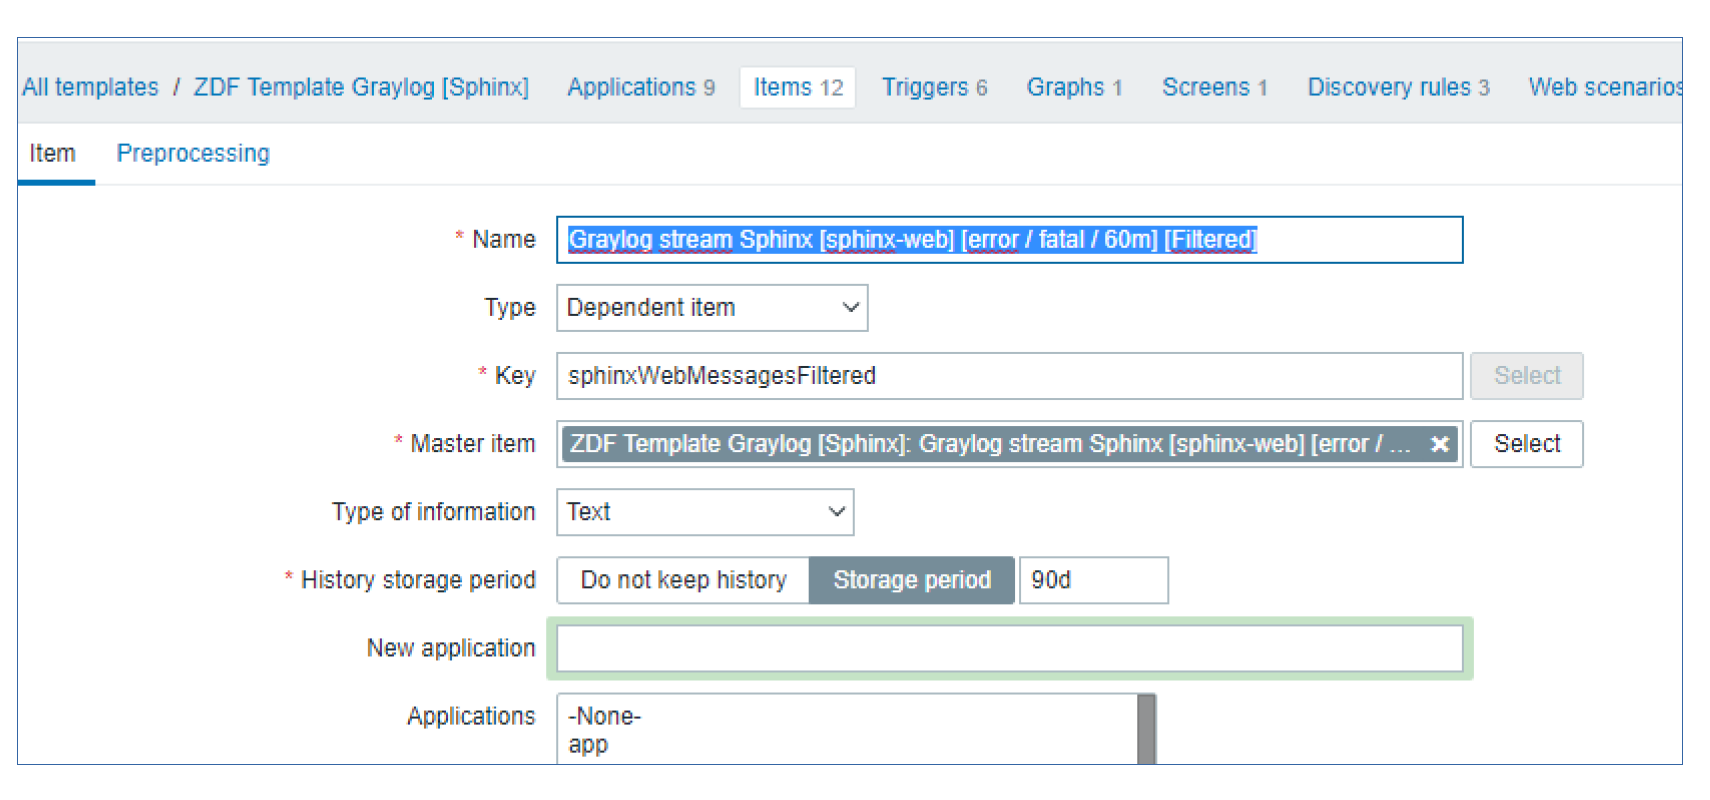
For this reason, we have created a dependent item, which uses preprocessing to filter and sort this data. The dependent item preprocessing is responsible for:
- Analyzing the error messages
- Defining the error type
- Sorting the raw data so that we can work with it more easily


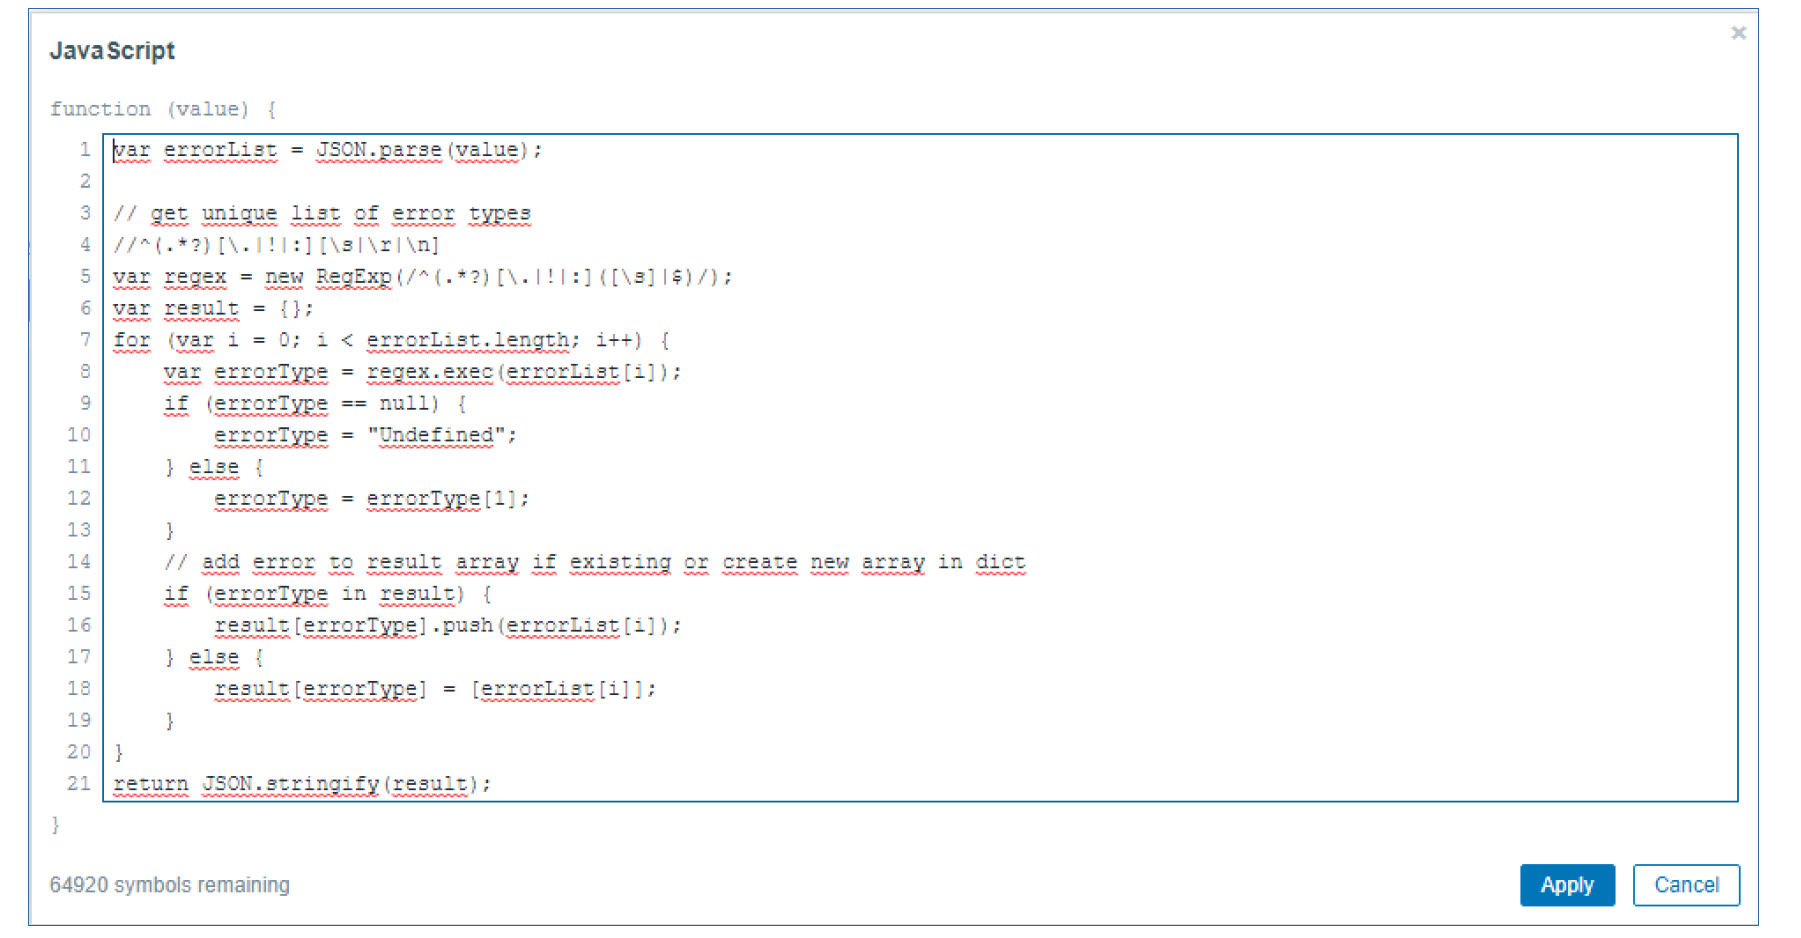
We have defined two preprocessing steps to process this data. We have the JSONPath preprocessing step to select the message from the response and a Javascript preprocessing script that does the heavy lifting. You can see the Javascript script below. It uses Regex and performs data preparation and sorting. In the last line, you can see that the data is transformed back into JSON, so we can work with it down the line by using the JSONpath preprocessing steps for our dependent items.
Below we can see the result. The data stream has been sorted and arranged by error types, which you can see on the left-hand side. All of the logged messages are now children that belong to one of these error types.
We have also created 3 LLD rules – one for each component. These LLD rules create items for each error type for each component. To achieve this, there is also some additional JSONPath and Javascript preprocessing done on the LLD rule itself:
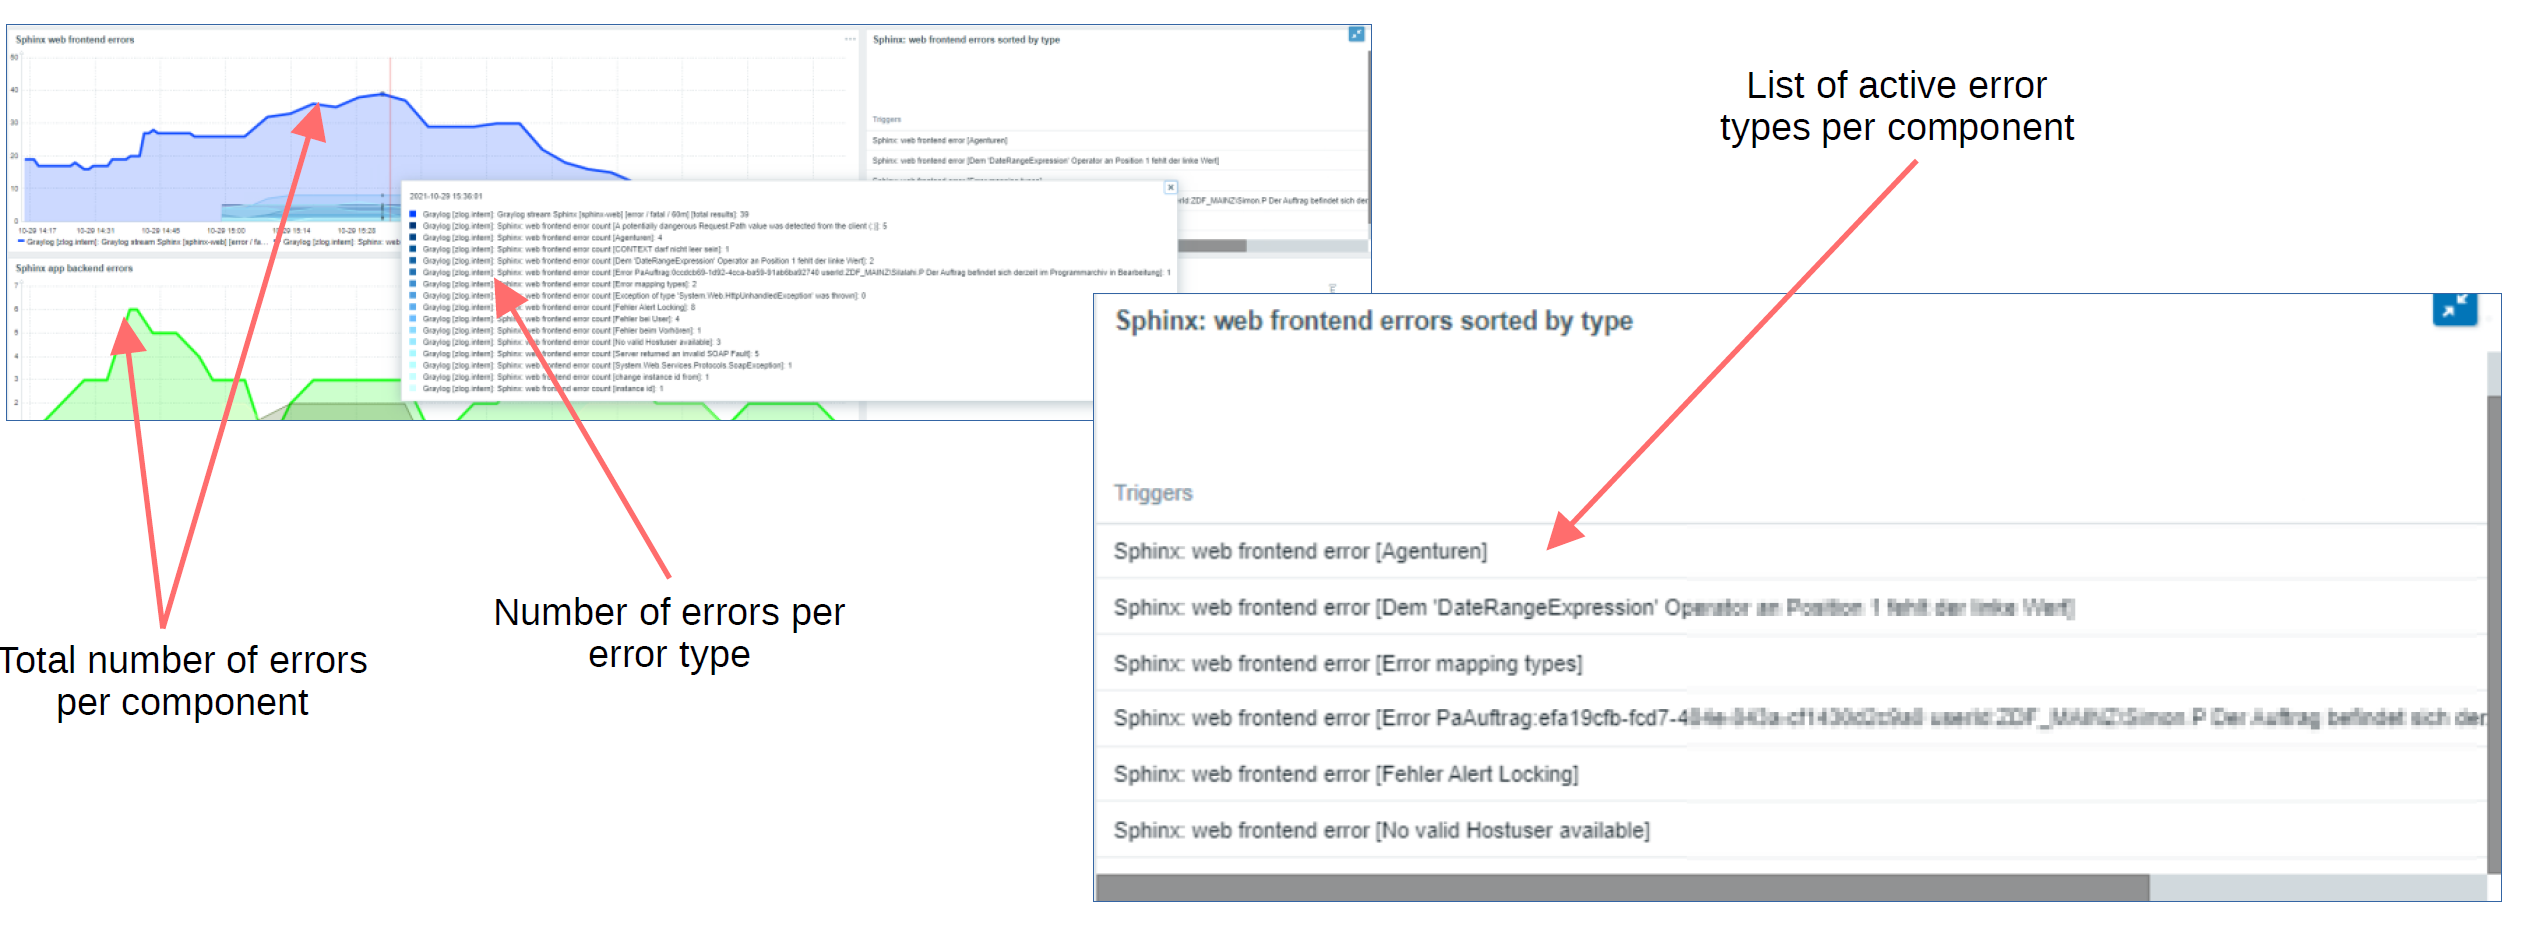
The end result is a dashboard that uses the collected information to display the error count per component. Attached to the graph, we can see some additional details regarding the log messages related to the detected errors.
Monitoring of TV broadcast trucks
I would like to finish up this bost by talking about a completely different use case – monitoring of TV broadcast trucks!
In comparison to the previous use cases – the goals and challenges here are quite unique. We are interested in a completely different set of metrics and have to utilize a different approach to obtain them. Our goals are:
- Monitor several metrics from different systems used in the TV broadcast truck
- Monitor the communication availability and quality between the broadcast truck and the transmitting station
- Only monitor the broadcast truck when it is in use
One of the main challenges for this use case is avoiding false alarms. How can we avoid false positives if a broadcast truck can be put into operation at any time without notifying the monitoring team? The end goal is to monitor the truck when it’s in use and stop monitoring it when it’s not in use.
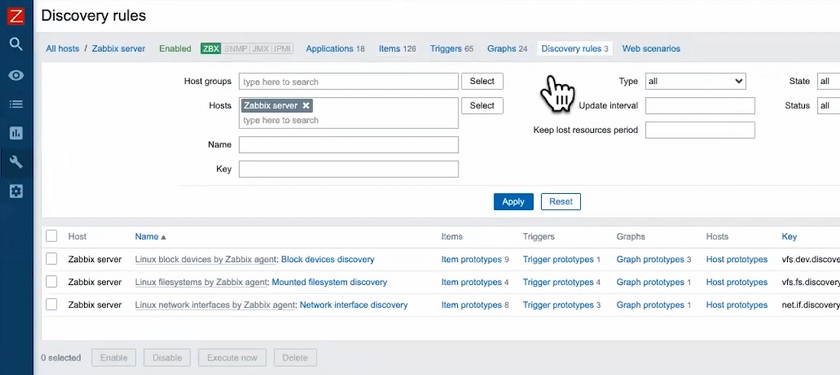
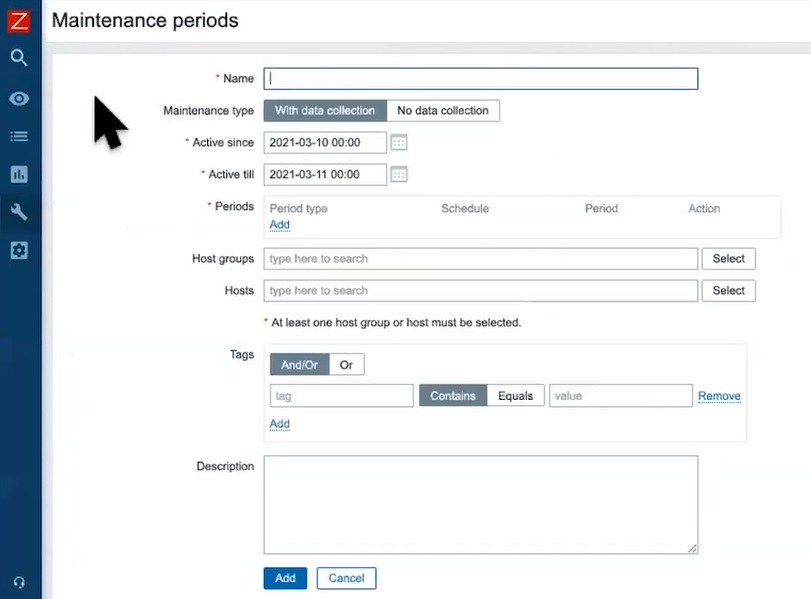
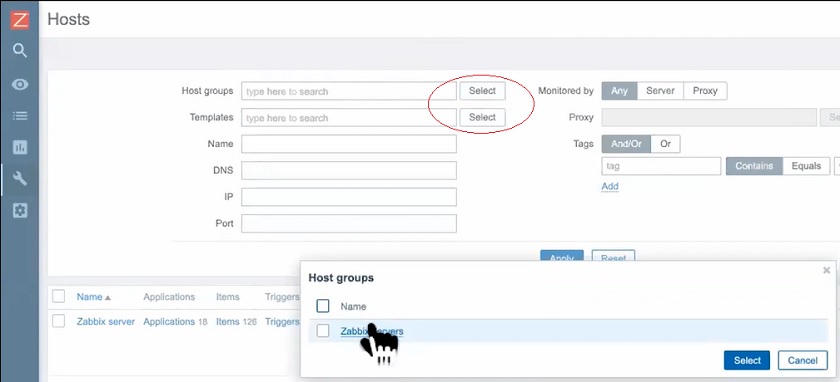
- Each broadcast truck is represented by a host in Zabbix – this way, we can easily put it into maintenance
- A control host is used to monitor the connection states of all broadcasting trucks
- We decided on creating a middleware application that would be able to implement start/stop monitoring logic
- This was achieved by switching the maintenance on/off by using the Zabbix API
- A specific application in the broadcasting truck then tells Zabbix how long to monitor it and when to enable the maintenance for the said truck

Below we can see the truck monitoring workflow. The truck control host gets the status for each truck to decide when to start monitoring the truck. The middleware then starts/stops the monitoring of a truck by using Zabbix API to control the maintenance periods for the trucks. Once a truck is in service, it also passes the monitoring duration to the middleware, so the middleware can decide when the monitoring of a specific truck should be turned off.
Next, let’s look at the truck control workflow from the Zabbix side.
- Each broadcast truck is represented by a single trigger on the control host
- The trigger actions forward the information that the truck maintenance period should be disabled to the middleware
- Middleware uses the Zabbix API to disable the maintenance for the specific truck
- The truck is now monitored
- The truck forwards the Monitoring duration to the middleware
- Once the monitoring duration is over, the middleware enables the maintenance for the specific truck

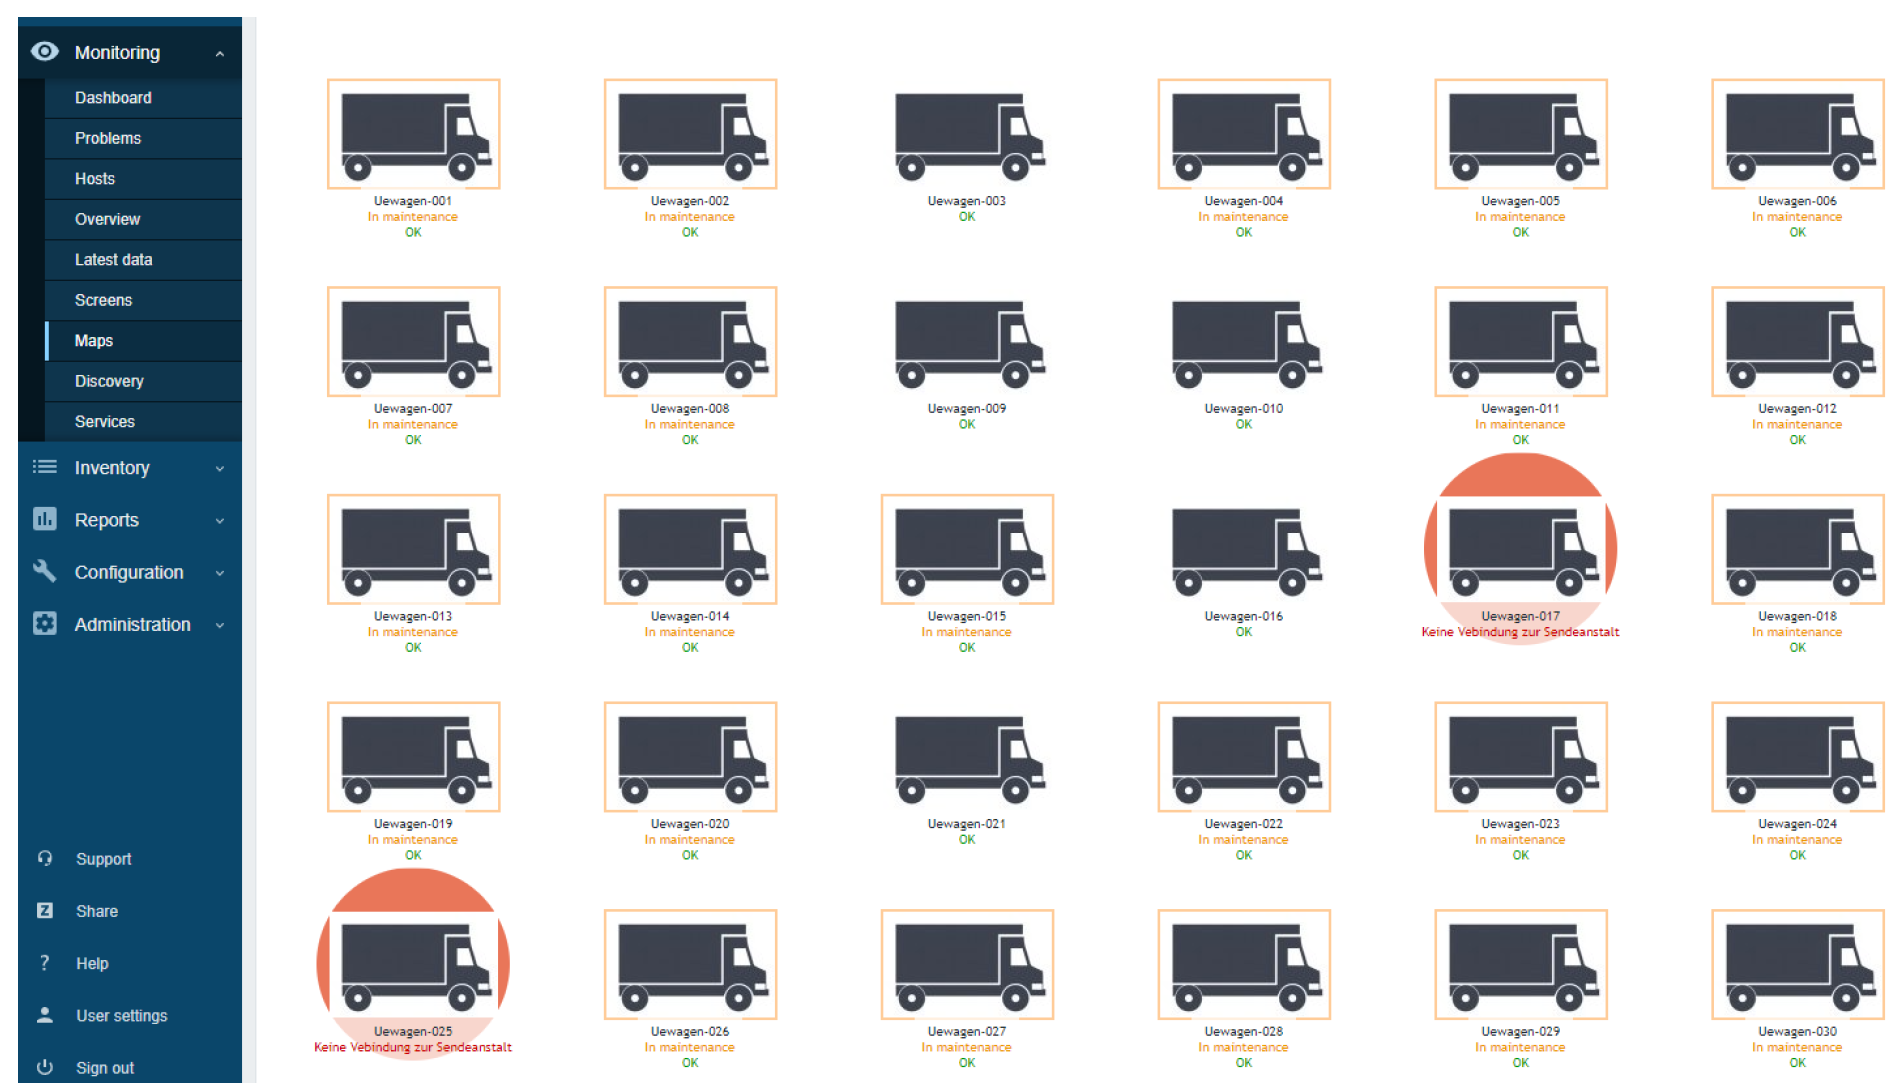
Finally, the trucks are displayed on a map which can be placed on our dashboards. The map displays if the truck is maintenance (not active) and if it has any problems. This way, we can easily monitor our broadcast truck fleet.
From gathering data from external systems to performing complex data transformations with preprocessing and monitoring our whole fleet of broadcast trucks – I hope you found these use cases useful and were able to learn a thing or two about the flexibility of different Zabbix features!
The post Zabbix meets television – Clever use of Zabbix features by Wolfgang Alper / Zabbix Summit Online 2021 appeared first on Zabbix Blog.