Post Syndicated from Aigars Kadiķis original https://blog.zabbix.com/correlation-between-devices-across-client-site/14657/
In this blog post, we will talk about aggregating different kinds of devices that are disconnected from the general network. Finding out how many devices per kind are “down” right now. This can be useful in the Internet Service Provider type of situation.
A property

It all starts with a property.
A property can be a building, a block. Most likely it has a firewall and a core switch at the top of everything.
A building can have floors. Floors can own a switch. An edge switch.
Each floor can have rooms or departments. It may be enough to put there a router to feed all devices around.
Vision
When something goes off, we want to see “what is the damage?” If a major component goes down, that should be a priority to concentrate on.
In general, we target much more descriptive message like:
=> 2 edge switches down
=> A core switch is down
=> 15 routers down
=> Firewall is down
For the best experience, we target to have only one message.
Prerequisites
To inform us how many devices are down, we need to make sure:
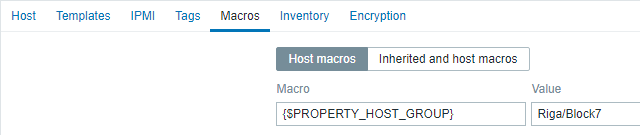
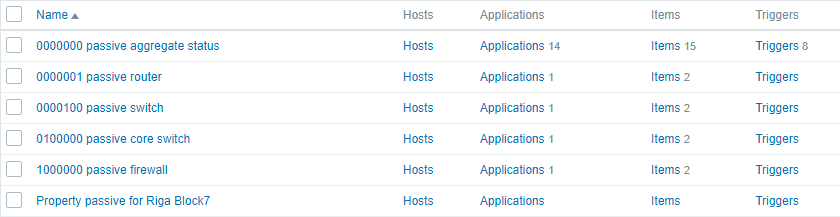
1) Each client host must belong to a host group. The name of host group describes the location of the property, for example “Riga/Block7”:

2) Each host object owns a macro {$PROPERTY_HOST_GROUP}. This can be delivered through the template. The macro value must be the same as the name of the host group: “Riga/Block7”
3) There is one virtual host in the client pool. This host will do the aggregations, determine what kind of devices are down and how many of them.
4) At least one passive check must work for devices. SNMP polling must be in place.
How it works?
Monitoring software is executing passive checks:
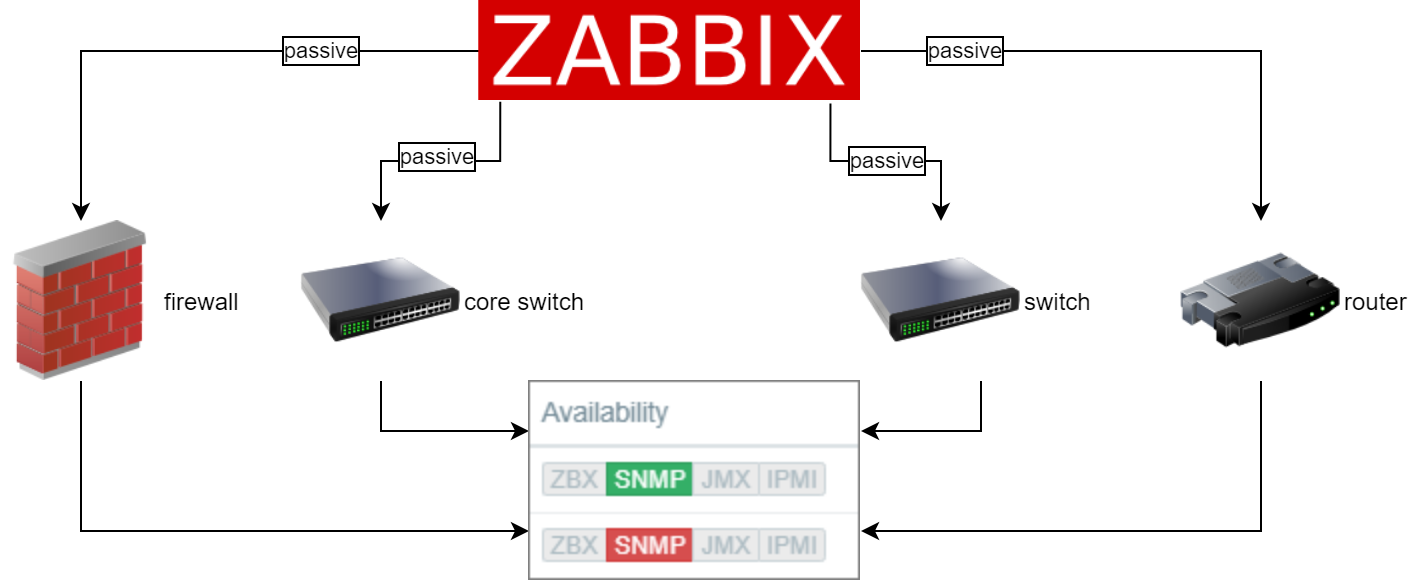
As a result, it will generate red/green icons:
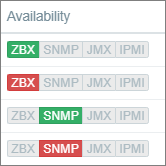
A “Zabbix internal” type can read the status of the icon:
zabbix[host,agent,"available"]
zabbix[host,snmp,"available"]
if the icon is red, a number 0 will be reported
if the icon is green, a number 2 will be reported
2 items in the template
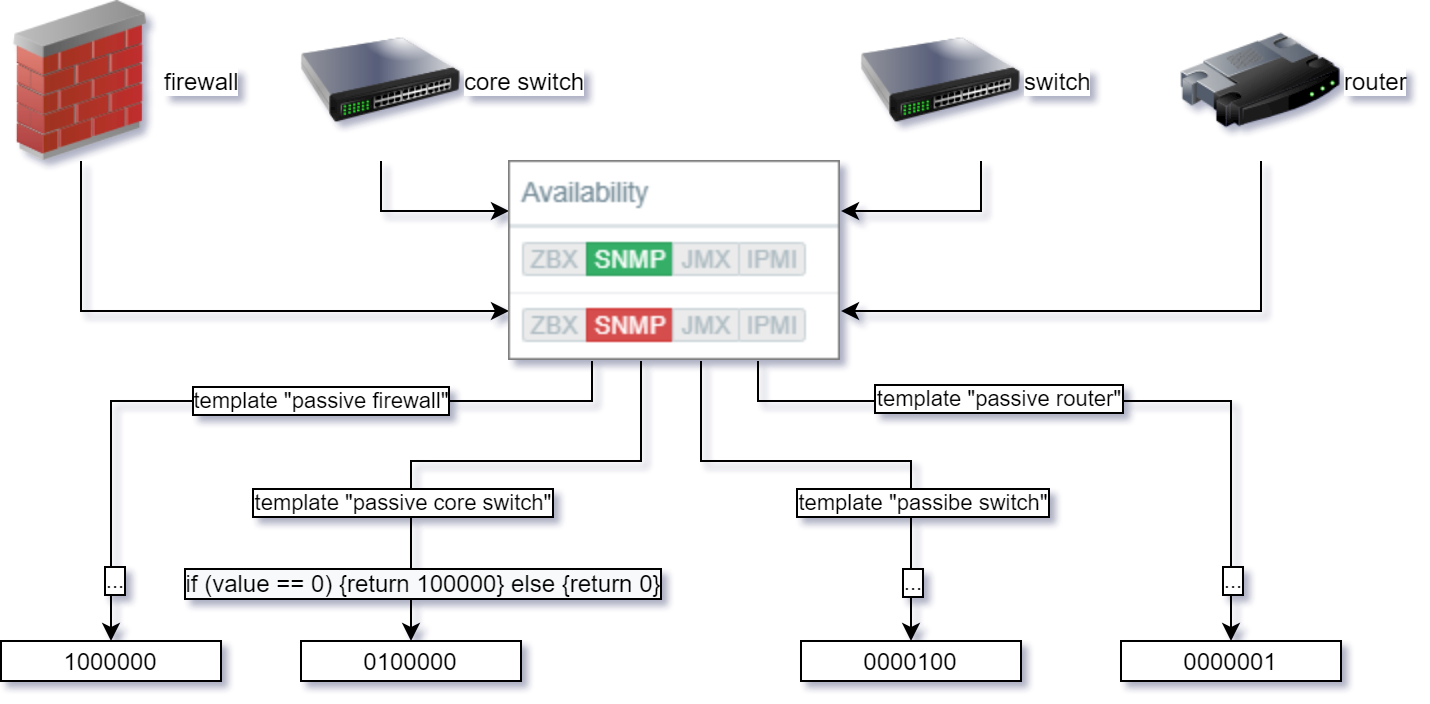
There are 2 items in the template per category. At first, the “availability” item fetch the status of the icon and then a dependable item transforms this information into another number:
// Router:
if (value == 0) {return 1} else {return 0}

// Switch:
if (value == 0) {return 100} else {return 0}

// Core switch:
if (value == 0) {return 100000} else {return 0}

// Firewall:
if (value == 0) {return 1000000} else {return 0}
Aggregation
Each device type will generate numbers like 1 or 100 or 100000 or 1000000.
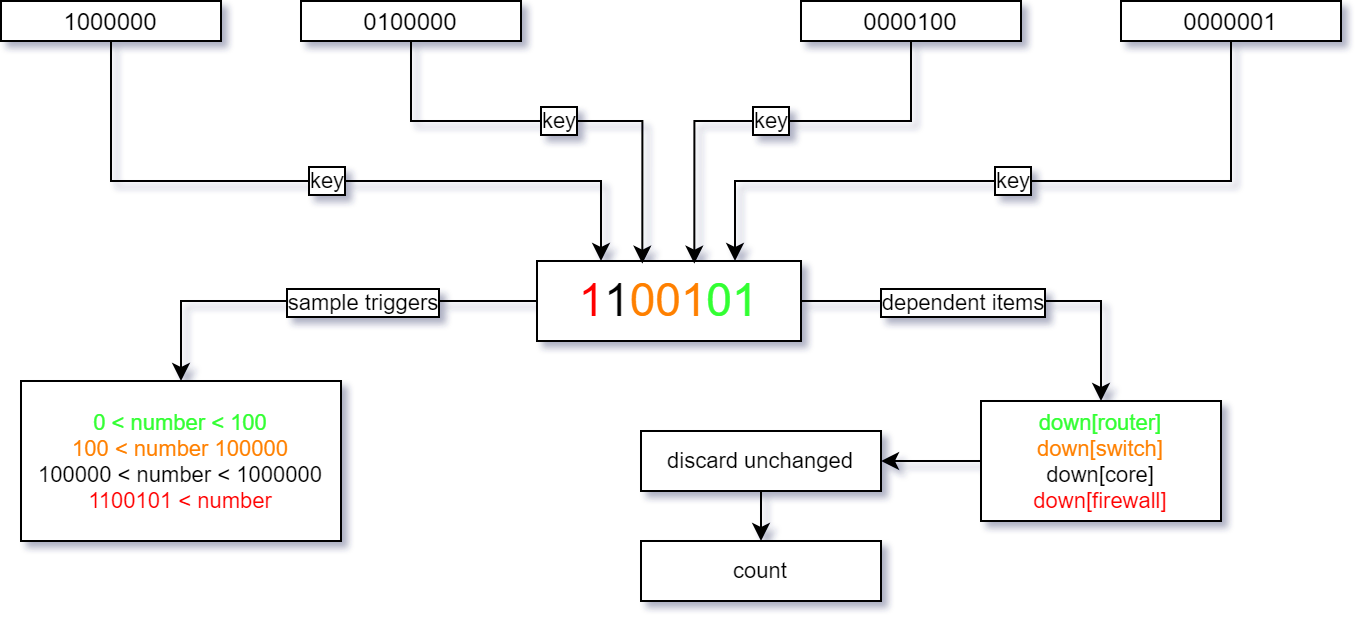
We can have 2 options:
1) Link a trigger directly on the calculated number. If the integer number is bigger, it’s more critical to the client.
2) We can also operate with dependable items. Here is one method to transform calculated item back into dependent items:
// Routers down:
if (value == 0) {return 1} else {return 0}

// Switches down:
if (value > 99) {return value.replace(/..$/,"") % 1000} else {return 0}
// % 1000 is because the client can have 999 switches

// Core switches down:
if (value > 99999) {return value.replace(/.....$/,"") % 10} else {return 0}
// % 10 is because the client can have 9 core switches

// Firewalls down:
if (value > 999999) {return value.replace(/......$/,"") % 10} else {return 0}
// % 10 is because the client can have 9 firewalls
Detect flapping
It would be quite useful to detect when some devices are changing up/down too frequently. No elegant solution here, be we can have a workaround. We can clone all 4 items:

and, per each item, add a second preprocessing step “Discard unchanged”:
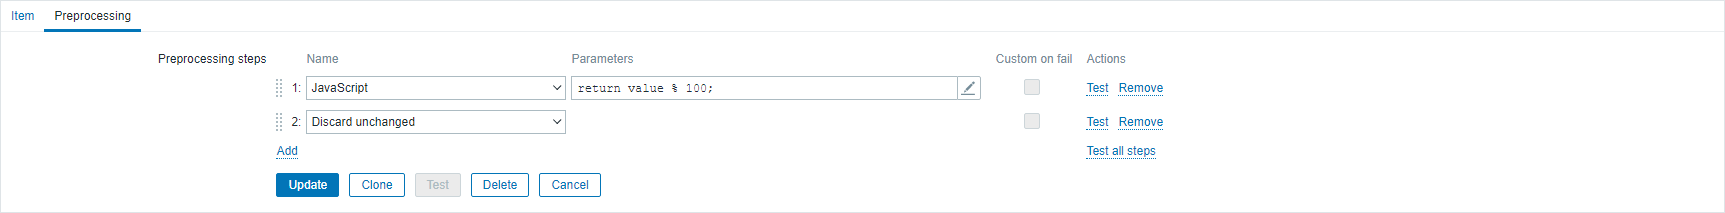
We will result up in +4 items:

One last step, to create additional +4 items to count how many metrics the “changes” item did receive. Here is a sample of one:

Macro value of {$FLAP} can be ‘1d’.
Known issues with the solution to detect flapping
If service ‘zabbix-server’ will receive a restart, It will generate “+1 flap” per each device type.
If a device in one category change state to “up” and another device in the same category in the same minute changes state to “down”. This will not be detected 
How far we can go?
How many classifications we can use? The calculated item is limited to a 64-bit integer which is ‘18446744073709551615’, there are 20 digits in this number. Because it starts with a ‘1’ it means that safely we can use only 19 digits.
Proof of concept template
There are 6 templates included in one XML file:
To use this solution:
1) Import XML file.
2) Clone “Property” template.
3) Open a cloned “Property” template and install the correct value of macro {$PROPERTY_HOST_GROUP}. Value must be the same a the host group where all client devices are in.
4) In the same host group where all client devices are in, create a dummy host, apply the “aggregate status” template and assign “Property” template to this host.
5) Assign “binary” templates (the ones which contain a ‘1’ in a name) to devices (switches, core switches, firewalls) the client owns.
Alright, that is it for today. Bye!