Aruba Central is a SaaS solution that allows you to manage your Enterprise Aruba network environment. Due to the increasing number of cloud migrations, we can expect that more and more Aruba customers will move their on-premise environment to it, which will also mean a change in their monitoring environment. In this article, I will show you how to switch to API- based monitoring using Aruba Central and Zabbix. All custom resources mentioned can be found in my repository.
Aruba Central’s API
Oauth 2.0 is used, so you can forget the simple token management. At the end it is great, but for monitoring purposes it is overkill. There is pretty good documentation (referred to later) regarding how you can generate your access token, but after two hours it expires so you need to continually refresh it. To do this, you must use a refresh token, which can help you to get a new access token AND a new refresh token.
Within two hours, use the latest refresh token to repeat this action again. At this point you can imagine that this is not something you can implement easily by using the Zabbix GUI only. Well, maybe with some javascript magic, but otherwise there is no native support for this logic at this point of time. So how can we do this? In short:
Generate your client credentials
Generate your first token
Schedule the token refresh for every two hours
Update your host macro via Zabbix API
Use the token in Zabbix HTTP agent checks
Monitor your environment based on JSONPath pre-processing
Initial steps within Aruba Central
To manage your API access, you need to launch your “HPE Aruba Networking Central” application, so do NOT look into your workspace modules – the “Personal API clients” menu is NOT what we are looking for. Turn off the “New Central” view – at this point the early access version is not so useful (hopefully it will change soon).
The first time you get there, you will not see any items, but under the “My Apps & Tokens” tab you can click the “Add Apps & Tokens” button and generate it. Technically, this is already enough to start to monitoring your network infrastructure, but within two hours it would stop. So the relevant data for us are the “Client ID” and “Client Secret.” Feel free to revoke the recently created token at the bottom area as we do not need it.
Record your credentials
For this article, I am using a simple file to store all the credentials, which will be sourced into a bash script. Please keep in mind that storing your sensitive credentials in a single file is a BAD practice! Your SECO/CISO would probably have a few words with you about it, so please consider a better approach. A more secure way would be to use some Key Vault solution (like Azure, AWS, Google, or Hashicorp). Anyway, let’s continue with this unsecure example:
#!/bin/bash

### ZABBIX VARS ###

# URL of your zabbix instance (assuming you do not use the "/zabbix" ending, if yes, then add it to the end)
zabbix_url="https://your.zabbix.instance.net"
# Your Zabbix API token. If you do not know how to get it, check the documentation.
zabbix_api_token="1234_your_zabbix_api_key_5678"
# Create a host with a macro, remain at the "Macros" tab, turn on debug mode, look for "[hostmacroid] =>"
zabbix_macro_id="12345"

### ARUBA VARS ###
# To find yours, go here and check "Table: Domain URLs for API Gateway Access"
base_url="YOUR_ARUBA_CENTRAL_BASE_URL"
# Click on your profile in the Central app and you will find it there: 32 char long hexa string
client_id="YOUR_CLIENT_ID"
# provided in the previous step
client_secret="YOUR_CLIENT_ID"
# provided in the previous step
customer_id="YOUR_CUSTOMER_ID"
# your login credential
account_username="YOUR_CENTRAL_LOGIN_USERNAME"
# your login credential
account_password="YOUR_CENTRAL_LOGIN_PASSWORD"
# to be populated later
csrftoken=""
session=""
auth_code=""
Get or refresh your token and update the Zabbix host macro
The next steps are based on the official Aruba documentation, which you can find here. Please remember that there are many ways to achieve our target – this is just one example and probably not the most optimal one. Feel free to change / improve it with your code in your preferred scripting language.
The below script assumes that the file containing the credentials (previous step) is named as “variables” and located in the folder named “central.”
Filename: aruba_central_token_new.sh
Purpose: To be used for first time token generation. Later, you only have to refresh your token with the script after this one.
Remarks: Aruba is limiting this API query set, so you can run it only ONCE every 30 minutes! If you made a typo somewhere, wait 30 minutes before your next attempt or tweak the result files.
Purpose: To refresh your existing token. It is expecting an existing refresh token in the “token_refresh.latest” file, so better to run the previous script one time before this.
Remarks: You can run this script as many times you want, but it will result in new tokens only once per every two hours (when the current one expires). Therefore, refreshing too frequently is pointless.
In my case, both the scripts and variables files are in the same “central” folder, which is in a git repository. Each time I call one of the scripts, it will record the new tokens in files, which are committed and pushed to the repo. In my own implementation, this is how I call the refresh script and sync the result with my repo:
You must run your refresh script at least once per every two hours. To make this happen you have many options, including:
cron (old-school, outdated way)
systemctl timer (a better way, but only if it is monitored)
Jenkins / Github Actions/etc.
Zabbix itself, by calling your bash script
In my case, Jenkins does the scheduling and execution and the job is monitored via Zabbix.
Monitor your network infrastructure
When everything is in place, then the monitoring part is pretty simple. The usual JSONPath based logic can be used. API call documentation can be found here. The template contains only the wireless components, since I do not have my switches in Central. Implementing the switching part should not be difficult – just have a look at the “Switch” section, then clone and adjust one of your “get” items.
Screenshots
Latest data – tag based filtering:
Latest data – Site health
Latest data – Gateway info
Latest data – AP info
Triggers:
Some triggers are intentionally disabled, because they are a bit redundant. However, I wanted to cover all options. Sometimes less alerting is better if you have a ticketing system integration, otherwise your monitoring system will turn into a ticket factory.
Known issues and limitations
Since we are not querying the devices directly, some delay can be expected. Based on my recent testing, the delay compared to real time is between 3-10 minutes. In my test I disconnected my test environment and then started to do manual updates frequently. Some items got the real state earlier, some only later.
If your refresh script will malfunction for whatever reason (normally it should not), then you may have to run the other script once to generate a new token, or you can go to the GUI and check the last refresh token, with which you can override the content of the “token_refresh.latest” file.
Aruba is limiting the number of API queries to 5,000 per day. This could seem annoying, but it is way more than what you need (you should expect less than 1,000 in normal conditions, depending on your update frequency).
Zabbix API will not authorize your call unless you insert a line into your apache vhost configuration. This is a more generic Zabbix API issue that is not related to Aruba Central.
If Aruba Central has a maintenance activity, then the token refreshing way could break. Running the token request script once should address the issue.
Summary
Aruba Central’s API is pretty decent, but if you start from zero it could take a while to get to the end of it. With this guide, my intention was to speed you up, but please do not consider my scripts and the shown example as the only or best possible way – I’m just hoping it can give you a good base for your own solution. Have fun!
In today’s digital era, information is an asset and most of it is obtained from websites. The ability to automatically monitor website content changes has become a crucial competitive advantage, as even small changes on a website can affect business strategies, security postures, and data-driven decision-making. Accordingly, Zabbix 7.0 saw the introduction of a new feature called Browser Item, which allowed users to perform advanced website monitoring using a browser.
The Browser Item feature includes the ability to:
● Capture screenshots of the current website state
● Measure website performance and availability metrics
● Extract and analyze data from web pages
● Generate automatic alerts based on detected changes or errors
This means Zabbix is no longer limited to traditional IT infrastructure monitoring. It can now also serve as a tool for monitoring strategic external information.
Key use cases for website change monitoring with Zabbix
The Zabbix Browser Item opens up many valuable use cases for organizations that want to proactively track website changes. Below are some key examples:
Monitoring release notes
Tracking vendor release notes is essential for IT teams. With Zabbix, we can automatically detect new releases, extract relevant information, and notify the appropriate team members so they can respond faster.
Tracking security advisories
Security advisories are critical for maintaining a strong security posture. By monitoring websites that publish vulnerability information using Zabbix, security teams can be promptly alerted about new threats and take timely actions to reduce risks.
Monitoring competitor websites
In a competitive market, staying informed about competitor activities is vital. Zabbix allows users to monitor competitor websites for pricing updates, new product offerings, marketing campaigns, or news announcements, while providing valuable business intelligence to support strategic decisions.
Monitoring tender announcements
Zabbix can also monitor websites for new tender announcements from government portals or business partners, ensuring our organization stays aware of the latest business opportunities.
Ensuring internal website integrity
Beyond external sites, we can also use the Browser Item to ensure the integrity and availability of our own websites. It helps detect unexpected content changes, broken links, or performance degradation that may affect the user experience or signal potential issues. Proactive monitoring helps maintain a high-quality user experience and protect our brand reputation.
Getting started with website change monitoring in Zabbix
Solution overview architecture
This diagram shows how Zabbix uses a WebDriver to capture and analyze website content.
The collected data is stored in Zabbix for visualization and alerts when changes are
detected.
Step-by-step configuration
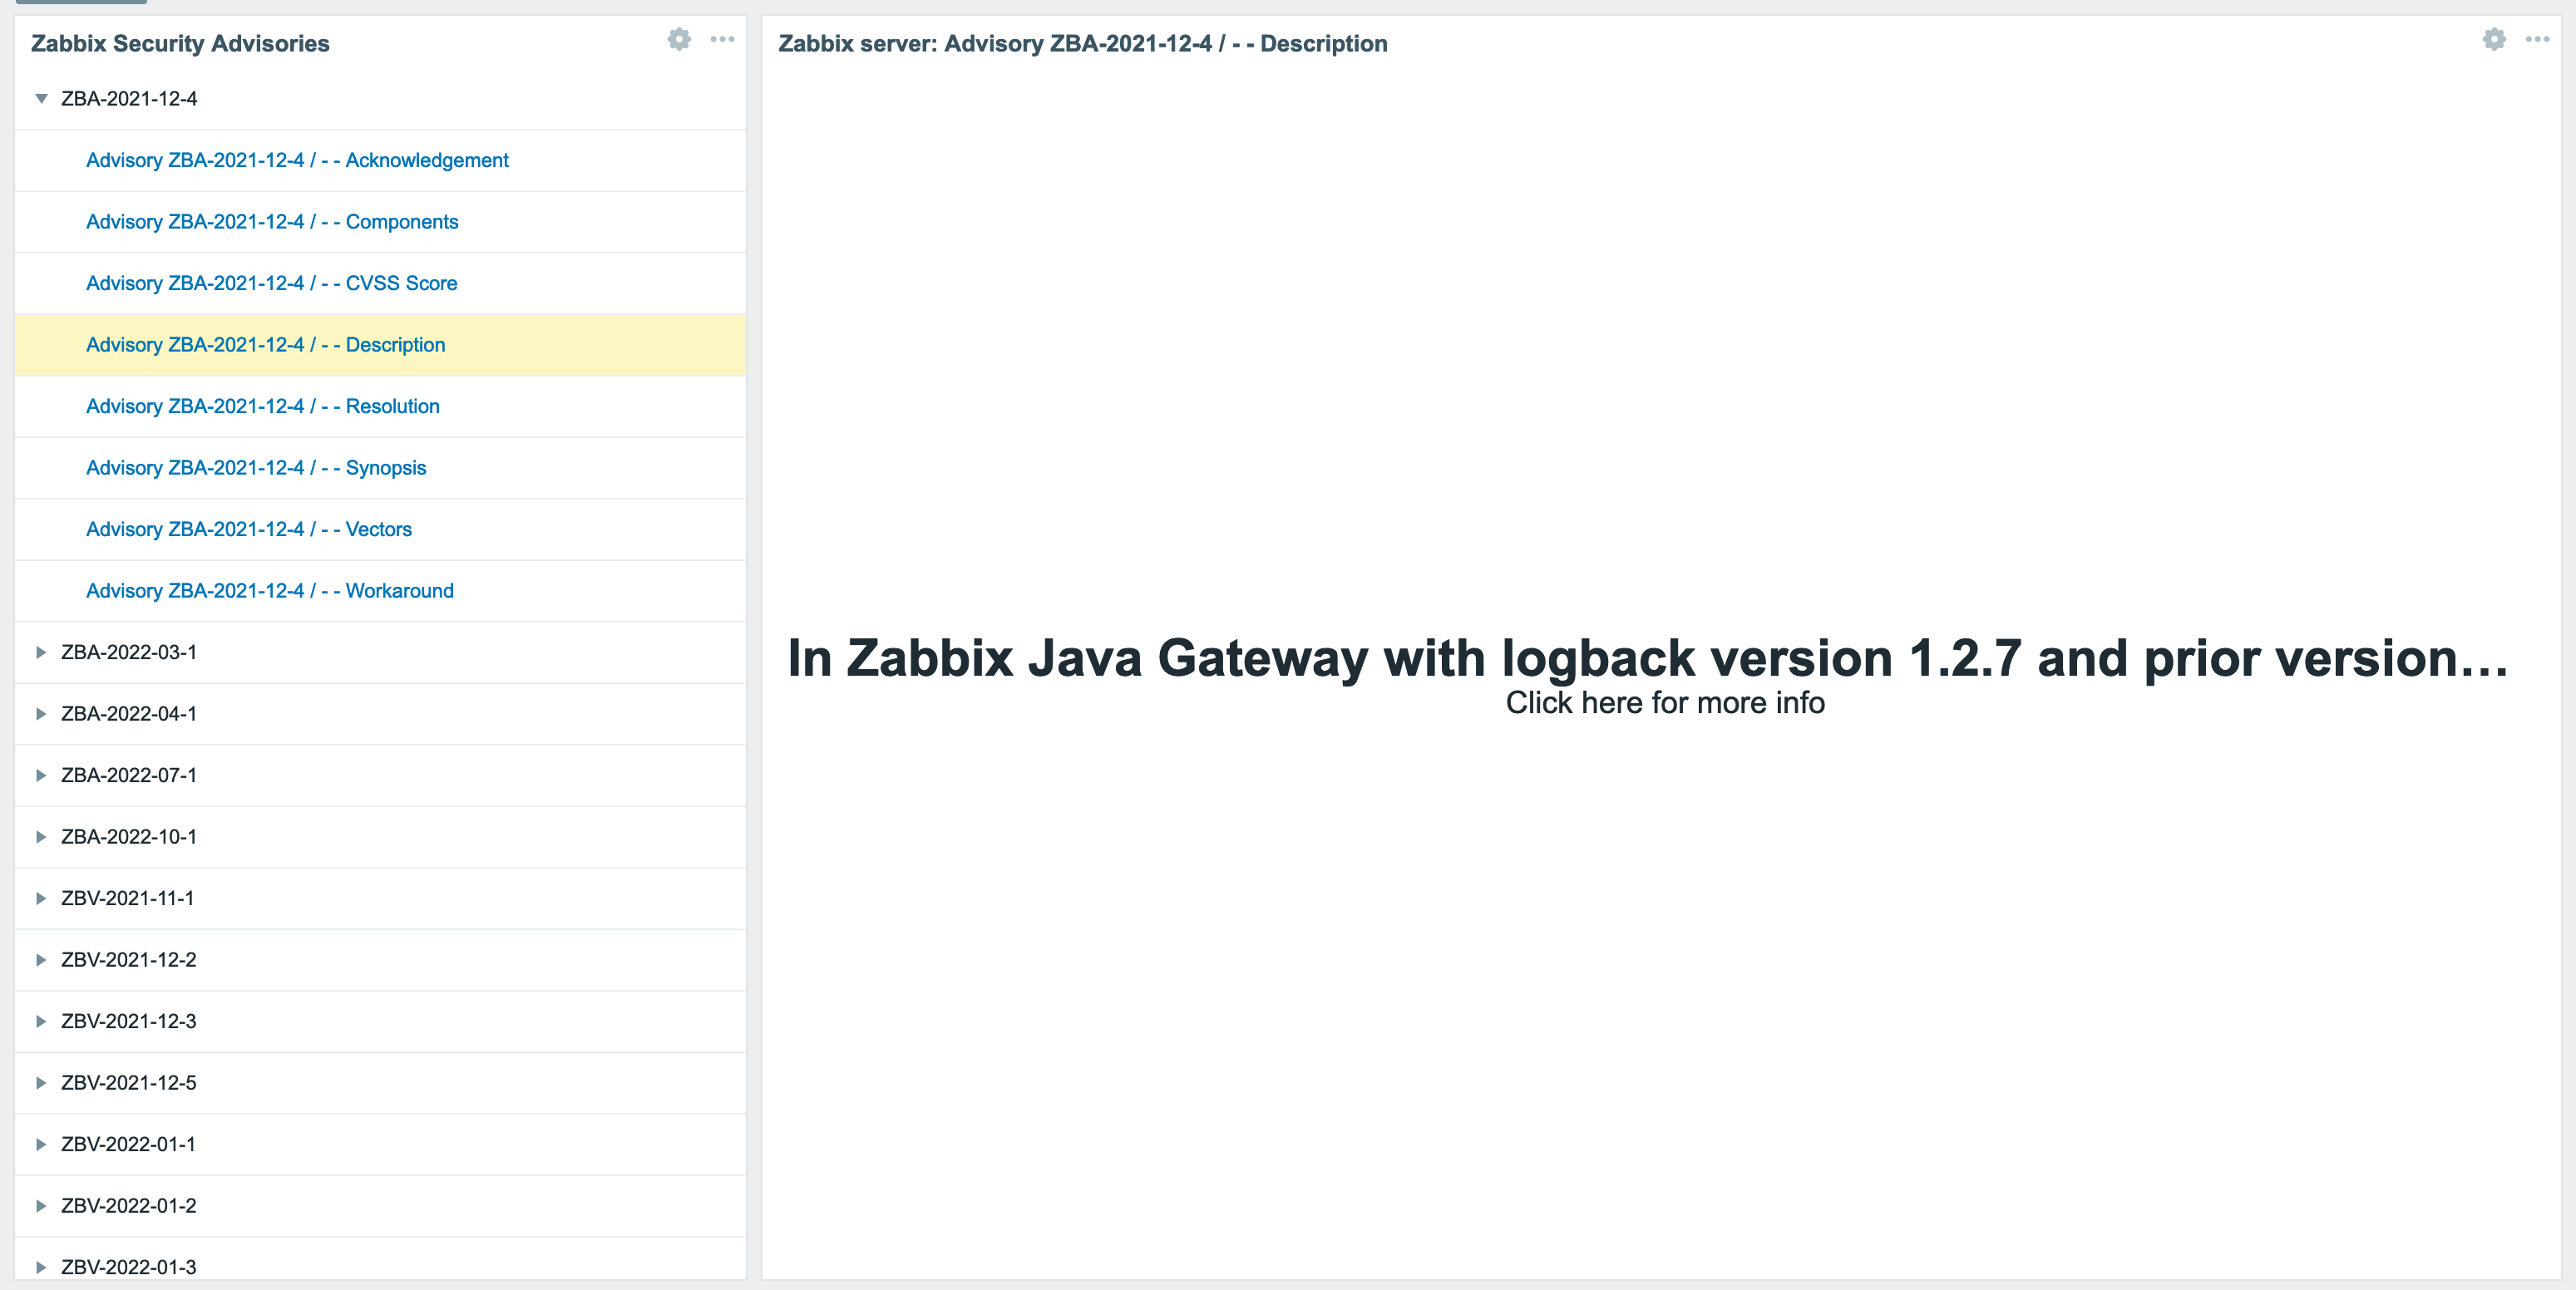
In this example, we’ll monitor changes on the Nginx Security Advisories webpage.
Step 1: Prepare the Web Driver
Zabbix requires a Web Driver to perform browser-based monitoring. One commonly used option is Selenium, which can be deployed using the following Docker image:
Step 2: Configure WebDriverURL on Zabbix server or proxy
Update the WebDriverURL parameter in your Zabbix Server or Zabbix Proxy configuration to point to the Selenium service you deployed.
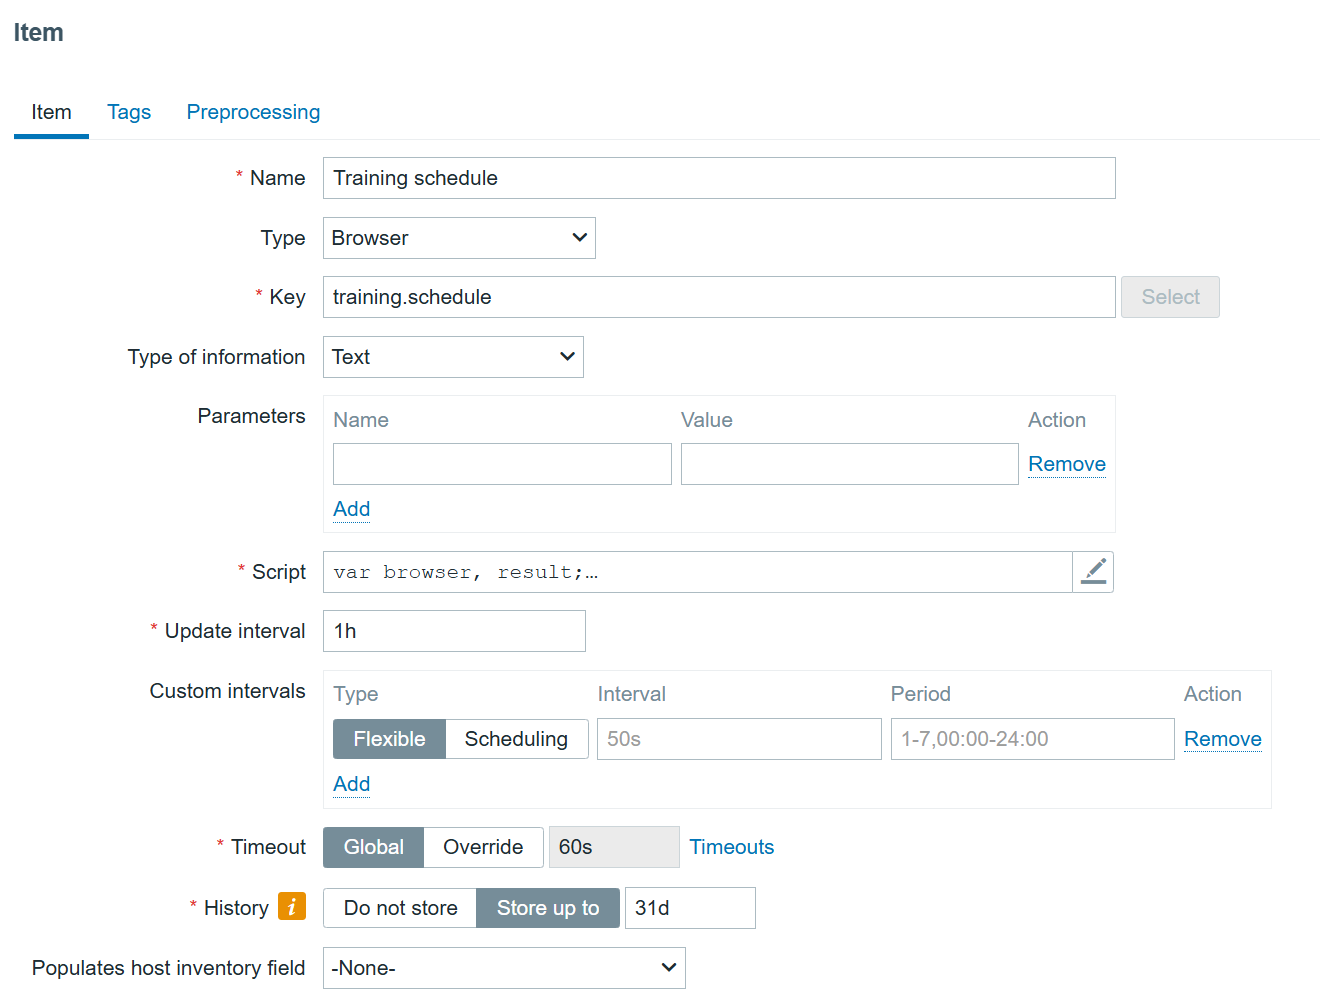
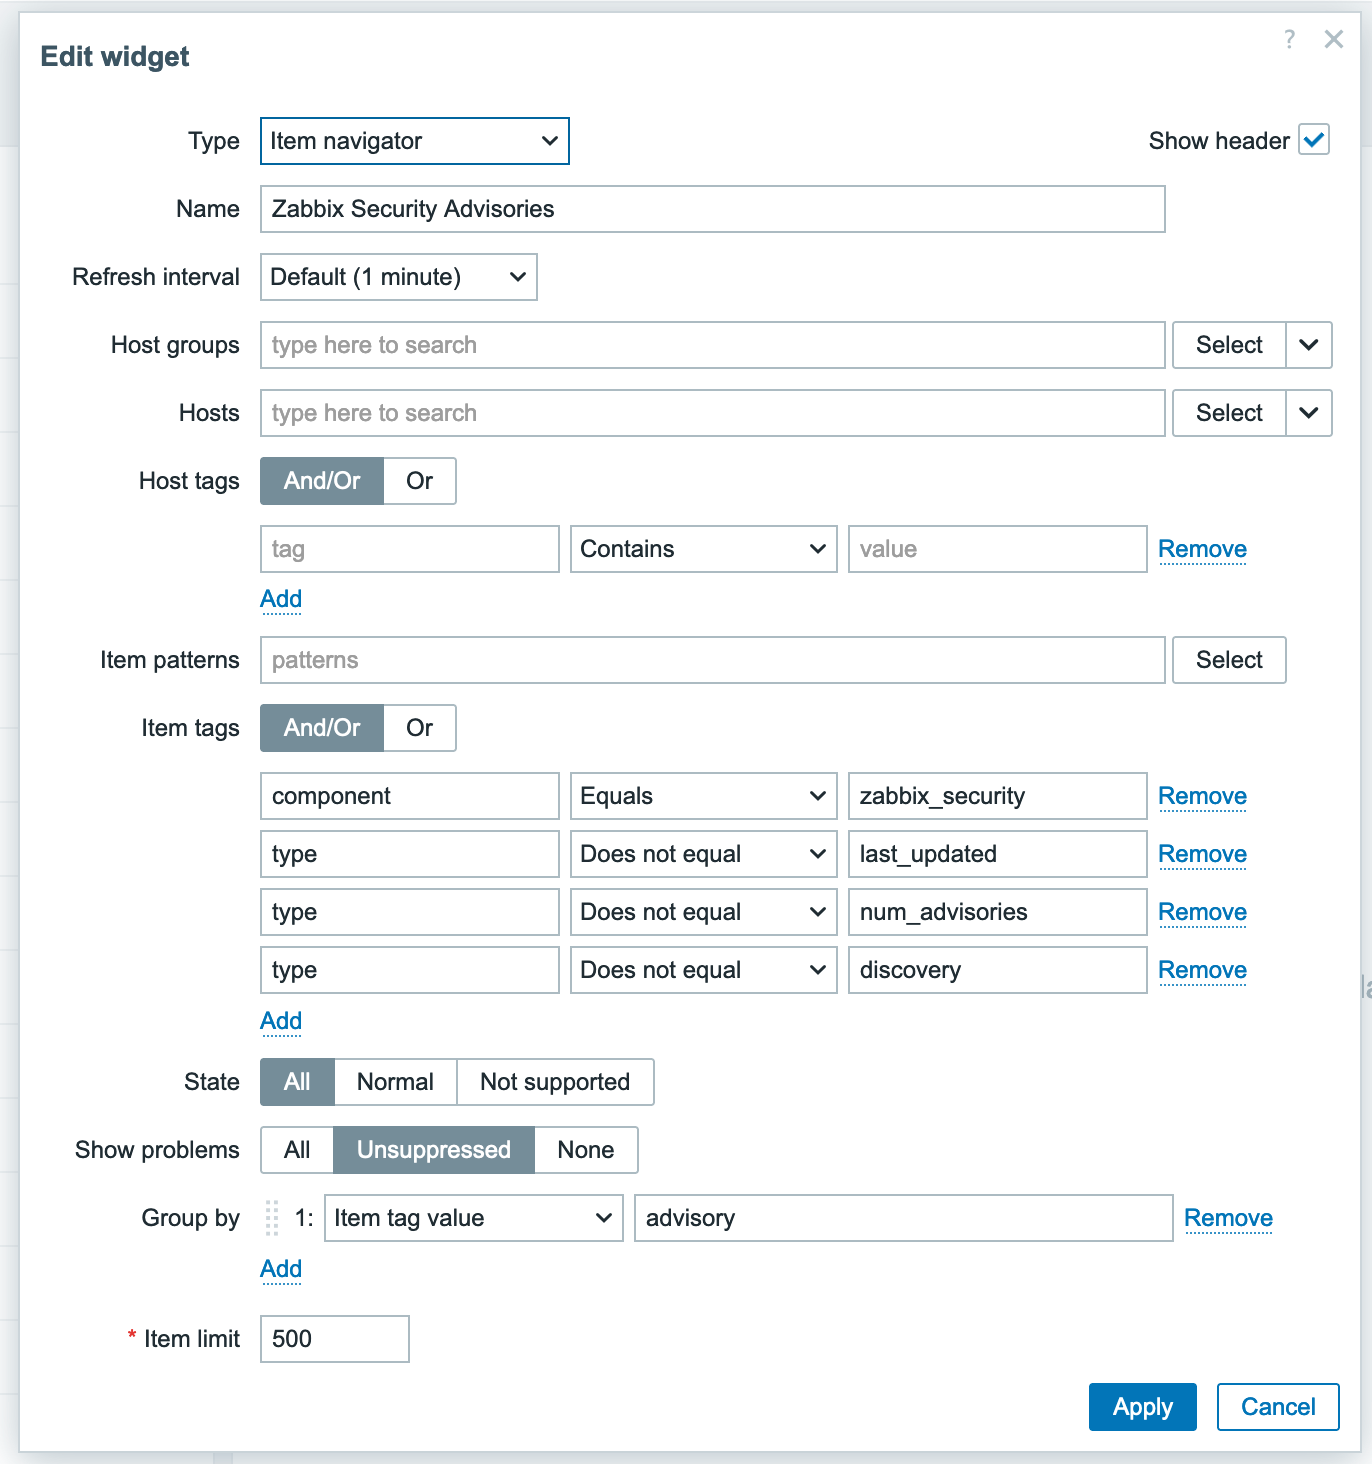
Step 3: Create a Browser Item in Zabbix
1. Create a host if it doesn’t already exist.
2. Add a new item with the following settings:
Type: Browser
Type of information: Text
The key part is the script section. Below is the example script.
The script uses two methods:
browser.navigate method defines the URL to be monitored
browser.findElements method specifies the page section where changes should be detected
Note: The StartBrowserPollers parameter must be enabled on the Zabbix server or proxy configuration for browser items to work. It is enabled by default with the value StartBrowserPollers=1.
Step 4: Create dependent items
The Browser Item produces a JSON result containing website data. This item serves as the master item for dependent items such as:
Extracting the latest security advisories
Capturing a website screenshot
Step 5: Create a trigger for change alerts
Create a trigger that compares the current and previous values of the “latest security advisories” item. If any change is detected, Zabbix will automatically send an alert notifying your team of the update.
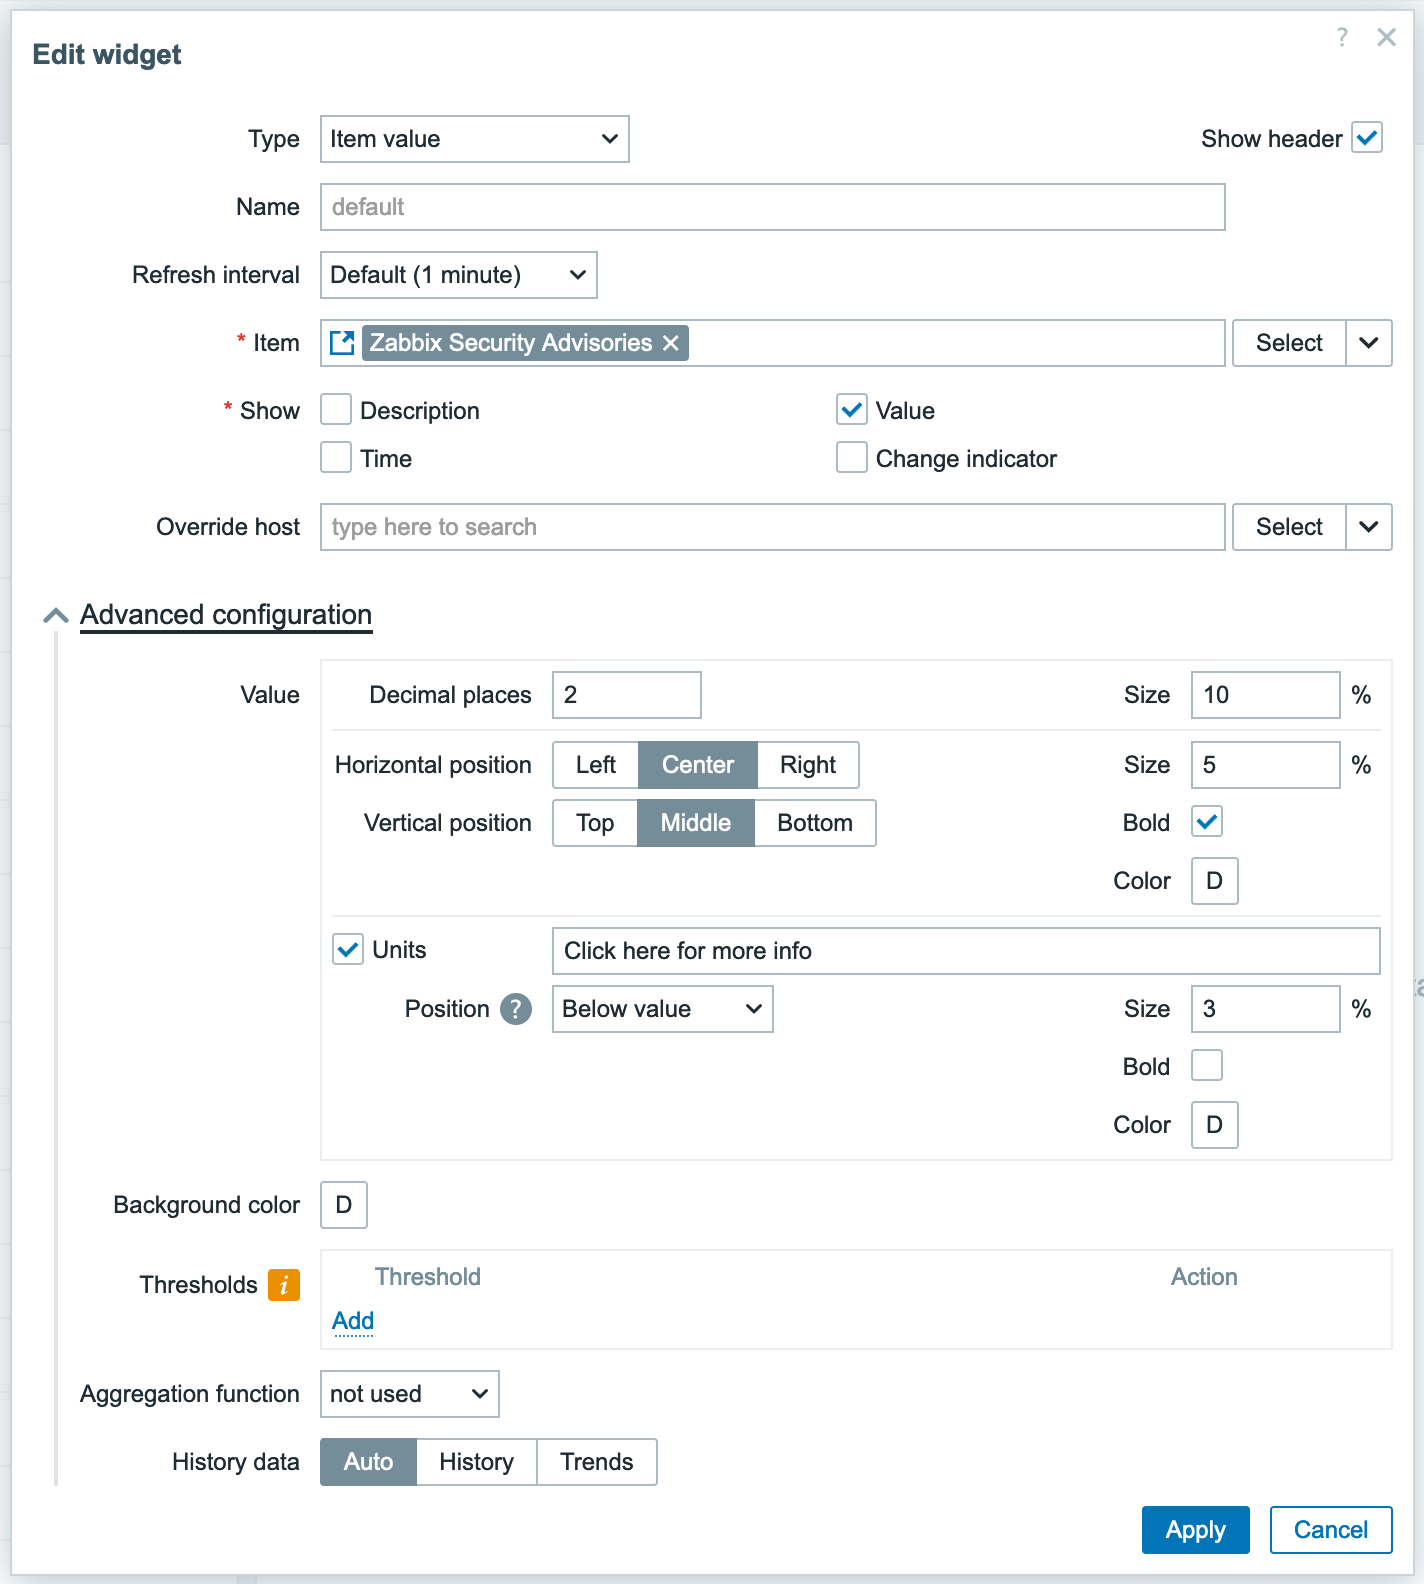
Step 6: Display data on the dashboard
To visualize the monitored data, we can use the Item History widget on a Zabbix dashboard to show both the latest security advisories and the corresponding screenshot, for example.
Conclusion
The Browser Item feature in Zabbix 7.0 elevates website monitoring beyond simple availability checks. It enables comprehensive monitoring of website changes, unlocking a variety of use cases such as tracking release notes, security advisories, competitor activity, and more.
If you’re interested in implementing this capability, feel free to contact us. Bangunindo is a Zabbix Premium Partner in Indonesia, ready to help you design, implement, and optimize your Zabbix monitoring solution to fit your specific needs.
Did you realize that you can monitor a Starlink dish using just Zabbix? The idea (or rather the need) to use Starlink came to me almost as soon as I moved to a fairly rural area. Local internet providers have not yet “provided” fiberoptic or stable mobile connectivity to places like this, and while searching for a solution I accidentally discovered that Starlink was already providing service to some local companies. As I later found out, they also offered service in my area for residential customers.
To make a long story short, since internet access is crucial in the IT field, I decided to acquire and then monitor my very own Starlink dish. At first, this proved challenging because regular user data access is quite limited. However, thanks to Zabbix browser monitoring, I managed to solve it fairly easily. In this post I will share my solution with you, including the template.
Table of Contents
Monitoring configuration
First, you need to make sure you have Zabbix installed (either a Zabbix proxy or server) on the same network that the Starlink dish and router are on. The next step is to configure Zabbix for browser monitoring.
Port 4444 will be the port on which the WebDriver will be listening, and port 7900 will be used by NoVNC, which allows us to observe browser behavior in case a browser with a GUI is used.
Zabbix server/proxy configuration
After WebDriver is installed, we need to set up the communication between Zabbix and the driver. This can be done by editing the Zabbix server/proxy configuration file and updating the following parameters:
### Option: WebDriverURL
# WebDriver interface HTTP[S] URL. For example http://localhost:4444 used with
# Selenium WebDriver standalone server.
#
# WebDriverURL=
WebDriverURL=http://localhost:4444
### Option: StartBrowserPollers
# Number of pre-forked instances of browser item pollers.
#
# Range: 0-1000
# StartBrowserPollers=1
StartBrowserPollers=5
With the configuration parameters in place, restart the Zabbix server/proxy to apply the changes:
systemctl restart zabbix-server
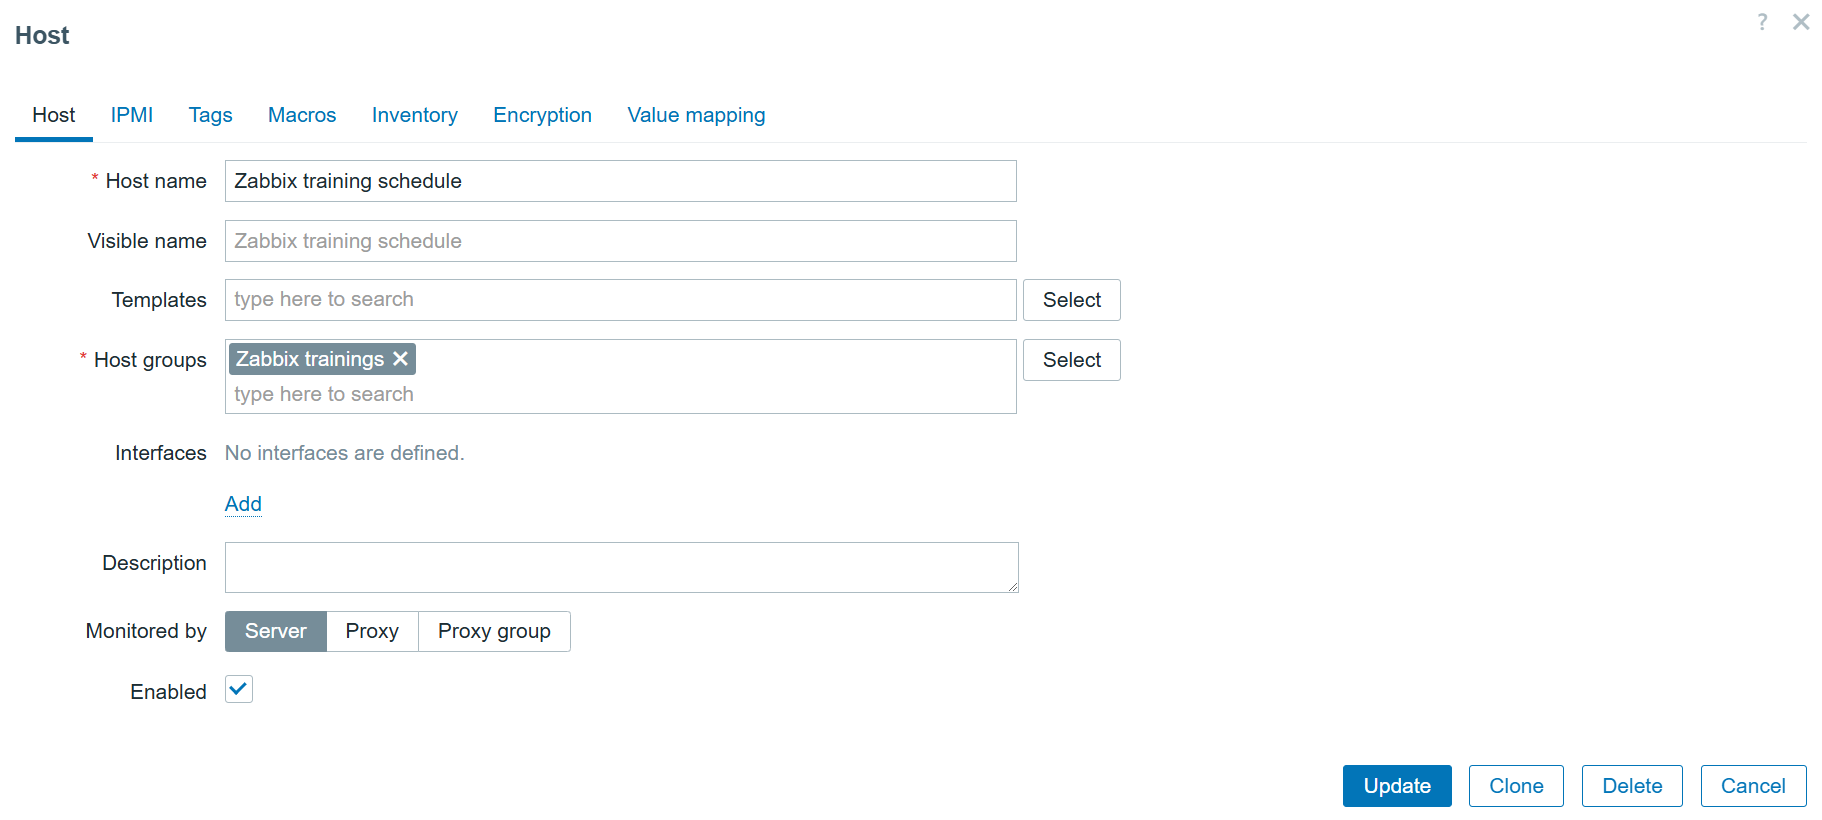
Creating a host
First, we need to navigate to the “Data collection” > “Hosts” section and create a host that represents our Starlink dish. The host in my example will look like this:
Starlink dish host
The host also has a user macro:
{$LINK} with value: http://webapp.starlink.com to point to the correct Starlink dish web app:
Link macro
Creating a browser item
We will now configure our browser item to collect and monitor the list of metrics exposed in the Starlink browser app:
Starlink browser item
We are using the bare minimum here, so make sure the update intervals are as frequent as you need. However, I would not recommend updating it more frequently than every 5 minutes. It’s also not a good idea to store the history, since it is already stored trough dependent items.
The most important part of the item is the script itself:
var browser, result;
var opts = Browser.chromeOptions();

opts.capabilities.alwaysMatch['goog:chromeOptions'].args = [];
browser = new Browser(opts);
browser.setScreenSize(Number(1980), Number(1020));

try {
    var params = JSON.parse(value);
    browser.navigate(params.url);

 // Wait for the dish to report status
    Zabbix.sleep(2000);

    // Find the JSON text element(s)
    var jsonElements = browser.findElements("xpath", "//div[@id='root']/div[@class='App']/div[@class='Main']/div[2]/div[@class='Section'][2]/pre[@class='Json-Format']/div[@class='Json-Text']");
    var extractedData = [];

    for (var i = 0; i < jsonElements.length; i++) {
        var text = jsonElements[i].getText();

        // Try parsing JSON
        try {
            extractedData.push(JSON.parse(text));
        } catch (e) {
            // If not valid JSON, include raw text instead
            extractedData.push({ raw: text, error: "Invalid JSON format" });
        }
    }

    // Collect result
    result = browser.getResult();

    // Replace with parsed JSON data
    result.extractedJsonData = extractedData.length === 1 ? extractedData[0] : extractedData;

}
catch (err) {
    if (!(err instanceof BrowserError)) {
        browser.setError(err.message);
    }
    result = browser.getResult();
}
finally {
    // Return a clean JSON object
    return JSON.stringify(result.extractedJsonData);
}
So what does this script do? It opens the Starlink web app, waits for the Starlink dish to output all the status data, and, after a bit of parsing, returns the data highlighted in the screenshot:
Starlink dish diagnostic data
Now we can click on the three dots on the left of our newly created item in the items page and proceed to create dependent items for each value we are interested in!
Creating dependent items
Now we just click here:
As an example, to create an item that monitors the hardware version we can create an item like this:
Hardware version dependent item
With JSONPath preprocessing:
Hardware version item preprocessing
In the end we get the data in Zabbix:
Starlink dish hardware version
All other items (except alerts) will follow the same logic – just update the item name, key, and JSONPath in preprocessing to extract the required values.
Creating dependent LLD item prototypes
To automate the alerts items creation, we can create a dependent discovery rule. In the “Discovery” section, create a new discovery rule:
Starlink dish alerts discovery
With preprocessing using Java Script:
var data = JSON.parse(value);
var alerts = data.alerts;
var lld = [];

for (var key in alerts) {
    if (alerts.hasOwnProperty(key)) {
        lld.push({
            "{#ALERT}": key
        });
    }
}

return JSON.stringify({ data: lld });
All that’s left ‘to do is to create a dependent item prototype:
Starlink dish alert prototype
With preprocessing, of course:
JSONPath will transform to extract each specific alert and “Boolean to Decimal” will save us some space in the database by tranforming true/false booleans to digits.
Result
In the end, we can monitor all the data:
Starlink dish latest data
Even more data can be collected using exporters – if you are willing to do a bit of extra configuration, of course! Let me know if you are interested, and I will show you a completely different approach with a template.
Before I forget, the template used in this tutorial can be found here.
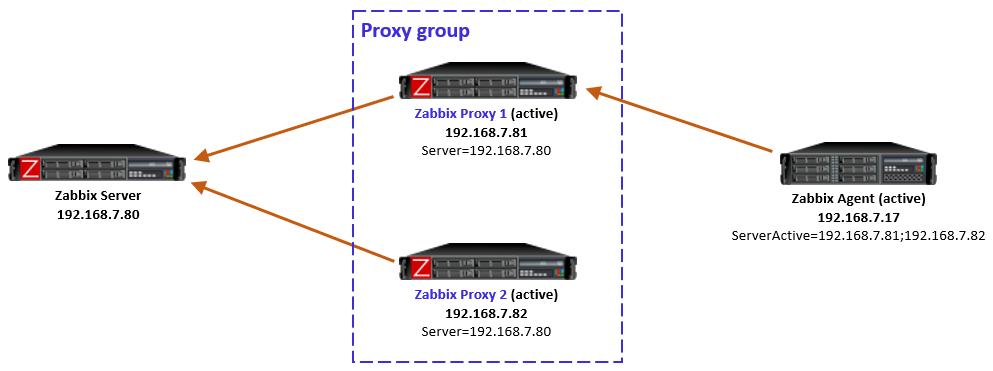
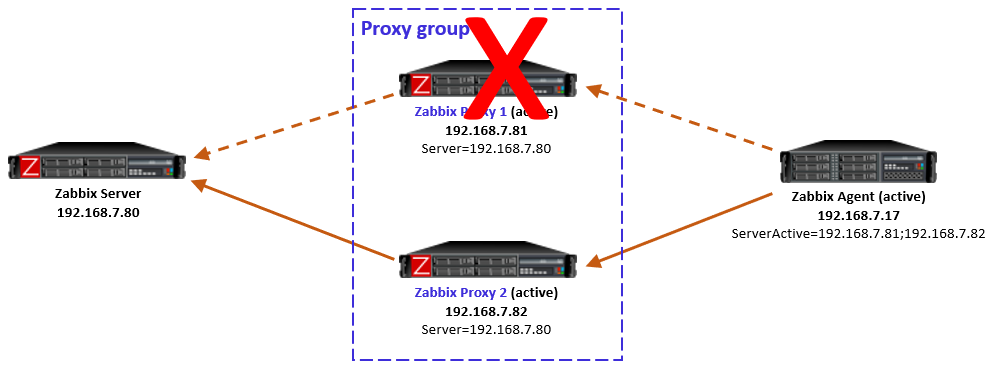
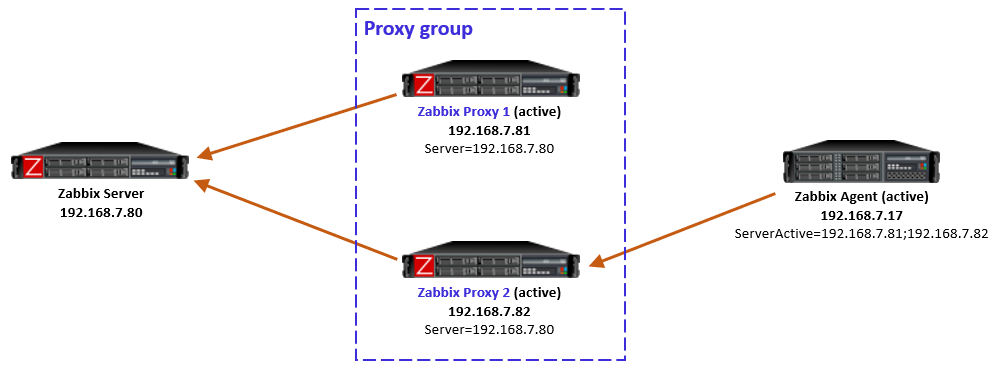
The new Zabbix proxy groups provide us with a method to provide both redundancy and load balancing in our Zabbix proxy setups. However, one major limitation arises when we want to use SNMP traps with these new proxy groups – it isn’t natively supported at the moment. One of our customers asked me to find a solution to that problem, so here’s how I went about it.
Getting to grips with the problem
As mentioned, many of us are now facing a problem. Either we use proxy groups and we don’t use SNMP traps, or we use proxy groups and move SNMP traps to a single proxy. Unfortunately, this is unacceptable for many environments where SNMP traps might be an essential part of monitoring. The problem, however, stems from how snmptrapd works in combination with Zabbix reading the trapper file. Improvements have already been made to provide for more room when creating our own solutions like this.
Other Zabbix users have also been proposing solutions and I’m sure Zabbix is looking into improvements. Here’s an example case to vote on.
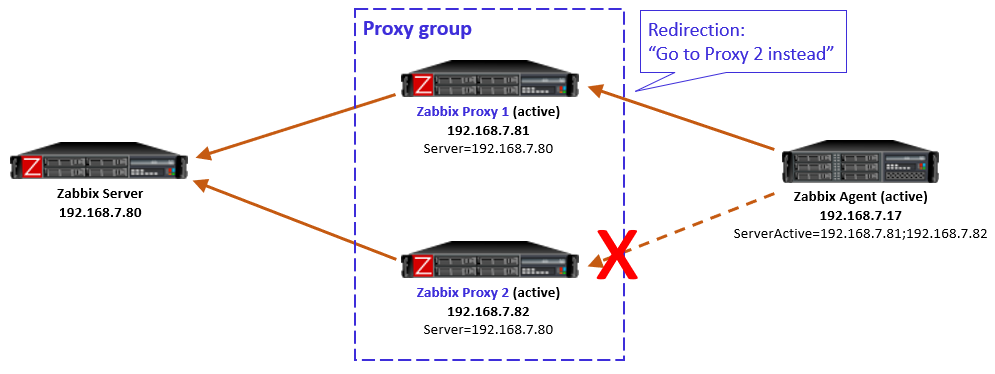
However, that doesn’t solve many of our issues now. The problem starts when we are sending SNMP traps to a single proxy (Proxy 1 for example) and a Zabbix host (let’s say Zabbix host 2) is assigned to another proxy in the proxy group (Proxy 2 for example). In this situation, the trap is coming in on an incorrect monitoring proxy and Zabbix won’t be able to read the trap. It will simply not add it to the Zabbix database and ignore it.
The solution here is simple – we can configure our monitoring target like a switch or a router to send the SNMP trap to multiple sources. However, this will cause our trap to be sent over the network multiple times, increasing the load on our network. This is acceptable for smaller setups, but we were dealing with a setup that is sending hundreds of traps every second.
Finding a solution
With the problem laid out for us, we came up with a simple duplication setup that included these requirements:
Simple and easy to maintain/troubleshoot
Traps could only be sent over the network once
Works fast between failovers
Works with both redundancy and load balancing
Minimal extra packages
No easily corruptible shared file systems
What we came up with in the end is visible in the image below:
It’s a simple setup that requires us to install 2 extra packages and a container.
First, we added a VIP to our proxy setup using keepalived, to provide our monitoring targets with a single SNMP trap destination. The VIP will be available on one proxy at the time, regardless of whether there are 2, 10 or more proxies in the proxy group. Our switches, routers, or any other SNMP trap host can now be configured to send traps to this VIP.
Second, we needed a way to duplicate our traps. Since only one proxy is going to be receiving traps, the other proxies still need to be able to receive the traps. Without the duplication and the VIP being present on Proxy 1, Zabbix host 2 still would not receive its trap. We installed Docker and created a tiny, lightweight container on our hosts to duplicate the SNMP trap from one proxy to all other proxies in the group. Admittedly this does slightly go against requirement number 2, as we are now sending the trap over the network between proxies. This is, however, all within our own more localized infrastructure instead of over a longer network.
That’s it! Whenever Proxy 1 receives a trap, it will now duplicate it to Proxy 2. The proxy with the host being monitoring will parse the trap correctly to Zabbix and the other proxies will ignore the trap. Even if the proxy restarts, fails over, or suddenly goes down, it will not read the trap twice.
The only thing to keep in mind is that it can take some time for keepalived to fail over the VIP. With SNMP traps being UDP-based, this means that any traps sent to the VIP while snmptrapd is down won’t be parsed. However, it’s definitely better to lose some in case of failover, than to lose all upon outage!
Authorization in Amazon Web Services (AWS) determines what actions a user, service, or system can perform on resources. It answers the question: “Does this identity have permission to do this action on that resource?”
In AWS, authorization is primarily handled through:
IAM (Identity and Access Management) policies
Resource-based policies (like S3 bucket policies)
Session-based permissions (like STS AssumeRole)
What authorization types are available in Zabbix AWS templates?
Access key authorization
Role-based authorization
Assume role authorization
Let’s look briefly at each of them.
Table of Contents
Before using the template, you need to create an IAM policy that grants the necessary permissions for the AWS services the template will interact with.
This policy defines what actions are allowed, on which resources, and optionally, under which conditions. Once created, the policy should be attached to the IAM role or user that will run the template.
IAM policy for Zabbix
Add the following required permissions to your Zabbix IAM policy in order to collect metrics. The policy can change when new metrics and services are added in Zabbix templates.
An error occurred (AccessDenied) when calling the DescribeInstances operation: User: arn:aws:iam::123456789010:user/zabbix_user is not authorized to perform: ec2:DescribeInstances on resource: arn:aws:ec2:eu-central-1:123456789010:instance/*
…you need to check the following permission to the role you are using (IAM Policy for Zabbix).
5. Set the following macros in Zabbix:
{$AWS.AUTH_TYPE} – set to access_key
{$AWS.ACCESS.KEY.ID} – set to your access key ID
{$AWS.SECRET.ACCESS.KEY} – set to your secret access key
Security tips
Never hardcode access keys in scripts or code.
Store them in ~/.aws/credentials, which is protected by file system permissions.
Apply least privilege with IAM policies.
Role-based authorization
1. Add the appropriate permission to the role you are using:
With the release of Zabbix 7.4, Zabbix users will be able to further extend their existing resource discovery workflows and enjoy a wastly improved user experience when it comes to configuring Zabbix entities. In addition, the latest release introduces multiple dashboard and network map improvements which will further enhance the visualization of infrastructure and resources.
Table of Contents
Host Wizard
Host creation can be somewhat confusing for Zabbix beginners. Creating a host and applying a template involves numerous steps – from creating a host and assigning it to a host group, to configuring appropriate host interfaces, applying a template, and editing template-level macros to adjust the default problem thresholds and filters.
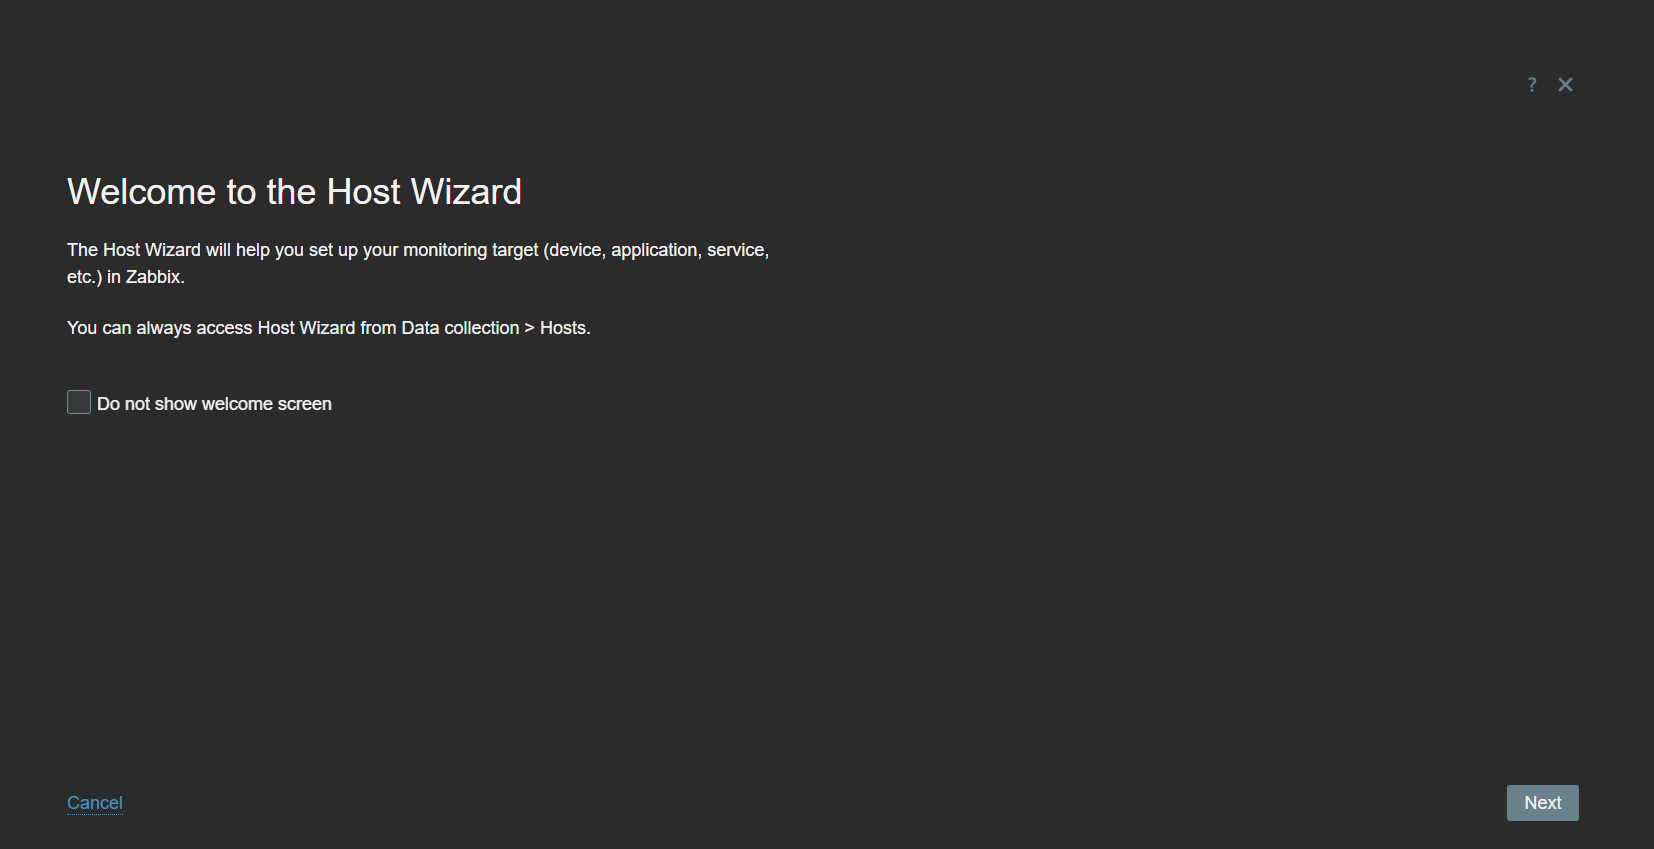
The Host Wizard aims to simplify the host onboarding process by providing a step-by-step guide for creating and configuring a host.
The Host Wizard can be opened from the Data Collection – Hosts section
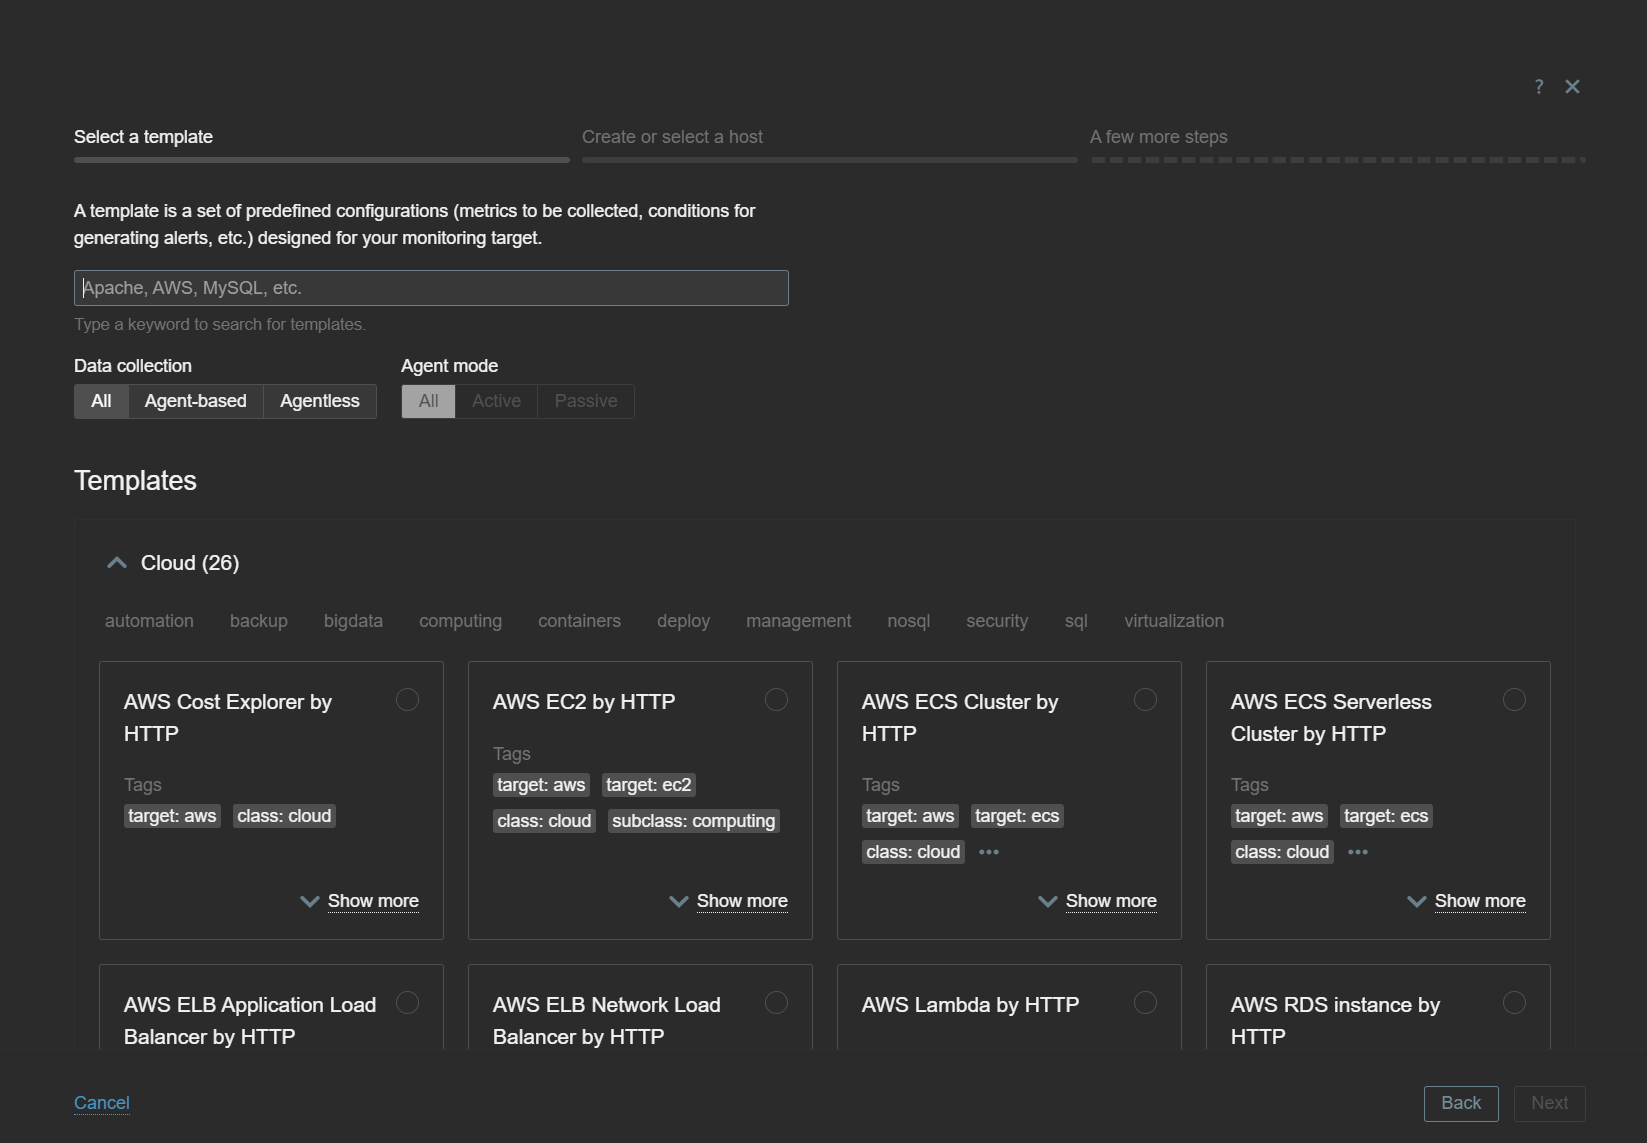
A new Host Wizard button has been added to the Data Collection – Hosts section. Once you click on it, you will first have to select the template you wish to apply on the new host. Only one template can be applied at a time, so if you wish to apply multiple templates on a single host via Host Wizard, you will have to do so via one template and one Host Wizard session at a time.
Under the hood, if we look at the template files, the templates have also received 2 new parameters: wizard_ready and readme. Only templates marked with wizard_ready: ‘YES’ can be selected in the Host Wizard.
Filter for and select the required template
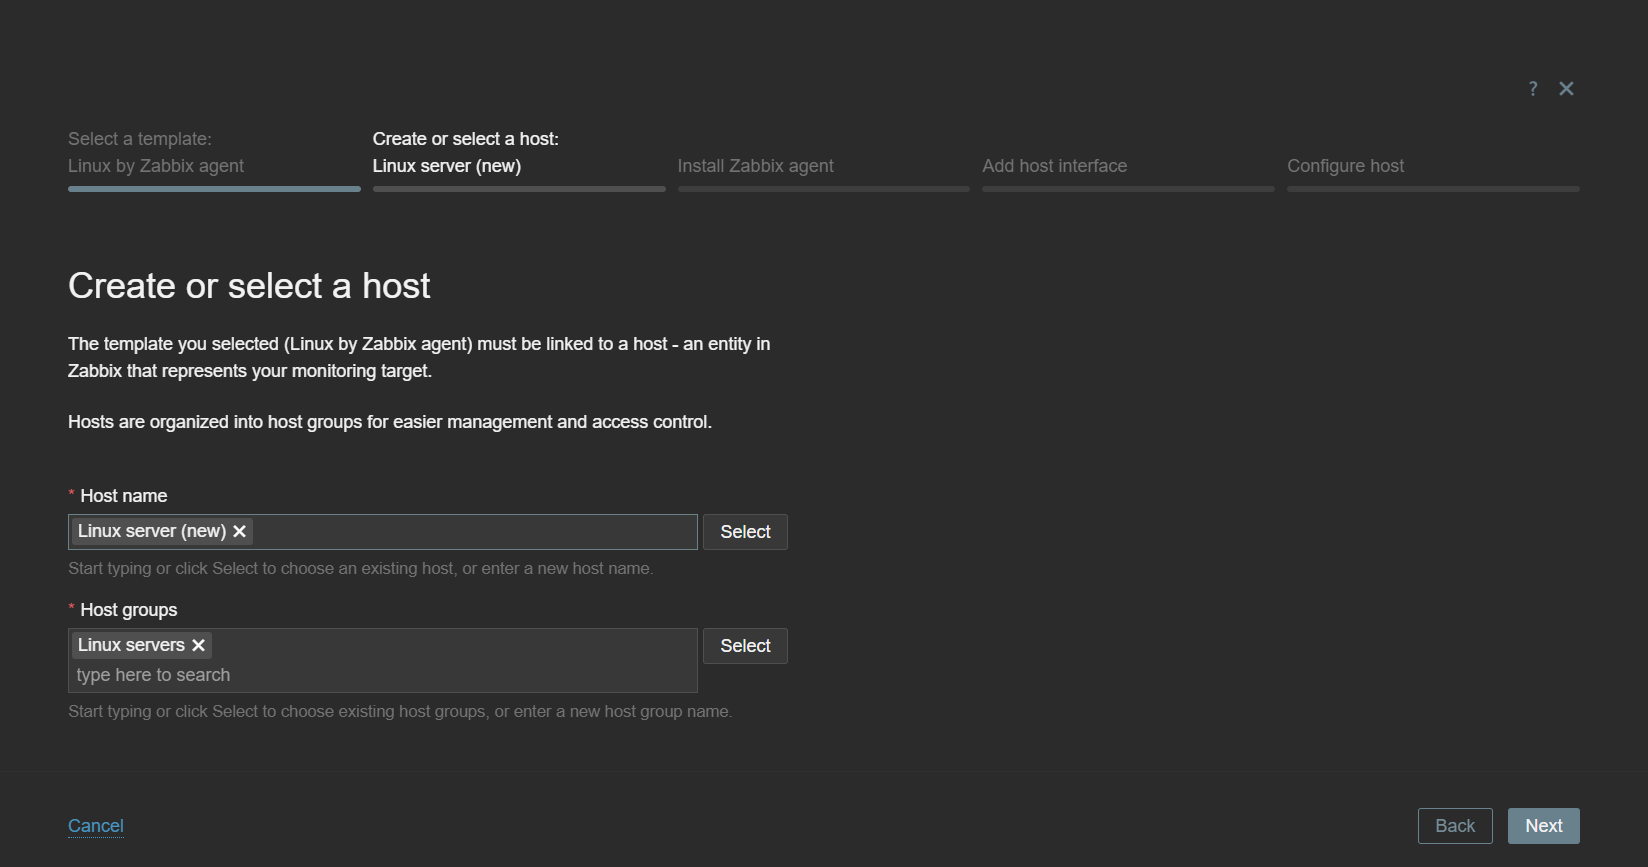
After you have selected the template, you will be prompted to enter a host name and select host groups. You can create a new host or apply the template on an existing host.
Provide a host name and select host groups
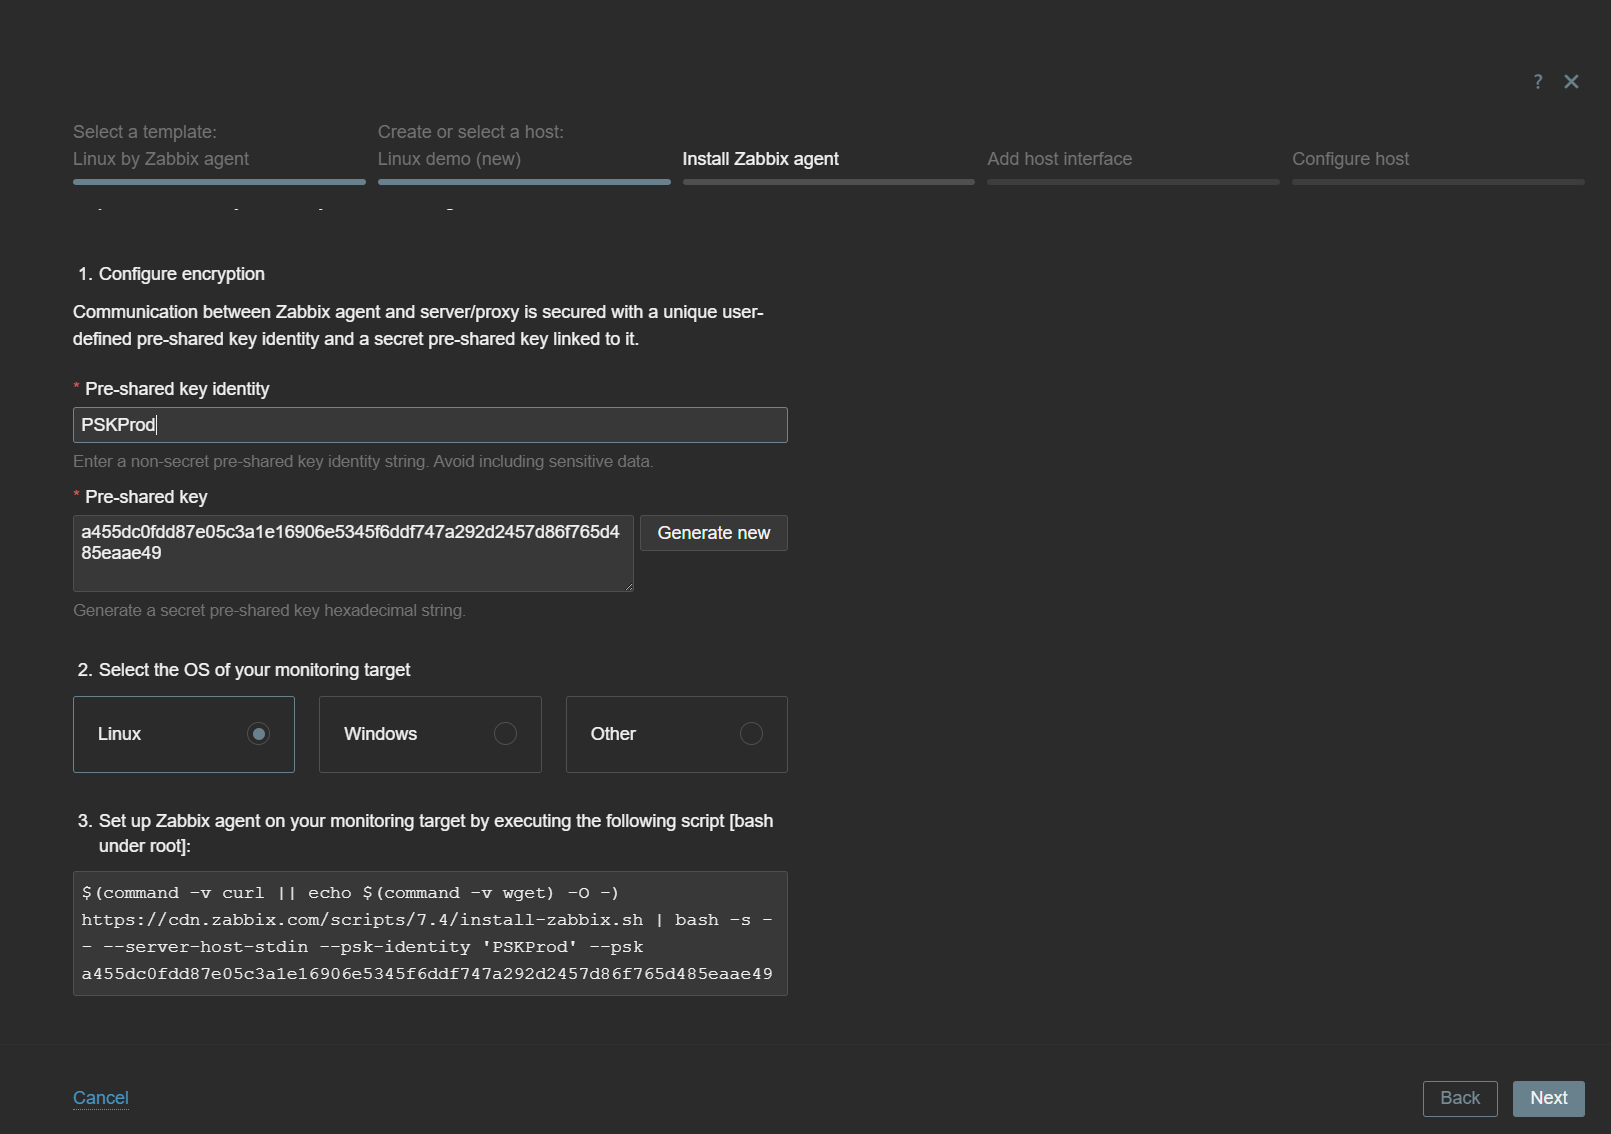
The next steps include the deployment instructions. Depending on the selected template type, the Host Wizard will provide all of the required instructions to start monitoring the host with the chosen template.
The Host Wizard will provide the required host configuration steps
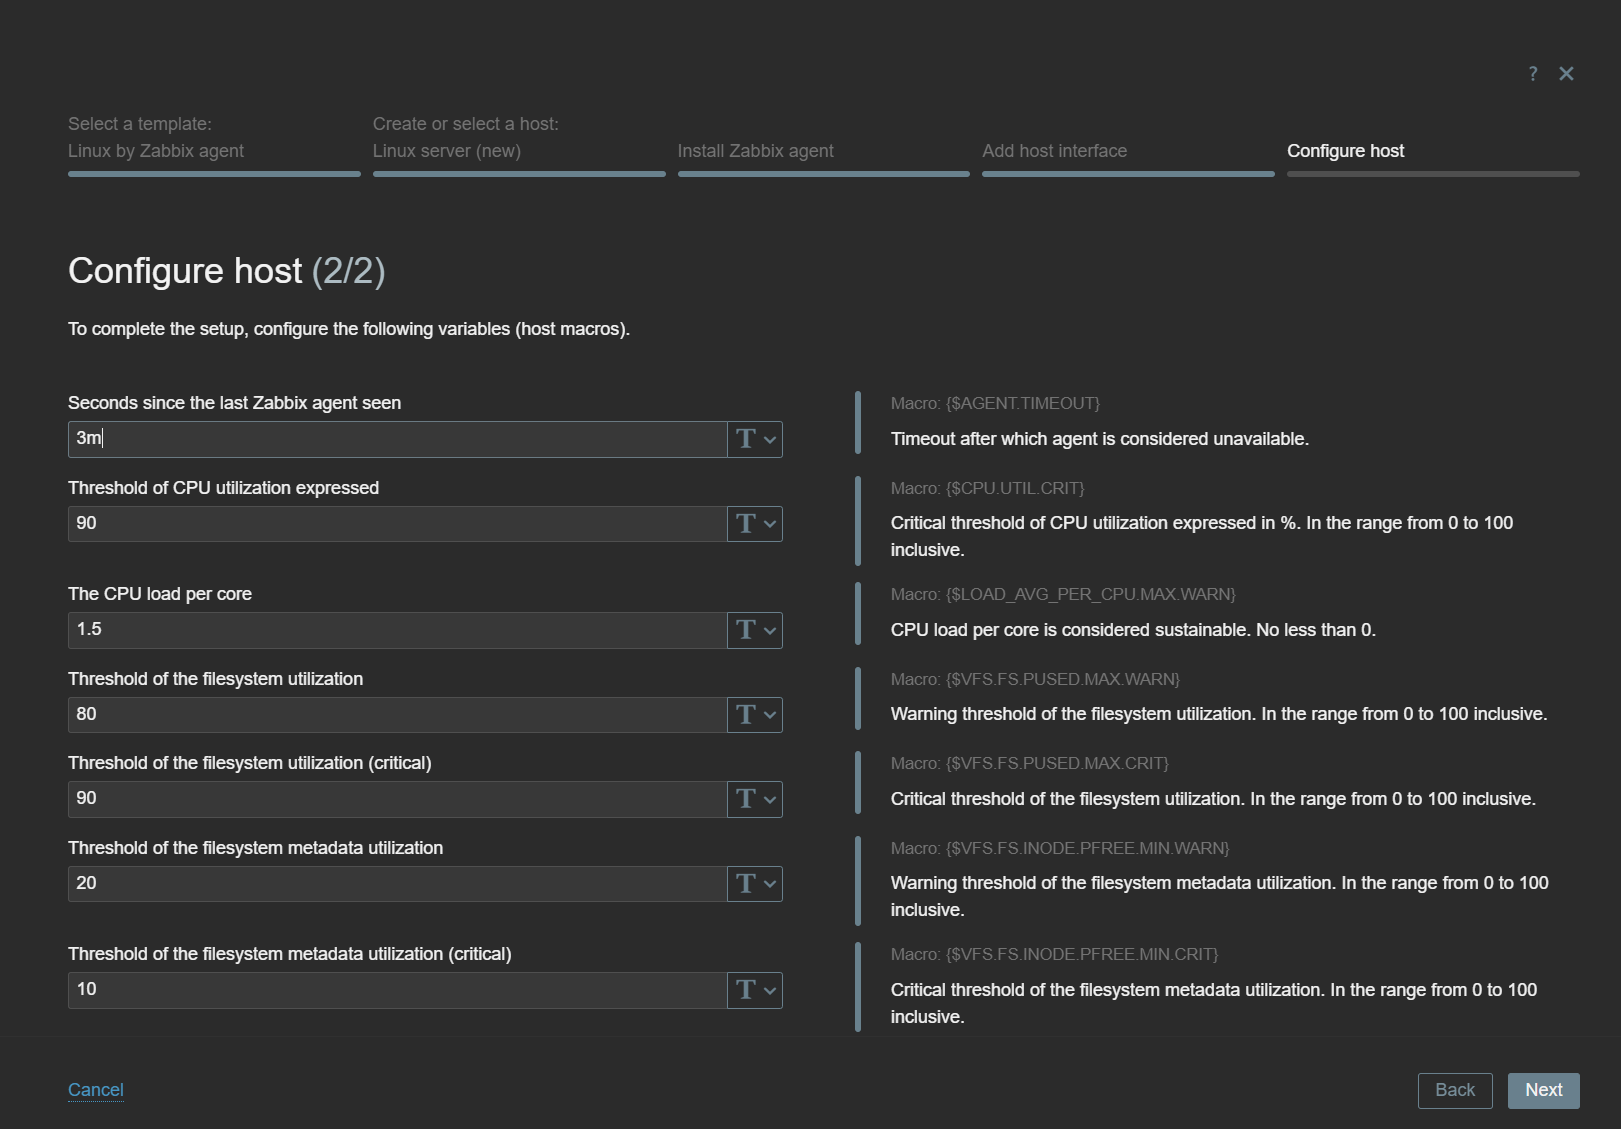
In the final Host Wizard steps, you will be prompted to add the required host interface, read the template notes, and customize the template-level macros.
Customize template-level macros to modify the default filters, problem thresholds, and other parameters
Nested low-level discovery rules and host prototypes
Low-level discovery rules have received major improvements in Zabbix 7.4. It is now possible to create nested low-level discovery rules, while host prototypes are now capable of discovering hosts of their own with low-level discovery.
A new type of prototype has been added to low-level discovery rules – discovery prototype. These prototypes are used together with low-level discovery macros to automatically create low-level discovery rules for resource discovery.
Discovery prototypes can now be created in low-level discovery rules
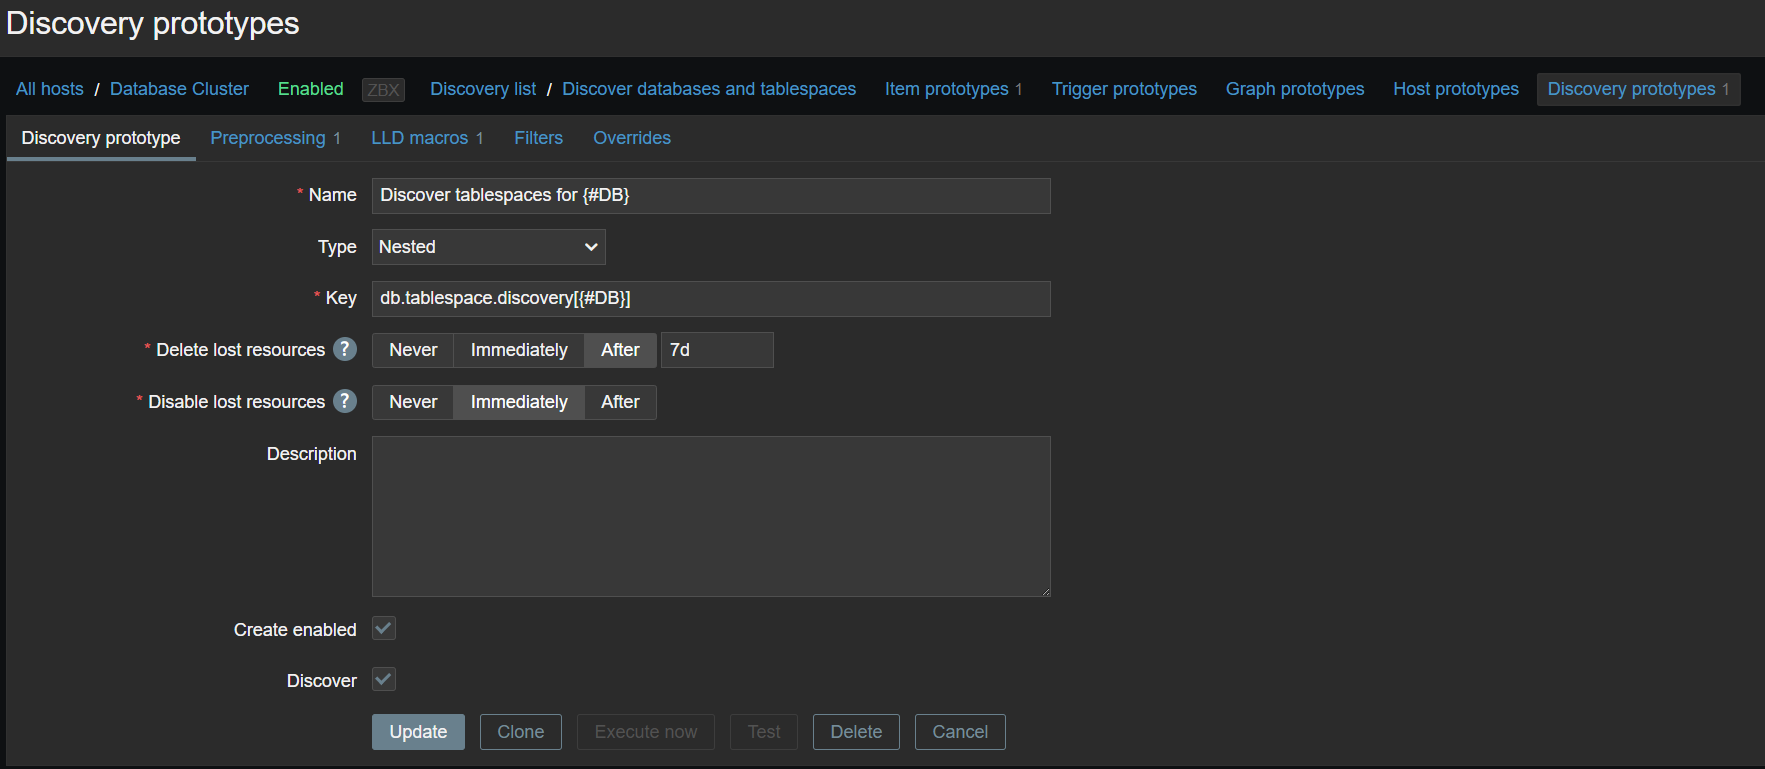
A new item type has been added for discovery rule prototypes – Nested. This type of discovery rule iterates through the JSON file received by the parent low-level discovery rule to discover child entities. For example:
If we set the jsonpath preprocessing in the discovery rule prototype to JSONPath=$.tablespaces and set the low-level discovery macro to {#TSNAME}=$.name, the nested low-level discovery rule will create discovery rules to discover tablespaces for each database.
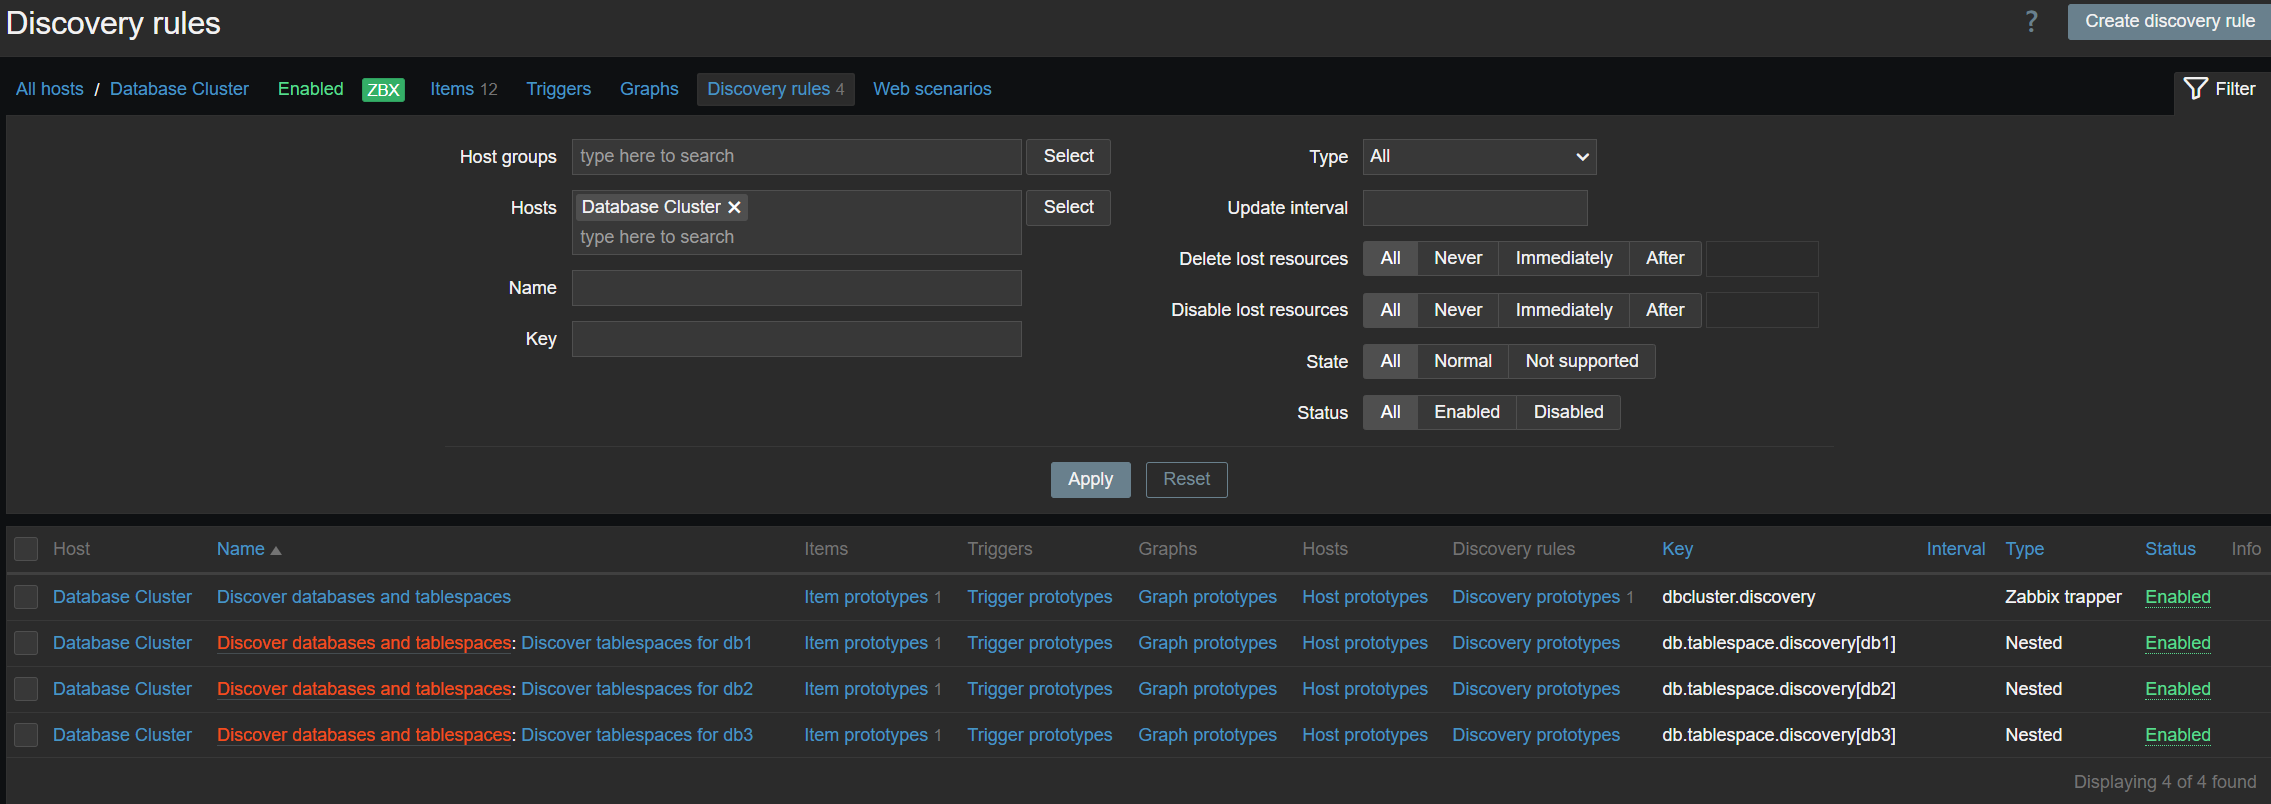
Low-level discovery rules are created from the discovery prototype
Inline form validation
Inline validation has been introduced with the goal of improving the overall user experience when configuring a variety of Zabbix entities. As of Zabbix 7.4, inline form validation is supported in:
Host configuration
Template configuration
Item configuration
Trigger configuration
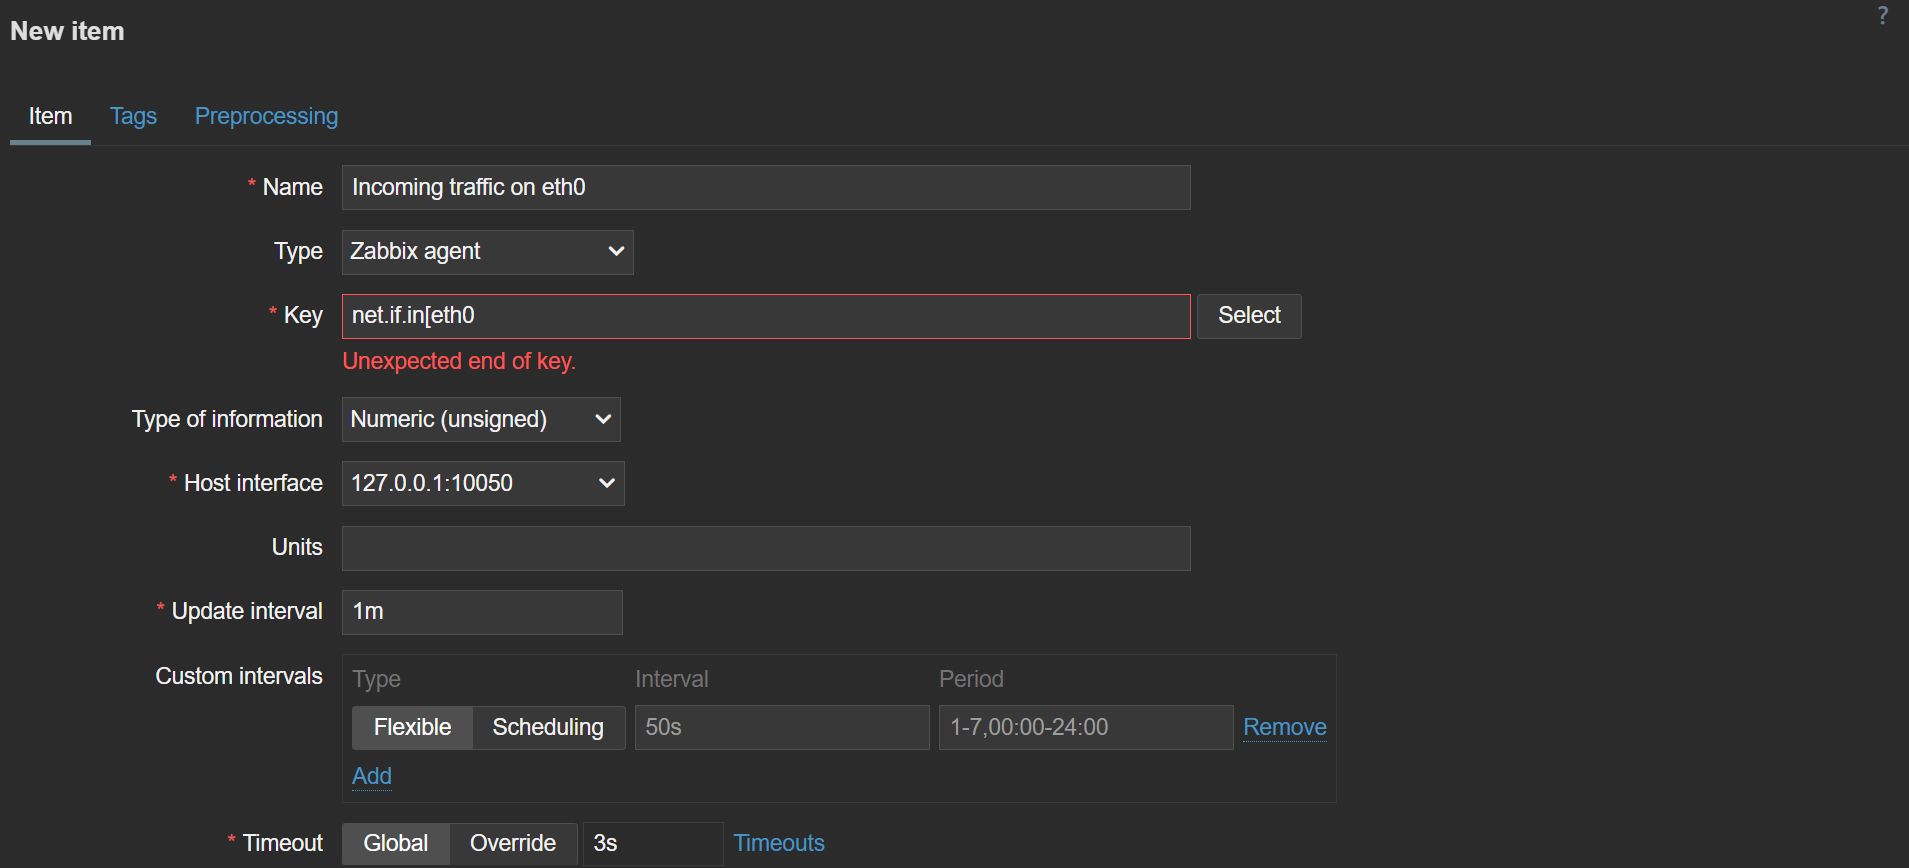
Inline validation detects any configuration errors on the fly and displays a corresponding error message
With inline validation in place, users will now receive immediate feedback regarding any configuration mistakes they have made in the sections above. Configuring new entities, especially items and triggers with complex keys and expressions, is now faster than ever.
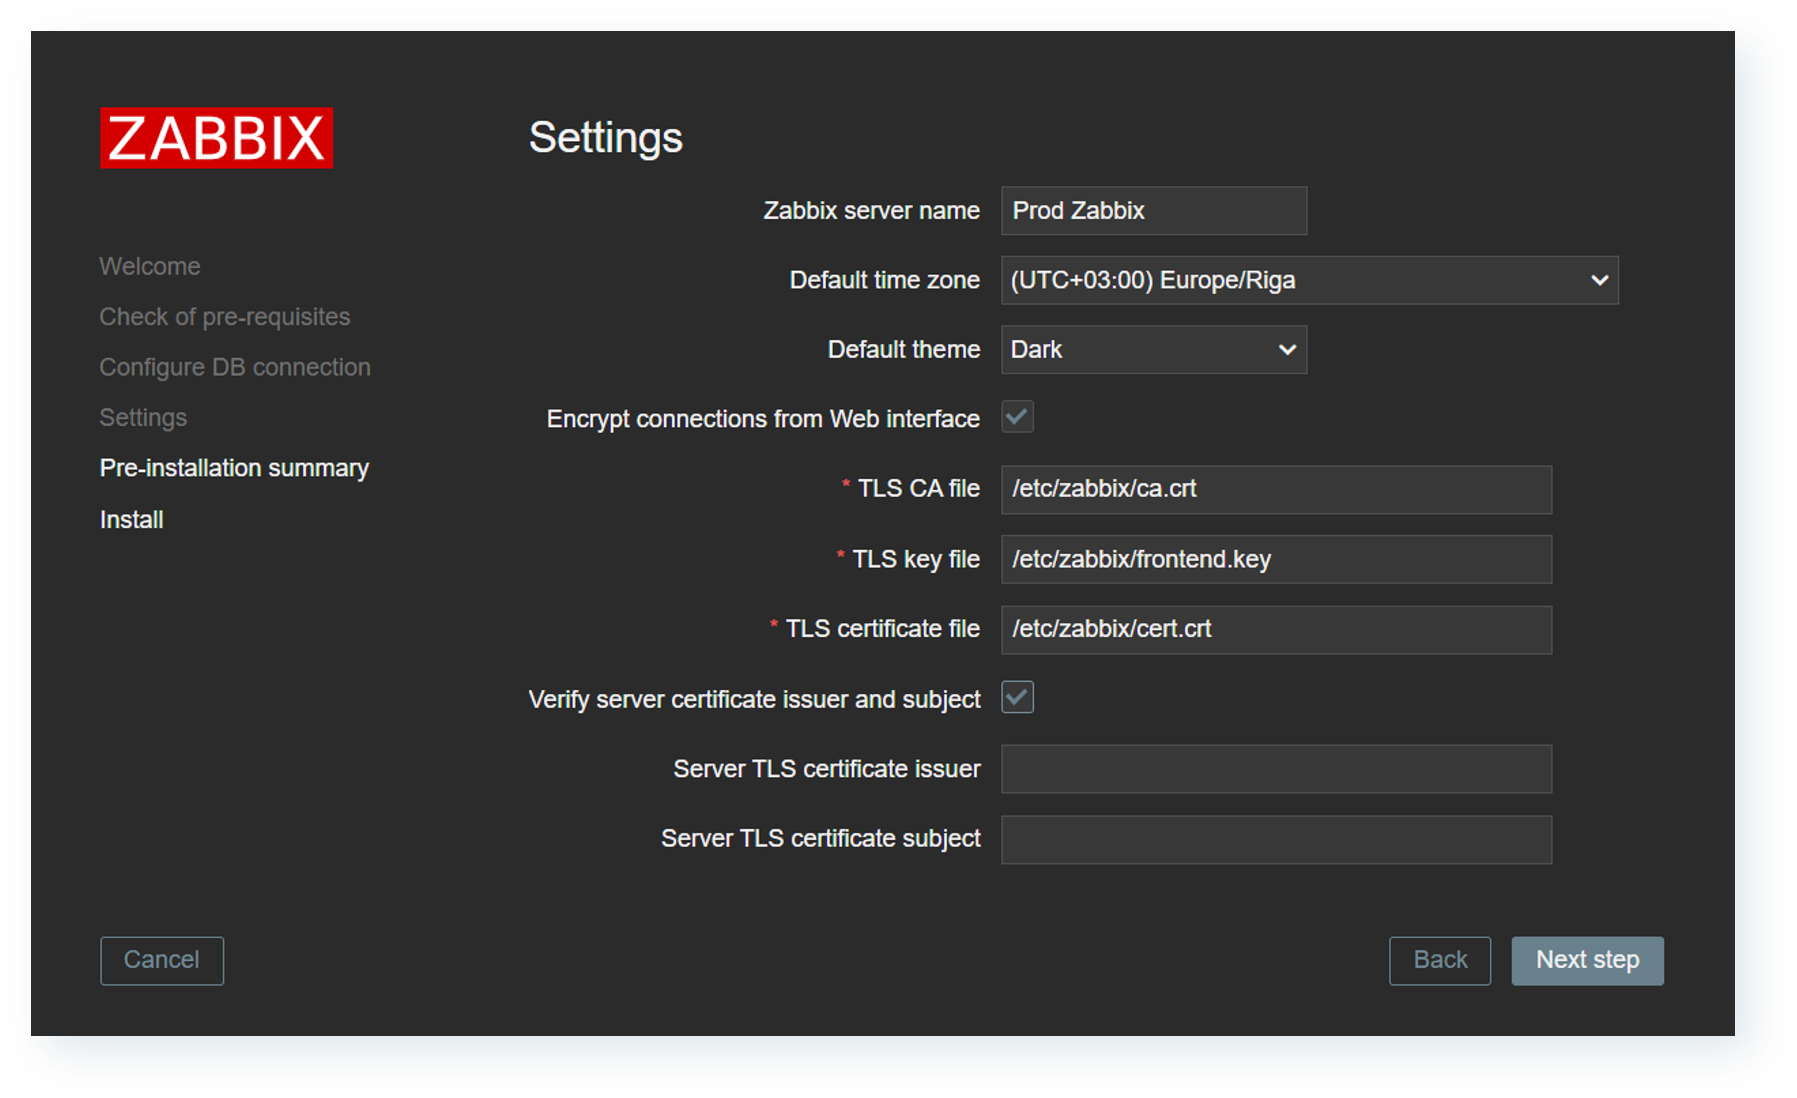
Frontend-to-server communication encryption
To further strengthen Zabbix communication flow security, Zabbix 7.4 introduces the ability to secure frontend to server communication with certificate encryption. The encryption must be configured from two sides, and the frontend setup now includes the options to enable and configure encrypted connections to the server.
Zabbix 7.4 introduces the ability to encrypt frontend-to-server connections
On the Zabbix server side, multiple new configuration parameters have been added:
TLSFrontendAccept – which incoming connections to accept from frontend
FrontendAllowedIP – frontend connections will be accepted only from addresses listed here if the parameter is set
New widgets and visualization improvements
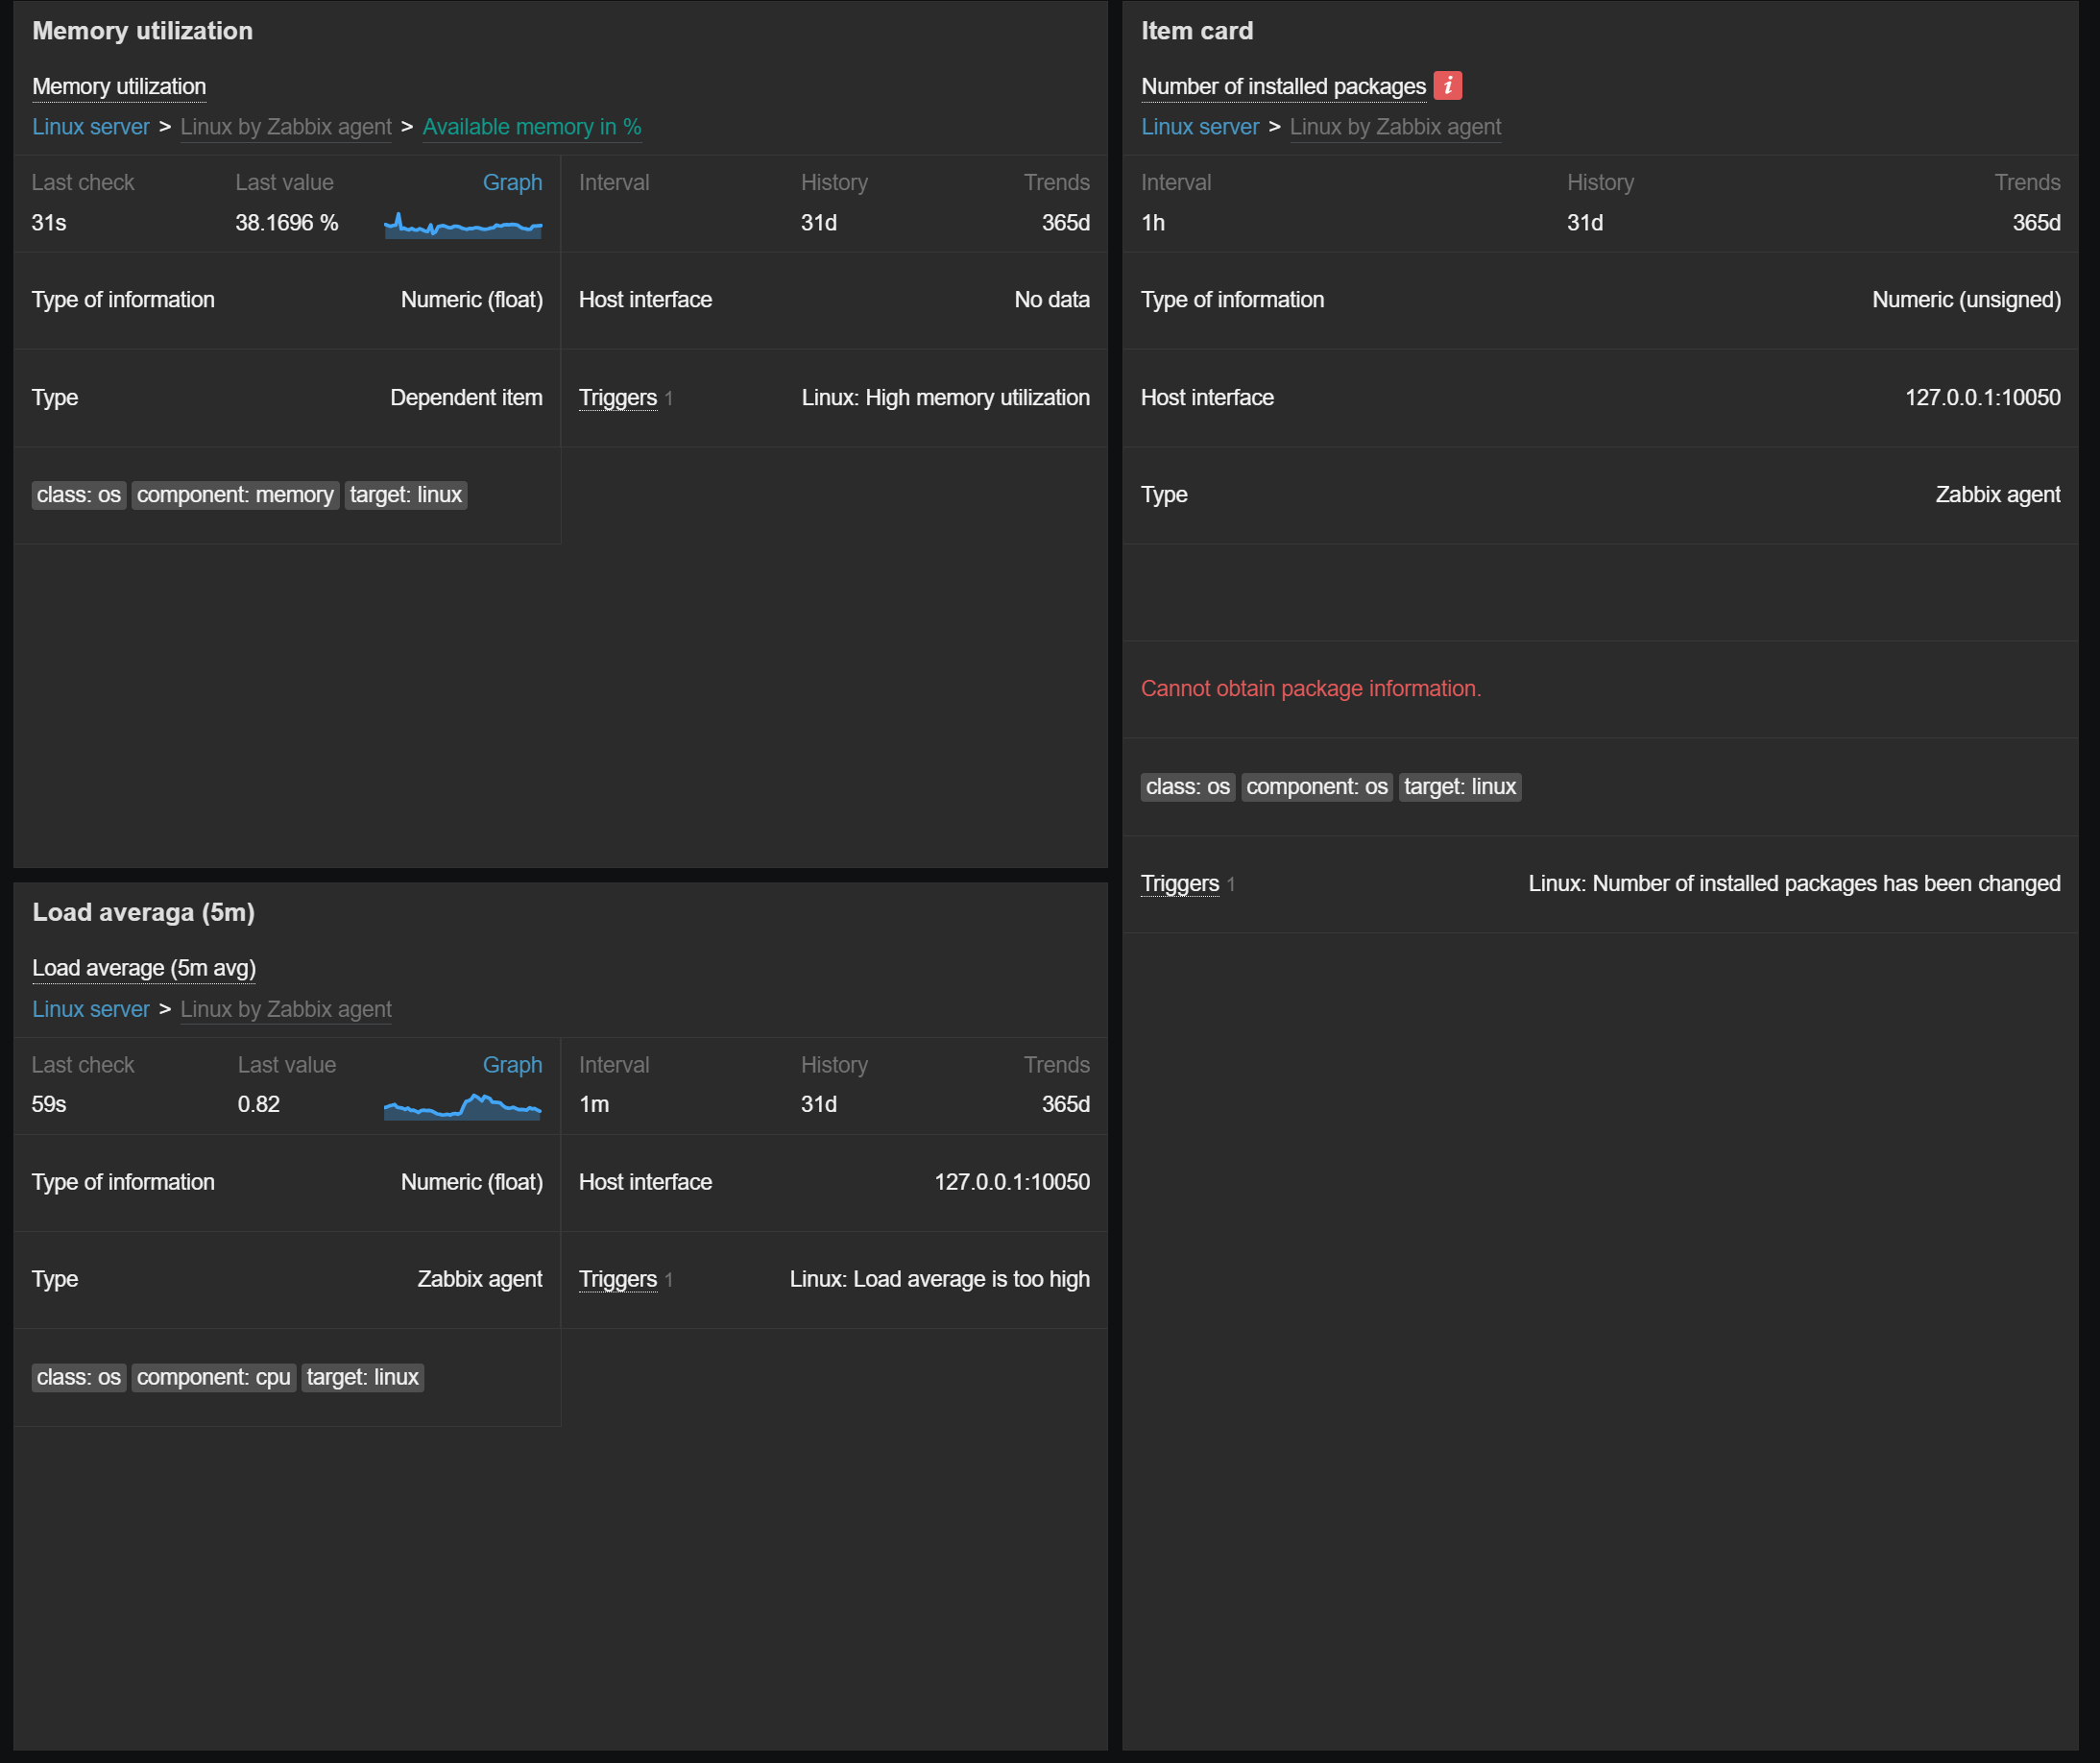
Zabbix 7.4 introduces a new widget (Item card) and multiple visualization improvements for dashboards and network maps.
Item card widget
The new Item card widget behaves similarly to the existing Host card widget introduced in Zabbix 7.2. The Item card widget provides a customizable view of an item and its attributes, such as latest data together with a sparkling chart, error messages, interfaces, tags, triggers, and more. The attributes for display can be selected and ordered in the widget configuration.
Various item attributes can be displayed in the item card widget
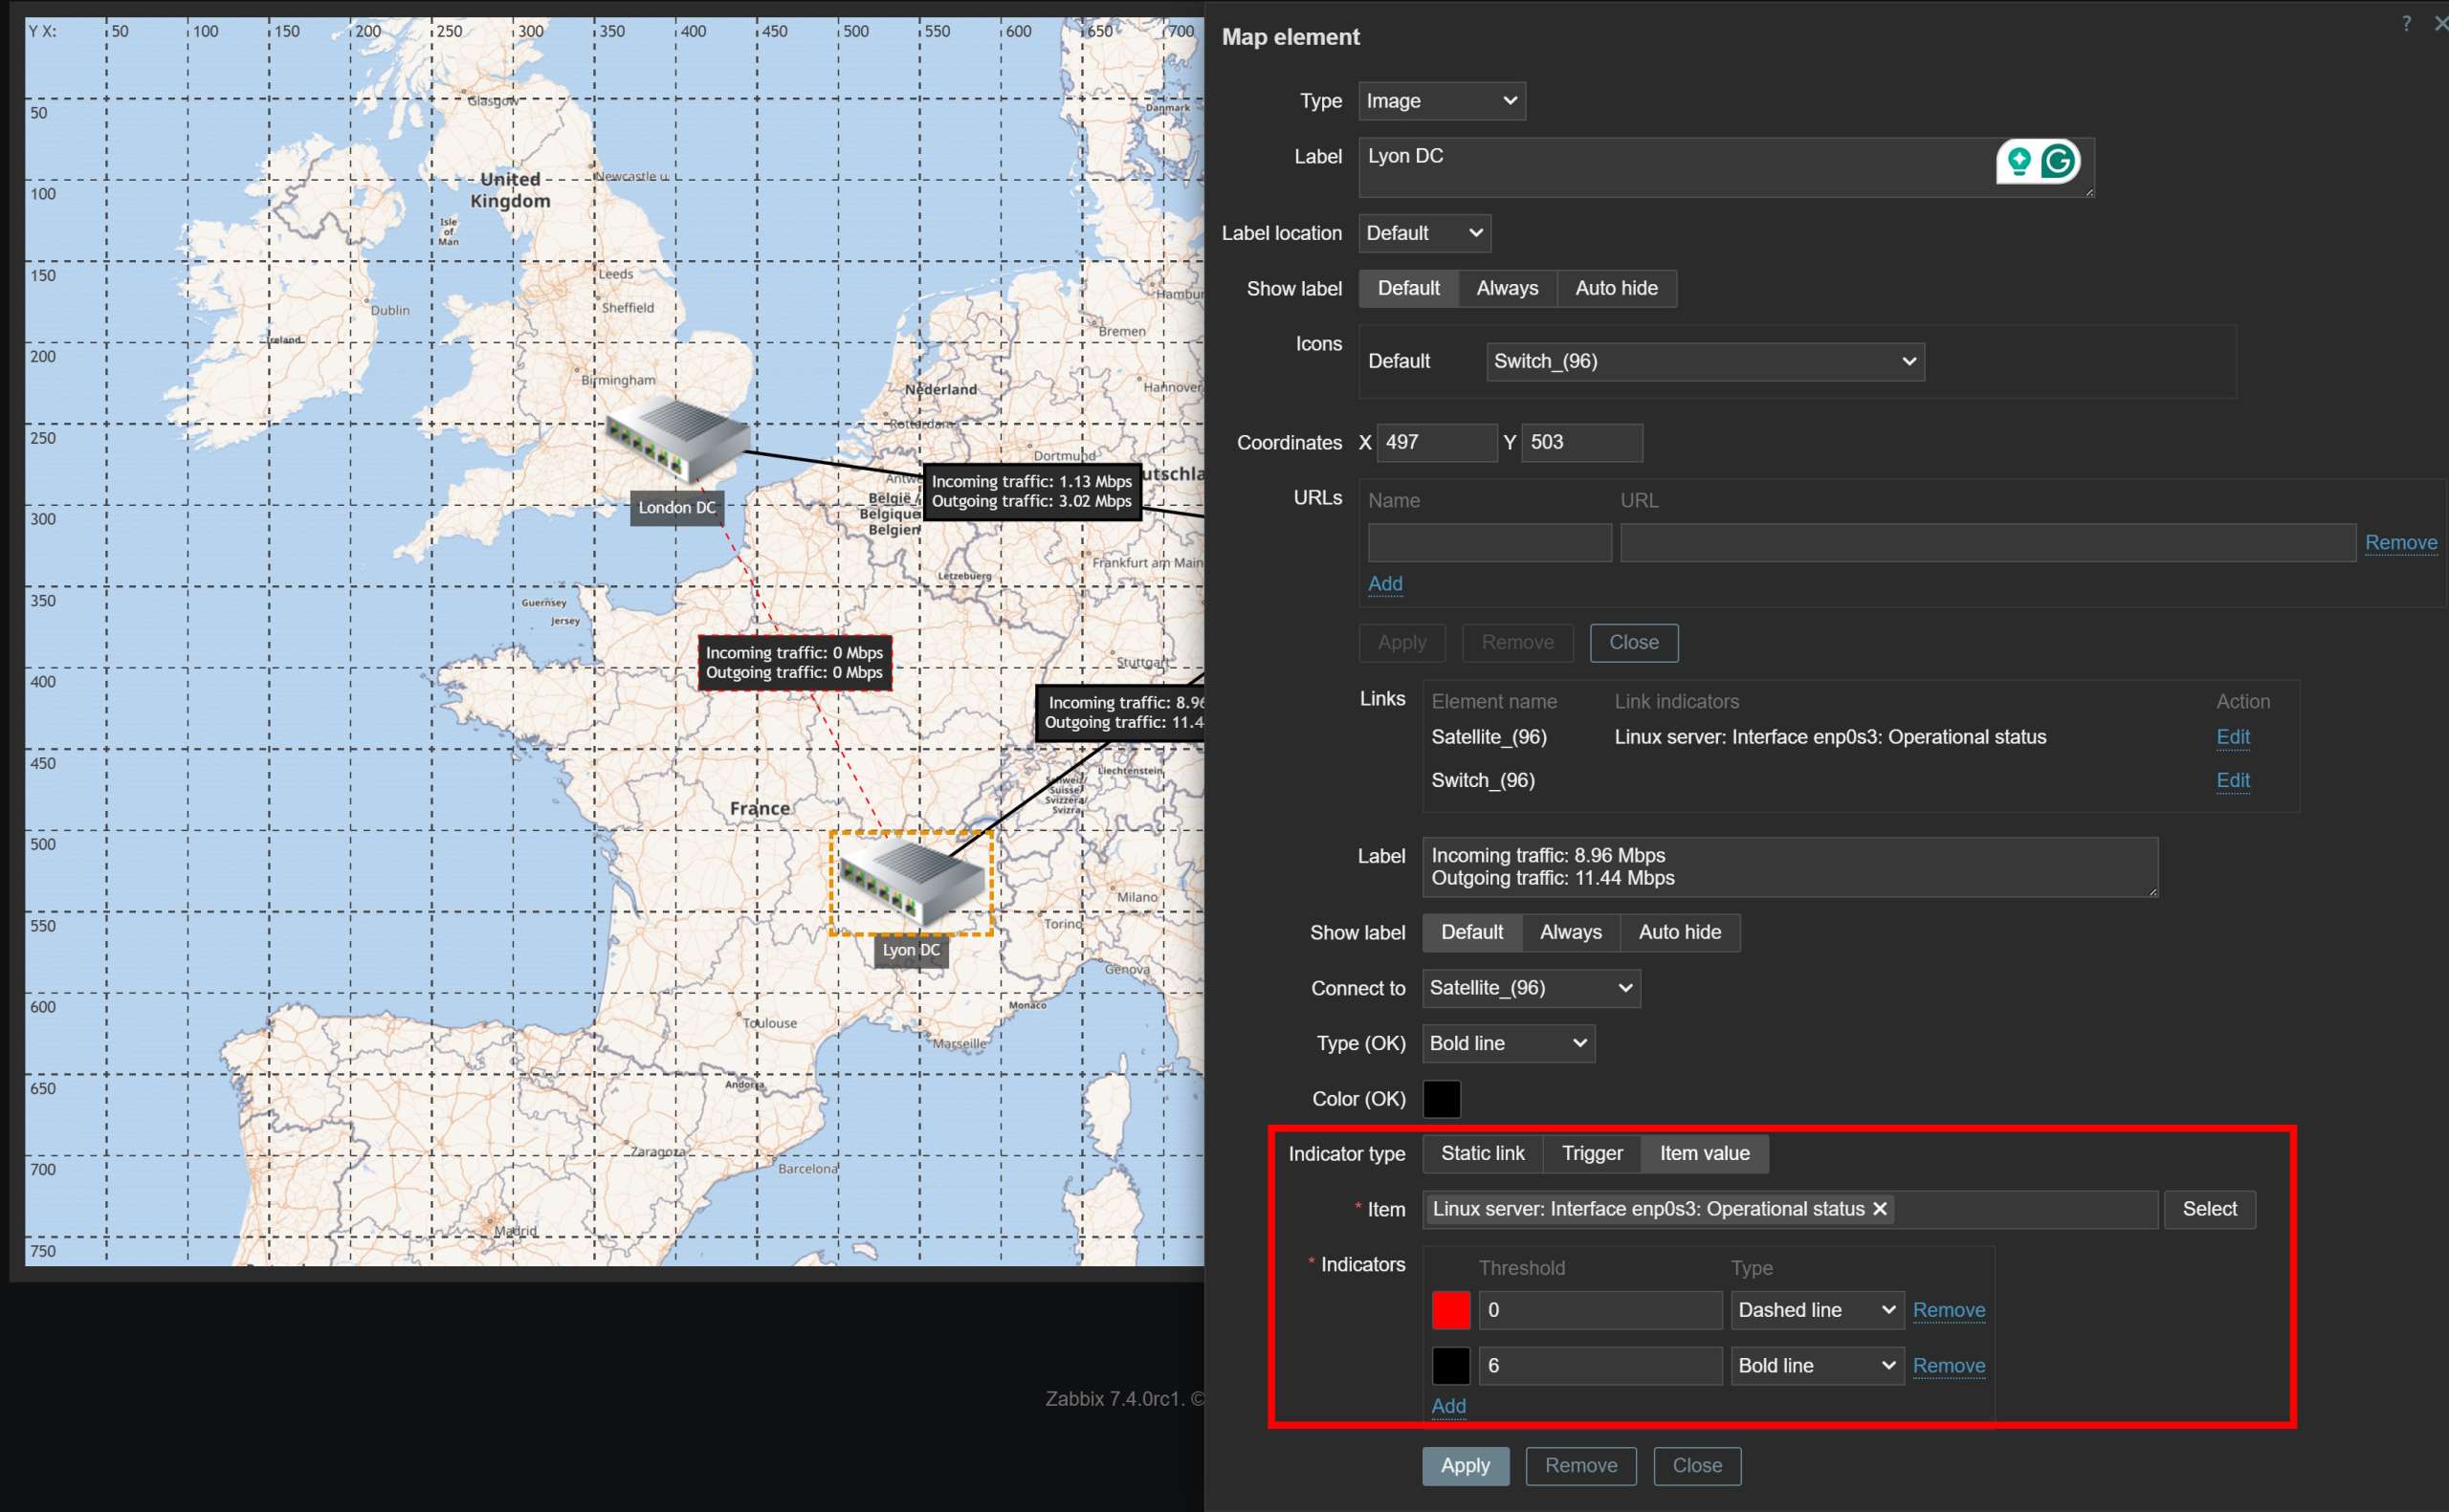
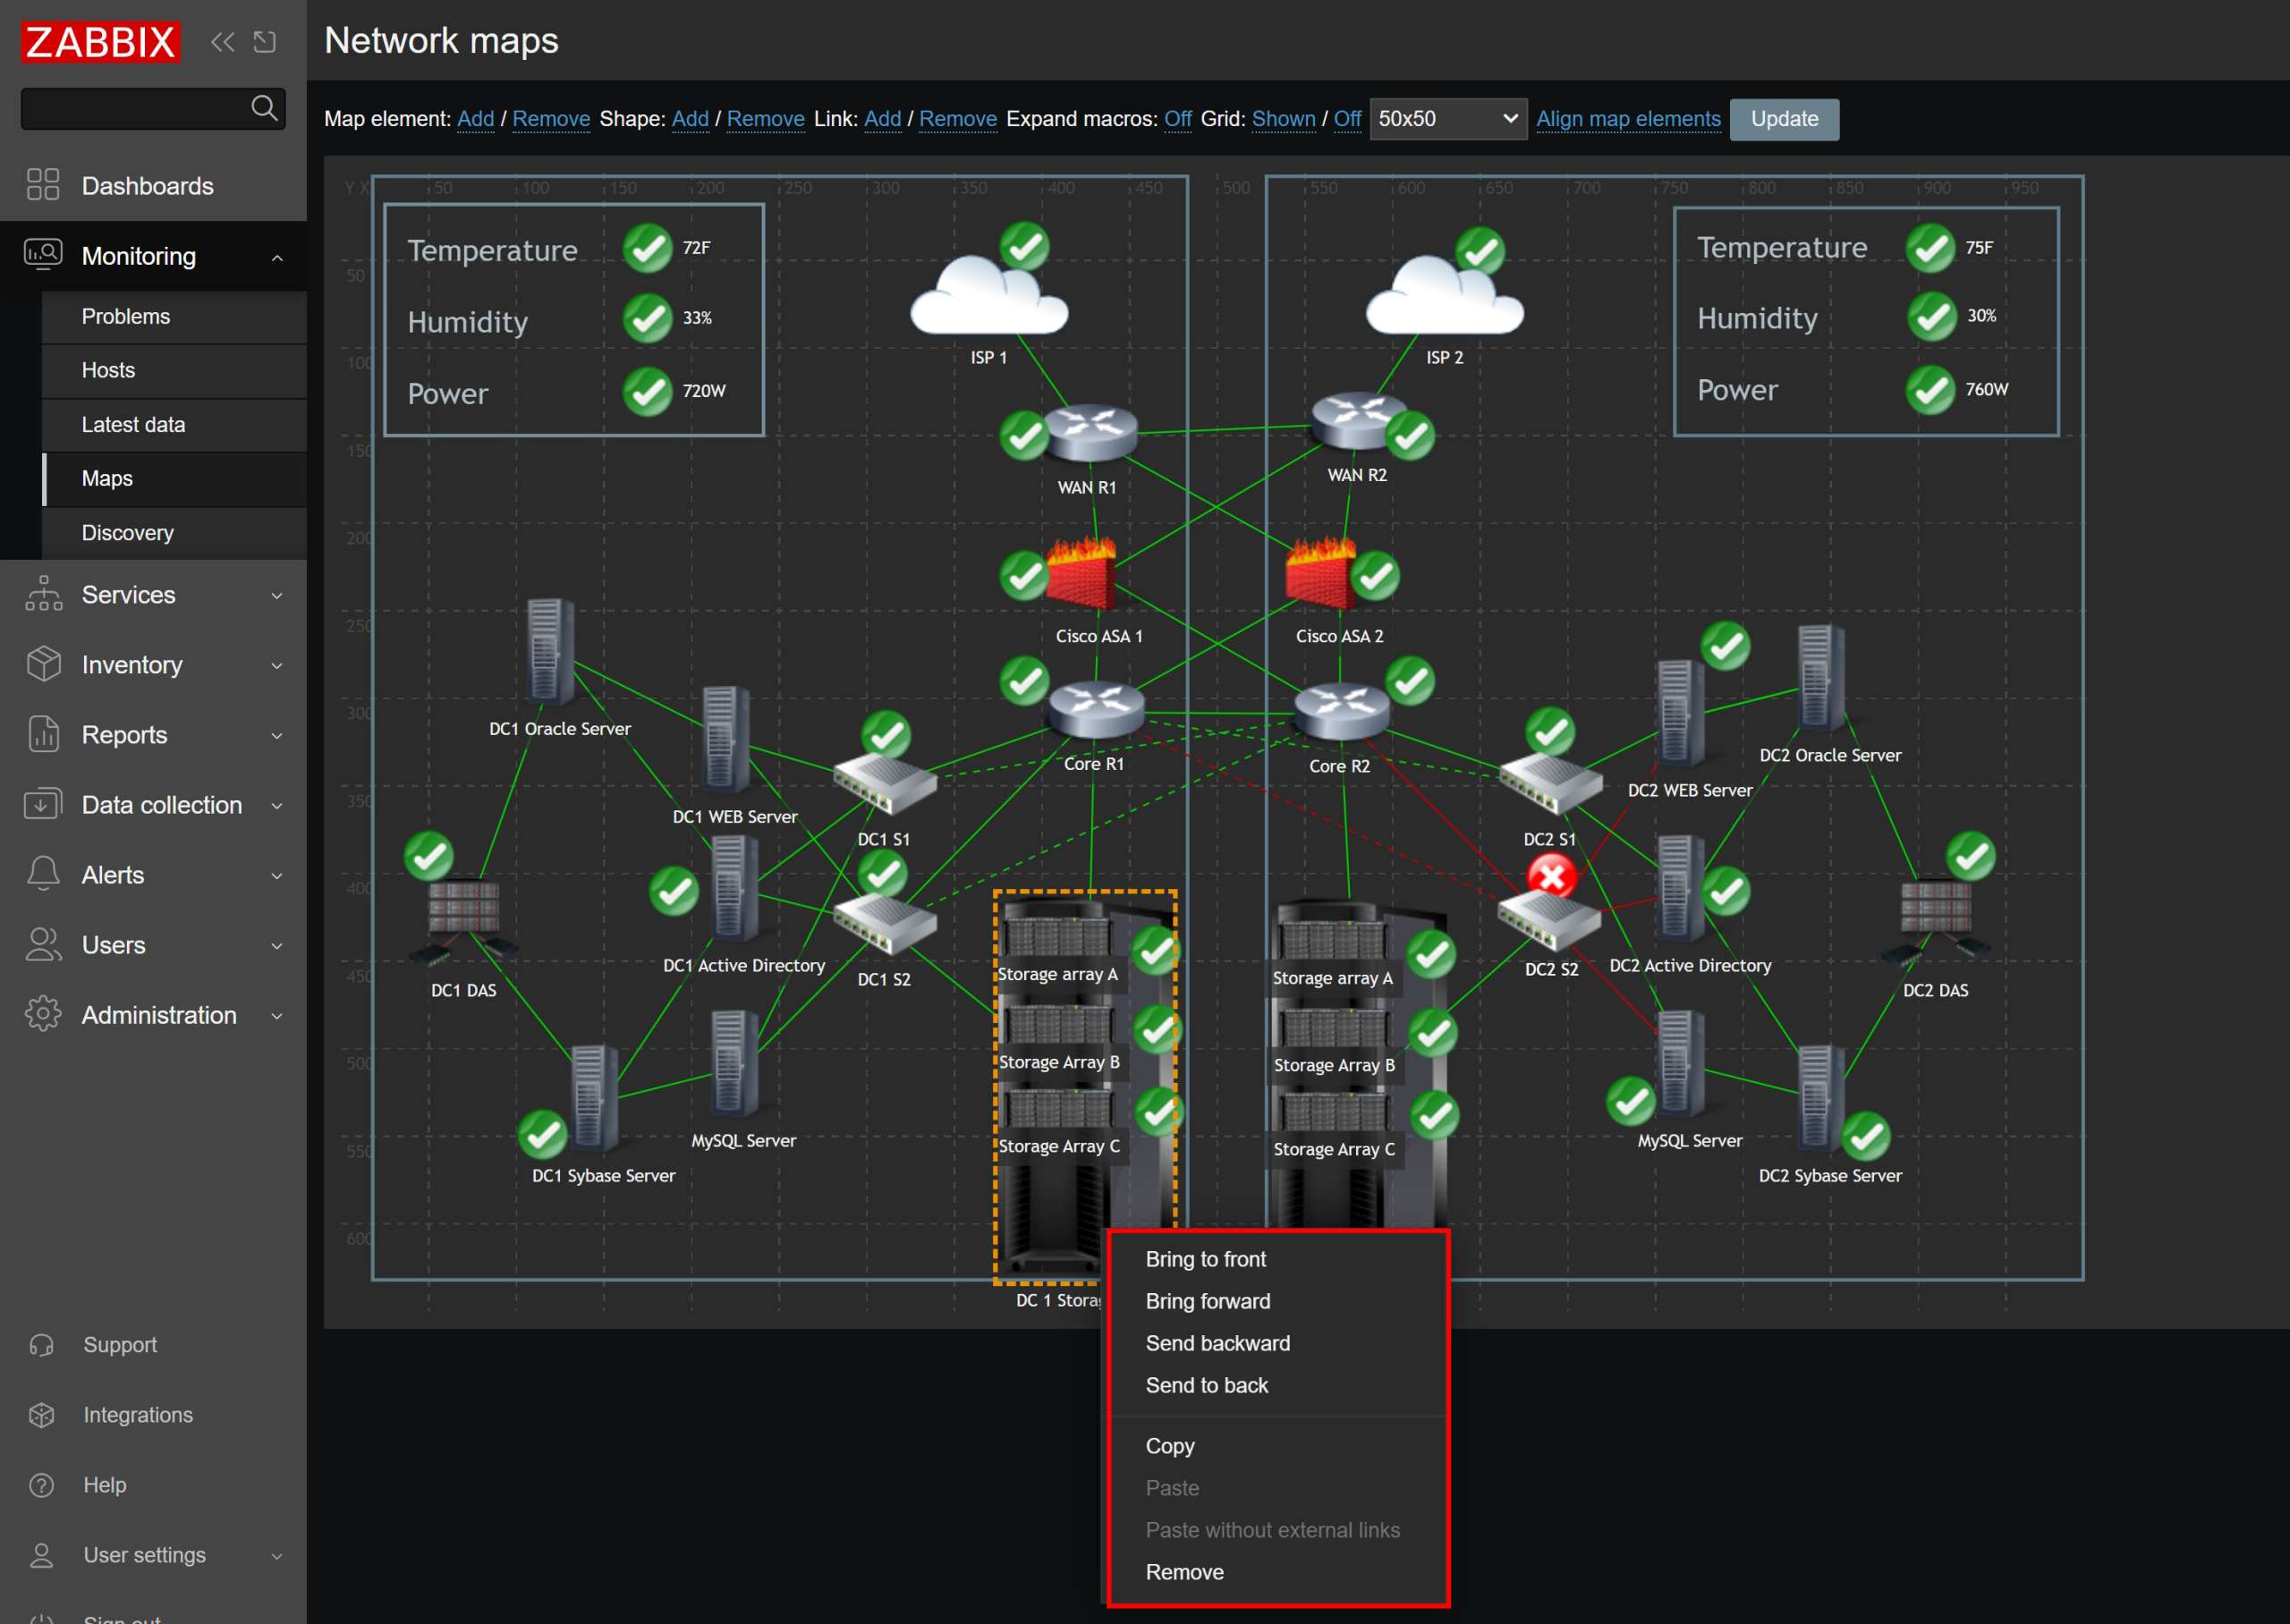
Network map improvements
Network maps have also received multiple improvements, enabling new use cases and simplifying existing network map scenarios.
Map background images can now be scaled proportionally to the map dimensions
Map links now support link indicators based on item value thresholds
Map element icons can now be ordered when placed on top of one another
Item value thresholds can be defined for link indicators
Map element icons can now be ordered when placed on top of one another
Host group map elements will now take into account nested host groups when displaying host group-related information
Map link and element labels can now be hidden and only displayed on mouse hover
Map elements can be ordered on top of each other
Dashboard improvements
Zabbix 7.4 introduces multiple dashboard improvements to facilitate faster and smoother dashboard configuration.
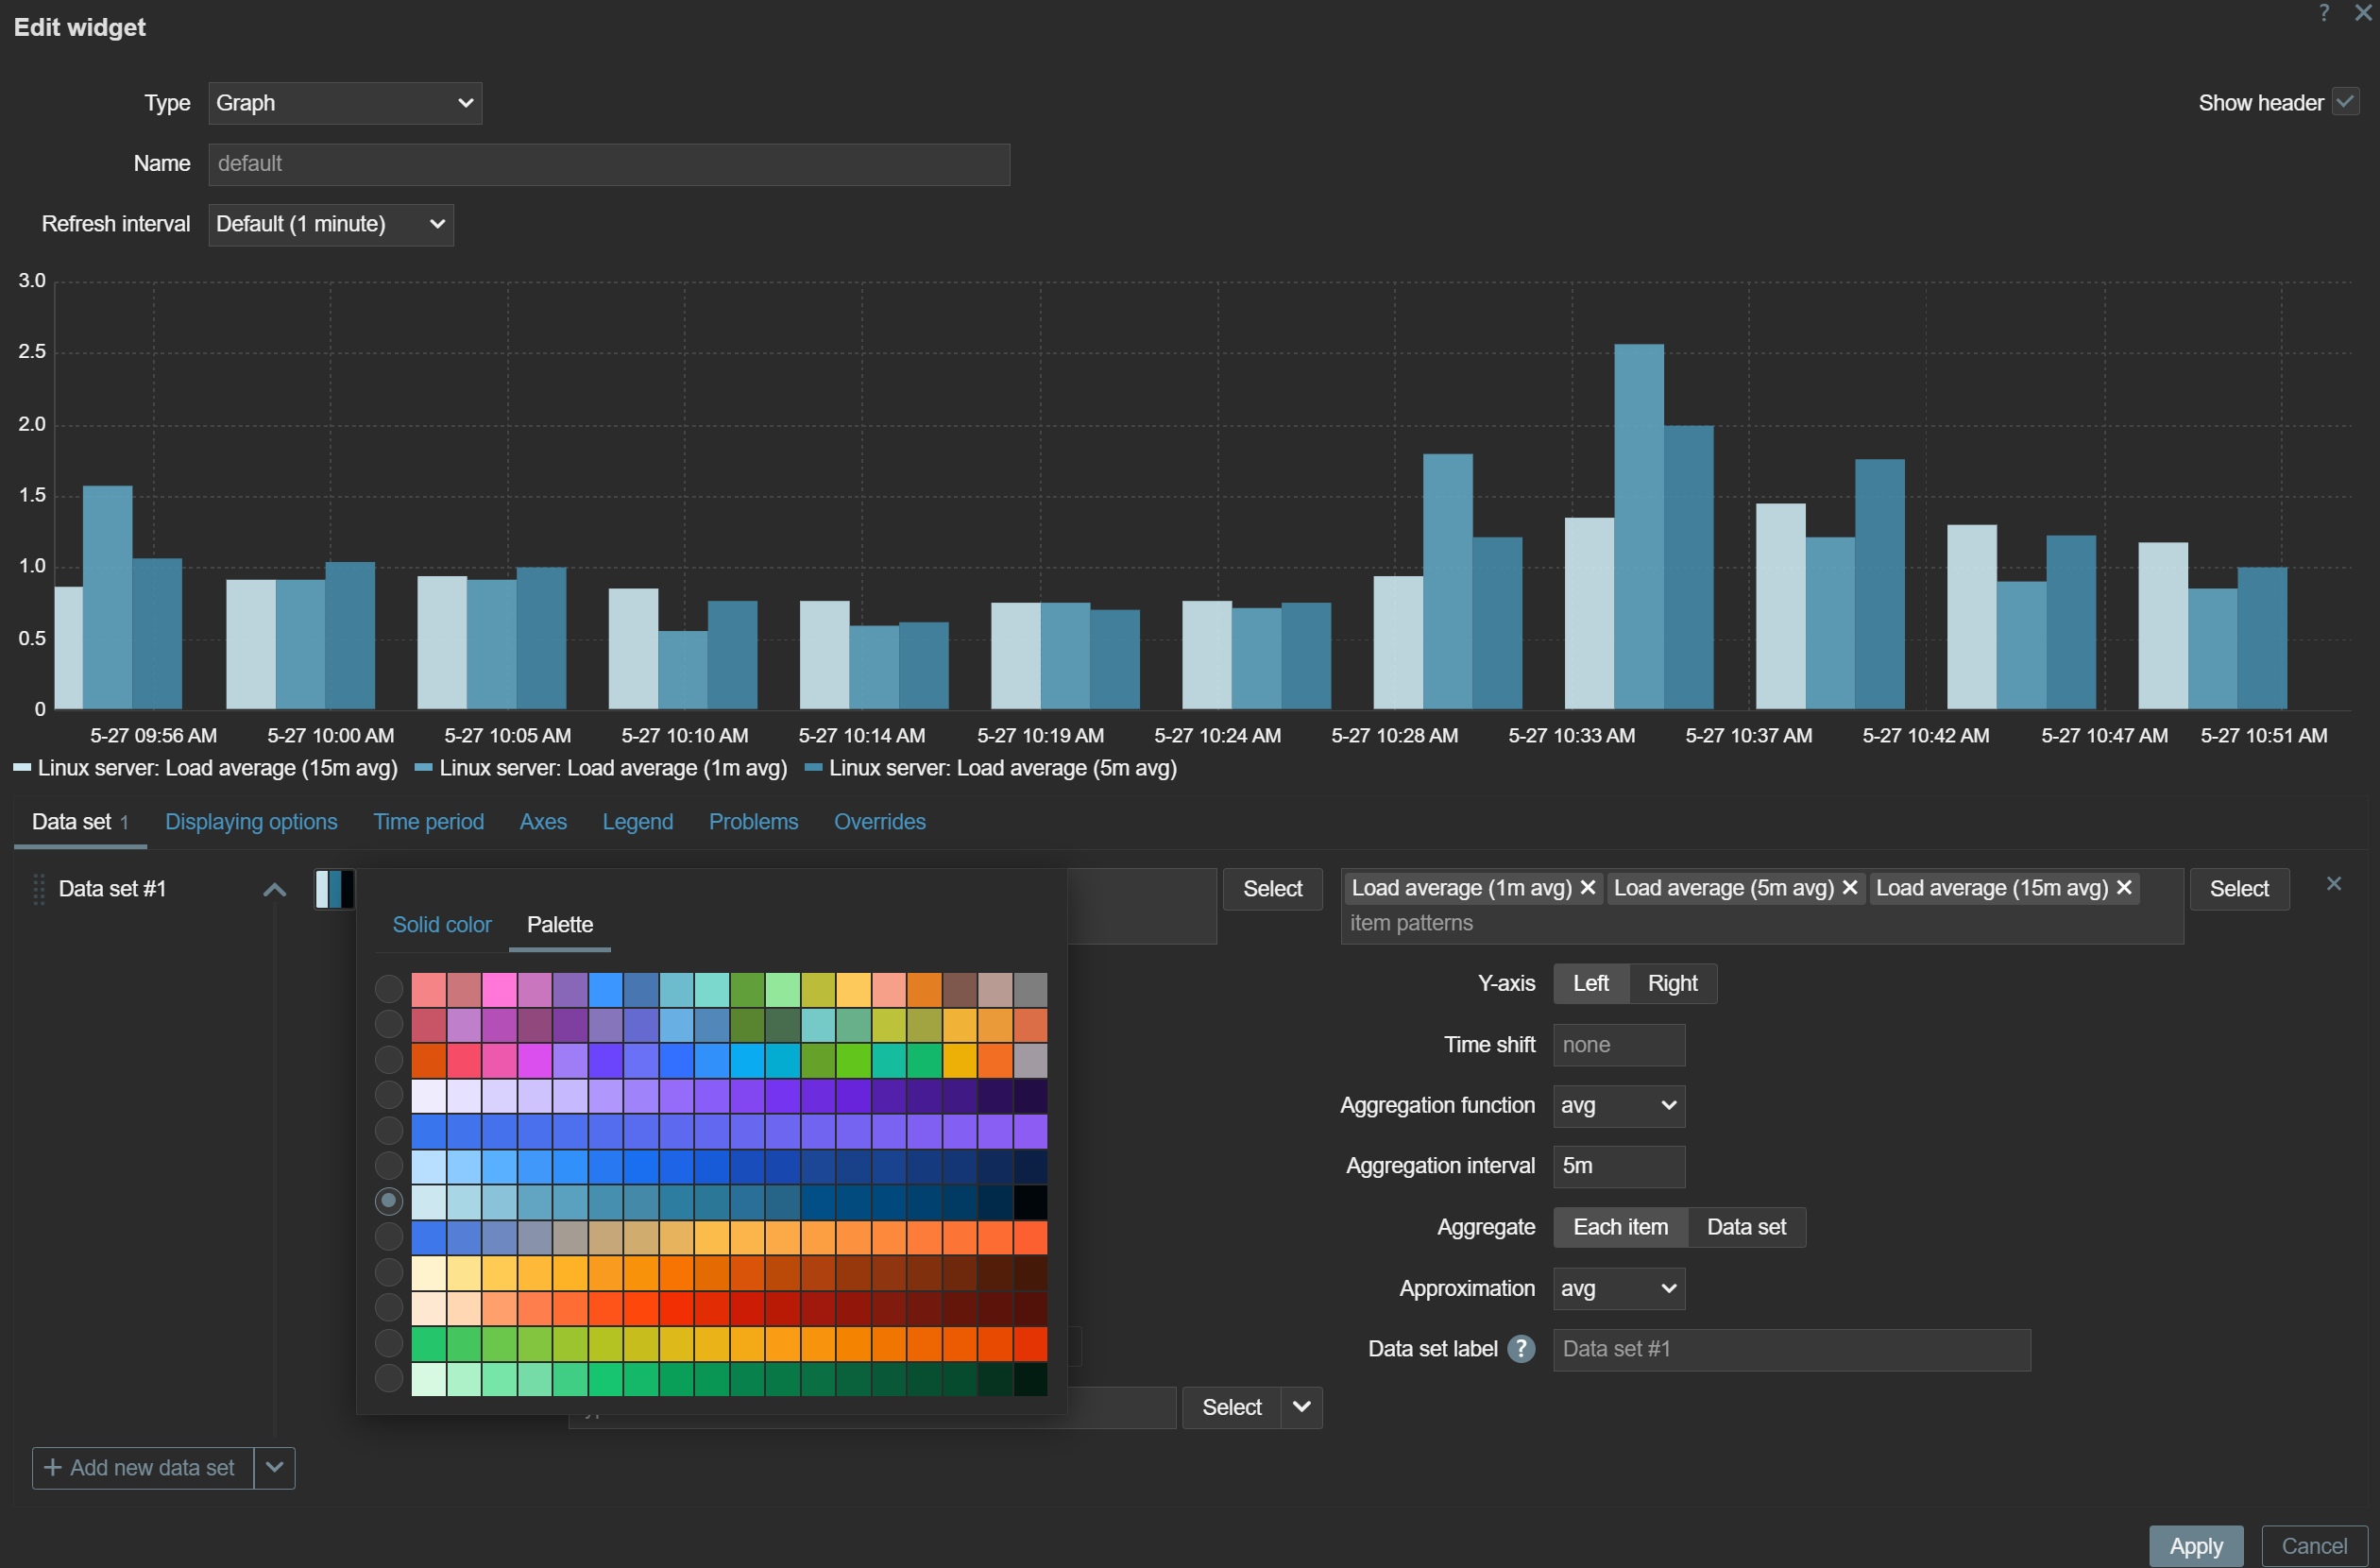
The color picker in graph and pie chart widgets has been extended with the new palette color scheme in addition to the existing solid color scheme. Users can choose from the available palette color schemes. The new palette color schemes display the values within a data set in a more distinguishable way, while the existing solid color scheme displays the data set values in shades of the selected color.
The new palette color scheme is available in graph and pie chart widgets
Widget configuration changes are also displayed instantly in Zabbix 7.4 – there’s no need anymore to apply the changes to see them reflected in the widget.
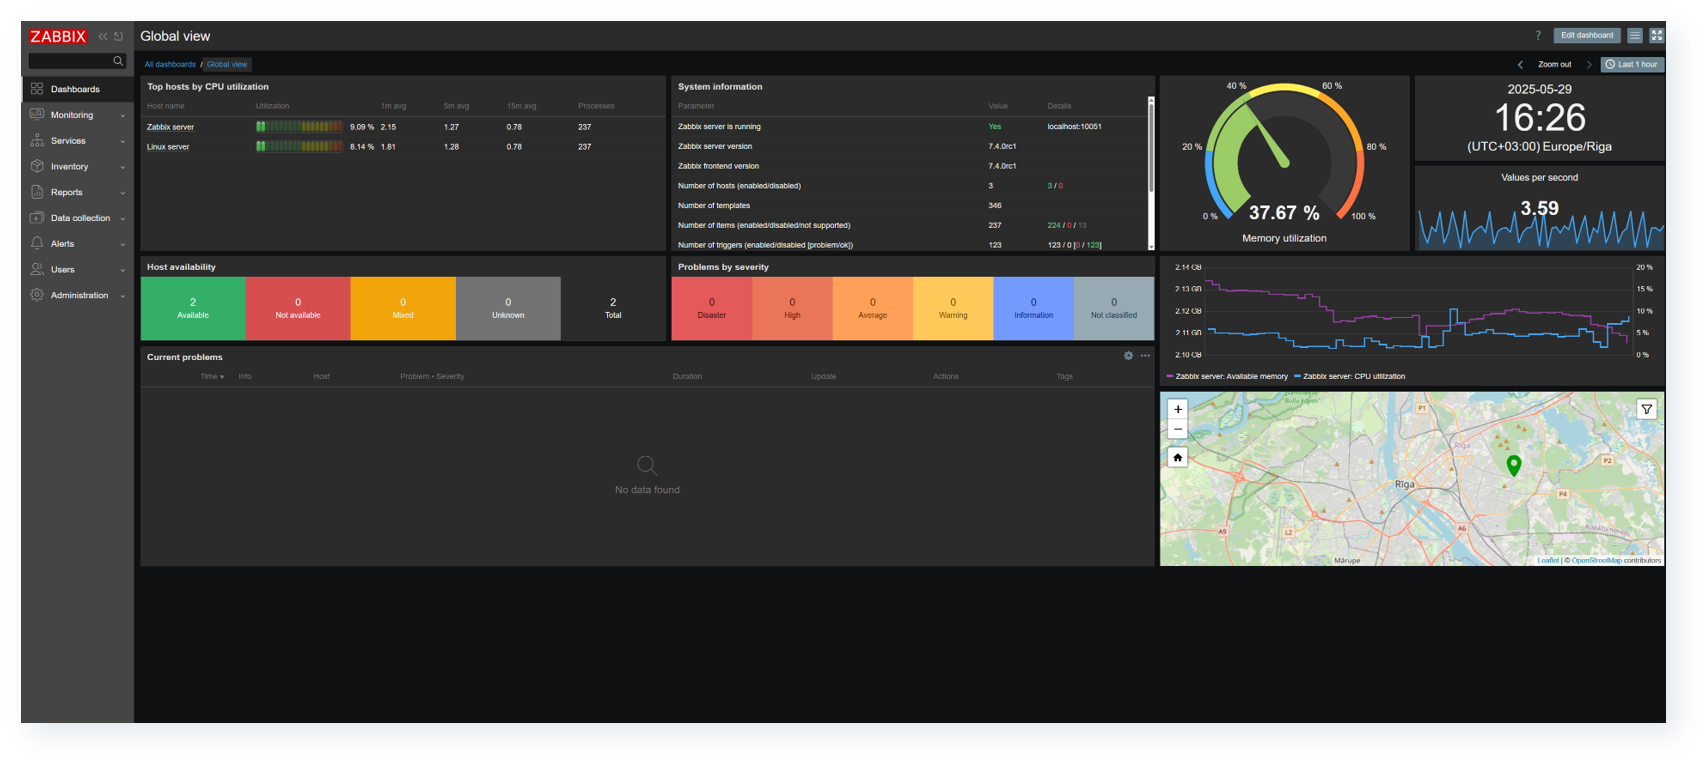
In addition, the default Global view dashboard has received an overhaul and now utilizes the latest Zabbix widgets to provide additional insights about the Zabbix instance.
The default Global view dashboard has received an overhaul
Other changes in Zabbix 7.4
Multiple smaller fixes have been introduced in Zabbix 7.4, such as new history functions, new macros, security fixes, and more:
Preprocessing results can now be copied directly to clipboard by using the “Copy to clipboard” button
All users are now allowed to manage their own media by default. These permissions can now be revoked in user role settings
A new Notifications section for customizing notification settings has been added under “User Settings”
Vault secret macros can now be resolved by either the Zabbix server or Zabbix proxy
A new icmppingretry simple check has been added to monitor host responses to ICMP ping with the ability to modify retries
New timestamp tracking history functions have been added
Multiple new macros added for item-value time tracking
Zabbix server/proxy automatically logs history cache diagnostic information when the history cache is full
Disabled items are now immediately removed from the history cache
It is now possible to manually clear the history cache for a specific item by its id with the history_cache_clear=targetruntime command
Added support of Gmail OAuth authentication
New templates and integrations in Zabbix 7.4
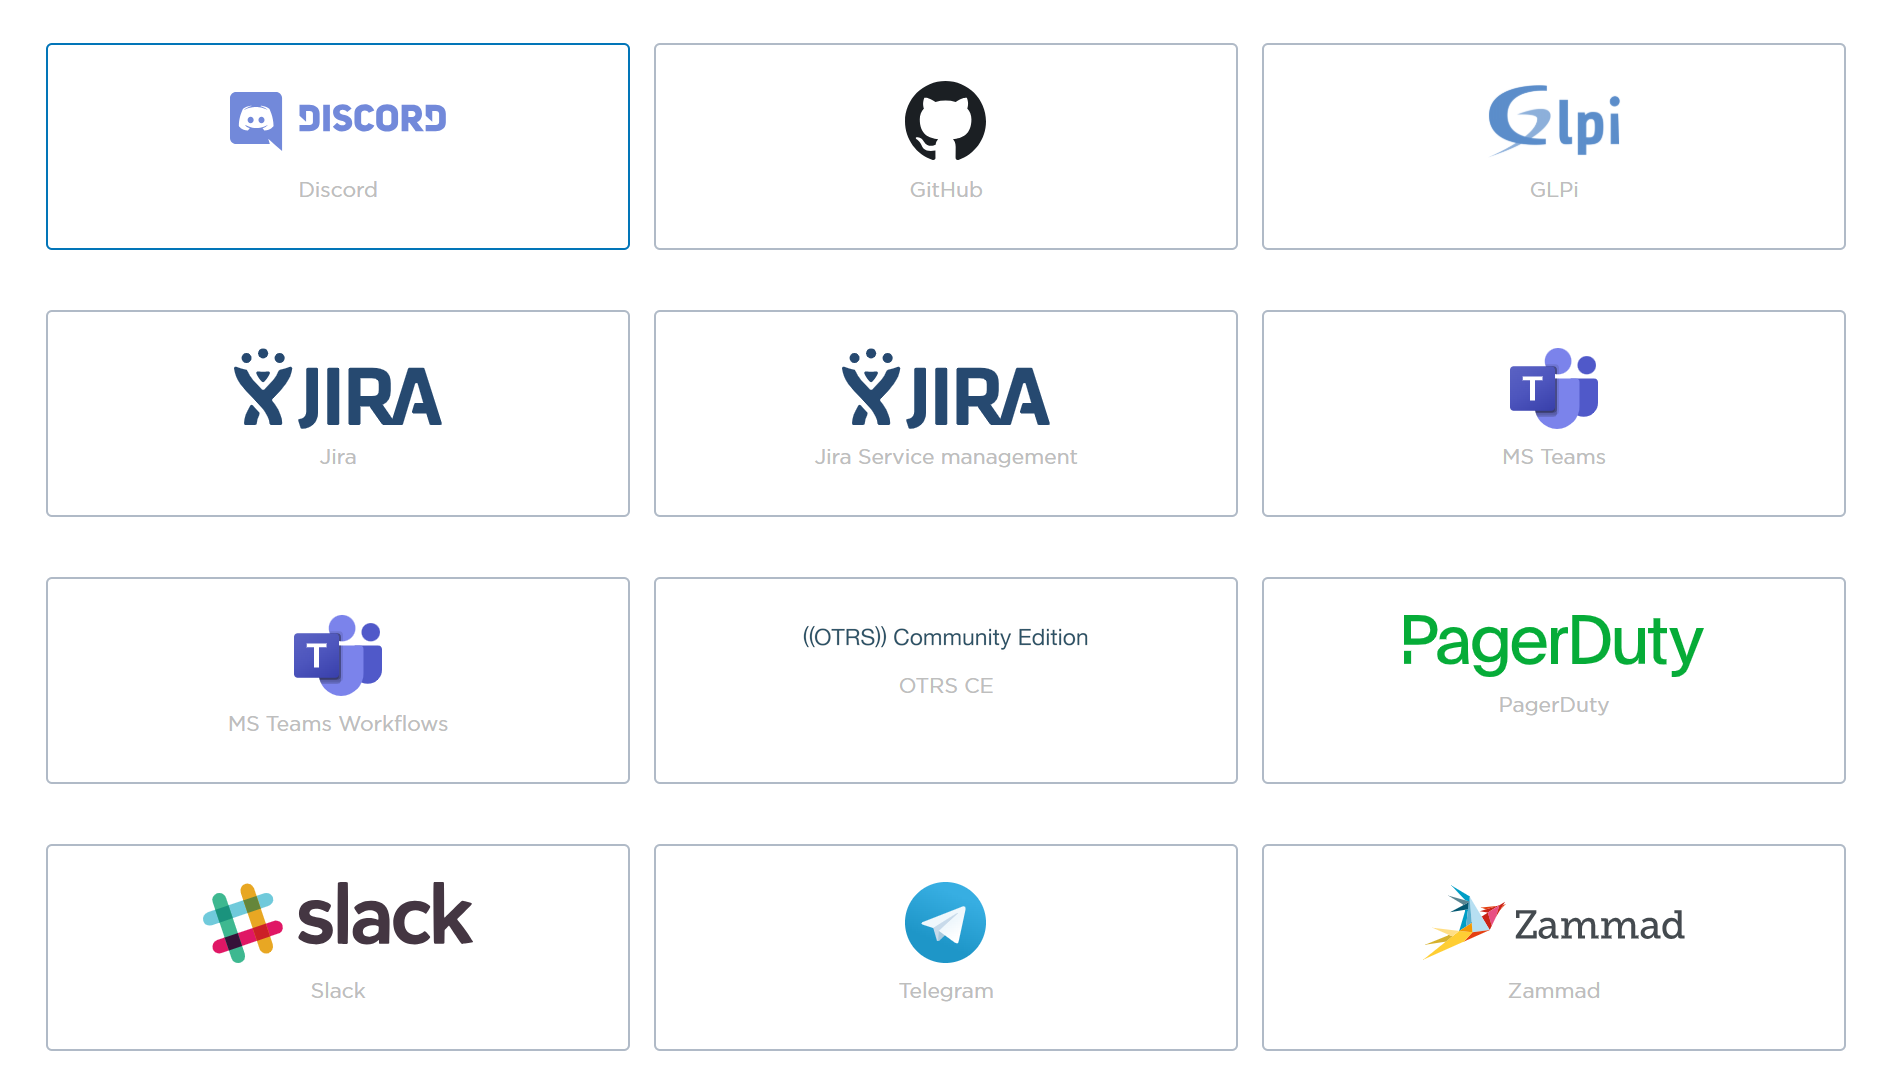
Many of the existing webhook integrations have been refactored in Zabbix 7.4. The webhooks have been optimized for the best possible performance and include a variety of fixes:
Discord
GitHub
GLPi
Jira
Jira Service management
MS Teams
MS Teams Workflows
OTRS CE
PagerDuty
Slack
Telegram
Zammad
Many of the existing webhook integrations have been refactored in Zabbix 7.4
If you find yourself needing additional flexibility when it comes to database monitoring, Zabbix agent 2 may be exactly what you need. Keep reading to see which features make it ideal for database monitoring and find out how to best use them for your own purposes.
Table of Contents
What is a database?
If you’ve been using Zabbix for a while, you know that a database is an organized collection of data that is stored and accessed electronically. That data can be historical, configuration, business, social media-related, etc. A database, or rather a database management system (DBMS) allows you to store, manage, and retrieve information efficiently.
Types of DBMS
We can separate DBMS into multiple types. Depending on how data is stored, retrieved, managed, there can be quite a few, but we will try to limit ourselves to the most common four:
Relational databases (or RDBMS) see tables and SQL.
MySQL
MariaDB
PostgreSQL
Oracle
NoSQL databases store data in formats like JSON, key-value pairs, or graphs.
MongoDB
Redis
InfluxDB
ElasticSearch
Cloud databases use cloud platforms for scalability.
Amazon RDS
Azure SQL
Time-series databases (or TSDB databases) are optimized for time-stamped data.
TimescaleDB
InfluxDB
But what unites all those database engines? They can all be monitored by Zabbix!
Database monitoring
Database monitoring is important for a variety of reasons, the most common of which are to get a precise overview of database and application performance. Since databases can be a vital part of multiple departments and applications, poor performance may impact an entire company and its users, leading to unsatisfactory results on all sides.
To avoid such situations, the set of metrics we should monitor for database engines can include:
Database environment metrics
CPU performance
Memory usage
Drive capacity
Disk latency
Database performance metrics
Query performance
Transaction/operations/indexing
Connections
Application and/or business related data
Amount of users
Transactions
Inventory
Configuration
Why Zabbix agent 2?
Zabbix Agent 2 includes multiple features that enhance its flexibility:
Task queue management with respect to both schedule and task concurrency.
Concurrent active checks with threads.
Multiple agent 2 unique metrics
Easier to extend using GO plugins.
Plugins in Zabbix Agent 2 are written in the Go programming language and provide a flexible, native way to extend the agent’s functionality. These plugins communicate directly with databases using their native APIs or libraries, which allows for correct and efficient performance monitoring.
But agent2 provides even more flexibility when focusing on database monitoring, allowing us to:
Limit query execution
Control the session time
Configure encryption between Zabbix agent and database
Control cache mode
All database data is collected using the best approach for the monitored database.
MySQL, monitoring relies on the Go-MySQL-Driver
PostgreSQL integration is managed through the pgx driver
The list goes on for supported database engines:
MySQL / MariaDB
PostgreSQL
ORACLE
MSSQL
MongoDB
Redis
Memcached
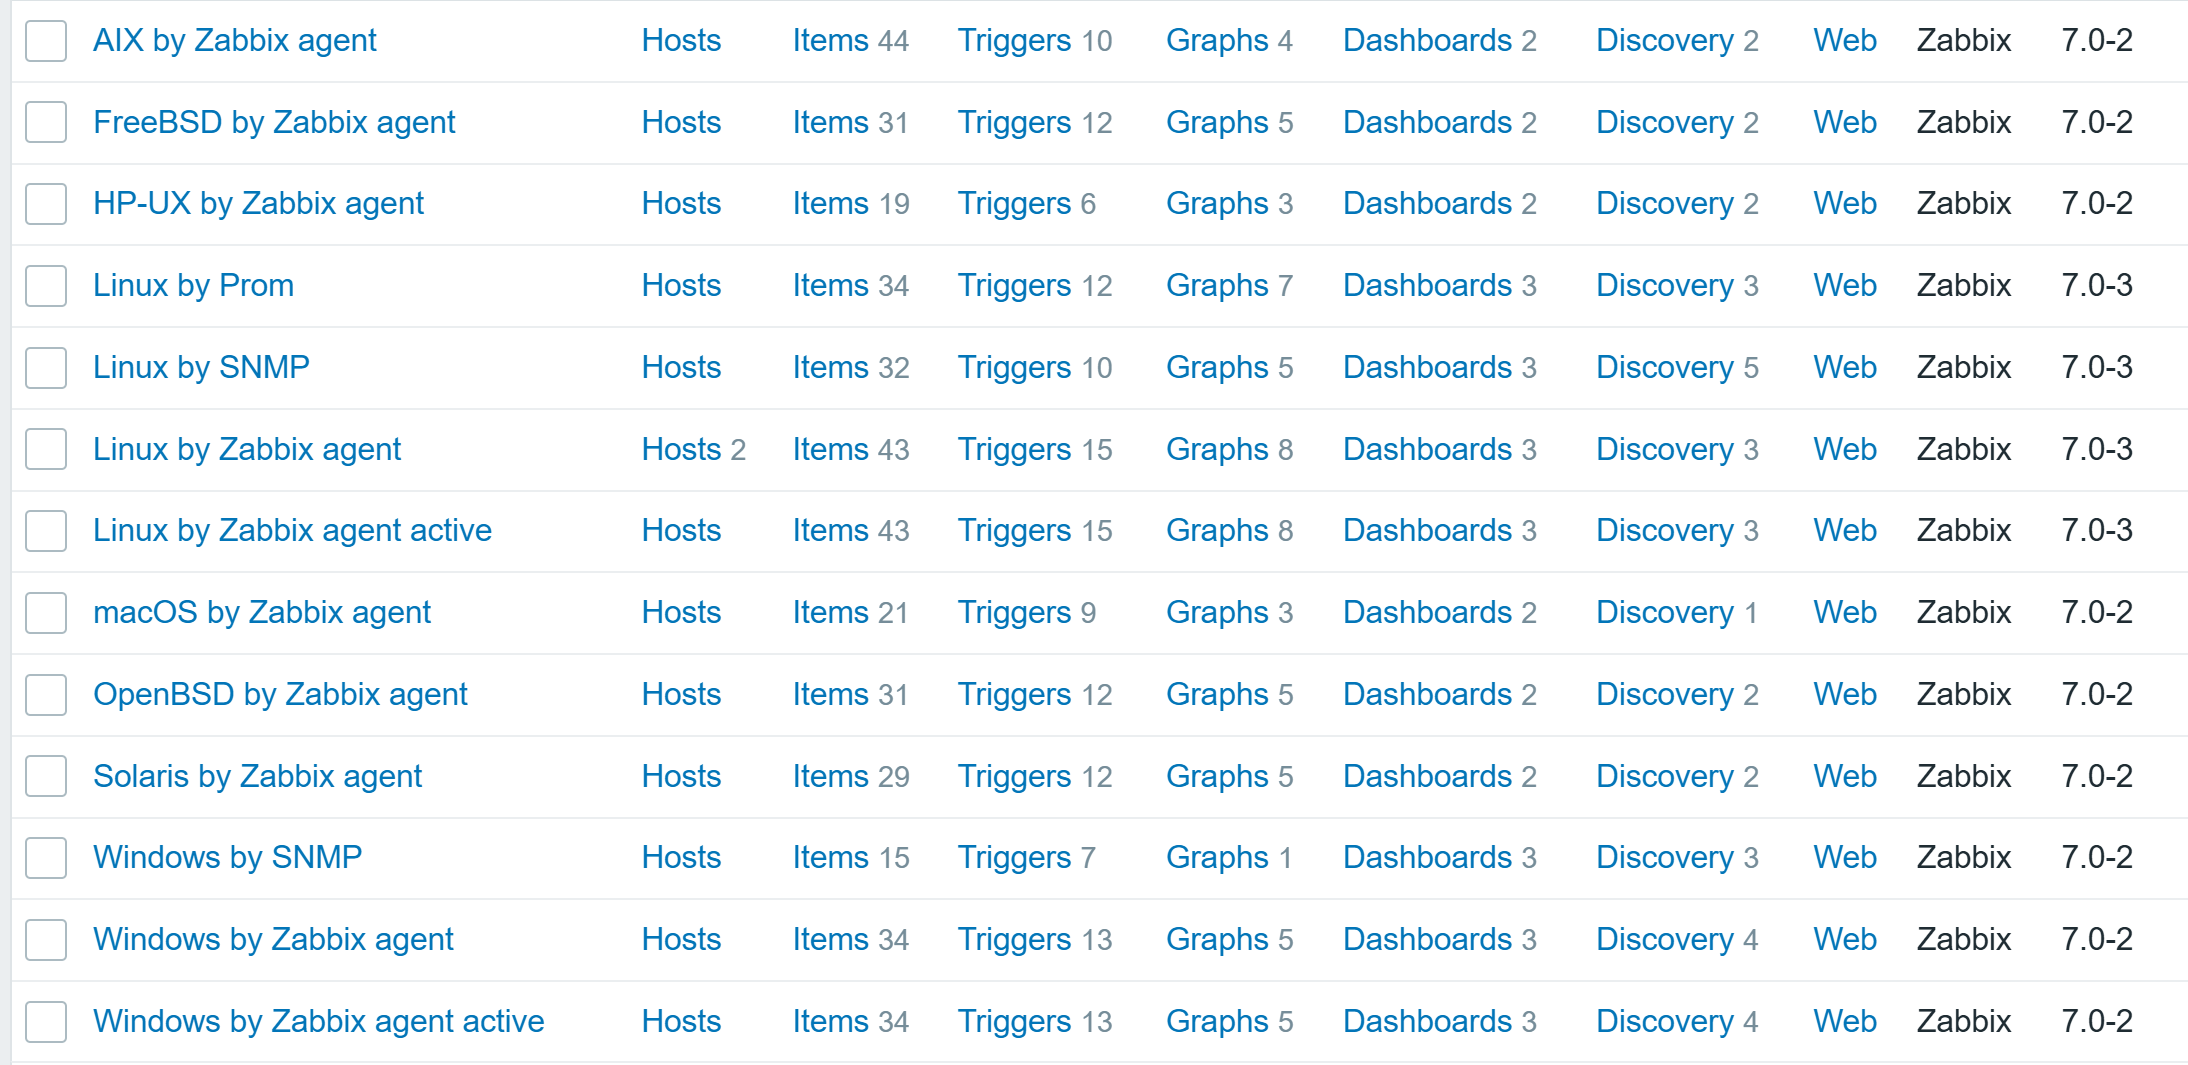
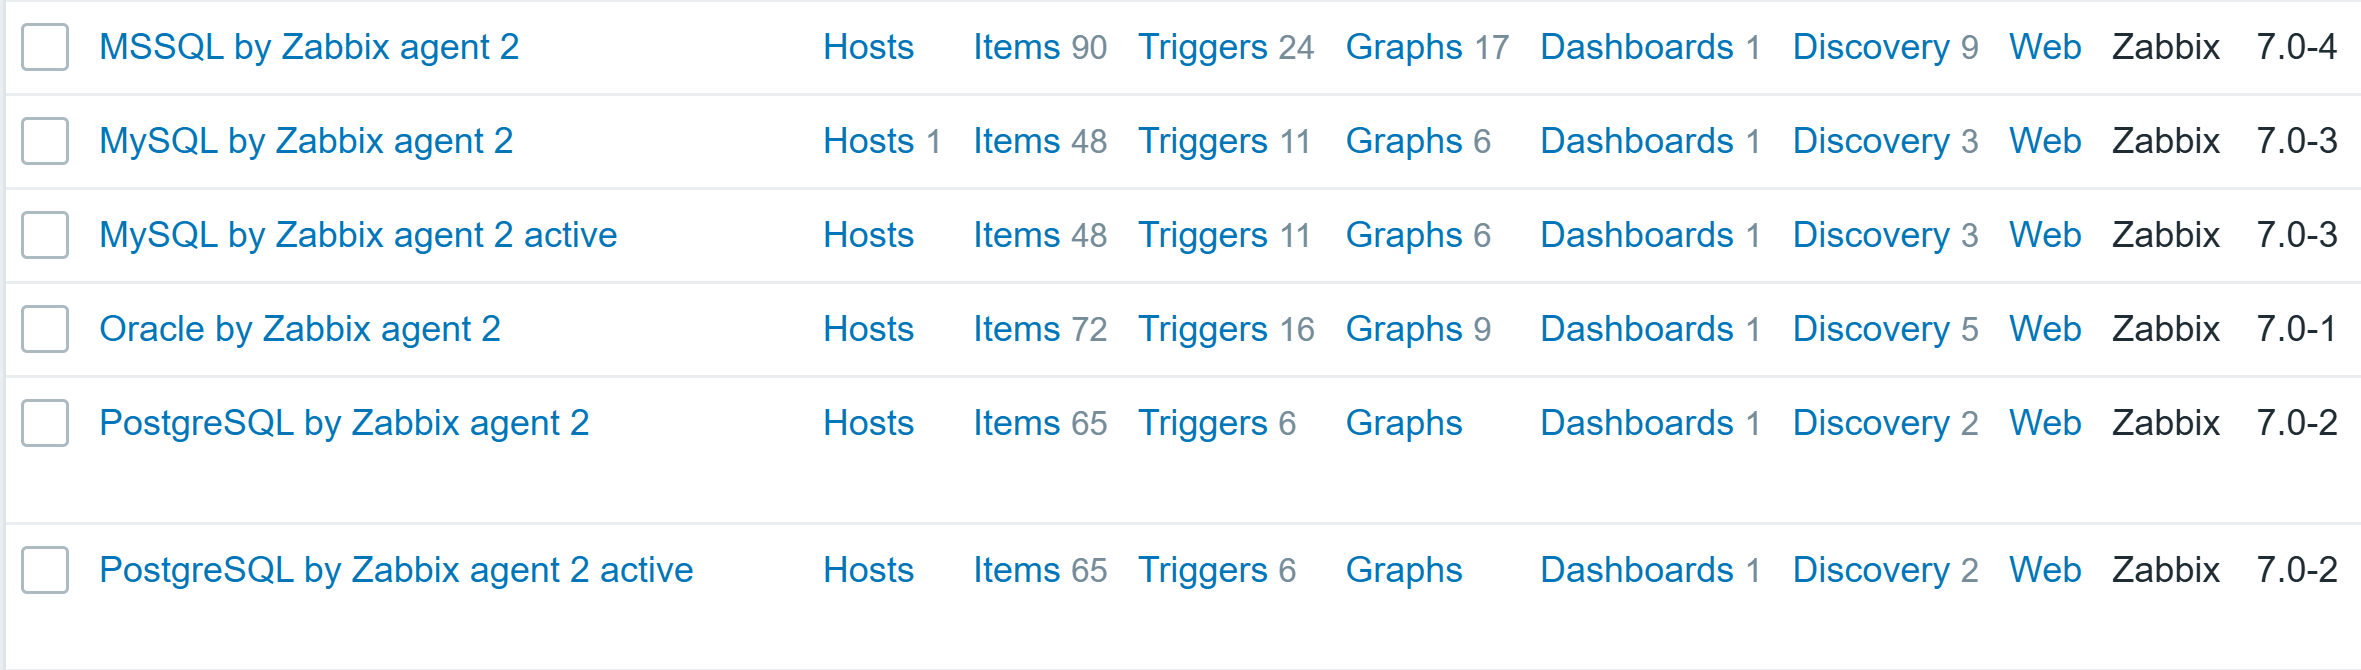
Monitoring SQL databases
Database environment
In this part we will focus on how to monitor and retrieve data from SQL databases and SQL database-related parameters. Monitoring SQL database environment metrics with Zabbix agent 2 is as straightforward as monitoring any virtual or physical machine with an OS. All we need to do is add the repo:
Then, make sure that connections from Zabbix server to Zabbix agent 2 are allowed using Server parameter:
### Option: Server
#       List of comma delimited IP addresses, optionally in CIDR notation, or DNS names of Zabbix servers and Zabbix proxies.
#       Incoming connections will be accepted only from the hosts listed here....
# Mandatory: no
# Default:
# Server=
Server=127.0.0.1,server-dns.example.com
Finally, link one of the many templates available out of the box:
List of templates for OS monitoring
SQL database performance metrics
What about the actual DB performance metrics? There are plenty of approaches we can take using Zabbix agent 2.
Out-of-the-box templates are available for multiple databases that can be monitored by Zabbix agent 2:
SQL database template list
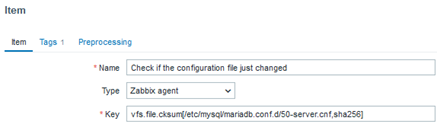
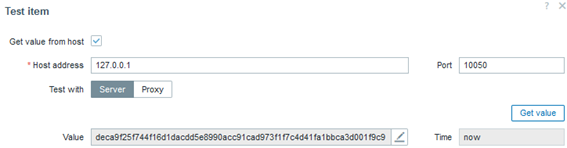
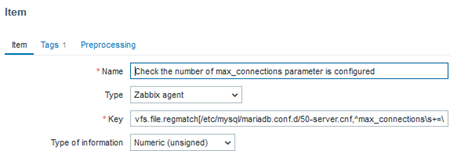
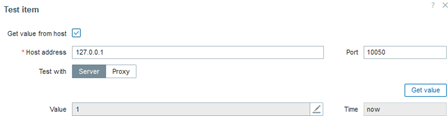
Each of the templates uses a database native way to get precise performance data, such as SHOW GLOBAL STATUS for MySQL or dbStats for MongoDB. Also, template provides instructions on how to prepare the database for monitoring. Let’s take MySQL/MariaDB for example:
Create a MySQL user for monitoring (<password> at your discretion) and give this user enough permissions for monitoring:
mysql> CREATE USER 'zbx_monitor'@'%' IDENTIFIED BY '<password>';
mysql> GRANT REPLICATION CLIENT,PROCESS,SHOW DATABASES,SHOW VIEW ON *.* TO 'zbx_monitor'@'%';
In order to collect replication metrics, MariaDB Enterprise Server 10.5.8-5 and above and MariaDB Community Server 10.5.9 and above require the SLAVE MONITOR privilege to be set for the monitoring user. The command then looks like this:
mysql> GRANT REPLICATION CLIENT,PROCESS,SHOW DATABASES,SHOW VIEW,SLAVE MONITOR ON *.* TO 'zbx_monitor'@'%';
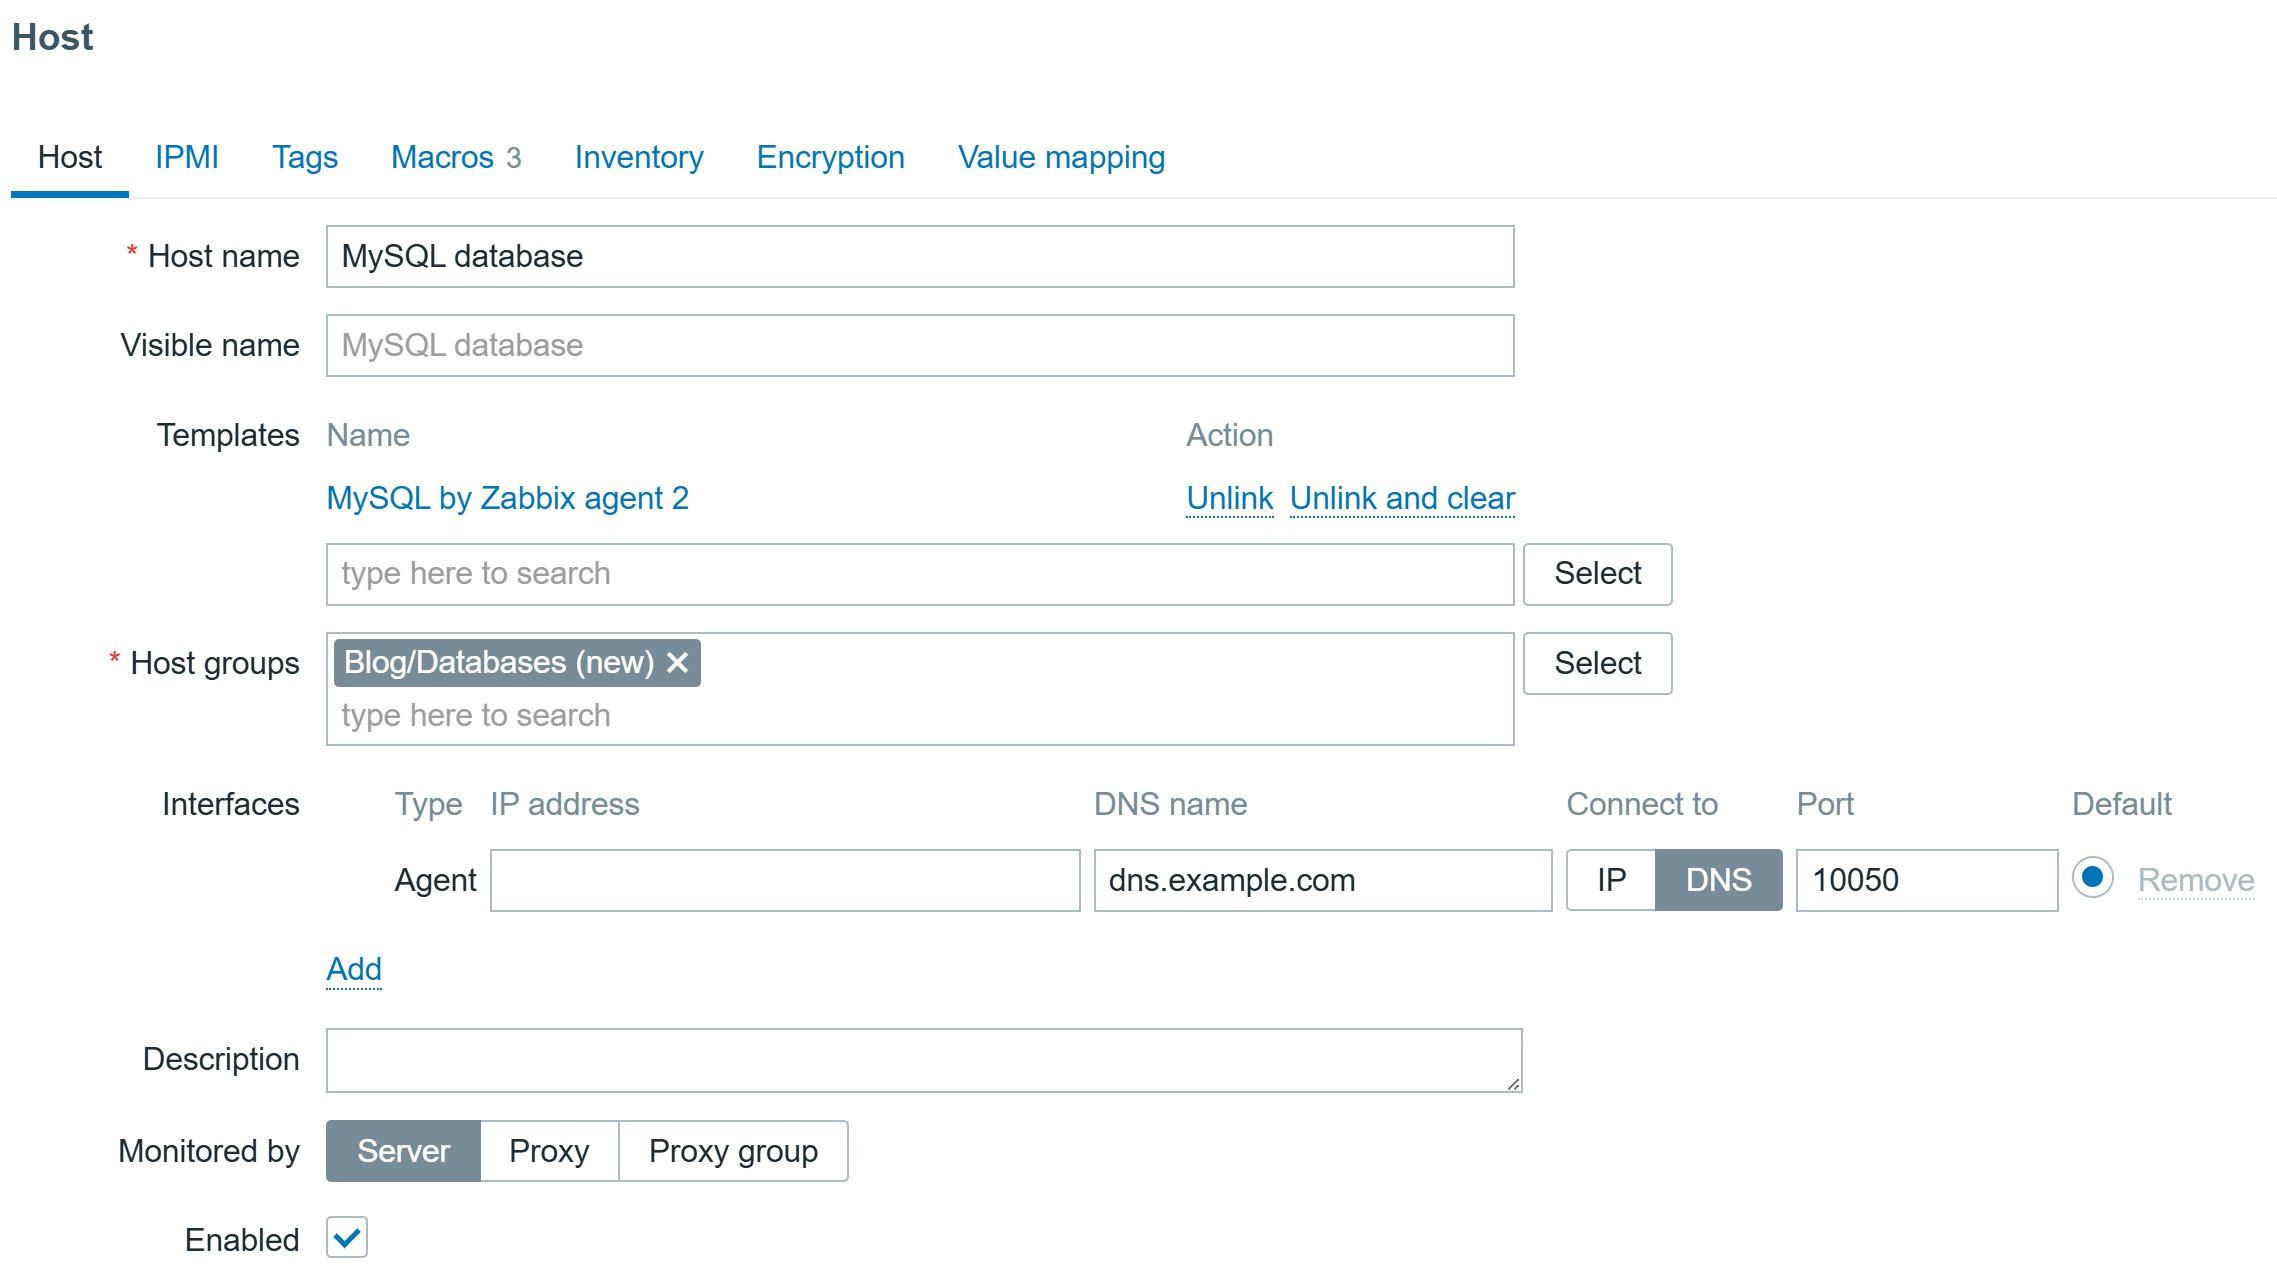
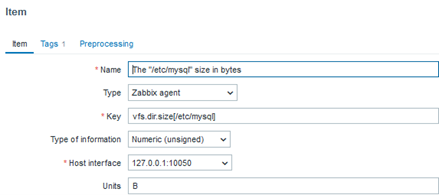
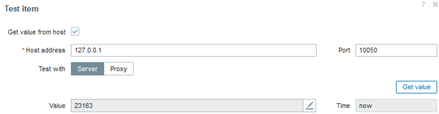
Then create a host to represent your MySQL/MariaDB and link the “MySQL by Zabbix agent 2” template:
MySQL database host
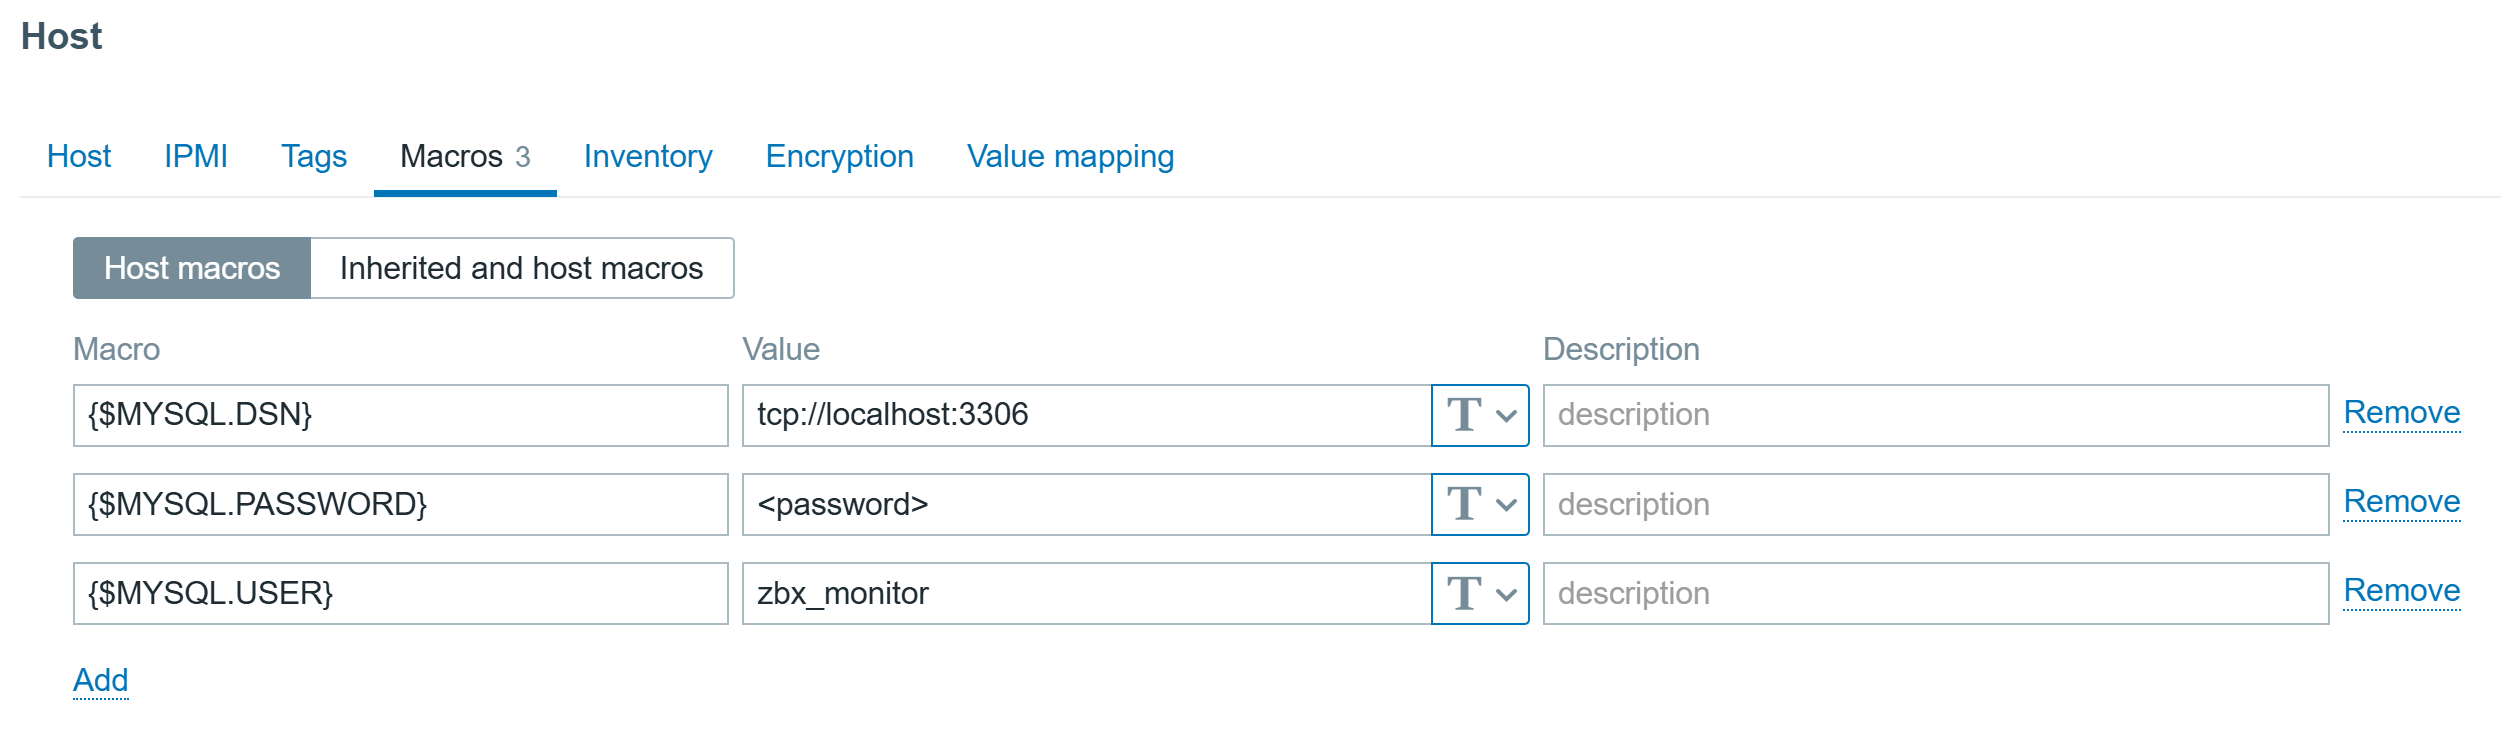
Configure the Macros on the same host:
MySQL database host macros
And the data will start pouring in!
You can find instruction for other databases here.
SQL database internal data monitoring
A default template will tell us a lot about performance, but what if we also need application data? Something that is stored in the database, i.e.
Number of orders
Logged in users
Host count
List of failed transactions
Amount of media uploaded
Zabbix agent 2 lets users collect custom SQL query results with the help of configuration files and a specific item key:
<dbtype>.custom.query[connString,<user>,<password>,queryName,<args...>]:
• Dbtype – mysql, postgresql, oracle, mssql
• connString - URI or session name;
• user, password - Database login credentials;
• queryName - name of a custom query, matches SQL file name without .sql extension;
• args - one or several comma-separated arguments to pass to a query.
The main idea of this key is to construct efficient queries that can return multiple values. The values returned will be automatically transformed to JSON, which is both easier to preprocess and use for LLD creation.
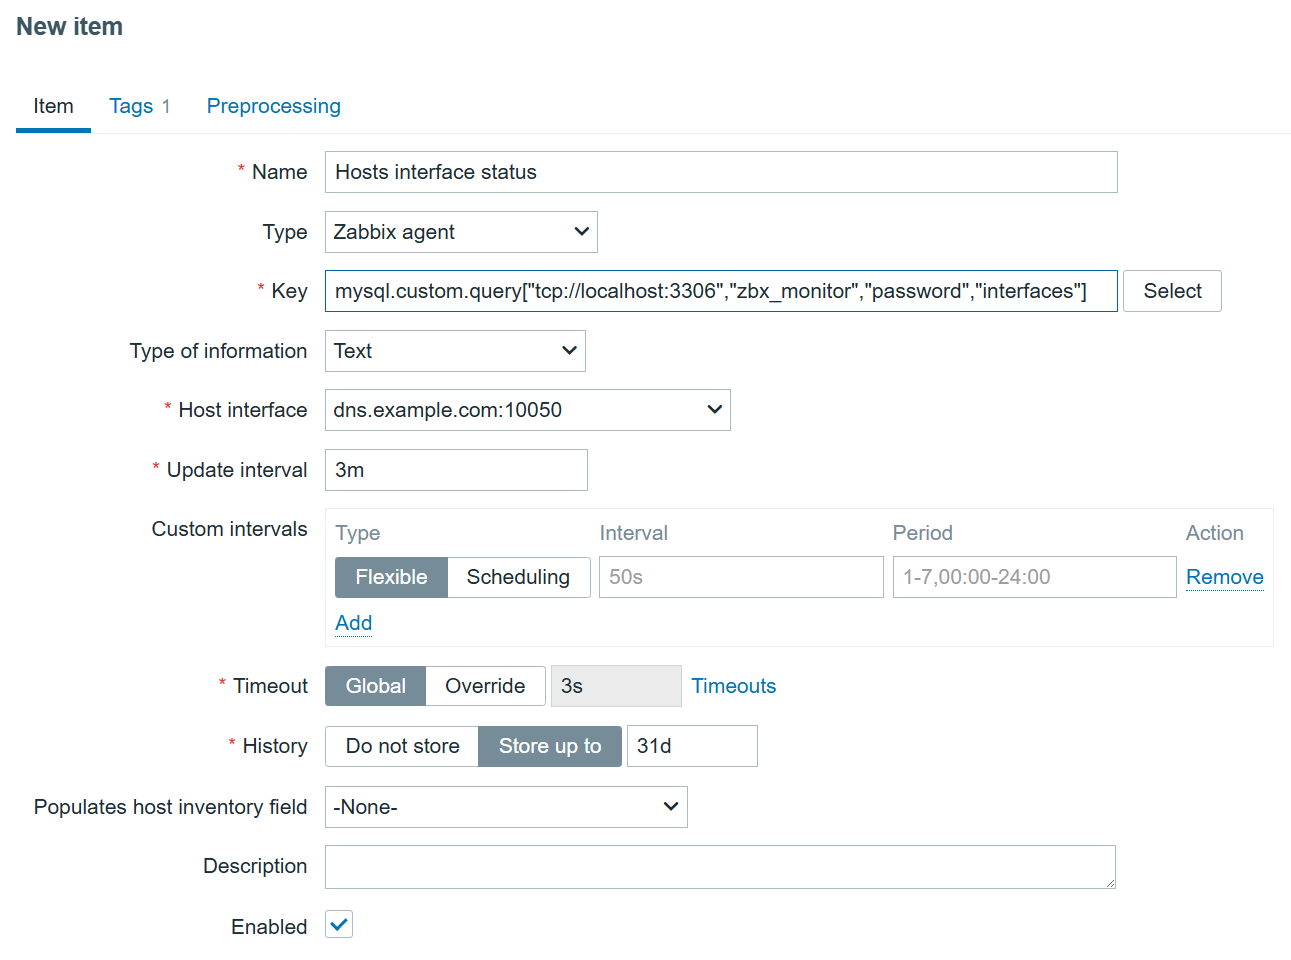
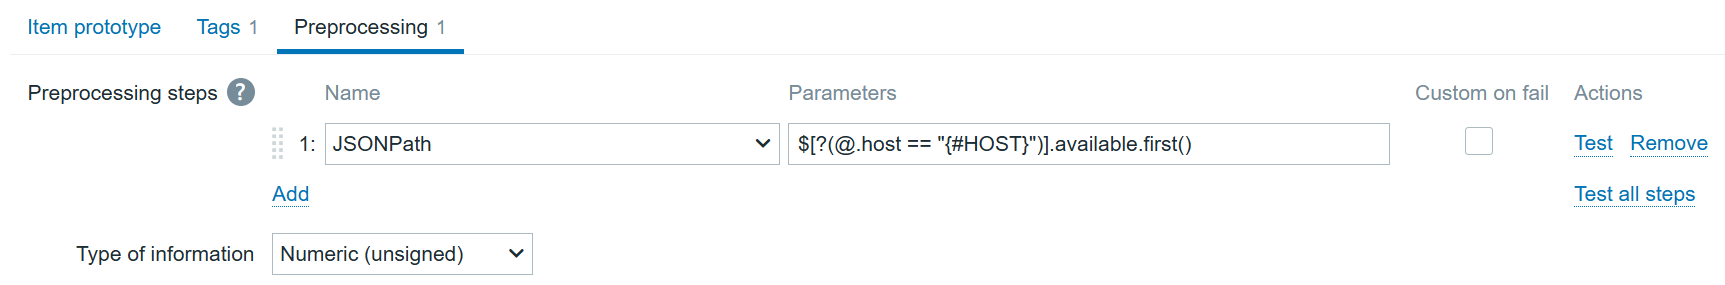
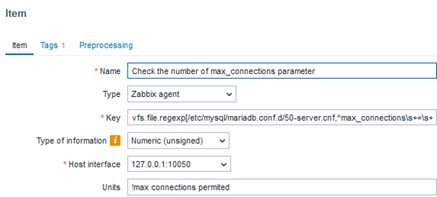
I will add a simple query to find all hosts and their main interface availability in Zabbix:
SELECT hosts.host,interface.available FROM zabbix.hosts JOIN zabbix.interface ON hosts.hostid=interface.hostid WHERE hosts.status IN (0,1) AND hosts.flags IN (0,4) AND interface.main=1;
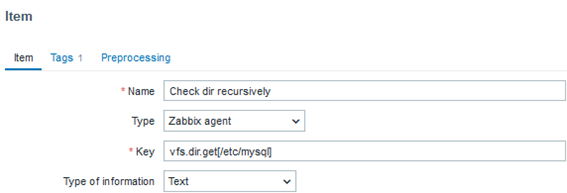
First I need to create a directory for custom queries:
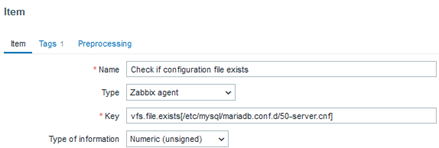
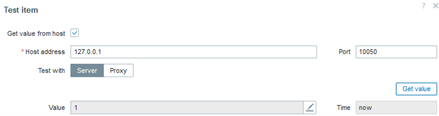
Now, I’m sure the data is collected and can be used for LLD. I can create a new item on the MySQL database host to collect this data:
Interface monitoring item
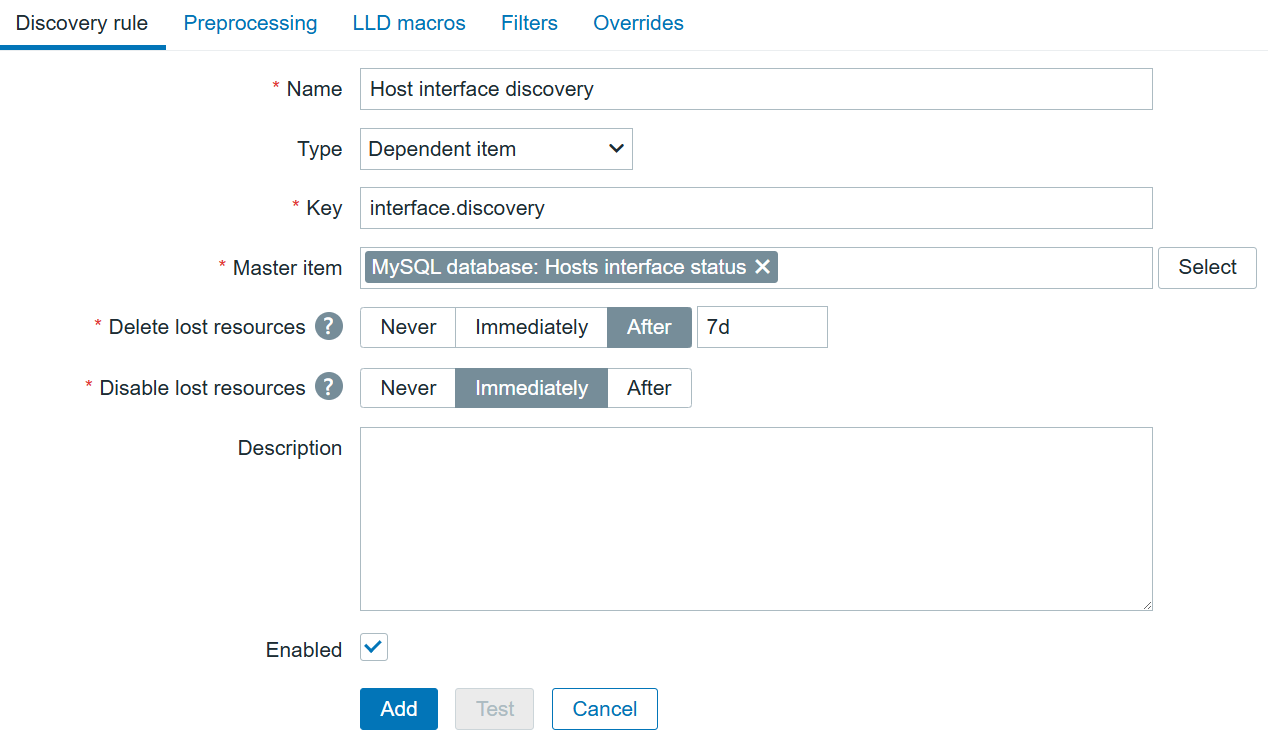
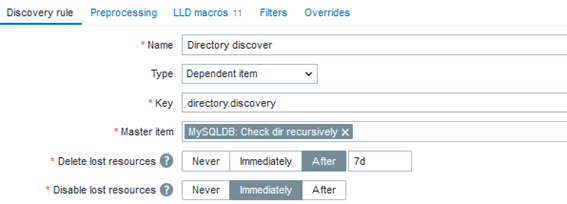
Since I know what kind of data will be returned, I can create a dependent Discovery rule on the same host:
Interface LLD item
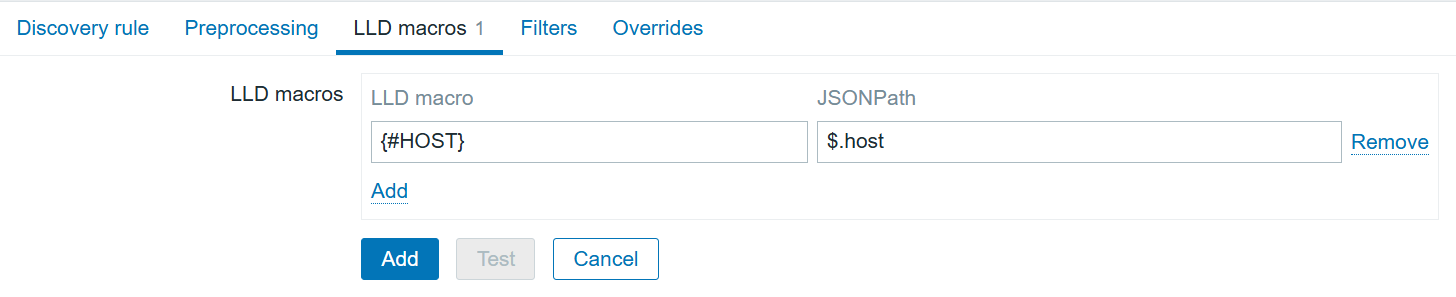
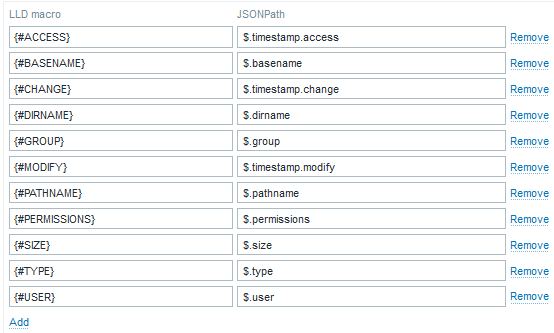
The LLD macros tab will help to transform the current JSON to the LLD-suitable JSON, replacing “host” with {#HOST}.
Interface LLD item macros
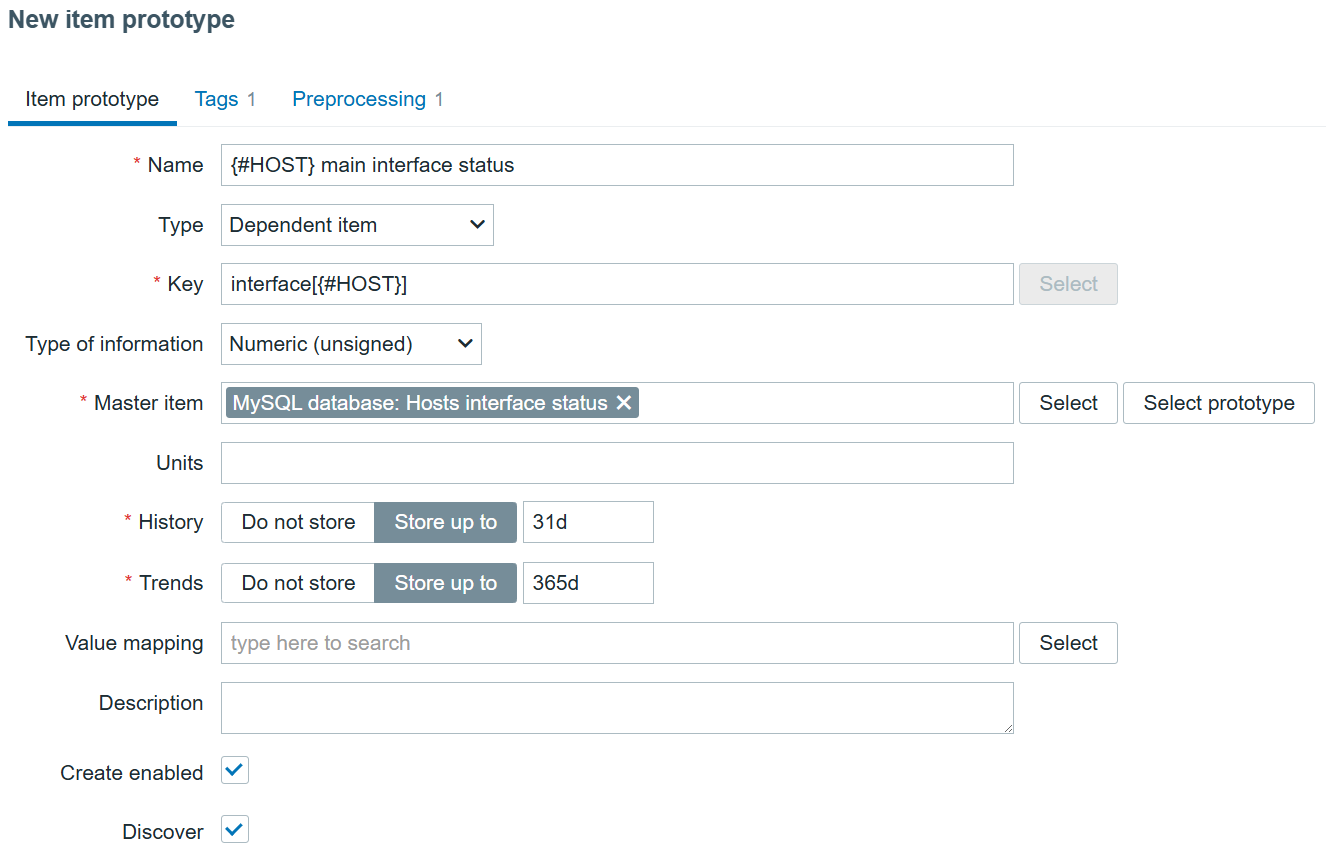
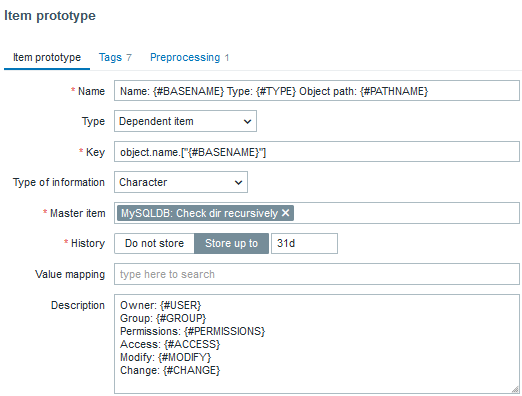
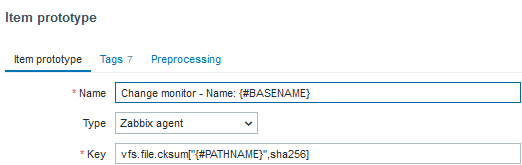
After adding the discovery itself, we can create the dependent item prototype, which will allow us to discover all hosts and their status:
Interface status item prototype
Preprocessing here is a must, and it needs to be flexible enough to extract each individual host interface status:
Interface status item prototype preprocessing
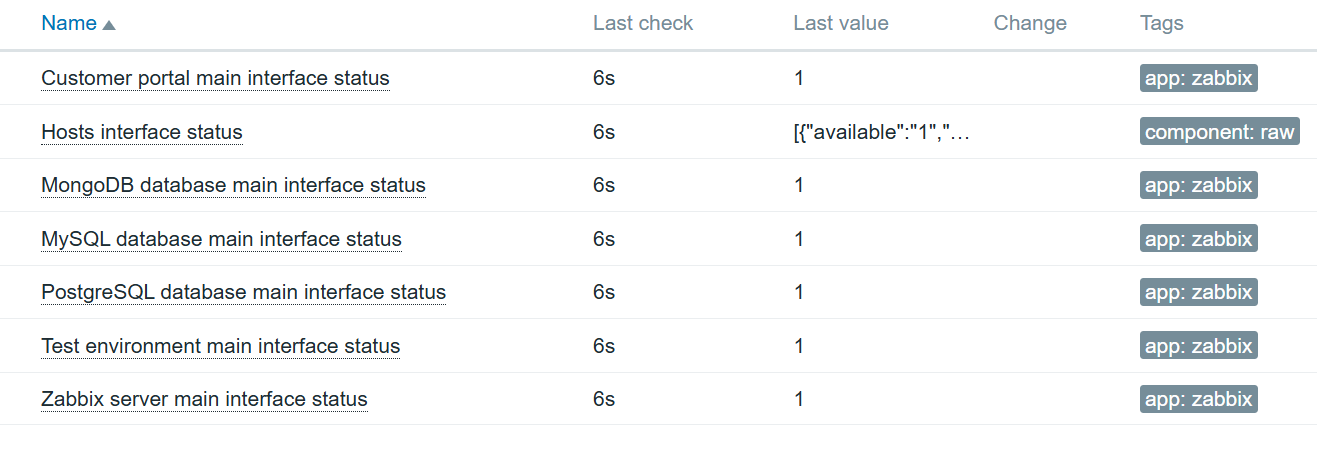
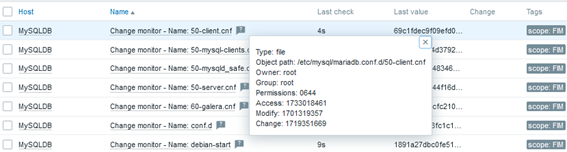
Now after adding the item prototype, we can check the results:
Interface status item data
An item cam be further enhanced using value mapping, to specify that 1 means available and 0 means not available.
With this approach, any internal database data can be extracted and monitored. In part 2 we will see how NoSQL databases can be monitored for both performance and internal data using Zabbix agent 2.
If you’d like more information on database monitoring, please don’t hesitate to sign up for our training course in Advanced Zabbix Database Monitoring, which covers multiple approaches to collecting database-related performance metrics and data using Zabbix Agent 2, ODBC, and API requests, as well as optimizing data collection by introducing dependent low-level discovery for minimal performance impact.
As IT infrastructures grow increasingly complex, efficiently analyzing monitoring data and accelerating incident response have become critical challenges for operations teams. This post explores a few innovative applications of DeepSeek when integrated with Zabbix.
Table of Contents
Requirements:
– Zabbix server 7.0 or higher
– DeepSeek API (Alternatively, other AI APIs can be used if needed)
By integrating DeepSeek Analytics into the Zabbix frontend, users can conduct intelligent alert analysis with just one click. This integration facilitates the swift generation of comprehensive fault analyses and solution suggestions, markedly decreasing the MTTR (Mean Time to Resolution). Consequently, it streamlines the troubleshooting process, alleviates the workload on IT personnel, ensures system stability, and conserves both time and resources.
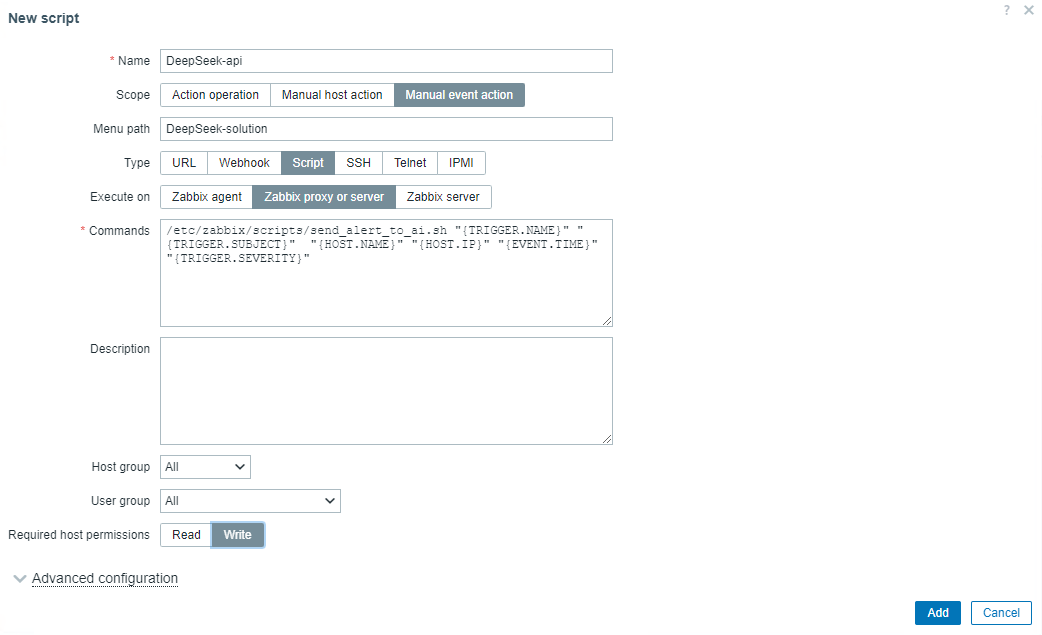
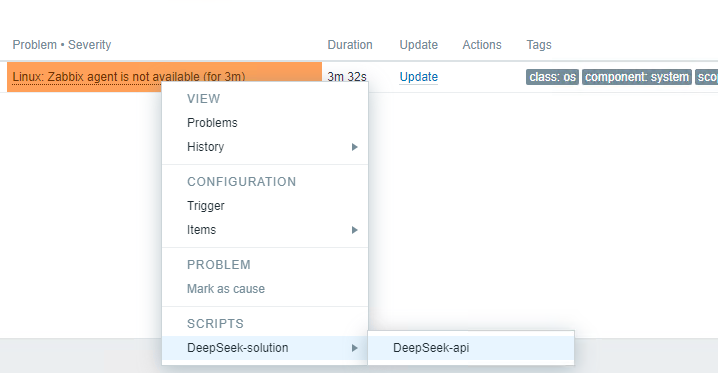
1.1 On the Zabbix home page, navigate to “Alerts” > “Scripts”, and click on the “Create script” button.
1.2 Configuration script:
Name: Can be customized
Scope: Select “Manual event action”
Menu path: Customize menu paths for quick access
Type: Select “Script”
Execute on: Select “Zabbix proxy or server”
1.3 Enter the following command in the command bar:
1.4.1 Modify the Zabbix Server Configuration File and Enable Global Scripts:
Open the Zabbix server configuration file for editing:
vi /etc/zabbix/zabbix_server.conf
Set the EnableGlobalScripts option to 1:
EnableGlobalScripts=1
Save the changes and exit the editor. Then, restart the Zabbix server service to apply the changes:
systemctl restart zabbix-server
1.4.2 Create an API Call Script.
Create a directory for custom scripts if it does not already exist:
mkdir -p /etc/zabbix/scripts && cd /etc/zabbix/scripts
Note: If the frontend prompts that the script file cannot be found, try moving the script to the directory used by the Nginx agent. Create a new script file named send_alert_to_ai.sh:
vi send_alert_to_ai.sh
Add the following content to the script, replacing DeepSeek KEY with your actual API key. Make sure you adjust the API call method if using a different AI service:
#!/bin/bash

# DeepSeek API configuration
API_URL="https://api.deepseek.com/chat/completions"
API_KEY="xxxxxxxxxxxxxxxxxxxx"

# Obtain the parameters to be passed as alarm information
TRIGGER_NAME="$1"
ALERT_SUBJECT="$2"
HOSTNAME="$3"
HOST_IP="$4"
EVENT_TIME="$5"
TRIGGER_SEVERITY="$6"

# Build a more concise JSON format for alarm information
alert_info=$(cat <<EOF
{
"model": "deepseek-chat",
"messages": [
{"role": "system", "content": "You are an assistant focused on responding quickly to system alarms。"},
{"role": "user", "content": "The following alarm information is received:\n\n: $TRIGGER_NAME\n: $ALERT_SUBJECT\n: $HOSTNAME\n: $HOST_IP\n: $EVENT_TIME\n: $TRIGGER_SEVERITY\n\nPlease tell me the cause of the alarm and the handling measures in a short and professional language with a word limit of 300 words。"}
],
"stream": false
}
EOF
)

# Send the POST request and capture the response and HTTP status code
response=$(curl -s -w "\n%{http_code}" -X POST "$API_URL" \
-H "Content-Type: application/json" \
-H "Authorization: Bearer $API_KEY" \
-d "$alert_info")

# Separate HTTP status codes from response bodies
http_code=$(echo "$response" | tail -n1)
response_body=$(echo "$response" | sed '$d')

# Parse and extract the content field
if [ "$http_code" -eq 200 ]; then
# Parse JSON using the jq tool
if ! command -v jq &> /dev/null; then
echo "jq could not be found, please install it first."
exit 1
fi

# Extract the content field and format the output
content=$(echo "$response_body" | jq -r '.choices[0].message.content')
echo -e "Analysis result:\n$content"
else
echo "failure: HTTP status code $http_code, respond: $response_body"
fi
Make the script executable:
chmod +x send_alert_to_ai.sh
Note: The script provided invokes the official DeepSeek API. Replace DeepSeek KEY with your actual API_KEY. If you are using another AI service, please confirm the appropriate API invocation method.
Important Notes:
Note: The script relies on jq to process and parse JSON data for tasks such as filtering, mapping, aggregating, and formatting. If jq is not installed on your system, follow these instructions to install it.
For Debian/Ubuntu Systems:
apt-get update apt-get install jq
For CentOS/RHEL Systems:
yum install epel-release yum install jq
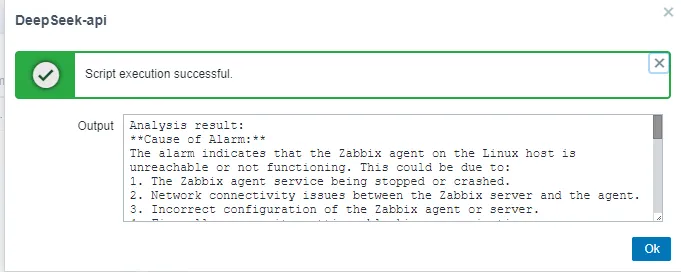
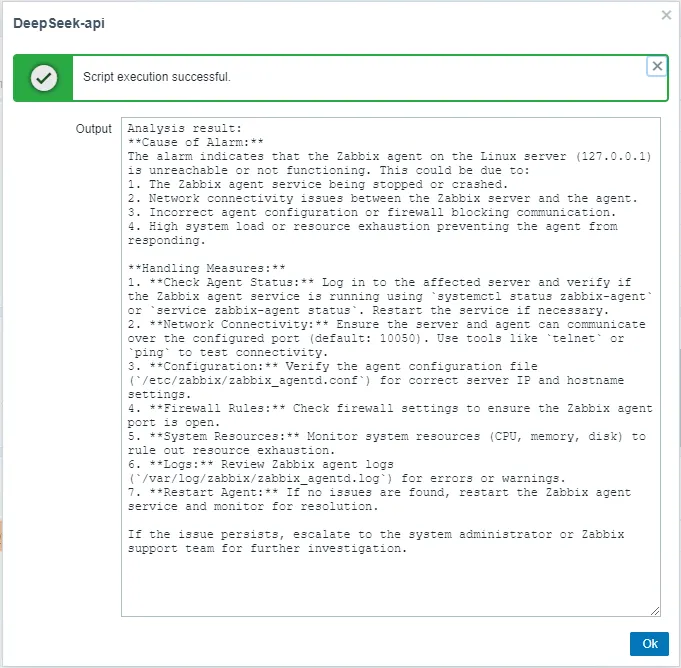
1.5 Actual Effect Display:
1.6 Optional Optimization Items.
1.6.1 Adjust Output Box Size for Better Browsing.
After executing the script, you may find that the output box is too small and inconvenient to browse. To optimize this, you can modify the front-end CSS file as follows.
Back up the existing CSS File:
cd /usr/share/nginx/html/assets/styles/
cp blue-theme.css blue-theme.css.bak
Edit the CSS File:
vi /usr/share/nginx/html/assets/styles/blue-theme.css
Add Custom Styles at the End of the File.
Add the following CSS rules to adjust the size and behavior of the output box:
#execution-output { height: 500px; /* Adjust to your desired height */ width: 540px; /* Optional: Adjust the width as required */ overflow-y: auto; /* Displays scrollbar when content exceeds the set height */ }
Save and exit the editor. At this point, clear the browser cache and reload the page to see the changes take effect.
1.6.2 How to Optimize Slow Output Response after Executing the One-Click Analysis Script.
During actual testing, it was estimated that returning a 300-word result takes approximately 20 to 30 seconds. While you can improve the response speed by adjusting the preset prompt words in the script, this approach may reduce the richness of the analysis content. Therefore, it is recommended to balance speed and content depth by adjusting the number of replies in the script’s prompt words according to your actual needs.
Actual effect display:
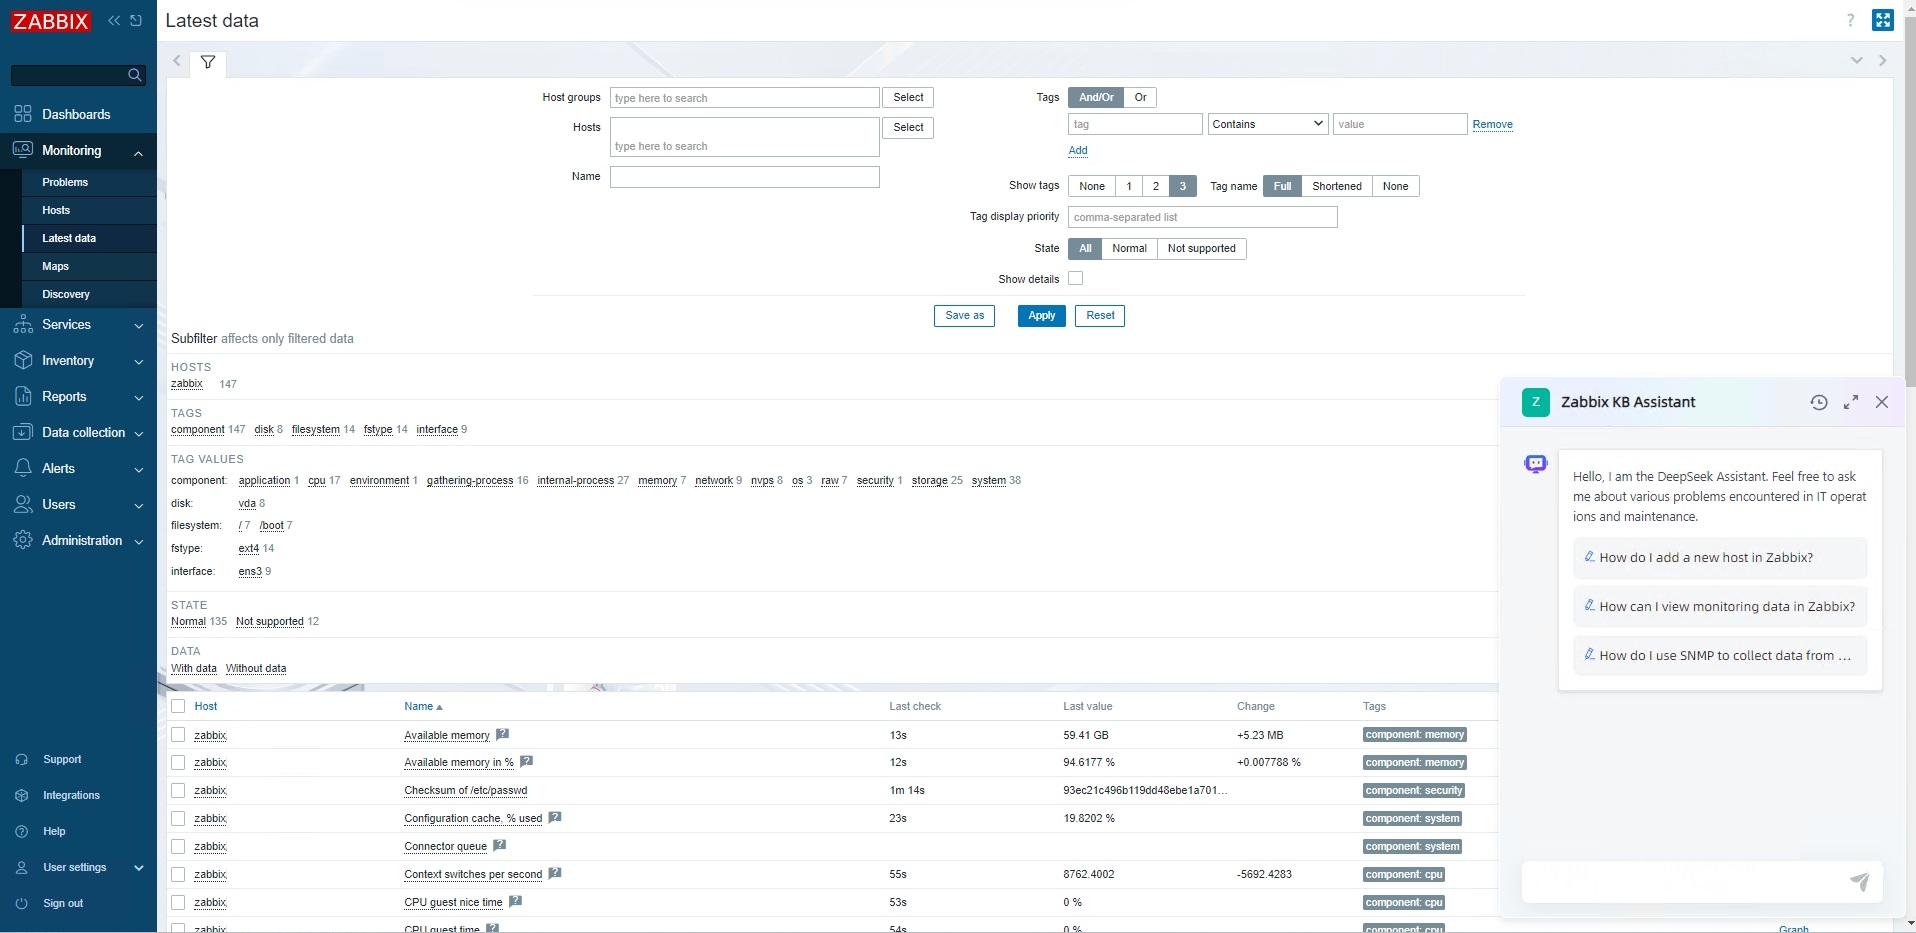
2. Scenario Two: Zabbix Documentation Knowledge Base Assistant
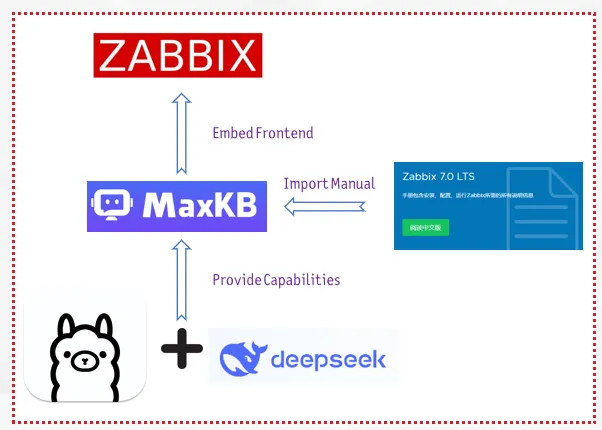
In today’s fast-paced IT environment, managing and retrieving information efficiently is crucial. To address this need, we’ve developed the Zabbix KB Assistant, an intelligent knowledge base solution built on MaxKB—an open-source Q&A system leveraging large language models.
This assistant streamlines access to Zabbix’s extensive documentation, making it easier than ever for users to find the information they require.
MaxKB stands out for its seamless integration capabilities, allowing for quick uploads of documents and automatic crawling of online content.
Its flexibility means it can be effortlessly embedded into third-party systems, including our very own Zabbix platform. The project is available at the GitHub repository.
The development process of Zabbix KB Assistant involved configuring MaxKB to recognize and parse the official Zabbix documentation. By utilizing this URL, we ensured that the latest updates and comprehensive guides are always accessible within our assistant. After setting up the core model configurations, we created a dedicated knowledge base tailored to Zabbix’s rich content.
With the knowledge base in place, we proceeded to integrate Zabbix KB Assistant into the Zabbix frontend. This step was essential for providing instant access to users navigating the Zabbix interface. By embedding a floating window mode, users can interact with the assistant without leaving their current page—a feature that significantly enhances user experience.
Actual effect display:
3. Scenario Three: DingTalk Alert Enhancement
By integrating DeepSeek’s deep analysis capabilities, DingTalk can automatically analyze alarm information upon receiving alerts. This integration provides precise fault diagnosis and solutions, aiding IT operations and maintenance personnel in quickly identifying and resolving issues. Consequently, this improves the efficiency of system maintenance and reduces downtime.
3.1 Create a Bot and Configure Security Settings.
First, create a new bot within the DingTalk group and ensure that the keyword “Alarm” is properly configured in the security settings. Next, retrieve the webhook URL for this bot and keep it safe for later use.
3.2 Install Python3 and Necessary Libraries.
Ensure that Python3 along with the required libraries are installed on your system. Depending on your operating system, follow these instructions.
3.3 Below is an example script (deepseekdingding.py) located at /usr/lib/zabbix/alertscripts/.
Replace the placeholder webhook URL and DeepSeek API key in the script with your actual values:
#!/usr/bin/env python3
#coding:utf-8
import requests
import sys
import json
class DingTalkBot(object):
# Send an alarm
def send_news_message(self, webhook_url, subject, content, ai_response):
url = webhook_url
data = {
"msgtype": "markdown",
"markdown": {
"title": subject,
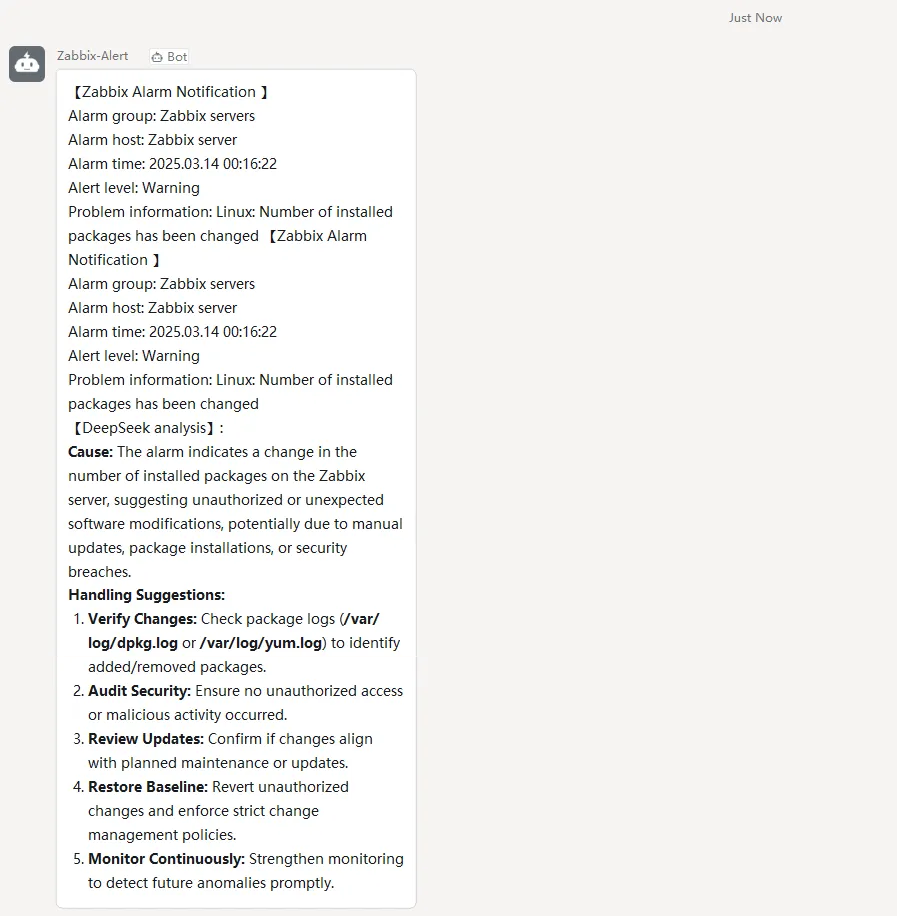
"text": f"{subject}\n{content}\n\n【DeepSeek analysis】:\n\n{ai_response}"
}
}
headers = {'Content-Type': 'application/json'}
response = requests.post(url, headers=headers, data=json.dumps(data))
return response
if __name__ == '__main__':
WEBHOOK_URL = 'https://oapi.dingtalk.com/robot/send?access_token=224c1ff0c6df60a809b3c5b69b8448486b780d292e9d395ac8fbf84980214e30' # Webhook
API_URL = 'https://api.deepseek.com/chat/completions'
API_KEY = "xxxxxxxxxxxxxxxxxxxx" # DeepSeek API
if len(sys.argv) < 3:
print("Error: Not enough arguments provided.")
sys.exit(1)
subject = str(sys.argv[1])
content = str(sys.argv[2])
print(f"Received subject: {subject}")
print(f"Received content: {content}")
try:
headers = {
'Authorization': f'Bearer {API_KEY}',
'Content-Type': 'application/json',
}
payload = {
"model": "deepseek-chat", # DeepSeek
"messages": [
{"role": "user", "content": f"If you are a professional IT operation and maintenance expert, please tell me the cause of these alarms and handling suggestions in a concise and professional language with a word limit of 100 words{content}"}
]
}
ai_response = requests.post(API_URL, headers=headers, json=payload)
ai_response.raise_for_status()
ai_response_content = ai_response.json().get('choices', [{}])[0].get('message', {}).get('content', '')
except Exception as e:
ai_response_content = "\nThe interface call timed out or an error occurred. Please check the configuration and try again"
bot = DingTalkBot()
response = bot.send_news_message(WEBHOOK_URL, subject, content, ai_response_content)
if response.status_code == 200:
print("successfully")
else:
print(f"failed: {response.text}")
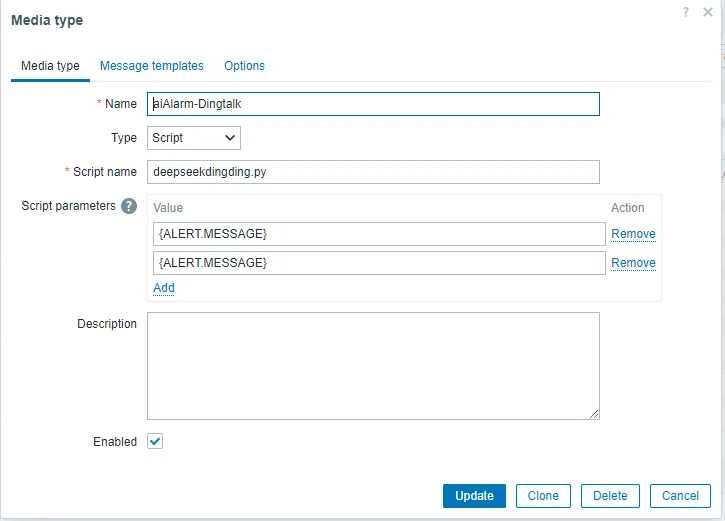
3.5 On the Zabbix home page, go to Alerts – Media types – Create Media type and then enter the following information:
Name: aiAlarm-Dingtalk
Type: script
Script name: deepseekdingding.py
Script parameter: {ALERT.MESSAGE} {ALERT.SUBJECT}
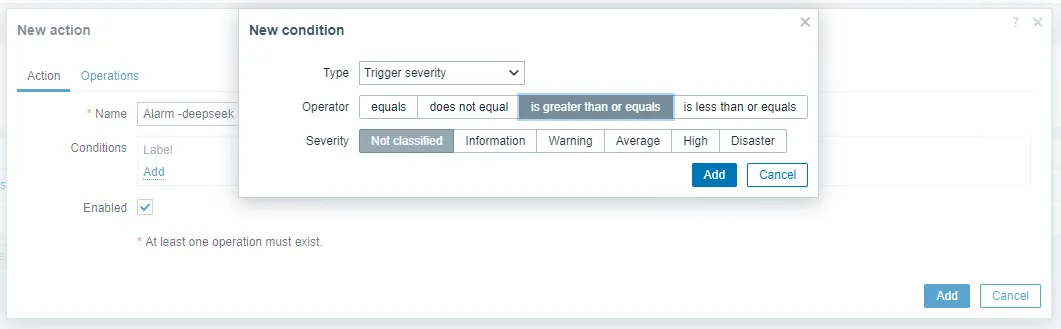
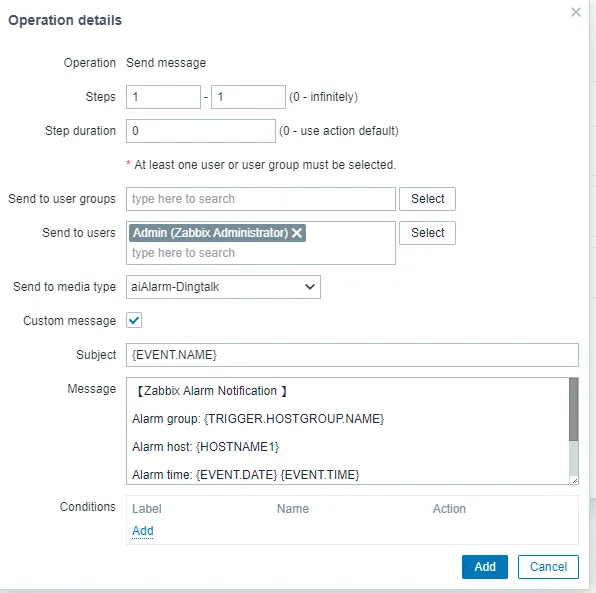
3.6 Create an alarm action.
Go to Alarm – Action – Trigger actions – Create action and set the name to Alarm -deepseek. Select this parameter as required:
Edit the action options as follows:
Send to media type aiAlarm-Dingtalk
Topic fault alarm: {EVENT.NAME}
message
【Zabbix Alarm Notification 】

Alarm group: {TRIGGER.HOSTGROUP.NAME}

Alarm host: {HOSTNAME1}

Alarm time: {EVENT.DATE} {EVENT.TIME}

Alert level: {TRIGGER.SEVERITY}

Problem information: {TRIGGER.NAME}
Confirm the update.
3.7 Configure notification rights for users.
The following item is added to the “User-User-Alarm” media dialog box. Once added, click Update.
Actual effect display:
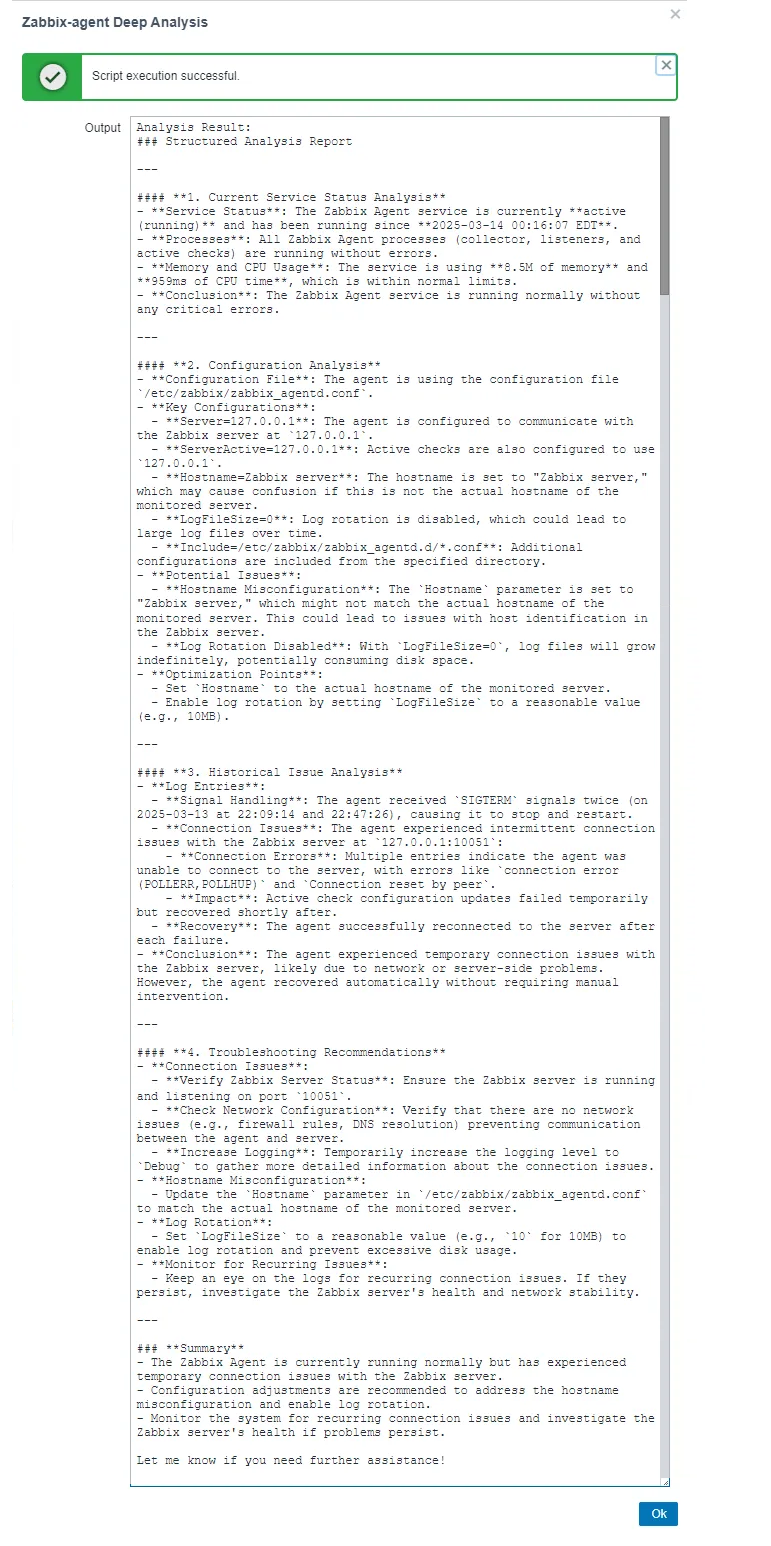
4. Scenario Four: One-Click System Service Deep Analysis
Our solution integrates DeepSeek analysis to offer a one-click intelligent inspection tool that automates the collection of service configurations, logs, and status from within your system. This information is then sent via API to DeepSeek for comprehensive analysis.
Our approach begins by extracting relevant configuration data, recent log entries, and current service statuses. These pieces of information are combined with predefined prompts and submitted to DeepSeek through its API. For instance, a prompt might look like this:
“Here are the current logs for XXX service:\n\n${recent_logs}\n\nService. Status is as follows:\n${service_status}\n. Please analyze the following four aspects based on this information and provide a concise report within 500 words: service status analysis, configuration review, historical issue examination, and troubleshooting recommendations.”
DeepSeek processes this input to perform a detailed breakdown across these four areas, delivering structured feedback and actionable insights.
This integration offers deep system analysis and precise optimization suggestions, enabling swift responses to system changes or anomalies. It aids administrators in promptly identifying and addressing issues.
In addition, it’s easily integrated into existing monitoring systems, allowing adjustments to the depth and scope of analysis as needed. The solution boasts high scalability and flexibility, catering to evolving business requirements.
Dashboard widgets have received substantial improvements in the latest Zabbix releases – everything from brand-new widgets to greatly expanding upon existing widget features. The post will cover some of the new improvements as well as lesser-known dashboard and widget features, while discussing multiple dashboard use cases targeted at large organizations and MSPs.
Table of Contents
Broadcast and listen capabilities
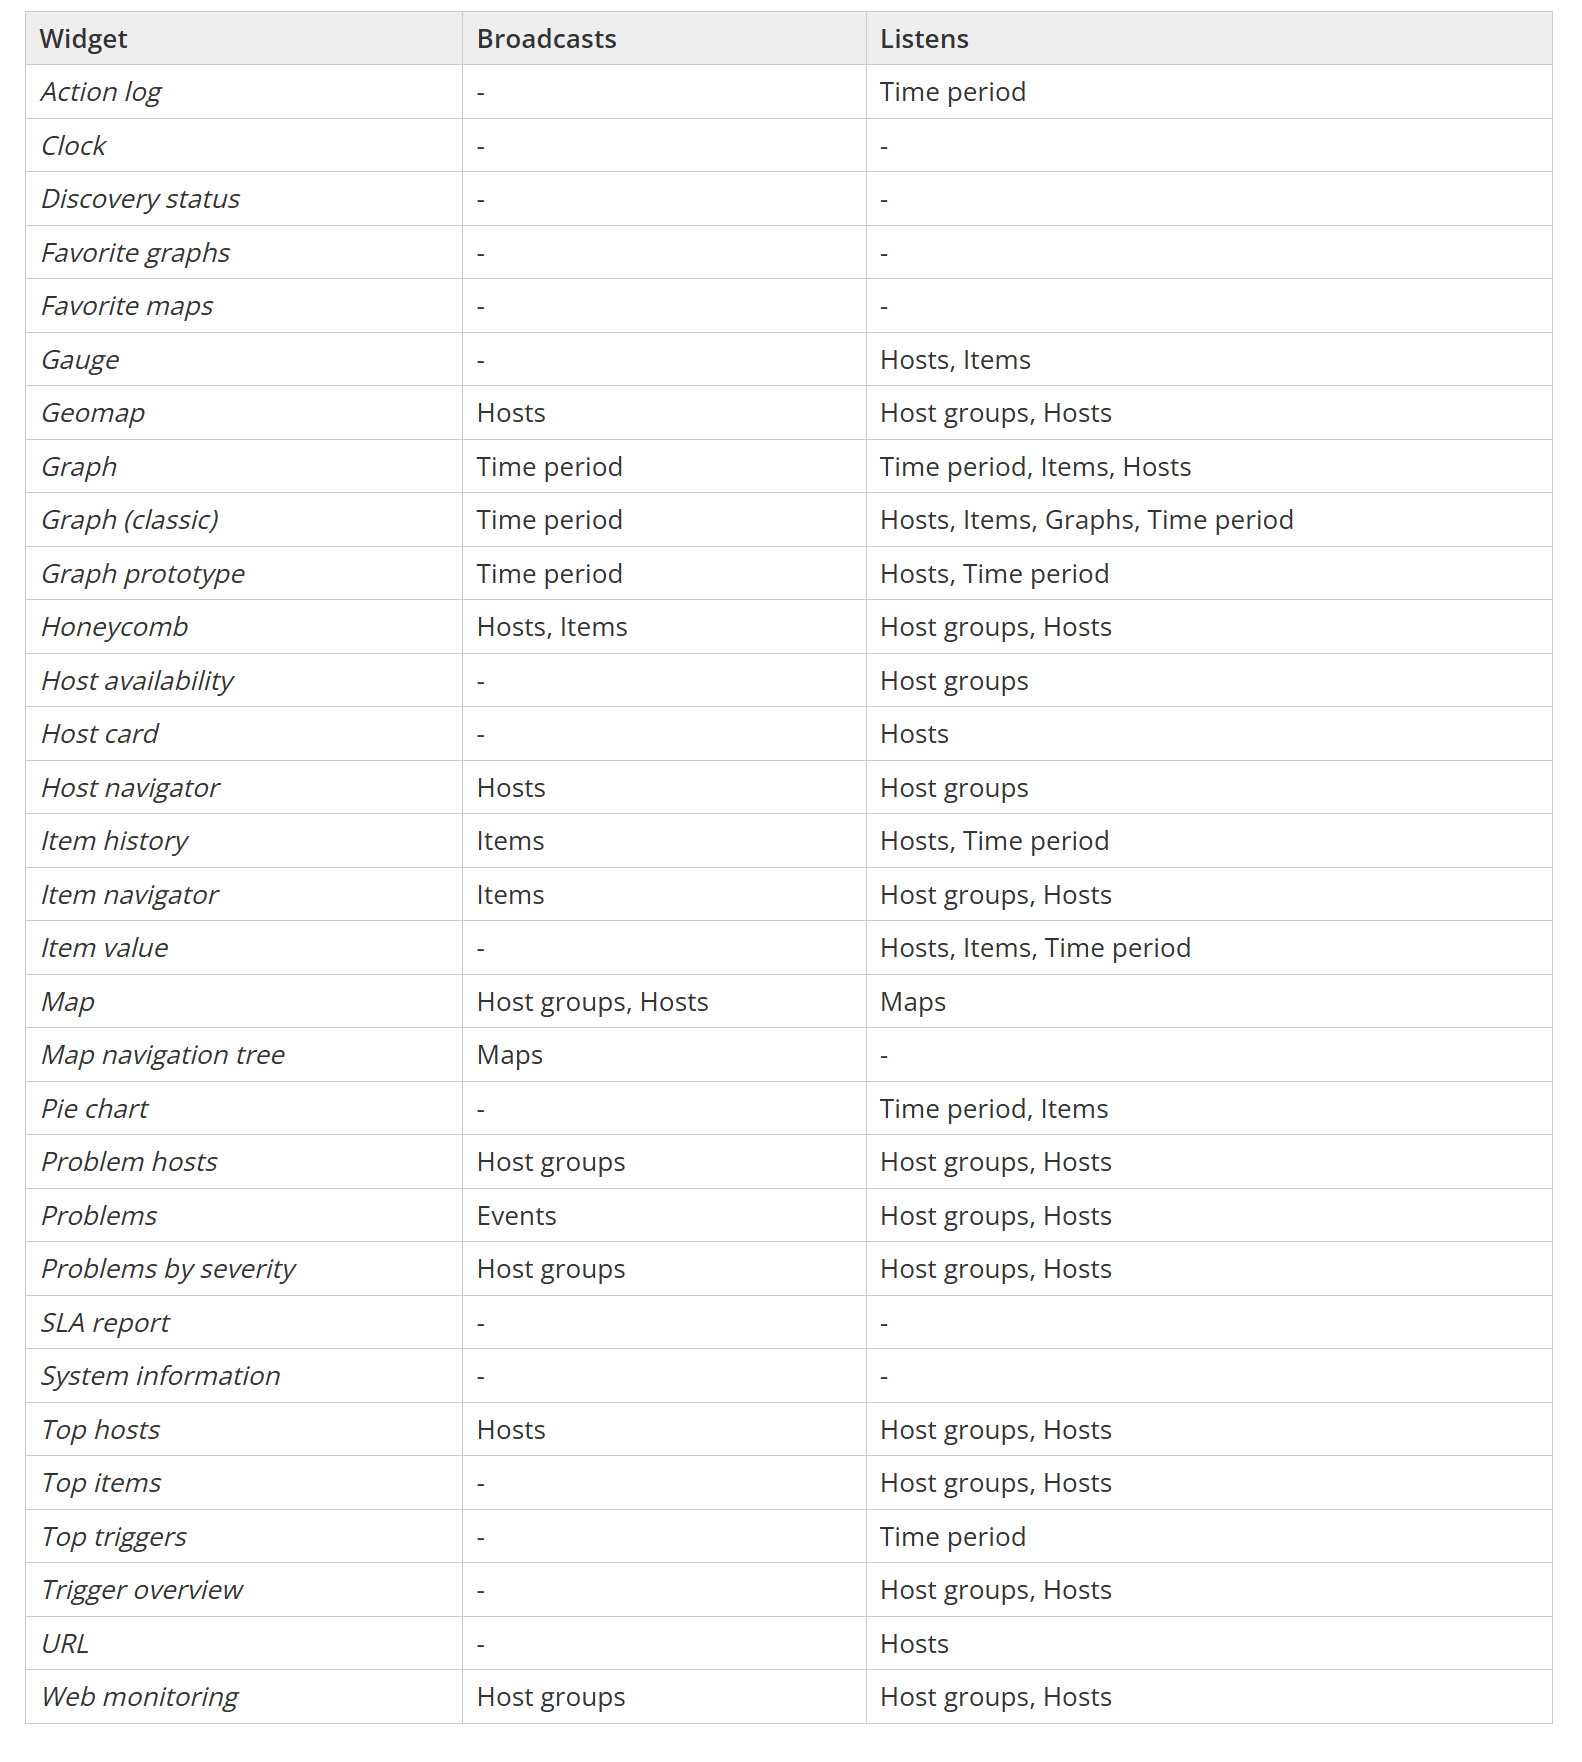
Zabbix widgets can be used to not only display static data, but they can also be linked together by using widget broadcast and listen capabilities. Depending on the built-in capabilities, widgets can either broadcast data (such as the item, host, event, or time interval selected in the widget) or listen and display the selected data points – multiple widgets support both broadcast and listen capabilities.
Widgets can broadcast and listen for the following entities:
Hosts
Host groups
Time periods
Items
Events
Maps
Zabbix documentation contains the full list of widget broadcast and listen capabilities.
Widget broadcast and listen capabilities
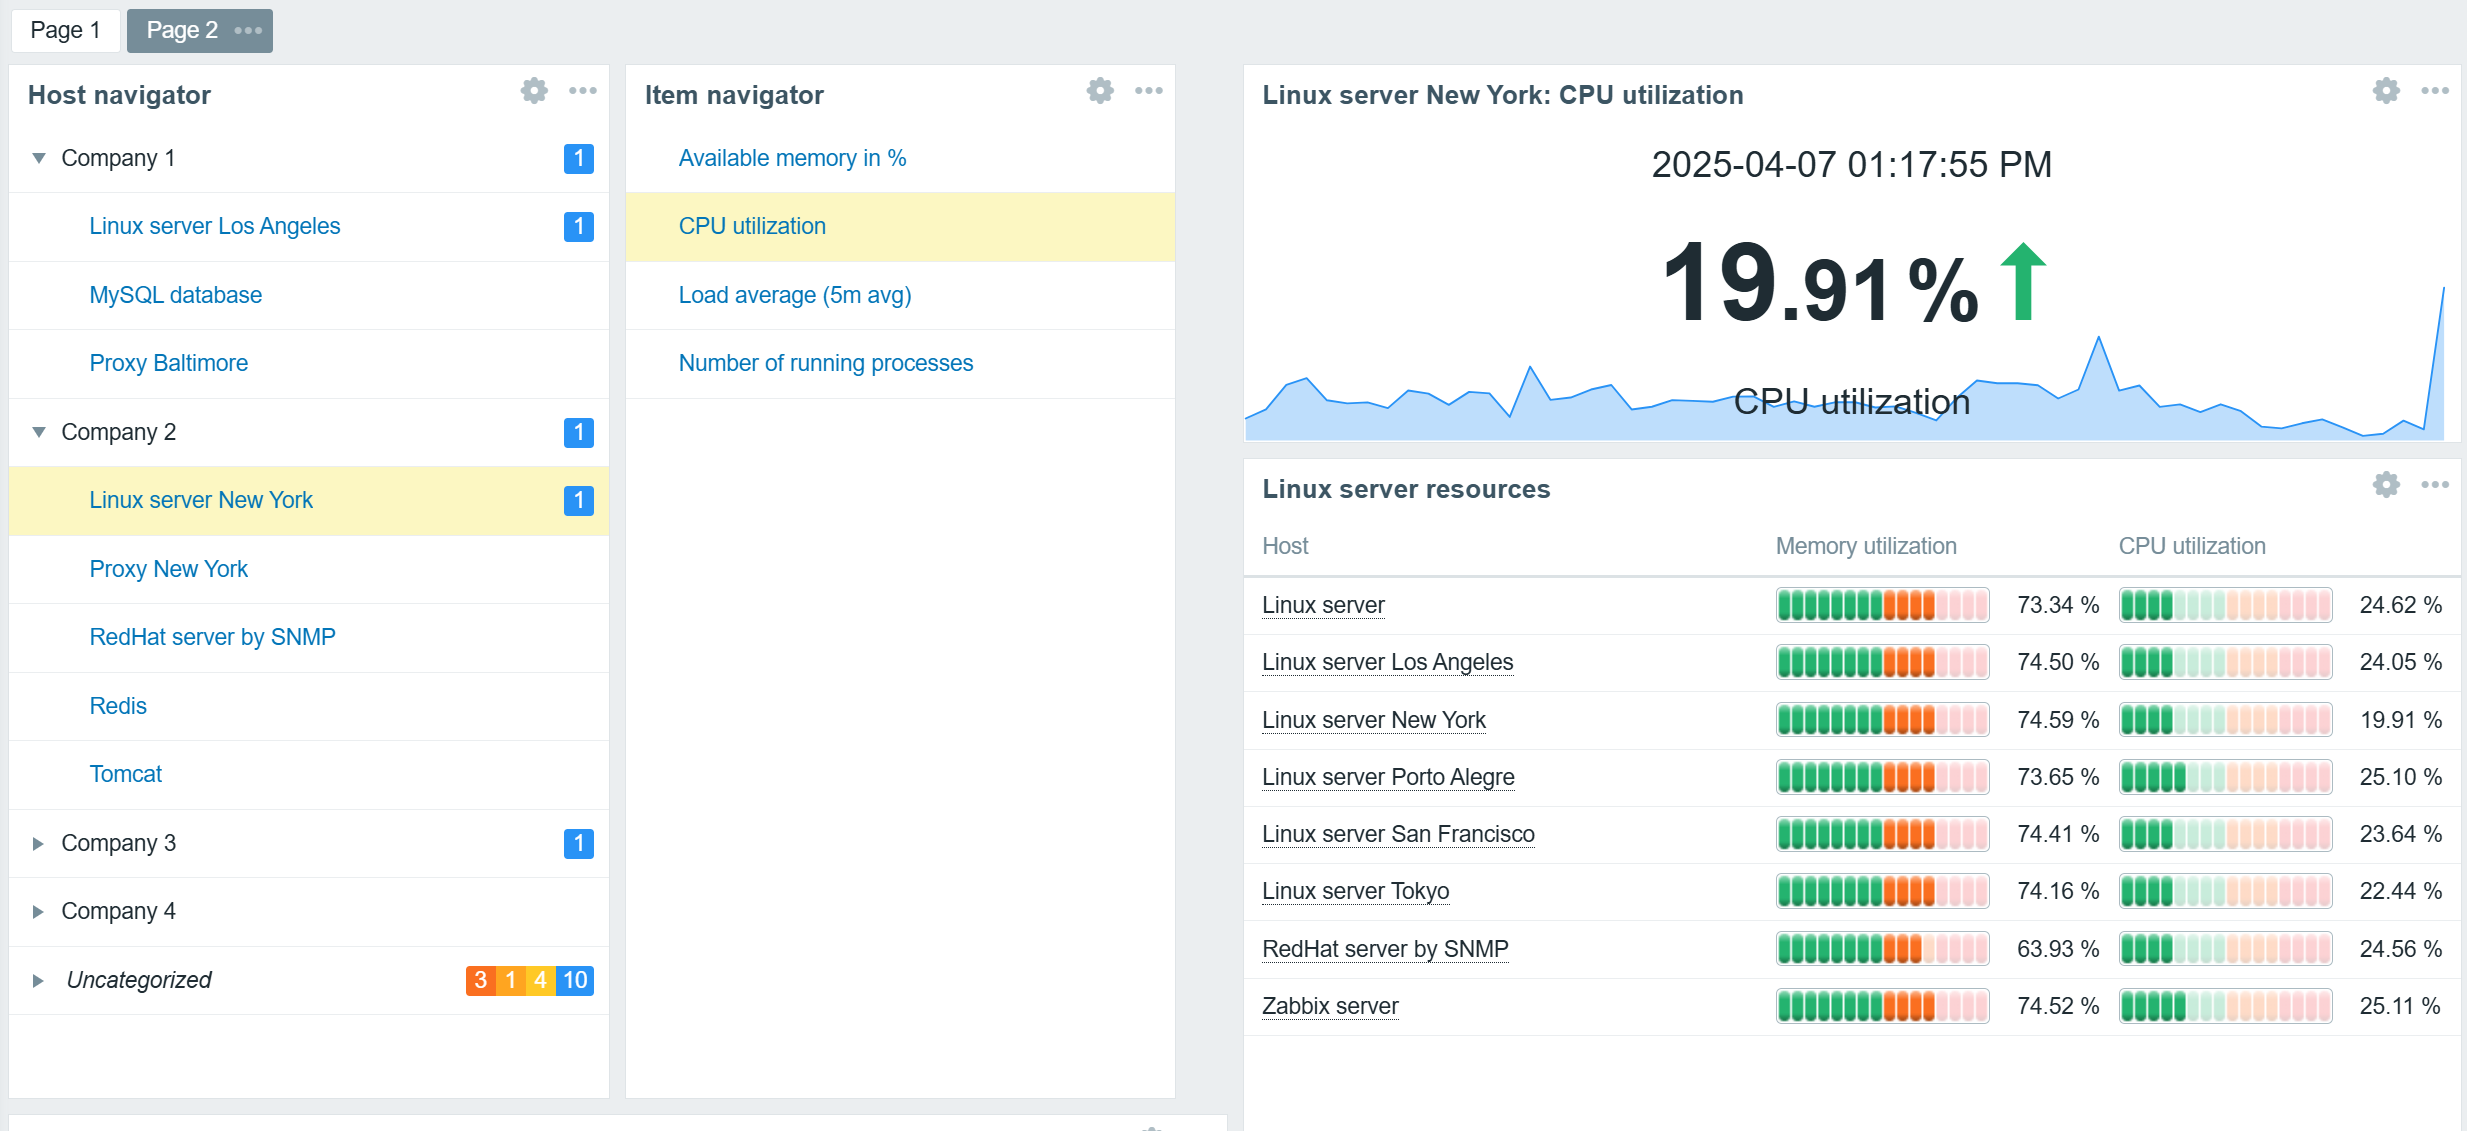
Navigator widgets
Host and Item navigator widgets serve as simple examples of broadcast widgets. The sole purpose of these widgets is to display an organized, interactive list of hosts or items. The selected hosts and items can be broadcast to other widgets such as graphs, gauges, problem widgets, an item value widget, and many others.
In addition to regular widget filters based on hosts, host groups, and tags, navigator widgets can be configured to group hosts or items based on tags, host groups, and existing problem severities. This can be used to provide an organized overview of hosts or items based on MSP clients, organization departments, and any other grouping.
Hosts grouped by MSP clients based on host group names
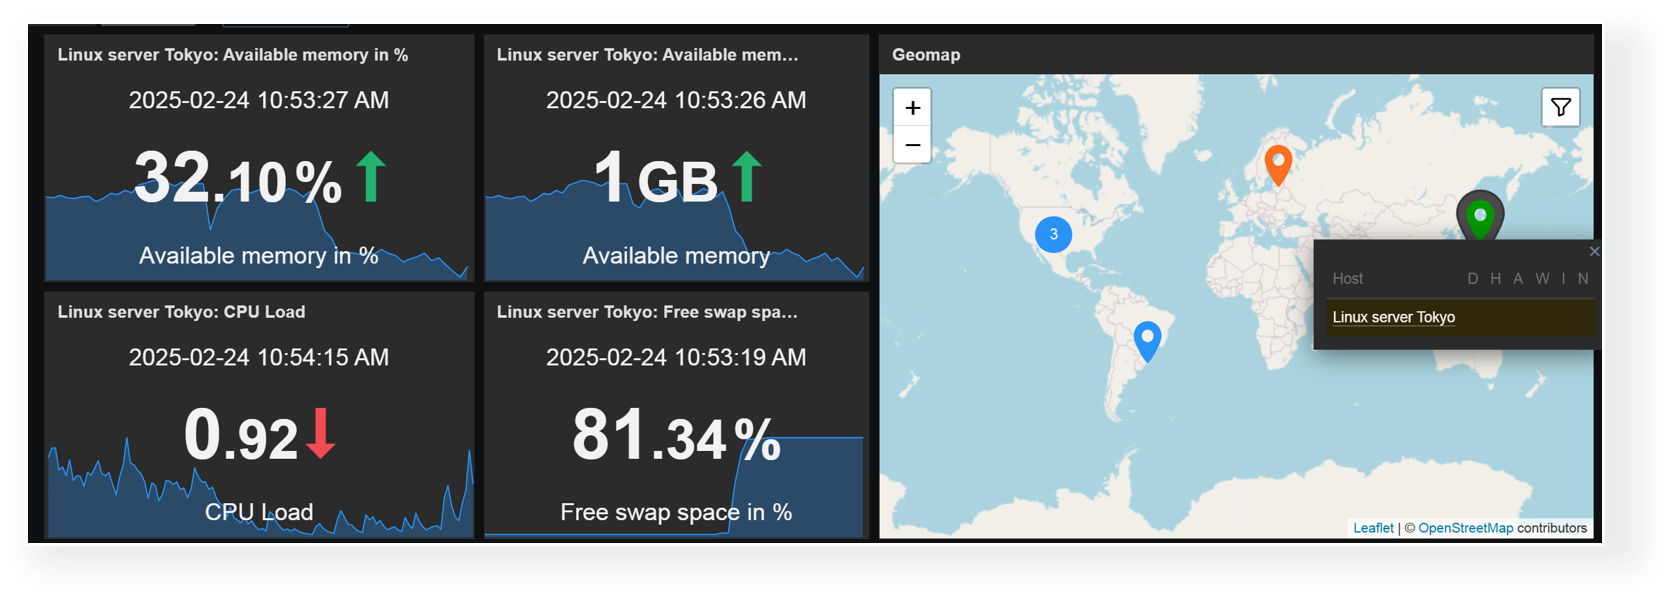
Any combination of widgets from the above table can be used to create interactive dashboards. For example, you could combine the Item value widget listen capabilities with the Geomap widget broadcast capabilities to display item values for hosts selected on the Geomap.
Broadcast hosts from the Geomap widget to Item value widgets
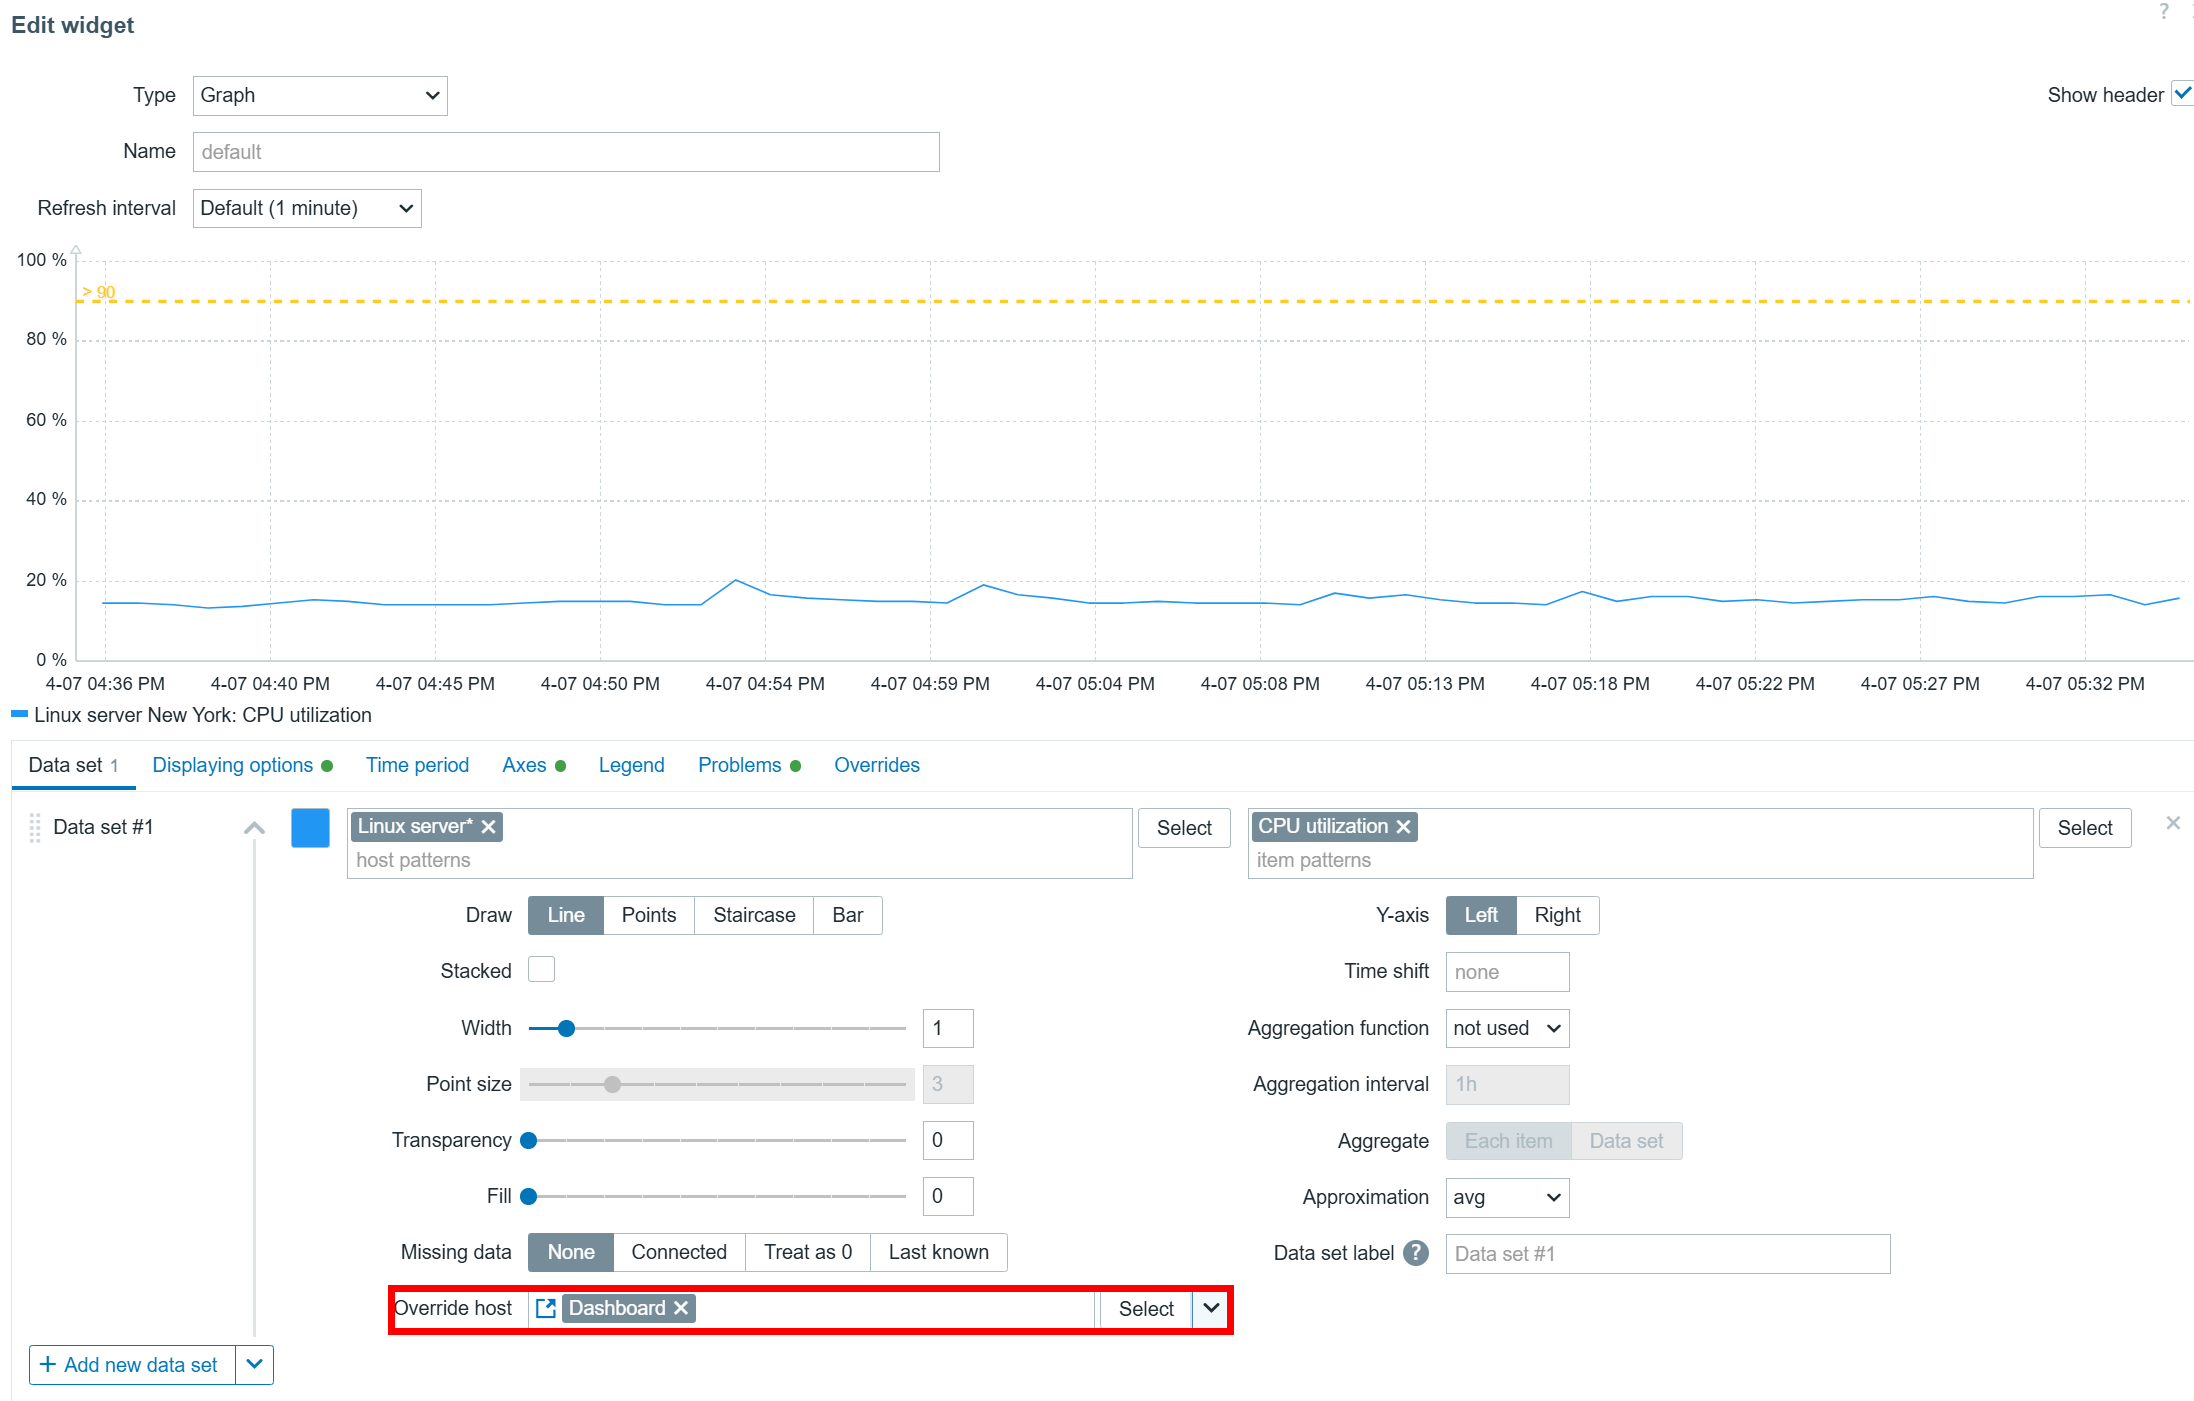
Dashboard-level host broadcast
Host overrides can also be performed on a dashboard level. Once you have set the Override host setting in your widgets to Dashboard, you can select the host in the top right corner of the dashboard. After the host is selected, the widgets will start displaying information related to the selected host.
Host information can also be broadcast on Dashboard level
Selecting non-existing items
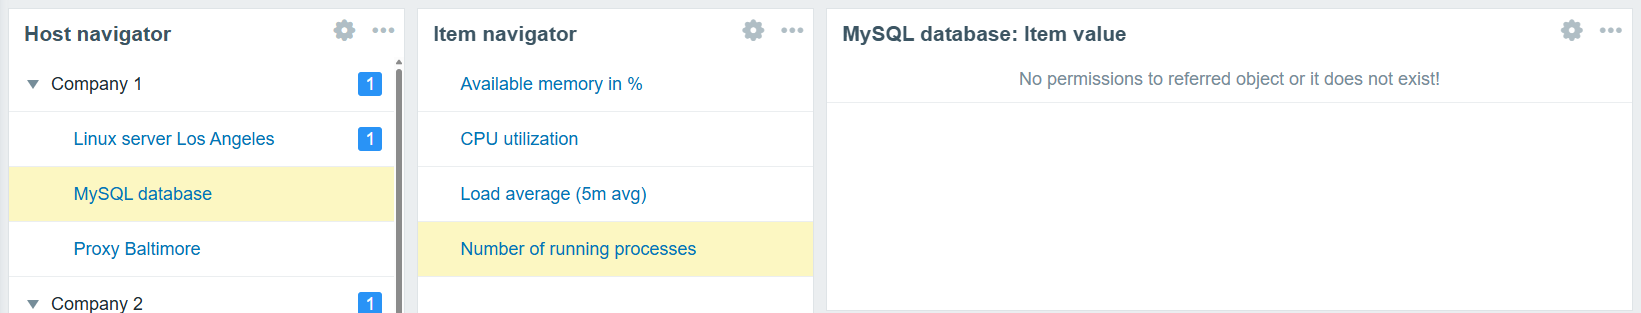
One final thing you should consider when implementing widgets with host/item sources from broadcast widgets is what happens if the selected item does not exist on the selected host. In that case, your widget will display a message “No permission to referred object or it does not exist!” – the same error message the users will see if they lack the read permissions on an item. Ideally, you’d want to define widget filters and broadcast/listen configuration in a way where such errors can be avoided – especially if Zabbix is used as a central monitoring hub for users from multiple departments or organizations.
The item value widget displays an error message since the selected item does not exist on the selected host
Advanced graph widget use cases
The Zabbix graph widget has a variety of advanced features that can enable many new use cases and provide new insights based on the collected item values.
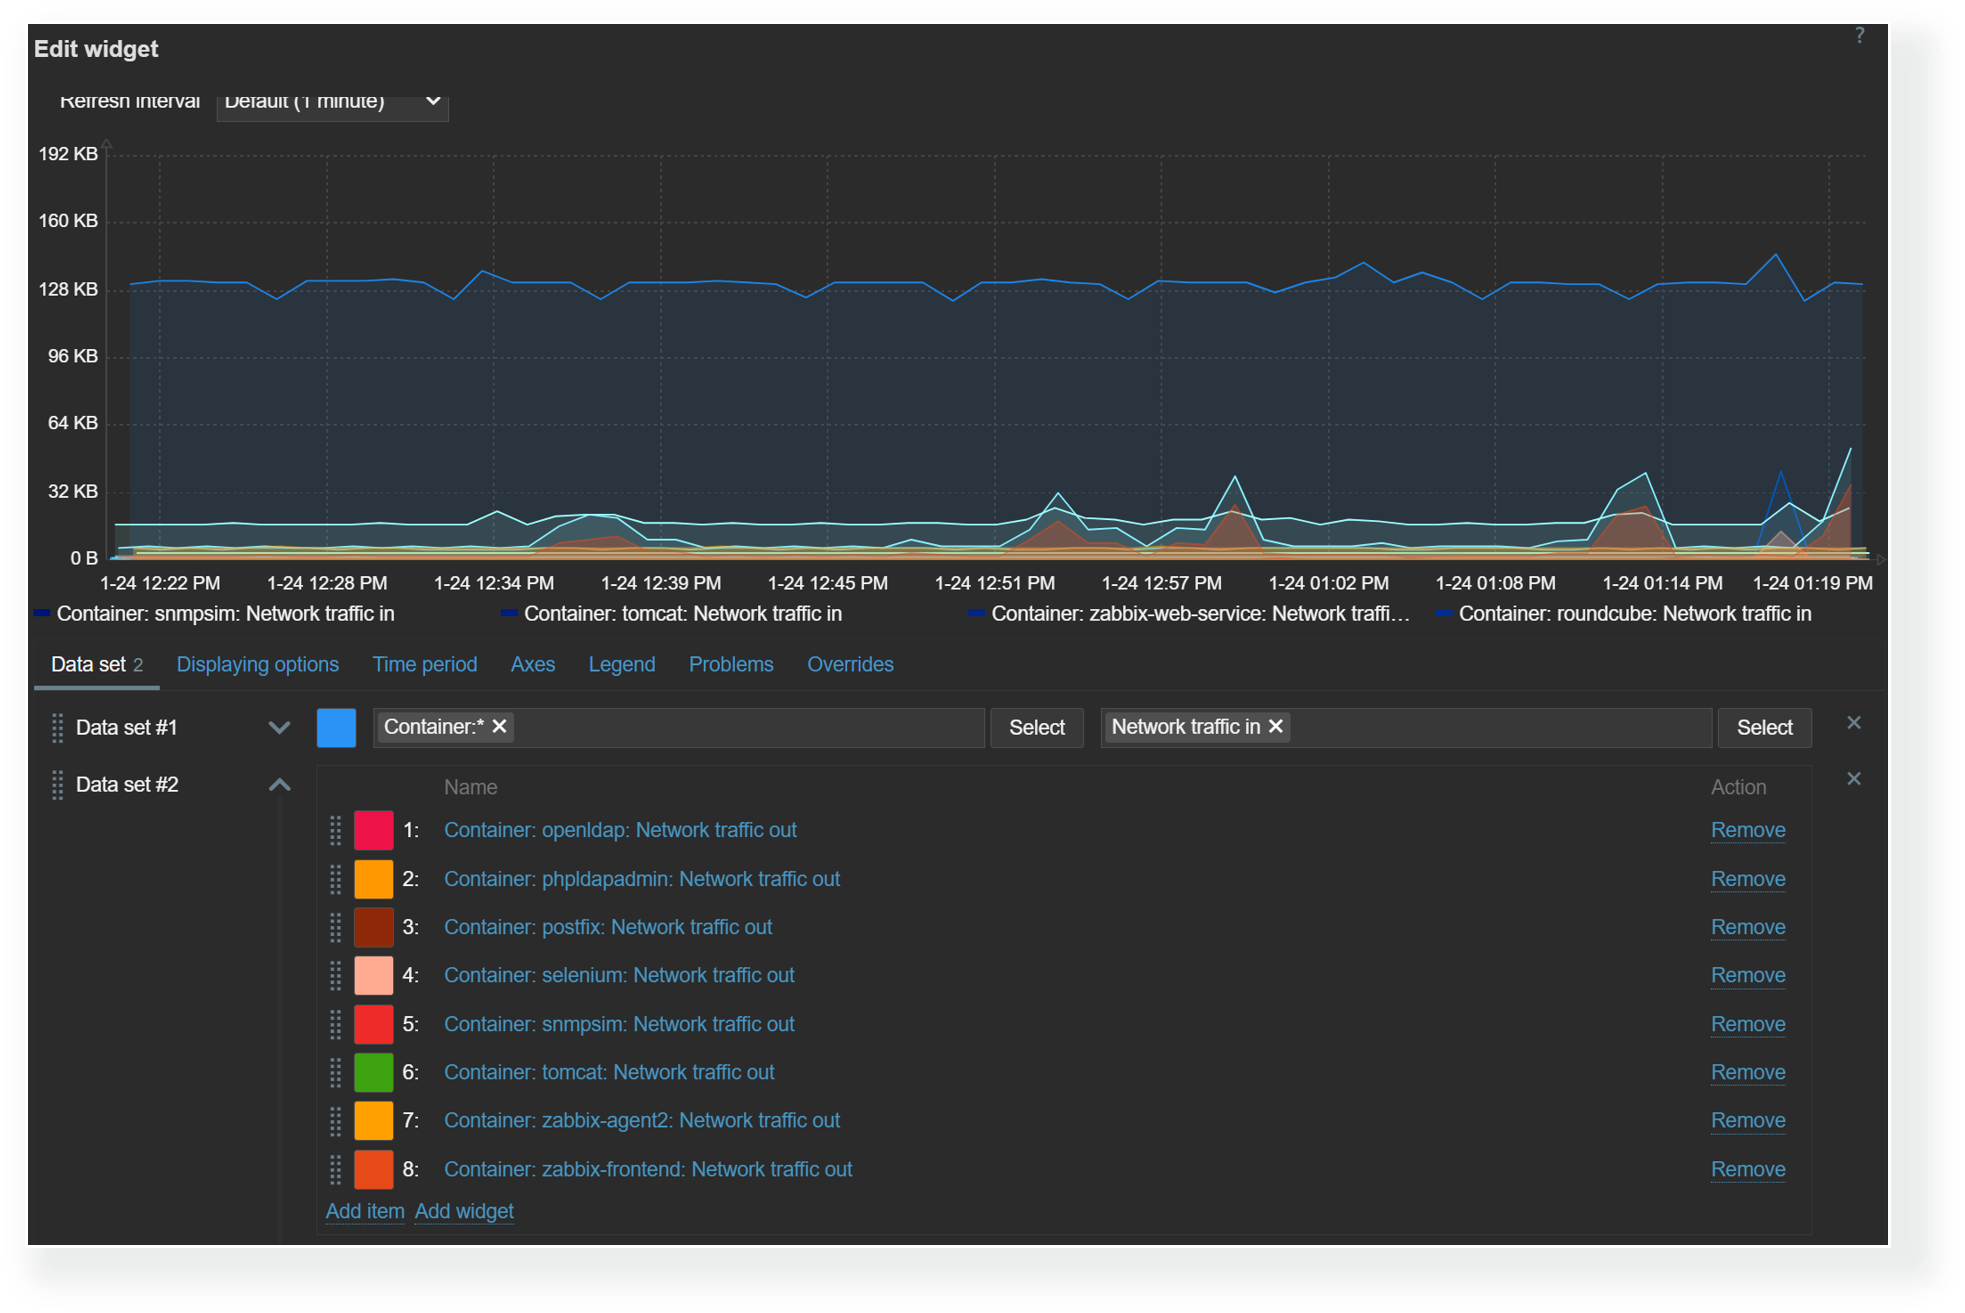
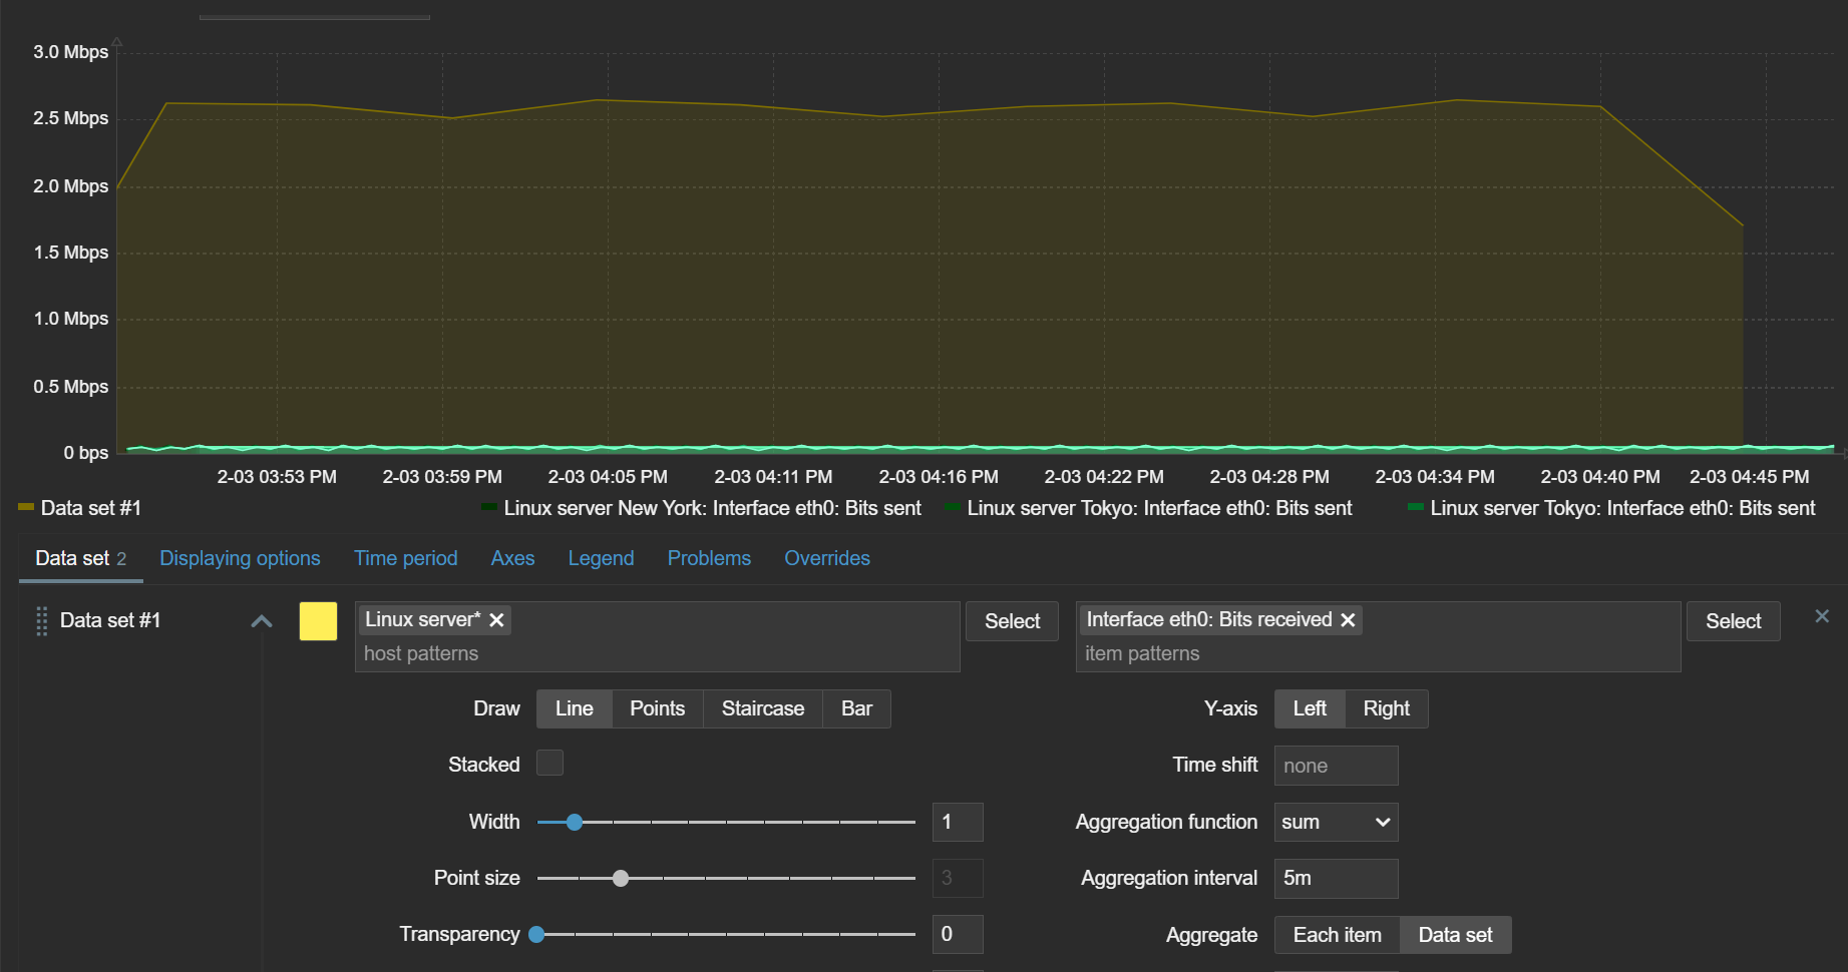
Data sets
The graph widget utilizes data sets to select, match, and group items that would be displayed in the graph. There are two types of data sets – item pattern and item list. When using item list data sets, you have to individually select each item that you wish to display on the graph. On the other hand, item pattern data sets provide more flexibility. Here we can utilize wildcards in host and item names to match items and hosts by name. This is especially useful for items discovered by low-level discovery in dynamic environments. With item pattern data sets, the addition or removal of items matching the pattern will be automatically reflected in the graph.
Item list and item pattern data sets in the graph widget
Trigger and problem display
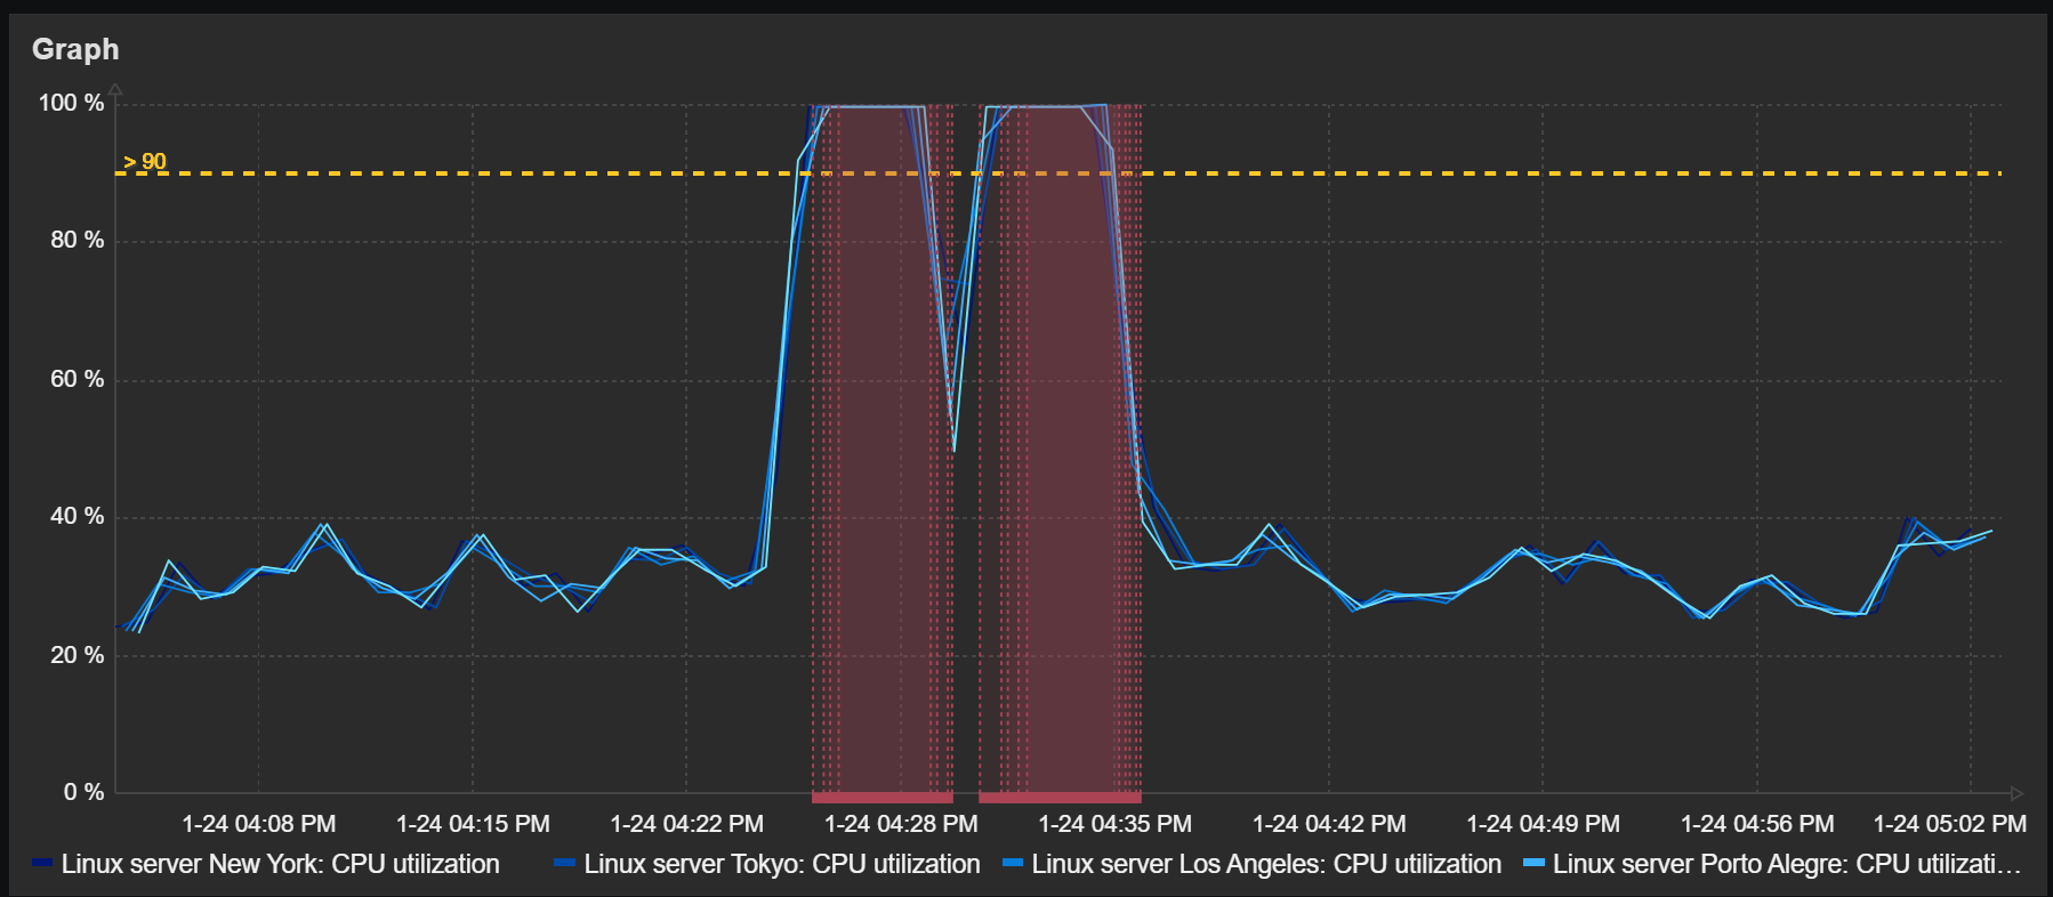
Detected problems and trigger thresholds can also be displayed in dashboard graph widgets. The time periods during which a trigger related to the displayed items has been in a problem state will be highlighted in red. The graphs also provide an option to display a trigger line for triggers utilizing last, min, max, and avg functions.
Graph widget can display a trigger line and highlight periods during which a problem was active
Aggregation
The ability to aggregate data directly within the widget can be an extremely useful tool for gaining new insights from existing data. With graph widget aggregations, it is possible to aggregate each individual item (for example, displaying hourly averages for network traffic on each interface) or the whole data set (total hourly traffic from all interfaces).
Aggregations can be performed on each item or the whole data set
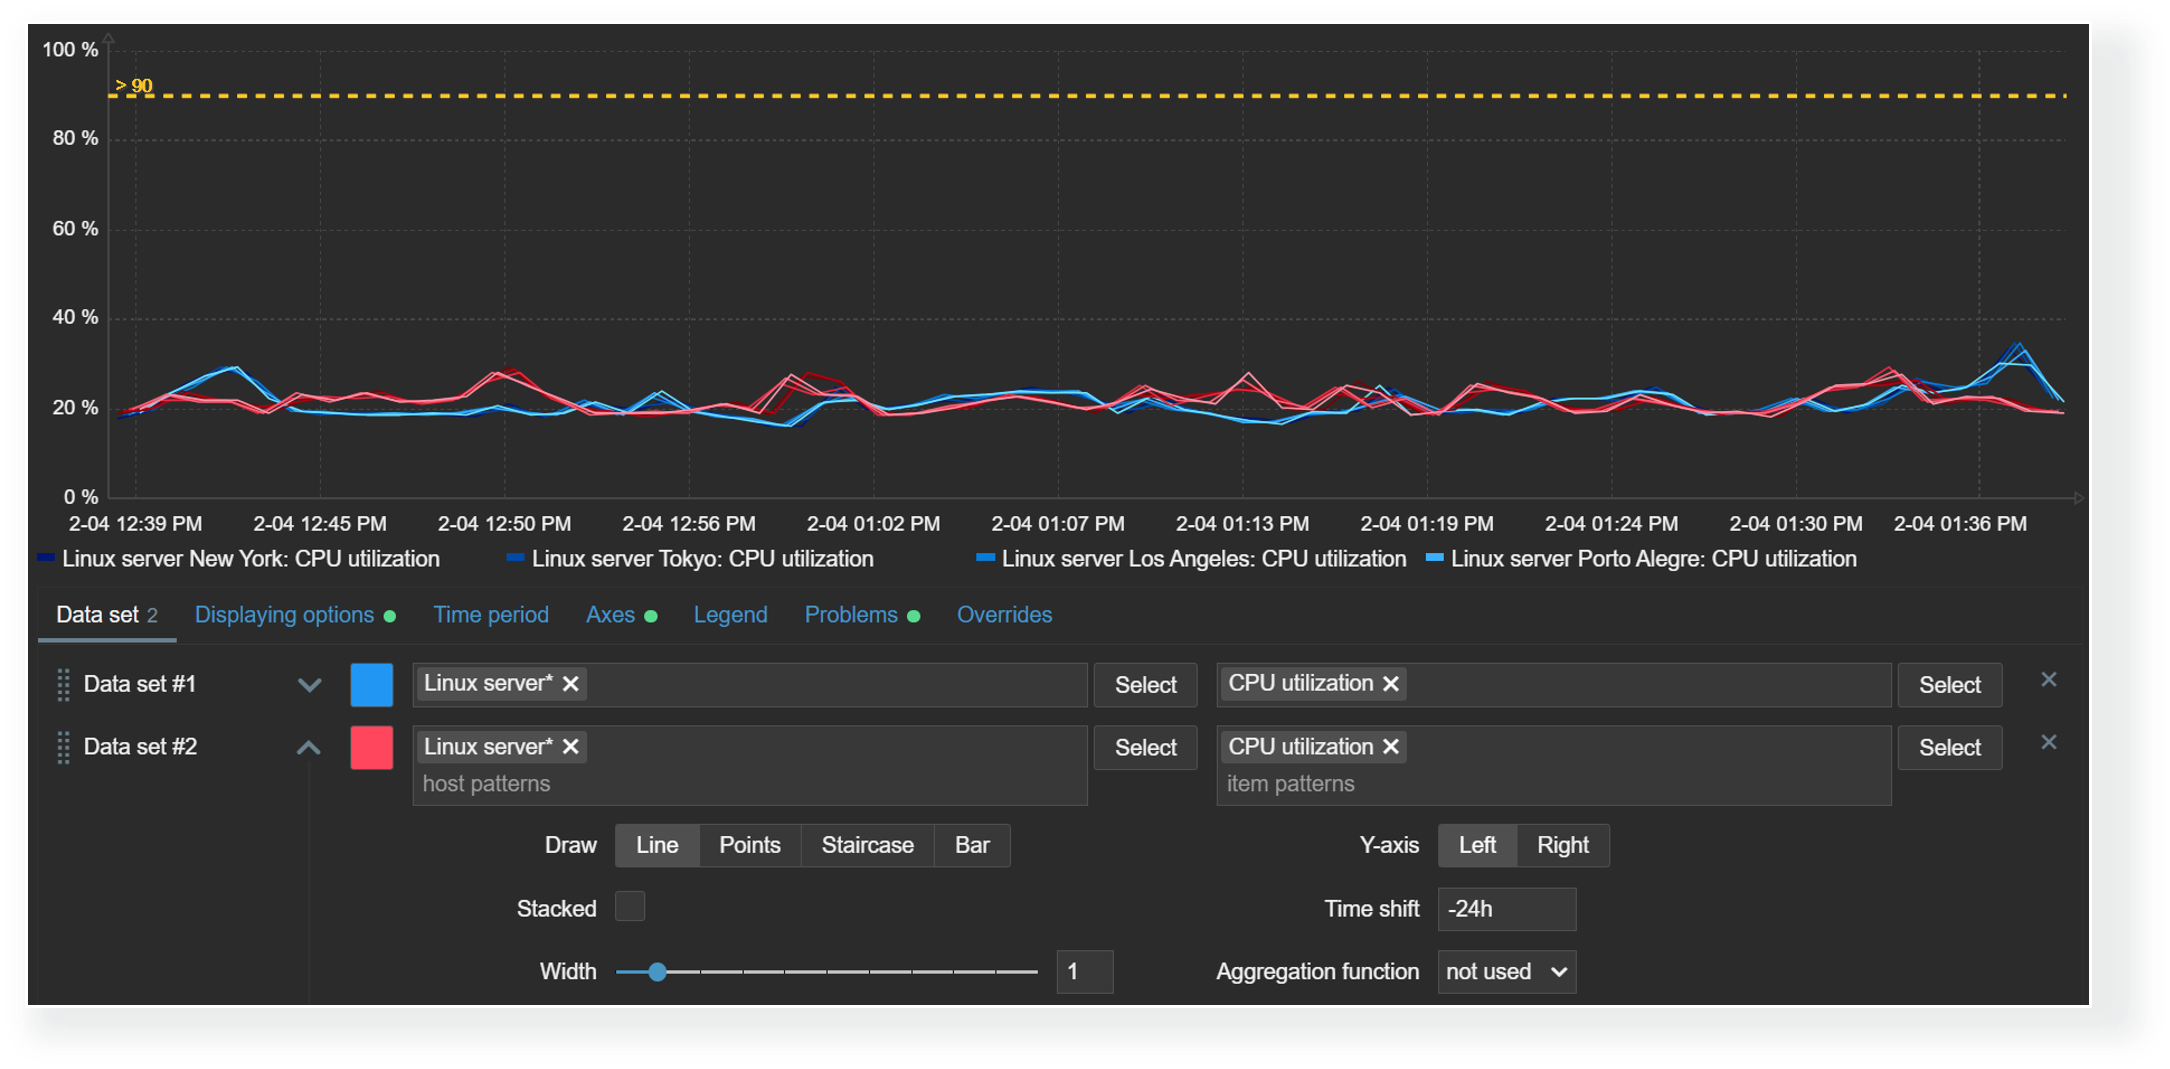
Time shift
The time shift feature is useful for visually comparing current values with values collected some time in the past. For example, we could compare the current CPU load on our application server with the CPU load for the same time period yesterday. This could allow us to detect unexpected deviations just by glancing over the graph.
With the graph widget time shift feature, you can compare current values with values collected in the past
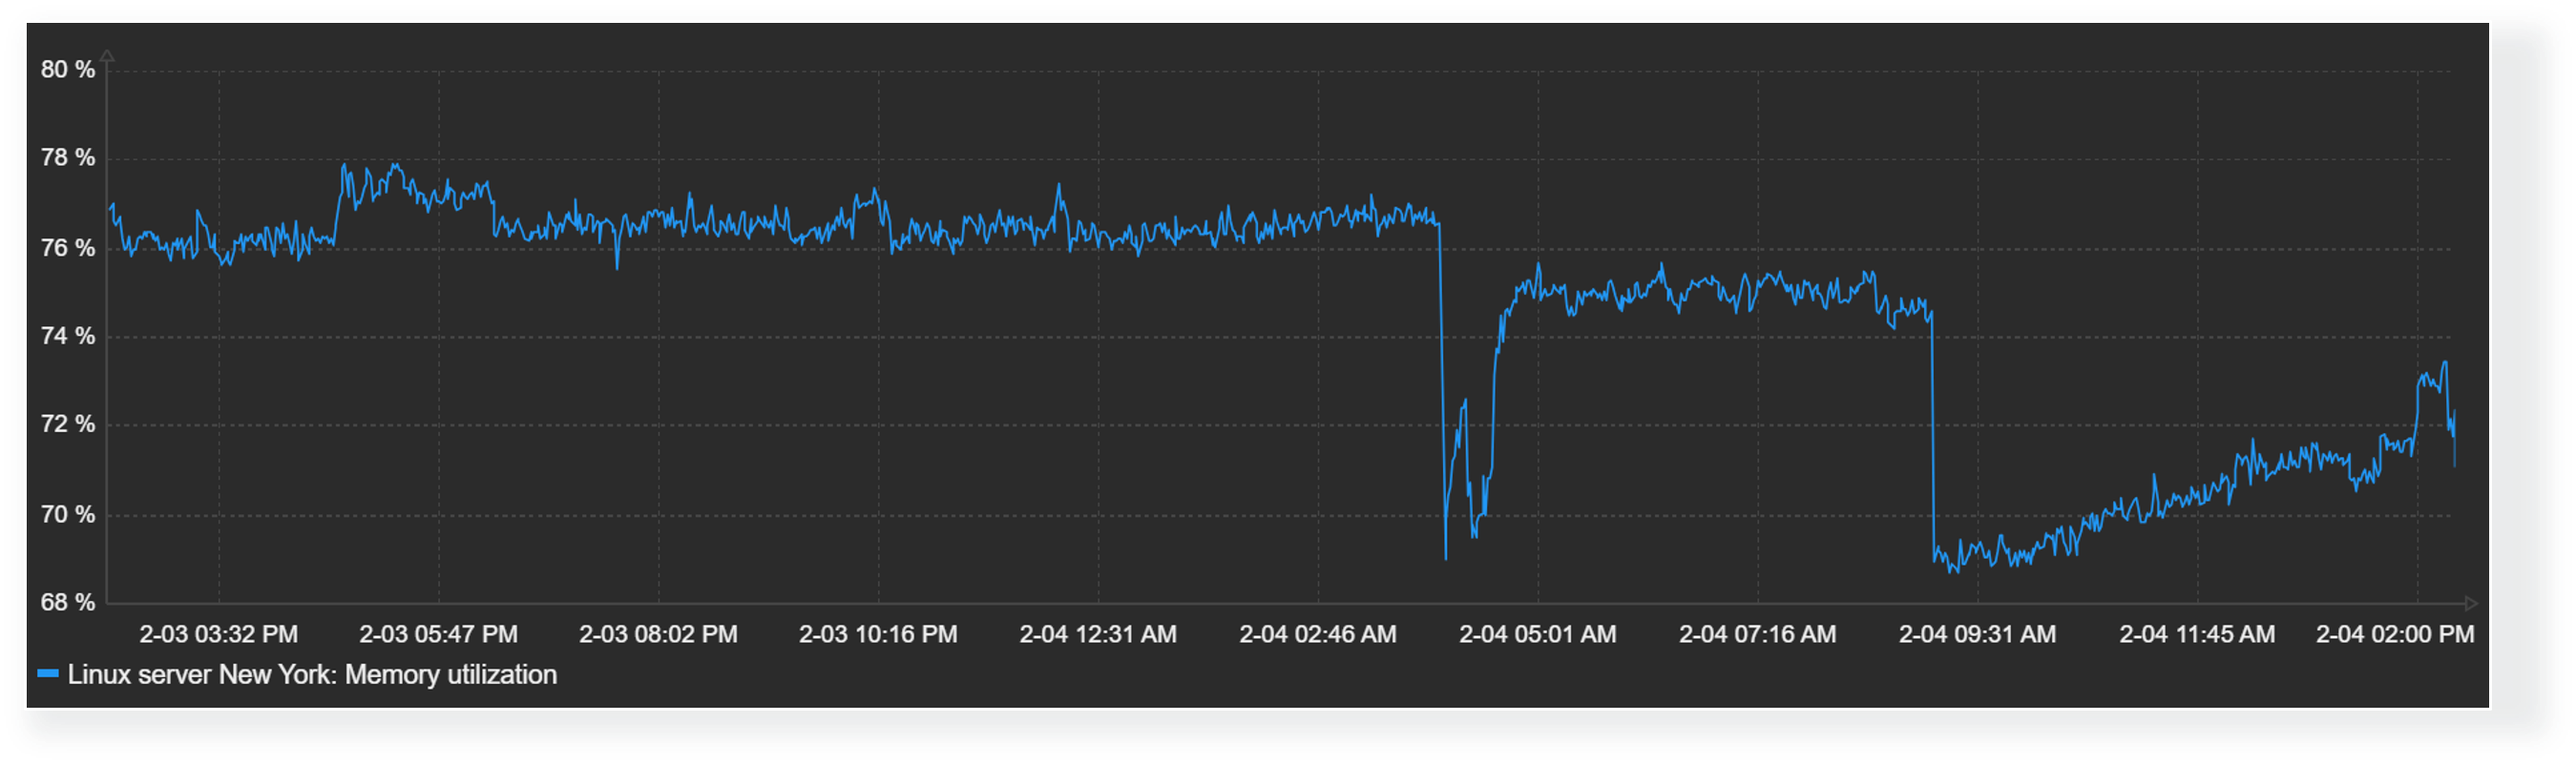
Missing data
Finally, the graph widget enables Zabbix users to choose how they wish to display missing values. Values for items could be missing for a variety of reasons – anything from data collection errors to various preprocessing workflows that could discard item values by design. Accordingly, it makes sense to design your graphs with the correct representation of missing data in mind.
Missing values in graphs can be displayed in the following formats:
Treat missing values as 0
Do not display missing values
Connect the last known value with the current value
Treat missing values as the last known value
Missing values are treated as 0Missing values are selected to not be displayed
Defining widget value thresholds
Threshold values can be defined for multiple widgets to make the visualization of data more dynamic. This way, Zabbix dashboards can instantly highlight resources exceeding warning/critical thresholds, services in unexpected states, unreachable endpoints, and a variety of other issues. As of Zabbix 7.2, widget thresholds are available only for numeric item values.
Widgets with threshold support
Multiple widgets provide the ability to define value thresholds:
Item value
Gauge
Top hosts
Top items
Honeycomb
Thresholds can be defined in widget configuration. By defining one or multiple thresholds, we specify that whenever values for the selected item reach or exceed the threshold, they will be highlighted in the selected color.
Item value widget can be used to highlight problematic resources or services
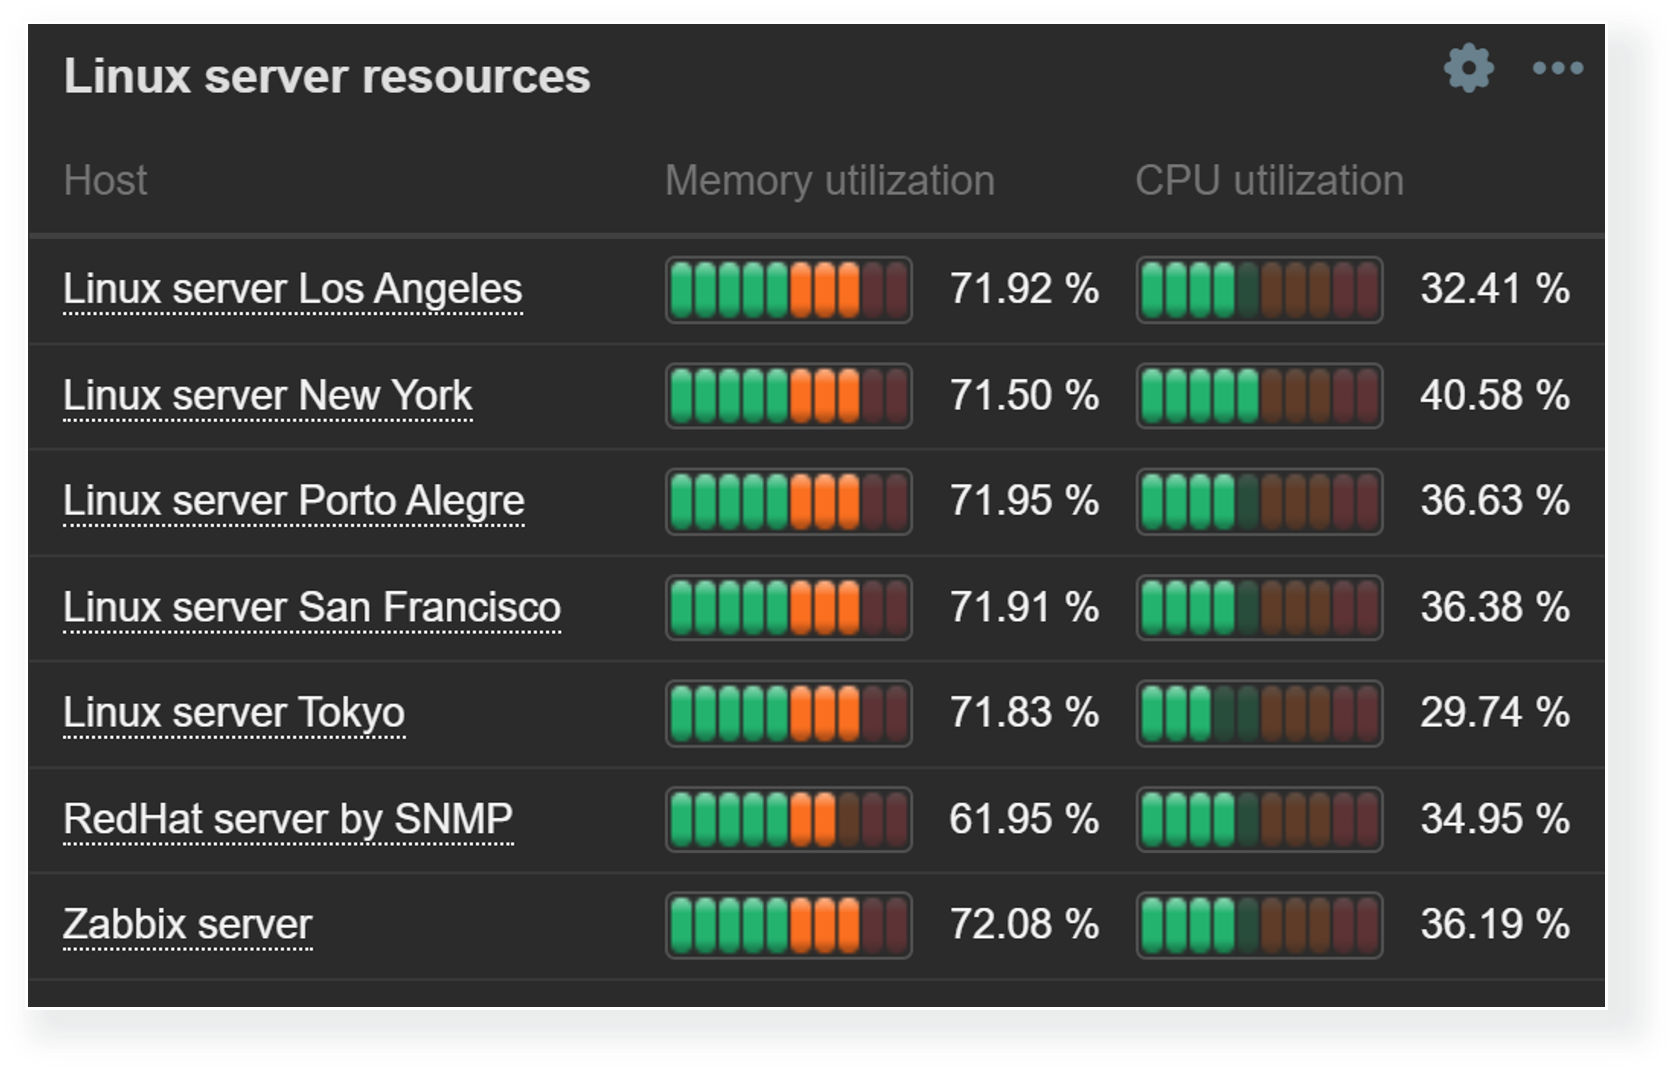
Thresholds are useful for not only highlighting the problematic items in Item value or Gauge widgets, but can also be used to provide a broader view of overall resource utilization with Top hosts and Top items widgets. Since we aren’t limited to a single item, Top hosts and Top items widgets enable us to do a surface-level correlation by looking at the utilization of various resources and highlighting the resources nearing critical utilization thresholds.
Top hosts and Top items widgets can display a comprehensive overview of host resource usage
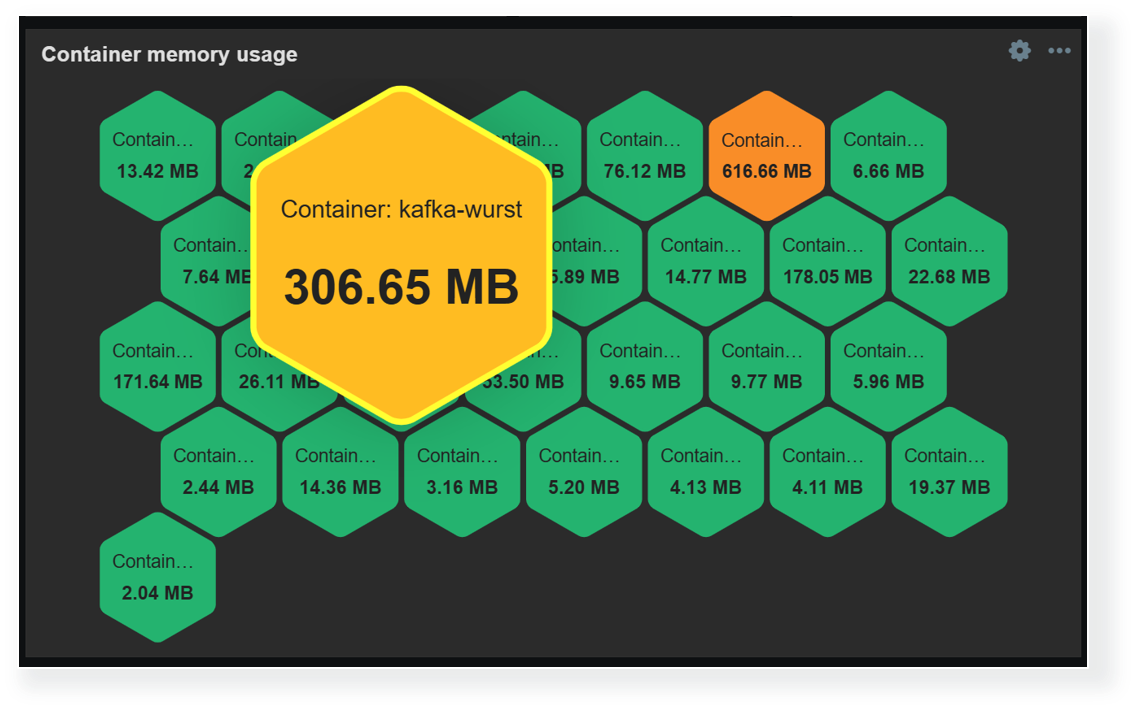
Another way to display and highlight our infrastructure state on a larger scale is by using the Honeycomb widget. The Honeycomb widget utilizes item patterns to display the matching item values. Here, thresholds can be combined with color interpolation to provide a more dynamic view of our environment. The Honeycomb widget is also capable of broadcasting the selected item and host, which enables us to quickly gain more information about the problematic host by clicking the corresponding cell in the widget.
Honeycomb widgets provide a dynamic overview of enterprise resource usage by supporting color interpolation features
Dashboards for MSPs
The previous sections have already highlighted a variety of features, useful widgets, and widget features for large organizations and MSPs. But let’s not forget that MSPs require granular access permission and control features. MSPs must also ensure that each client’s information (Hosts, items, dashboards) is fully isolated and secure from outside access.
Dashboard visibility
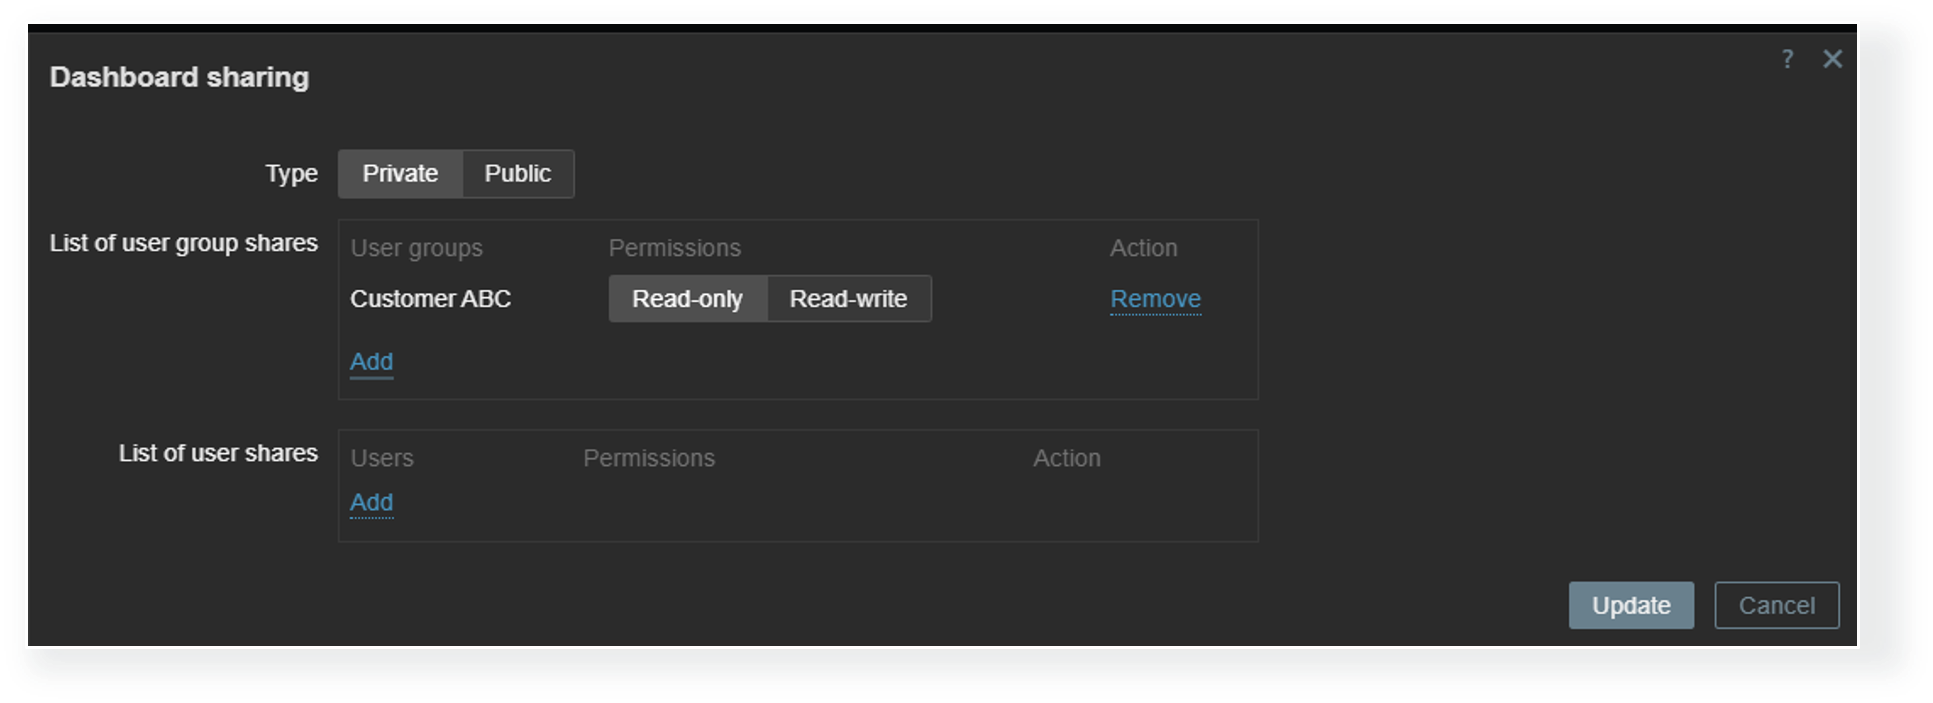
Each dashboard can be deployed either as a public or a private dashboard. Public dashboards are available to every user in read-only mode, while private dashboards require explicit read and write permissions for users who need access to them. MSPs can utilize private client organization dashboards to allow each client to view information about their environment in multiple views while completely hiding the dashboards assigned to other organizations.
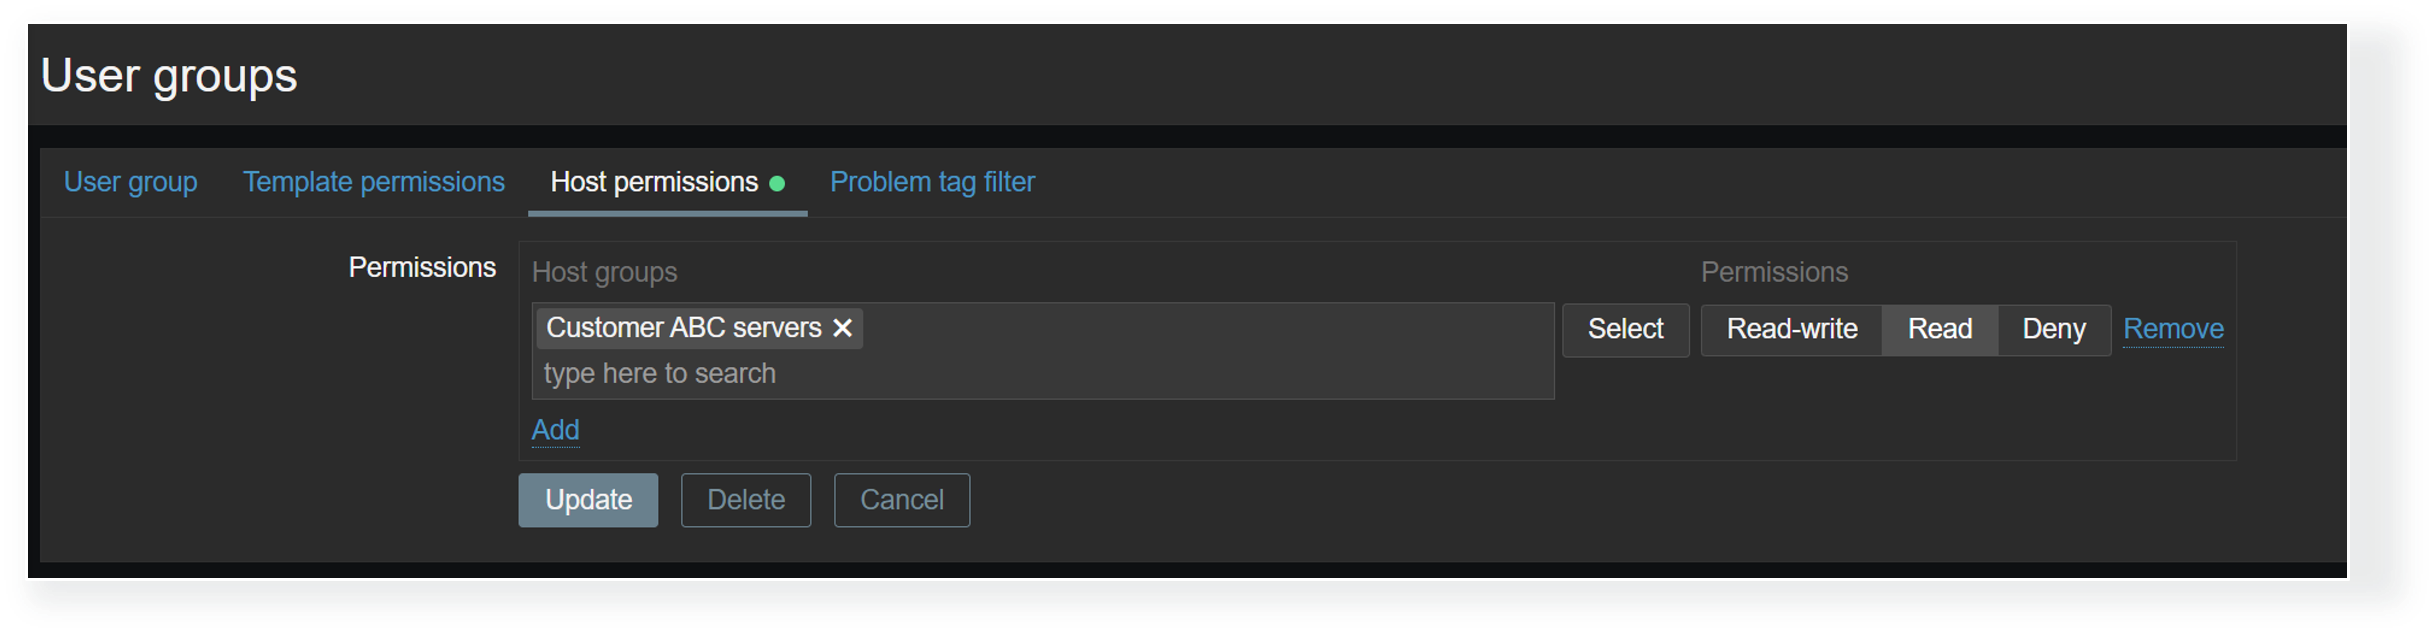
Dashboard visibility is only the first access control layer. Even when a Zabbix user has access to a dashboard, we must ensure that the user also belongs to a user group that has at least read permissions on the hosts displayed on a dashboard. Without at least read permissions, the hosts will not be displayed in dashboard widgets. This way, MSPs can utilize a single dashboard where each organization’s users can only see the information related to their environments, as opposed to having many duplicate dashboards, where each has a custom host filter that matches just the particular organization’s hosts.
User group-to-host group permissions have a direct impact on host visibility in dashboards
Restricting access to widgets
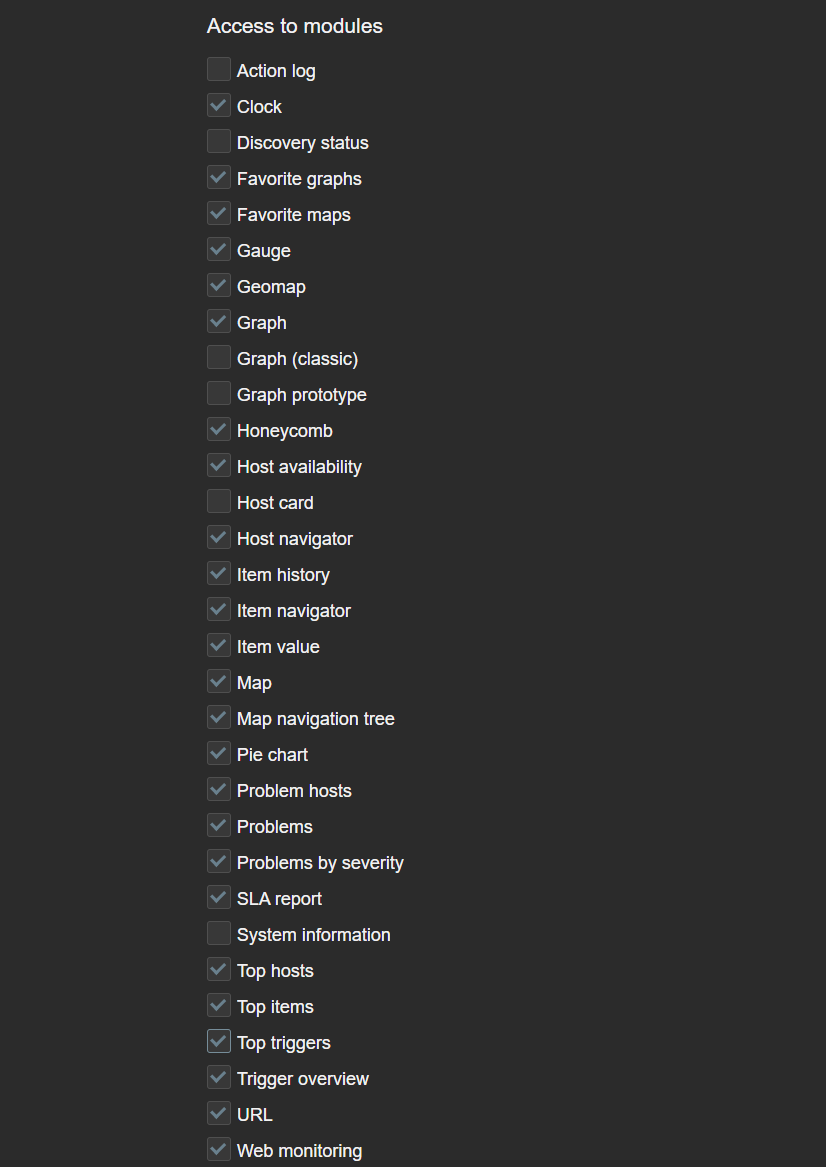
Access to each widget can also be restricted in Zabbix. This can be done globally by disabling widget modules under Administration—General—Modules or by disabling access to modules on an individual user role level. This can come in handy if the Zabbix environment in question enables users from various departments or organizations to create their own dashboards or edit existing ones. In addition, we may also have some custom community or in-house widgets which are utilized only by Zabbix administrators. which we may want to restrict access to.
If a Zabbix user opens a dashboard containing the restricted widget, the widget will be replaced with the message “No permissions to referenced object or it does not exist!” Ideally, it is recommended to avoid situations where users encounter such widgets, since such a message can be confusing to a user not familiar with various Zabbix permission and access error messages.
Access to modules can be restricted per each user role
Dashboard ownership
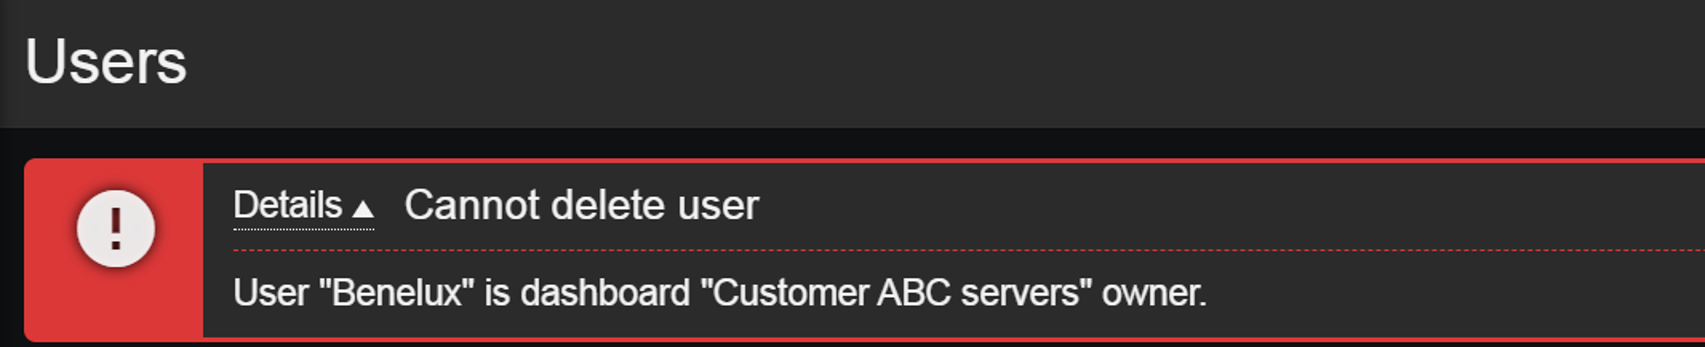
Dashboard ownership can also play a role in our user onboarding and offboarding process. Dashboard owners can edit permissions on the dashboards they own, but this can add an extra step in our user offboarding process since dashboards cannot remain without an owner! Therefore, before deleting a Zabbix user, we need to ensure that either their dashboards have also been removed or have their owners be changed. If we attempt to delete a user who is also a dashboard owner, Zabbix will display an error message.
Users who are owners of an existing dashboard cannot be deleted
This article touches upon only a few of the latest and lesser-known features useful to MSPs and large organizations. There are many more advanced ways of utilizing Zabbix widgets, permissions, tags, low-level discovery rules, and many other features that come in handy to organizations of various sizes, utilizing Zabbix for a variety of use cases. Follow our blog, watch the latest Zabbix videos on our YouTube channel, and check out our on-premise and online events to learn more about the flexibility of Zabbix data collection, alerting, and visualization features.
Hosts, items, and triggers are some of the most basic concepts in Zabbix. To successfully configure their monitoring workflows, Zabbix users need to have a clear understanding of how these entities are used. This article is aimed at Zabbix beginners and should help anyone better understand the basics of Zabbix while providing guidance on how to start monitoring your initial set of hosts.
Table of Contents
Hosts
Hosts are top-level entities in Zabbix and represent your monitored endpoints. Whenever we need to monitor a device, web application, service, or anything else – we start by creating a host.
The host acts as a container for our items (representing the metrics we wish to collect) and triggers (problem threshold definitions). These entities can be created directly on the host or inherited from predefined templates.
Every host has 2 mandatory parameters – its unique name and at least a single host group. Host groups are used for grouping, filtering, and assigning read/write permissions to hosts. Hosts are not limited when it comes to the number of host groups they are assigned to.
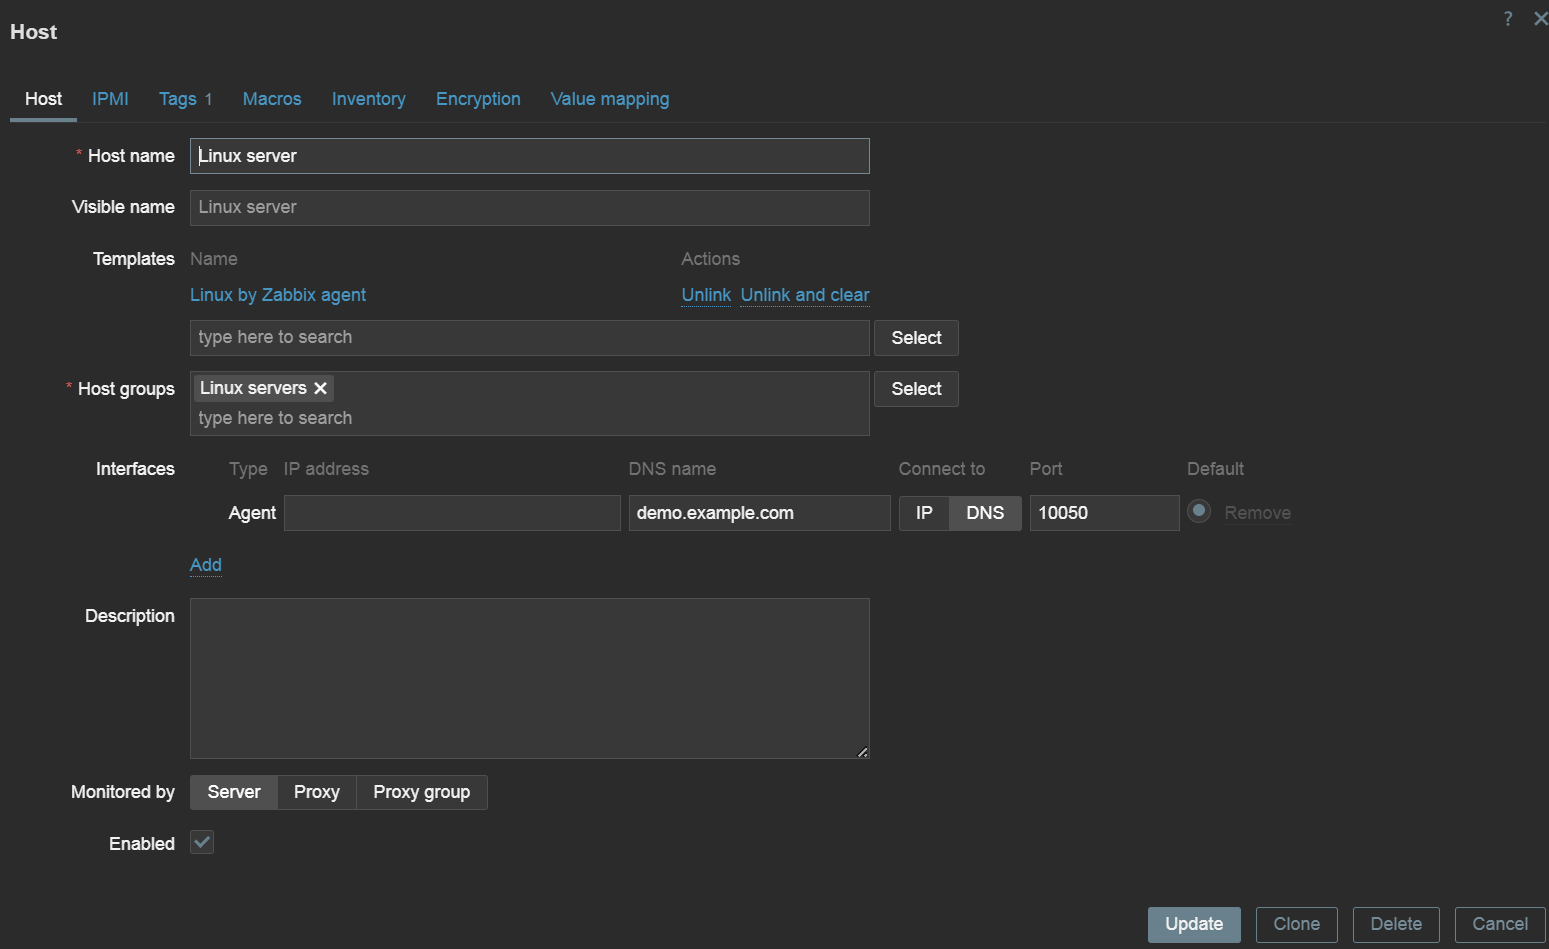
A simple Linux server host with an agent interface and a Linux template
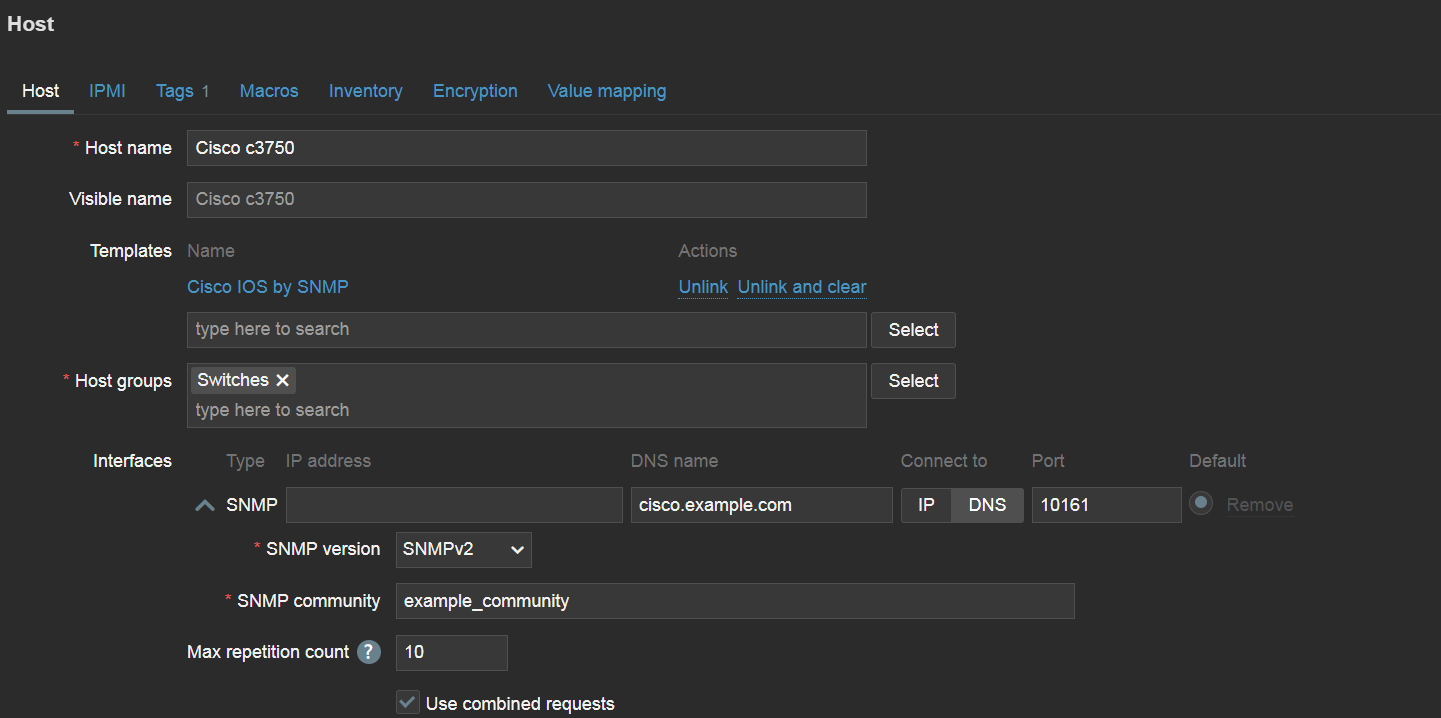
An interface might also be required, depending on the type of items we will create on the host. Interfaces define host addresses and, in case of SNMP interfaces, some additional authentication and security parameters.
There are 4 types of interfaces in total, representing 4 different data collection methods:
Agent
SNMP
JMX
IPMI
An SNMP device host with SNMP interface
Zabbix supports other types of data collection methods, but for these 4 methods in particular an interface is required on the host. Other data collection methods define endpoint addresses directly in the item configuration or use push data collection (trapping) where Zabbix is not required to know the endpoint address.
Templates
Templates contain a set of predefined items and triggers and can be linked to hosts. This enables the standardization of monitoring workflows in your environment. Changes made on the template will be immediately applied on the hosts to which the template is linked. Zabbix comes prepackaged with over 300 templates for a variety of vendors and endpoint types.
Zabbix comes pre-packaged with over 300 official templates
Zabbix users aren’t limited to just the official templates – anyone can create their own templates with items and triggers tailored to the requirements of a particular environment. We also recommend adjusting the official templates – disable the unnecessary items and adjust the triggers so they don’t generate any unnecessary noise.
Items
Items are used to define the metrics that we wish to collect, and are configured on hosts or templates. Items can be of various types. The type of the item usually defines the protocol and the methods used to collect metrics via this item. Some examples of item types:
Zabbix agent
SNMP agent
SNMP trap
Simple check
HTTP agent
IPMI agent
JMX agent
SSH agent
…and many others.
The key of the item is used to specify what particular metric should be collected. There are some exceptions to this – for example, for SNMP agent items it’s the OID field, while the key can be written arbitrarily. The key should be unique per host.
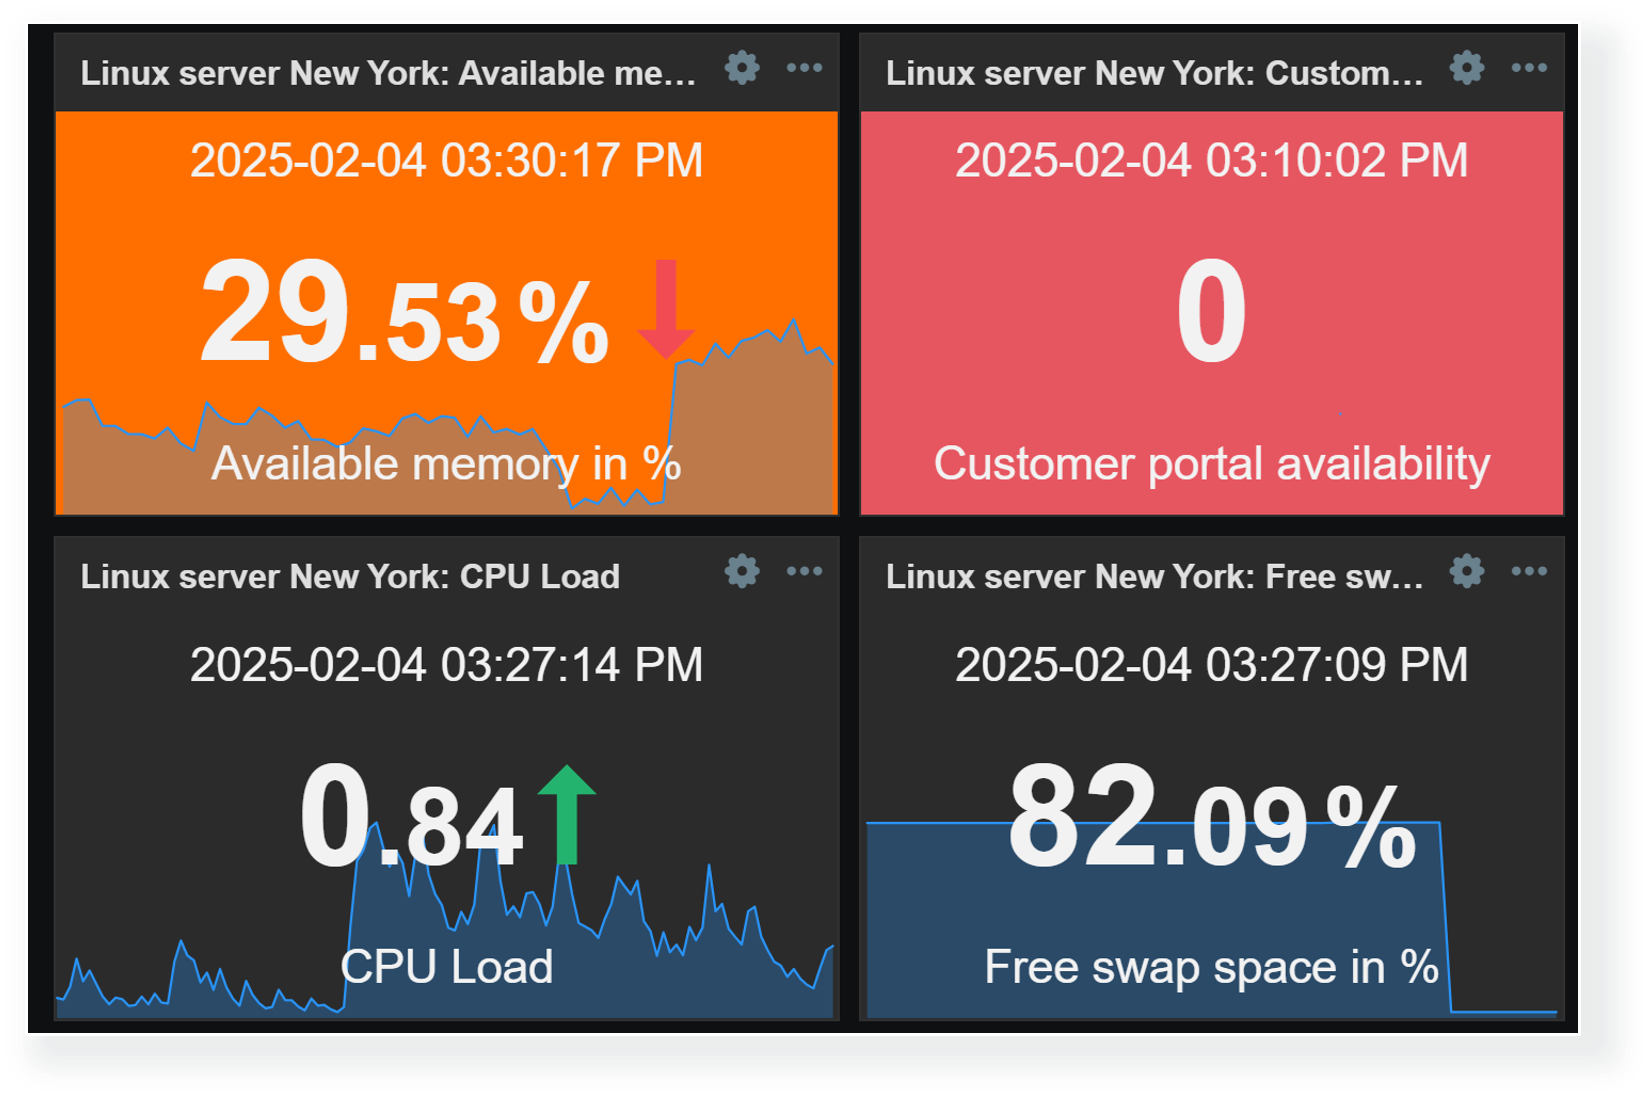
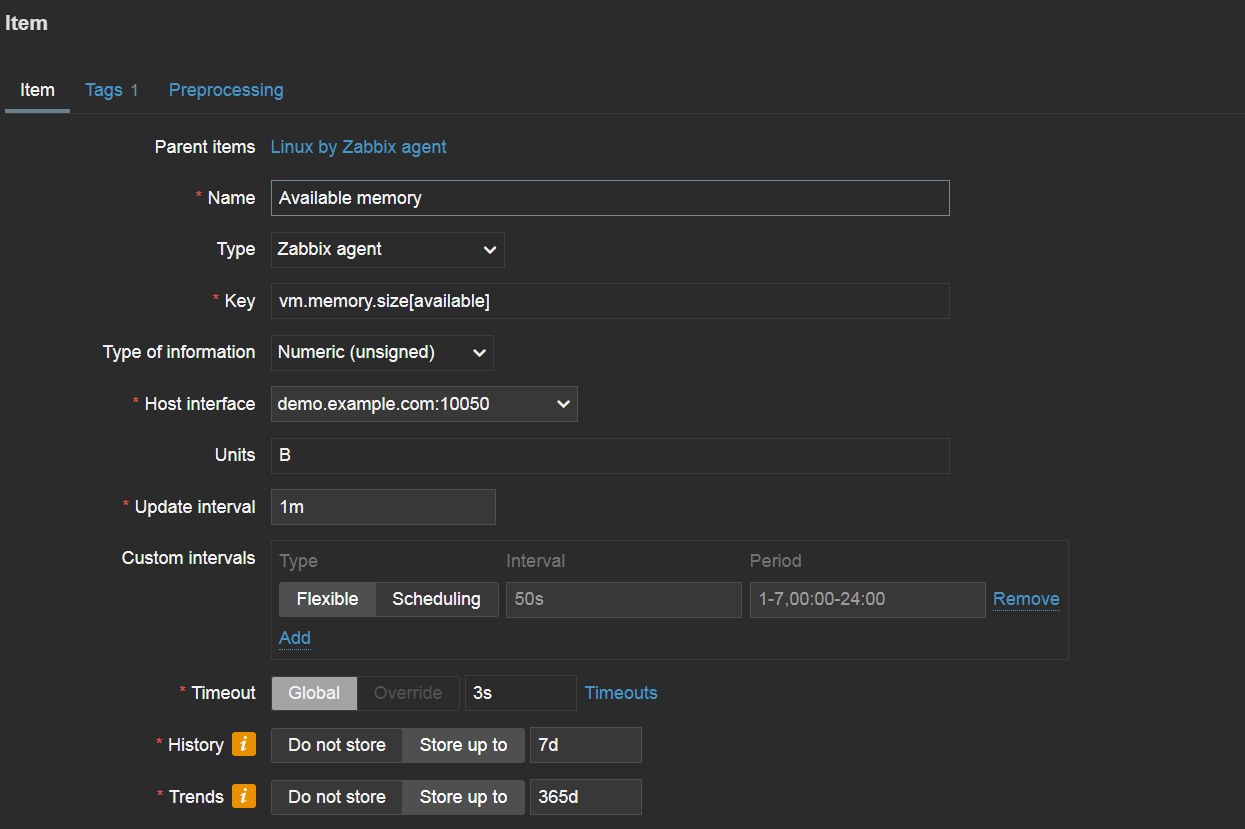
Available memory Zabbix agent item
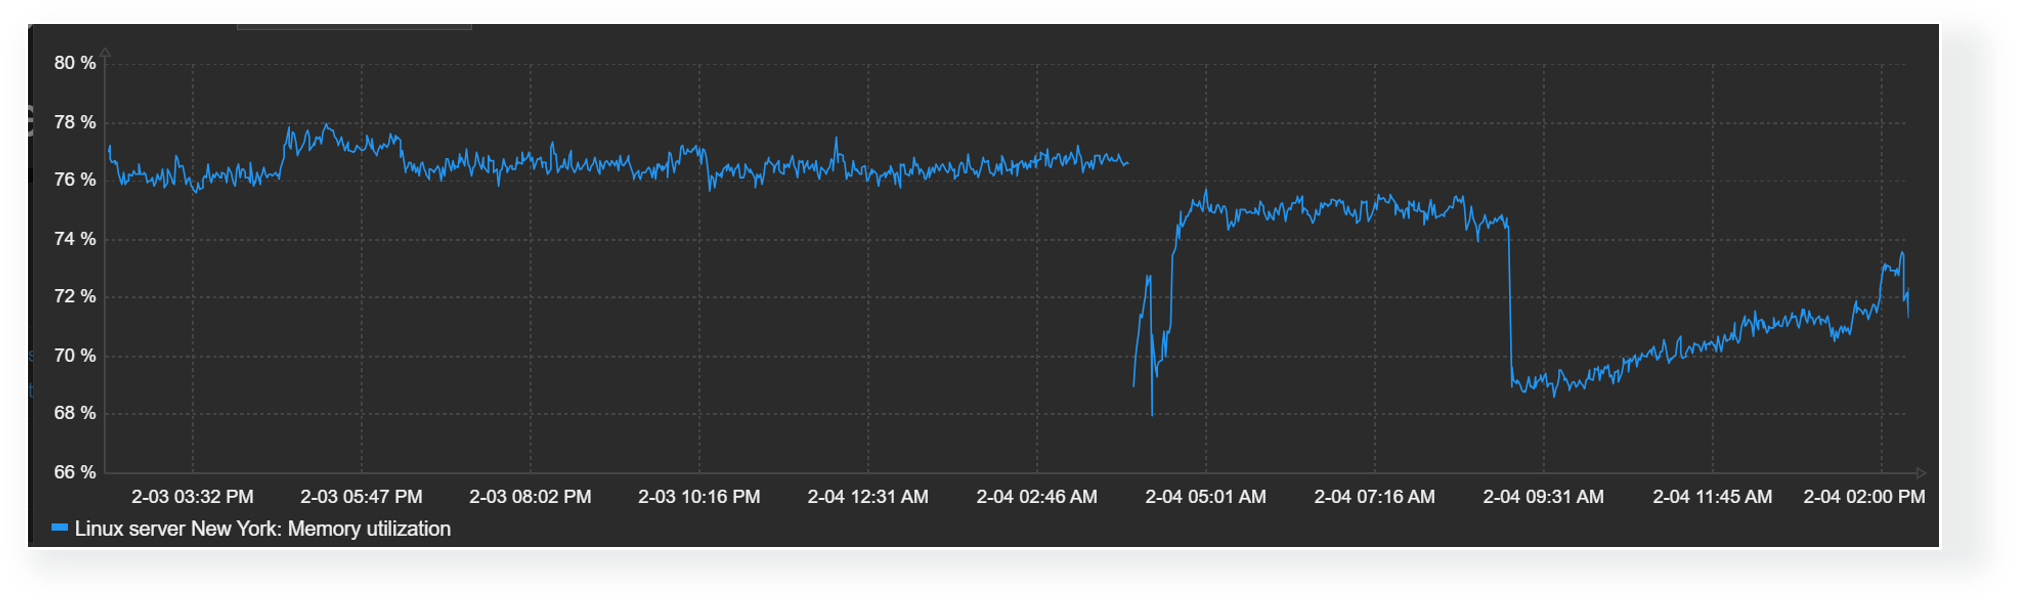
The key uses a <key>[<parameters>] format. For example, if we wish to collect available memory by utilizing Zabbix agent, we will use the vm.memory.size[available] item key. If we wish to collect available memory in percent, we would use the vm.memory.size[pavailable] item key. A quick item key reference is available by pressing select next to the Key field. You can find more about the available item keys and other configuration details in our documentation.
The update interval specifies how often metrics should be collected for this key, and the history/trend storage periods define for how long the collected data should be retained.
Triggers
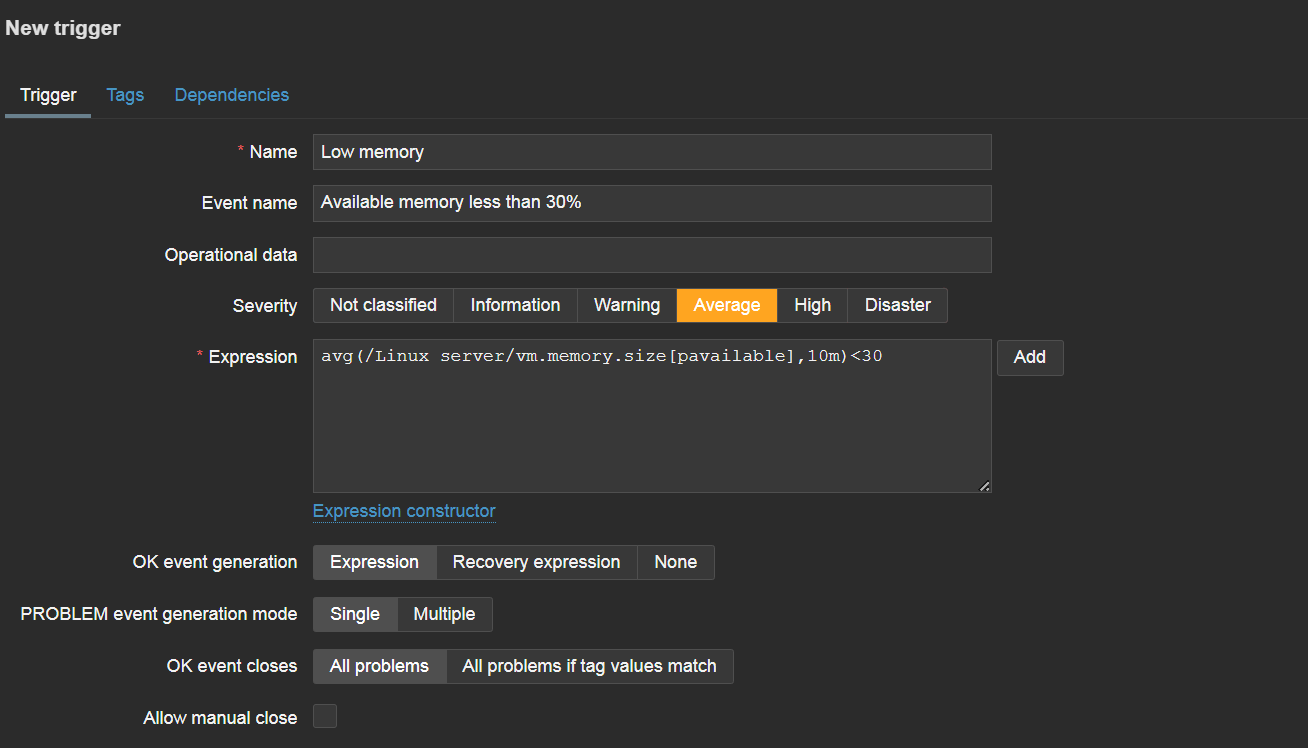
Once we have configured our items, we should create triggers to react to item values reaching problem thresholds. First, let’s define a simple trigger name. The name should be simple enough for our Zabbix administrators to understand the goal of the trigger simply by glancing at it.
Trigger reaction to low available memory over the last 10 minutes
The event name field is used to define the name with which our problems will be displayed. Since the problem event name is often used not just in Zabbix but also in the alerts that your administrators will receive in their mailboxes or via messaging and ITSM systems, the event name should be more descriptive, giving general details about the problematic situation.
Operational data fields are used to display information about the current state of items analyzed by the trigger. By default, the field will display the current value of our item (available memory, for example). This allows users to compare the current item values with item values at the time of problem creation and decide if any additional interference is necessary to resolve the problem.
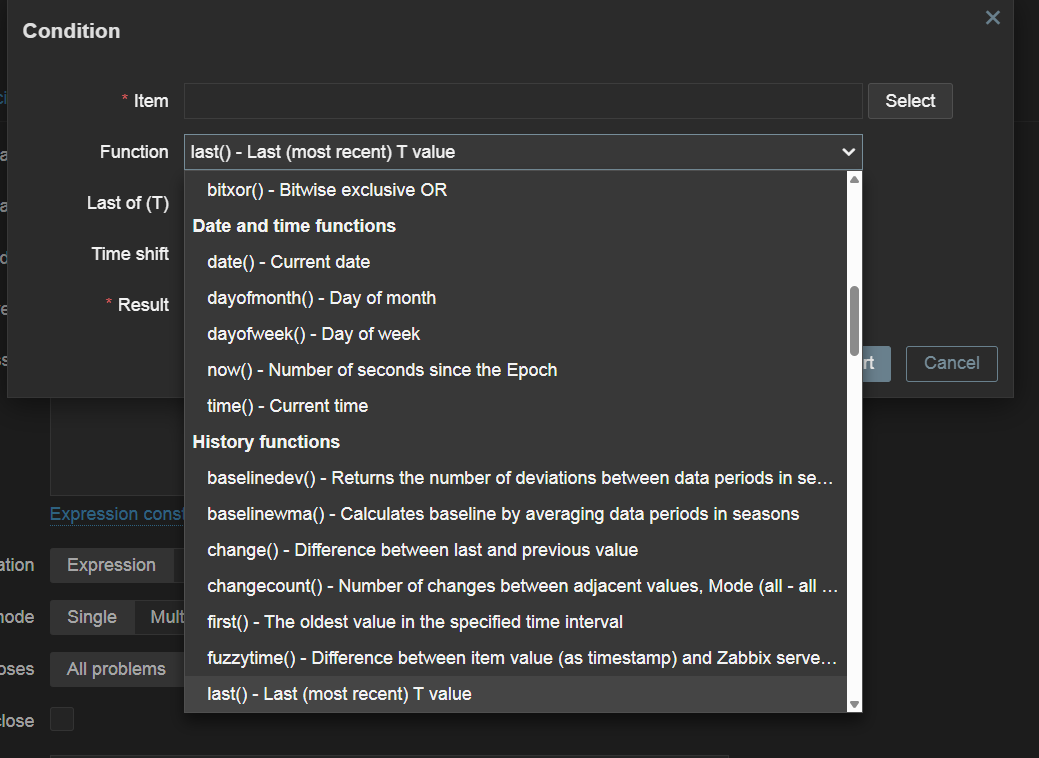
The expression field defines the logic behind detecting a problem. Here, we can either type in the expression manually or press the add button and build the expression by selecting the item that we wish to analyze – plus one of the various functions used for analysis. For example, the last function is used to analyze only the last received value and can generate a lot of noise when used for resource monitoring. Meanwhile, average, minimum, and maximum functions can be used to analyze values less sensitively over time. There are many more functions available for a variety of more advanced use cases – from string analysis functions to predictive functions and many others.
A large selection of functions can be used in trigger expressions to detect problems
Once the trigger is created, it will be recalculated every time any of the related items receive a new value.
This article covered only the basics of Host, item and trigger configuration. There are many more options for more advanced use cases. If you’re interested or need help with more advanced Zabbix features, please check out a variety of tutorials, how-tos and case studies in our blog and YouTube channel.
Zabbix is dedicated to monitoring IT infrastructures based on predetermined thresholds, such as servers, networks, and applications. Incorporating artificial intelligence (AI) into Zabbix as a complement allows a user to mitigate alerts based on these predetermined thresholds, offering possible causes and solutions to problems. This can help a user resolve incidents more efficiently.
In this article, we will explain how to integrate Zabbix and Google’s AI tool Gemini by using the API provided as well as a custom widget alternative.
First steps towards integration
You can find the repository in GitHub based on the Google Gemini model. You’ll need to create an account in Google AI Studio to obtain the required API.
Script configuration in Zabbix
From Zabbix version 7.0, access:
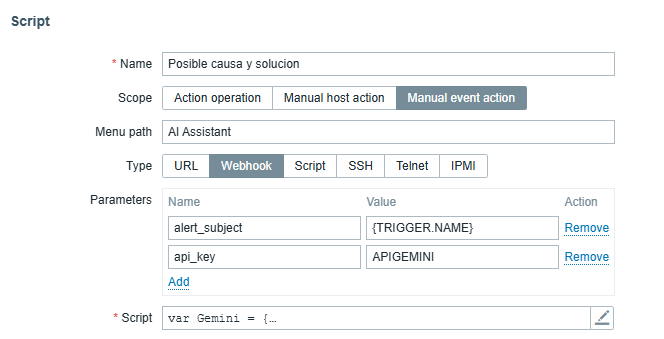
“Alerts” > “Scripts” > “Create Script.”
For this functionality, we designated the name as “Possible cause and solution.” Next, we can configure the parameters with the trigger event and the API generated in AI Studio. We then copy and get the script from the repository mentioned in the «Script» field, as in the following image:
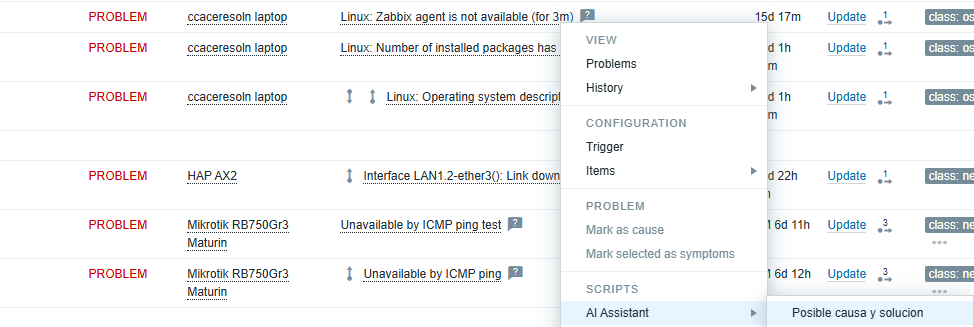
Application in the problem panel
After configuration, we access the alerts panel and select a specific alert. We click on “AI Assistant” and access the functionality that was previously named as “Possible cause and solution.”
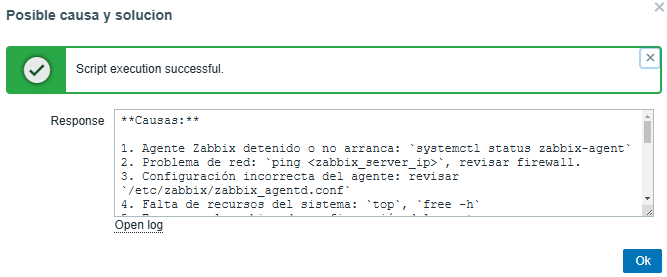
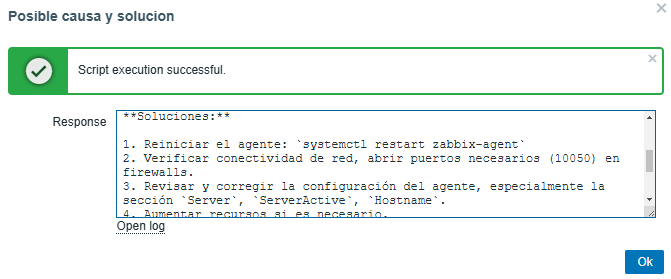
The following images present an example of an agent installed on a notebook.
Possible cause:
Possible solution:
The AI will be able to provide a precise solution for each problem presented, allowing us to progressively optimize the predetermined thresholds.
Using the custom widget “What are you working on?”
Creating accurate personalized dashboards for the user is essential.With this in mind, we propose the creation of an AI-based widget called “What are you working on?” (¿Qué harías tu? in Spanish), which analyzes the current state of the problem presented in Zabbix.
This concept integrates all the functionalities present in the widget (including Summary, Perspectives, Diagnosis, Comparison, and Forecast), since the used prompt can indicate whether it is necessary to make adjustments to the strategic plan or predict future trends based on the panel databuilt.
To exemplify how the “What are you working?” widget works, let’s consider the analysis of disk usage on our Zabbix Server.
The creation of personalized widgets from the official Zabbix page.
Once we have knowledge for the project, on the backend of our Zabbix Server we locate the route:
/usr/share/zabbix/widgets/
Then, we create a carpet called “insights” and copy the following repository. It is necessary to place the Gemini API in the file «assets/js/class.widget.php.js» in the field “YOUR_API_KEY.”
On the frontend, we go to “Administration” > “General” > “Modules.”
In the upper right corner, we click on “Scan Directory.”We have our widget to use:
After performing the scan, it is necessary to enable the widget, as it is disabled by default.
The importance of using AI in Zabbix
Let’s imagine a scenario with 100 monitored servers.Performance thresholds, Windows services, or other specific services can generate up to 50 weekly alerts. With the help of AI, it’s possible to reduce this number to a bare minimum, thanks to the weekly collection of possible causes and solutions.
This ground-level approach allows users to solve problems faster, but also improves overall health by minimizing necessary adjustments to the Zabbix server.
Implementing AI locally
Using a dedicated server with open source AI models like HuggingFace, it’s possible to implement the AI locally and create a database collecting the possible causes and solutions of the events.
The AI will learn from repetitive events, offering more accurate answers in the future.The analysis of possible trends can be based on the generated alerts. In this way, we can optimize our alerts and put artificial intelligence to work understanding and solving our problems.
Conclusion
The model we use is project-oriented.We are constantly evolving artificial intelligence, and we must use the model we know best. language is distinct due to the orientation of the prompts used for the answers and the learning we can provide, either by making requests to specific artificial intelligence platforms or by using it locally.
We have often seen Zabbix used as a simple tool for monitoring network assets as well as Information and Communication Technology (ICT) infrastructure. While this concept is not incorrect, it is equally important to understand that with the advancement of Zabbix versions, more and more functionalities have been made available for other types of monitoring, enabling advanced data analysis and stunning visualizations through new and modern widgets in the frontend layer.
In this short blog post, we will explore some of the existing yet under-discussed features of Zabbix that contribute to the maturity of the cybersecurity discipline within organizations — a topic that is becoming increasingly critical in the corporate environment.
Table of Contents
FIM – File Integrity Monitoring
FIM is a very common concept among information security tools, specifically in tools like SIEM/XDR (Security Information Event Management/Extended Detection and Response). The name is quite suggestive of its usability, but while some tools highlight this feature as one of their main functionalities, it is also available for those who use Zabbix – just not explicitly labeled under this name.
Here, we will approach FIM as a concept rather than just a functionality. This is because we aim to achieve a result, not merely have a menu with a name to claim compliance while using our tool. In fact, the outcome needs to be more important than mere “marketing.”
What should we expect from FIM?
Imagine that your servers have certain directories and/or files so critical that you cannot afford to neglect monitoring them for changes, insertions, or deletions. Additionally, these files may have owners and properties that must not be altered – otherwise, the systems that depend on them might lose the ability to read or execute their functions. This, at a minimum, is what we expect from FIM as a functionality.
To illustrate this a bit further, consider a database service like MariaDB:
# ls -lR /etc/mysql/
/etc/mysql/:
total 24
drwxr-xr-x 2 root root 4096 Jun 25 18:40 conf.d
-rwxr-xr-x 1 root root 1740 Nov 30 2023 debian-start
-rw------- 1 root root 544 Jun 25 18:43 debian.cnf
-rw-r--r-- 1 root root 1126 Nov 30 2023 mariadb.cnf
drwxr-xr-x 2 root root 4096 Sep 30 16:36 mariadb.conf.d
lrwxrwxrwx 1 root root 24 Oct 20 2020 my.cnf -> /etc/alternatives/my.cnf
-rw-r--r-- 1 root root 839 Oct 20 2020 my.cnf.fallback

/etc/mysql/conf.d:
total 8
-rw-r--r-- 1 root root 8 Oct 20 2020 mysql.cnf
-rw-r--r-- 1 root root 55 Oct 20 2020 mysqldump.cnf

/etc/mysql/mariadb.conf.d:
total 40
-rw-r--r-- 1 root root 575 Nov 30 2023 50-client.cnf
-rw-r--r-- 1 root root 231 Nov 30 2023 50-mysql-clients.cnf
-rw-r--r-- 1 root root 927 Nov 30 2023 50-mysqld_safe.cnf
-rw-r--r-- 1 root root 3795 Sep 30 16:36 50-server.cnf
-rw-r--r-- 1 root root 570 Nov 30 2023 60-galera.cnf
-rw-r--r-- 1 root root 76 Nov 8 2023 provider_bzip2.cnf
-rw-r--r-- 1 root root 72 Nov 8 2023 provider_lz4.cnf
-rw-r--r-- 1 root root 74 Nov 8 2023 provider_lzma.cnf
-rw-r--r-- 1 root root 72 Nov 8 2023 provider_lzo.cnf
-rw-r--r-- 1 root root 78 Nov 8 2023 provider_snappy.cnf
All the files, directories, and subdirectories listed above have already been configured, and the system (whatever it may be) is functioning perfectly. However, if someone suddenly decides to alter a configuration in the file /etc/mysql/mariadb.conf.d/50-server.cnf, this could be disastrous for the service. Regardless, the important thing to do is to monitor this scope and notify the relevant stakeholders so that an appropriate analysis can be conducted.
Zabbix can help with that. Let’s see how.
Zabbix and File Integrity Monitoring functions
Consider that the Zabbix agent is installed on the server to be monitored:
vfs.dir.count[/etc/mysql]
With this key, we can count the objects present within the /etc/mysql directory. Subsequently, we can create a trigger to be activated if there is any change related to the initial collection count, such as someone deleting or adding a file or directory in this location.
vfs.dir.size[/etc/mysql]
With this key, we can determine the total size in bytes used by the directories and configuration files. In the future, we can create a trigger that activates when this size changes, indicating the deletion or addition of a file.
Among several important files, we may have a greater interest in some configuration files, and we can validate their existence by creating a trigger that activates when such a file ceases to exist. This will clearly indicate that something important has disappeared.
In this case, the value “1” represents “OK” for the existence of the file.
In addition to verifying the existence of the configuration file we consider important, we need to be informed if anything in it changes. This key handles that by generating a hash in a variety of possible formats, allowing a trigger to be activated in case of a hash change, which would reflect a file modification (unfortunately, we won’t know what exactly was altered).
We might have a specific parameter of interest – for example, the maximum number of connections allowed to the database. Monitoring this is important because if the configuration is set to the default value, it means that no “tuning” has been applied to the database. Alternatively, it could mean that someone simply deleted or commented out this line, causing it to be ignored by the system. Therefore, verifying whether the parameter exists and is properly configured is crucial.
In this case, the value “1” indicates that the regular expression was successfully found, meaning that the configuration or parameter we need to exist is indeed present.
Beyond verifying the existence and integrity of the file, it is also possible to determine what was changed within it. However, we would need to specify the configuration of interest using a regular expression. For example, considering that the maximum number of connections allowed by the database system is “x,” we can be alerted by a trigger if it changes to “y,” “z,” or any other value different from “x.” This setup allows us to monitor the parameter of interest with precision. This logic can be applied to any other parameter you consider important. Of course, there is another way to automate this process, but we will not cover that automation here.
In this case, the parameter defining the maximum number of connections is not only present, but we also know the exact number of connections. This way, we will have a history of the applied parameterization in case it is changed at any point.
The two keys above allow us to determine the owner of a file and (in the case of a Linux system) the owning group. We can also choose to monitor the user’s name or their UID in the system. Naturally, a trigger can be activated to alert us in case of an ownership change, indicating that someone might be “taking over” an important file in the system.
The key above allows us to determine a file’s permissions—read, write, read and write, execution, or a special permission bit. Naturally, a trigger can be activated to alert us if there is any permission change in the file.
The key above does not exist by default. It was created with a UserParameter, which is a customization for verifying a command that, in this case, checks the attributes of a specific file. Consider the following command executed directly in your system’s terminal:
…it could mean that someone does not want the system to log when this file was accessed (refer to the chattr command manual). Additionally, any other attribute can be added or removed, which poses a risk to the system because these attributes can alter how files are accessed, stored on disk, and later read. Therefore, we can create a UserParameter as follows:
When creating the item, don’t forget to create the trigger that should be activated in case there is a change in the attribute of a file, whatever it may be.
Paying attention to file access and modification times
To delve a bit deeper into the concept of FIM, we should ask ourselves if we are monitoring file access and modifications concerning their timestamps. In a way, if we have implemented everything proposed above, the answer is yes.
That said, there is an easier way to keep track of all the things we’ve discussed. It involves using this key:
vfs.dir.get[/etc/mysql]
When creating an item with this key, we will recursively obtain all its objects, such as subdirectories and files. The output format will be a JSON, which allows us to create LLD (Low-level Discovery) rules to automate FIM. Below is a small snippet of the monitoring output:
Considering that the output includes all objects from the main directory, this would be the most sensible approach to configure our FIM. However, it is necessary to create the LLD and prototypes. We will not cover this in detail in this article, but this is the path I recommend you follow.
Below is a “blueprint” for an LLD to create automated File Integrity Monitoring:
The “Master item”:
The “Dependent rule”:
The LLD Macro:
The item prototypes:
Below are the components of a trigger prototype (I created just one to symbolize a type of alert for file modification):
Name: Object: {#BASENAME} just changed

Event name: Object: {#BASENAME} just changed. Last hash: {ITEM.VALUE} The previous one: {?last(/MySQLDB/vfs.file.cksum["{#PATHNAME}",sha256],#2)} Object: {#BASENAME} just changed. Last hash: {ITEM.VALUE} The previous one: {?last(/MySQLDB/vfs.file.cksum["{#PATHNAME}",sha256],#2)}

Severity: Warning

Expression: last(/MySQLDB/vfs.file.cksum["{#PATHNAME}",sha256],#1)<>last(/MySQLDB/vfs.file.cksum["{#PATHNAME}",sha256],#2)
And then, some results:
Conclusion
The implementation of a robust File Integrity Monitoring system helps to ensure the security of IT infrastructure. Detecting unauthorized changes in critical files helps prevent attacks, identify security breaches, and ensure the integrity and availability of systems. With Zabbix, we have an effective solution to implement FIM, enabling process automation and the real-time visualization of changes. This monitoring not only reinforces protection against intrusions but also facilitates auditing and compliance with regulatory standards.
The main benefits of integrating File Integrity Monitoring with Zabbix include:
1. Early detection of changes in critical files, enabling quick responses.
2. Enhanced compliance with security regulations and internal policies.
3. Protection against malware and ransomware by identifying changes in essential files.
4. Ease of auditing with automated reports and modification histories.
5. Greater visibility and control over the integrity of data and systems in real time.
6. Operational efficiency through the automation of alerts and reports.
7. Improved proactive security, helping prevent attacks before they become critical.
By using Zabbix, organizations can strengthen their security posture and optimize risk management, ensuring that any unauthorized changes are detected and promptly corrected.
Welcome to another episode of What’s up, home? weirdness! Who wouldn’t have their own NetBox at home – and who wouldn’t think of it as a home CMDB? I’ve just started experimenting with it. For those who do not know, a Configuration Management Database (CMDB) is the source of truth for your inventory of stuff. In data centers, it keeps track of your servers, their cables, and everything else, telling you in which data center and which rack they are.
For me… well, take a look at for yourself. One picture says more than a thousand words of my storytelling.
What is it good for?
Well… in the real business world, it’s good for many things – from knowing about your assets, their serial numbers, purchase dates, hardware configuration, and so much else. I could go as deep as that, but there’s a limit how far even I want to go with these little experiments. Today’s case is merely to demonstrate the flexibility of Zabbix, yet again.
How did I do this?
I quickly threw the data in to NetBox by hand — it looks by a lot of work to do, but in fact, it wasn’t too bad – took me about 45 minutes to do the following:
Create a Site called “”What’s up, home?”
Create the rooms by adding new locations and making the previously created site as their parent
Add some manufacturers
Add some device roles
Add some device types
After that, adding the devices themselves is a breeze. If you have not used NetBox, this is what adding a new device looks like. Yes yes, in the real business world there would have been many more items for me to fill in, but for this case I only added the mandatory items and even those I could do just by choosing from the drop-down menus. Not a big deal.
…and the Zabbix integration?
Actually, this is something I created many years ago for other purposes, but still seems to work with today’s versions of NetBox. My little template queries NetBox over its API and asks if it has anything that matches with the host name that’s in Zabbix. If it has, then it gets the rack location and other stuff.
How this then works is pretty standard stuff. Retrieve a master item…
…and the dependent items then gather the data, parse some JSONPaths with Zabbix item preprocessing, and at least some of the items also populate bits and pieces in the Zabbix inventory. This is handy in real world, as your alerts can then contain the exact rack location and so forth about your failing devices. Add them as tags or add them as part of the alert text, your imagination is your limit.
Does it work?
Of course it does! Here’s the inventory grouped by manufacturer:
If I click on any of them, I get this:
Of course I can also browse the data through the latest data, for example…
…or I could just create some dashboards for visualizing all this. I have not done that yet, as this is what I did tonight so far and now I’m going to bed. To be continued – maybe! For now, the template only pulls data from NetBox, but I’d like to push data towards it as well, to also tell if a light bulb is powered on or not, for example. Stay tuned!
Website and web application monitoring can vary from simple use cases to complex multi-step scenarios. To fully cover the scope of modern website monitoring requirements, Zabbix has introduced Browser item, a new item type that brings with it multiple accompanying improvements for simulating browser behavior and collecting website metrics.
Table of Contents
What is browser monitoring?
Browser monitoring allows users to monitor complex websites and web applications using an actual browser. It involves the constant tracking and analysis of the performance, reliability, and functionality of a website or web application from a real user perspective. This process ensures that key pages, features, and user navigation work as expected. By monitoring critical pages and flows specific to different businesses, companies can ensure optimal user experience, resolve potential or ongoing issues, and proactively address any potential problems.
Browser monitoring can be split into two main approaches:
Browser real user monitoring – Monitors how your web page or web application is performing, using real user data to analyze overall performance and user experience.
Browser synthetic monitoring – Analyzes application availability and performance, using scheduled testing to analyze website availability and emulate real user experience.
Since Zabbix is not a real person (yet) but is fully capable of emulating real user behavior on a website very precisely, we will focus on browser synthetic monitoring.
What business goals can we achieve with browser monitoring?
There are a multitude of goals that can be achieved, depending on what business we are running or expect to monitor, but some examples include:
Improving user experience
Browser monitoring helps ensure that users have a fast, smooth, and reliable experience on a website or web application. A positive user experience leads to higher user satisfaction and a greater likelihood of repeated visits or purchases.
Ensuring cross-browser and cross-device compatibility
Users access websites from a host of browsers and devices. Browser monitoring helps to detect compatibility issues that could affect certain users (e.g., JavaScript errors on specific browsers or layout shifts on mobile). By monitoring these scenarios, we can deliver a consistent experience across platforms, which is essential as multi-device usage continues to grow.
E-commerce checkout monitoring
Retailers can ensure a smooth checkout process by monitoring page load times, form interactions, and payment processing to confirm that users can easily complete purchases.
Form performance
Browser monitoring makes it easy to detect any issues preventing form completion, such as slow response times or broken validation. It also ensures a smooth, error-free experience to improve lead capture and gain more conversions.
Subscription renewal page monitoring
Subscription-based businesses rely on customers regularly renewing or upgrading their plans. Monitoring the subscription renewal page for load speed, usability, and any payment processing issues is essential, as issues on this page can directly the amount of renewals and lead to customer loss.
Supporting portal uptime
Many businesses provide a customer support portal where users can submit requests or use a knowledge database. Downtime or slow response times can lead to frustrated customers and an increased number of complaints.
How to set up browser monitoring
There are a lot of goals we can reach, but the question remains – how can we reach them with Zabbix? The answer is that we can use the already mentioned and newly introduced browser item.
Browser item configuration window
Browser items gather information by running custom JavaScript code and fetching data via HTTP or HTTPS protocols. These items can mimic browser activities like clicking buttons, typing text, navigating across webpages, and performing other user interactions within websites or web applications.
Along with the script, users can specify optional parameters (name-value pairs) and set a timeout limit for the actions. But before we can actually use the item, we will need to configure Zabbix server or Zabbix proxy with a WebDriver, so that Zabbix can actually control browser trough scripts.
What is a WebDriver? A WebDriver controls a browser directly, mimicking user interactions through a local machine or on a remote server, enabling full browser automation. The term WebDriver includes both the language-specific bindings and the individual browser control implementations, often simply called WebDriver. WebDriver is designed to offer a straightforward and streamlined programming interface trough an object-oriented API which efficiently manages and drives browser actions.
In this guide, for instance, we’ll use a WebDriver with Chrome within a Docker container and make a script that includes actions like button clicks and text entry.
WebDriver installation
One of the simplest ways to install a WebDriver is to use containers. To install a chrome WebDriver on a local or remote machine, you can use Docker or any other preferred container engines:
Port 4444 will be the port on which the WebDriver will be listening and port 7900 will be used by NoVNC, which allows us to observe browser behavior in case a browser with a GUI is used.
Zabbix server/proxy configuration
After WebDriver is installed, we need to set up the communication between Zabbix and the driver. This can be done by editing the Zabbix server/proxy configuration file and updating the following parameters:
### Option: WebDriverURL
#       WebDriver interface HTTP[S] URL. For example http://localhost:4444 used with
#       Selenium WebDriver standalone server.
#
# WebDriverURL=
WebDriverURL=http://localhost:4444

### Option: StartBrowserPollers
#       Number of pre-forked instances of browser item pollers.
#
# Range: 0-1000
# StartBrowserPollers=1
StartBrowserPollers=5
With the configuration parameters in place, we will now configure our Browser item to collect and monitor the list of upcoming Zabbix trainings from the training schedule page.
Creating a host
First, we need to navigate to the “Data collection” > “Hosts” section and create a host that represents our web page. This is more than anything – a logical representation. This means we don’t need any specific interfaces or additional configuration. The host in our example will look like this:
Training page monitoring host
Creating a browser item
Since the data collection is done by items, we need to navigate to the “Items” section on the “Zabbix training schedule” host and create an item with the type “Browser.” It should look something like this:
Training schedule browser item
Now comes the most important part – creating the script to monitor the schedule. Click on the “Script” field.
First, we will need to define what browser we will use, and any extra options we might want to specify, like screen resolution or whether the browser should run in headless mode or not. This can be done using the Browser object. The Browser object manages WebDriver sessions and initializes a session upon creation, then terminates it upon destruction. A single script can support up to four Browser objects.
var browser, result;
var  opts = Browser.chromeOptions();
opts.capabilities.alwaysMatch['goog:chromeOptions'].args = []
browser = new Browser(opts);
browser.setScreenSize(Number(1980), Number(1020));
In this snippet, we defined that we will use the Chrome browser with a GUI. As you can see, the screen size is set to the pretty common 1980x1020p.
Now we will need to define what the browser will be doing. This can be done by using such Browser object methods as navigate – to point to the correct URL of the web page or application and (for example) findElement/findElements to return some element of the web page.
findElement/findElements methods allow us to define strategies to locate an element and selectors to provide what to look for. Strategies and selectors can be of multiple kinds: strategy – (string, CSS selector/link text/partial link text/tag name/Xpath) selector – (string) Element selector using the specified location strategy
Let’s take a look at the next snippet:
try {
    browser.navigate("https://www.zabbix.com/");
    browser.collectPerfEntries("open page");

    el = browser.findElement("xpath", "//span[text()='Training']");
    if (el === null) {
     throw Error("cannot find training");
    }
    el.click();

    el = browser.findElement("link text", "Schedule");
    if (el === null) {
        throw Error("cannot find application form");
    }
    el.click();
In this snippet,
I am using a browser to navigate to the Zabbix page.
I collect a range of performance entries related to opening the page (download speed, response time, etc.).
I look for an element with the text “Training” using the XPath strategy, and the selector “Training.”
I click on it, which is a method to interact with elements.
In the next part, I use the strategy “link text” to find a link with the text selector “Schedule.”
I click on it
A visual description would look like this:
Browser interaction with the zabbix.com website
Now, let’s do some more clicking to filter out all other trainings and leave only trainings in Korean and Dutch:
    el = browser.findElement("link text", "English");
    if (el === null) {
        throw Error("cannot find application form");
    }
    el.click();

    el = browser.findElement("xpath", "//span[text()='English']");
    if (el === null) {
        throw Error("cannot find application form");
    }
    el.click();

    el = browser.findElement("xpath", "//span[text()='Korean']");
    if (el === null) {
        throw Error("cannot find application form");
    }
    el.click();

    el = browser.findElement("xpath", "//span[text()='Dutch']");
    if (el === null) {
        throw Error("cannot find password input field");
    }
    el.click();

    Zabbix.sleep(2000);
English is selected by default, so the script “unclicks” it. Then it selects Korean and Dutch and uses the sleep function to have some extra time for the page to load and make a screenshot of the currently opened page:
List of trainings with language filters applied on it
Now let’s get the list of dates so we can monitor which trainings we have left in 2024:
el = browser.findElements("xpath", "//*[contains(text(), ' 20')]");
var dates = [];
for (var n = 0; n < el.length; n++) {
    dates.push(el[n].getText('2024'));
}

// Remove entries that do not contain "2024"
dates = dates.filter(function(date) {
    return date.includes('2024');
});

dates = uniq(dates);
In this case we do a bit of a jump, and now search for all elements that contain text 20 (to include all years), but filter them out by year 2024 specifically, which later can be easily replaced with 2025. The end result contains all the upcoming training dates:
Items containing the upcoming training dates
The full host export with the script snippet can be found by following this link.
An additional example
But what if I want to fill in a form? Maybe to make a purchase, create an order, or just test a contact form? Good news – that’s an even simpler operation! Let’s take a look at this snippet:
// enter name
var el = browser.findElement("xpath", "//label[text()='First Name']/following::input");
if (el === null) {throw Error("cannot find name input field");}
el.sendKeys("Aleksandrs");

// enter last name
var el = browser.findElement("xpath", "//label[text()='Last name']/following::input");
if (el === null) {throw Error("cannot find name input field");}
el.sendKeys("Petrovs-Gavrilovs");

// enter cert number
var el = browser.findElement("xpath", "//label[text()='Certificate number']/following::input");
if (el === null) {throw Error("cannot find name input field");}
el.sendKeys("CT-2404-003");

// select version
var el = browser.findElement("css selector", "form#certificate_validation>fieldset>div:nth-of-type(5)>select");
if (el === null) {throw Error("cannot find name input field");}
el.sendKeys("7.0");

// check certificate
var el = browser.findElement("xpath", "//button[text()='Check Certificate']");
if (el === null) {throw Error("cannot find name input field");}
el.click();
This way, I can validate that my certificate is still valid!
As you can see, there are multiple ways to make a browser emulate user behavior and allow us to validate whether our pages and businesses are performing the way we expect them to! You can find even more examples in Zabbix documentation and Zabbix Certified Training, which I welcome you to attend!
In this article, we will explore a practical example of using the zabbix_utils library to solve a non-trivial task – obtaining a list of alert recipients for triggers associated with a specific Zabbix host. You will learn how to easily automate the process of collecting this information, and see examples of real code that can be adapted to your needs.
Table of Contents
Over the last year, the zabbix_utils library has become one of the most popular tools for working with the Zabbix API. It is a convenient tool that simplifies interacting with the Zabbix server, proxy, or agent, especially for those who automate monitoring and management tasks.
Due to its ease of use and extensive functionality, zabbix_utils has found a following among system administrators, monitoring, and DevOps engineers. According to data from PyPI, the library has already been downloaded over 140,000 times since its release, confirming its demand within the community. It’s all thanks to you and your attention to zabbix_utils!
Task Description
Administrators often need to check which Zabbix users receive alerts for specific triggers in the Zabbix monitoring system. This can be useful for auditing, configuring new notifications, or simply for a quick diagnosis of issues. The task becomes especially relevant when you have plenty of hosts containing numerous triggers, and manually checking the recipients for each trigger through the Zabbix interface becomes very time-consuming.
In such cases, it is advisable to use a custom solution based on the Zabbix API. You can directly access all the required data using the API, and then use additional logic to determine the final alert recipients. The zabbix_utils library makes working with the Zabbix API more convenient and allows you to automate this process. In this project, we use the zabbix_utils library to write a Python script that collects a list of alert recipients for the triggers of the selected Zabbix host. This will allow you to obtain the necessary information faster and with minimal effort.
Environment Setup and Installation
To get started with zabbix_utils, you need to install the library and configure the connection to the Zabbix API. This article provides more details and examples on getting started with the library. However, it would be better if I describe the basic steps to prepare the environment here.
The library supports several installation methods described in the official README, making it convenient for use in different environments.
1. Installation via pip
The simplest and most common installation method is using the pip package manager. To do this, execute the command:
~$ pip install zabbix_utils
To install all necessary dependencies for asynchronous work, you can use the command:
~$ pip install zabbix_utils[async]
This method is suitable for most users, as pip automatically installs all required dependencies.
2. Installation from Zabbix Repository
Since writing the previous articles, we have added one more installation method – from the official Zabbix repository. First and foremost, you need to add the repository to your system if it has not been installed yet. Official Zabbix packages for Red Hat Enterprise Linux and Debian-based distributions are available on the Zabbix website.
For Red Hat Enterprise Linux and derivatives:
~# dnf install python3-zabbix-utils
For Debian / Ubuntu and derivatives:
~# apt install python3-zabbix-utils
3. Installation from Source Code
If you require the latest version of the library that has not yet been published on PyPI, or you want to customize the code, you can install the library directly from GitHub:
After installing zabbix_utils, it is a good idea to check the connection to your Zabbix server via the API. To do this, use the URL to the Zabbix server, the token, or the username and password of the user who has permission to access the Zabbix API.
Now that the environment is set up, let’s look at the main steps for solving the task of retrieving the list of alert recipients for triggers associated with a specific Zabbix host in Zabbix.
In zabbix_utils, asynchronous API interaction support is built in through the AsyncZabbixAPI class. This allows multiple requests to be sent simultaneously and their results to be handled as they become ready, significantly reducing latencies when making multiple API calls. Therefore, we will use the AsyncZabbixAPI class and the asynchronous approach in this project.
Below are the main steps for solving the task, and code examples for each step. Please note that the code in this project is for demonstration purposes, may not be optimal, or could contain errors. Use it as an example or a base for your project, but not as a complete tool.
Step 1. Obtain Host ID
The first step is to identify the host for which we will retrieve information about triggers and alerts. We need to find the hostid using its name/host to do this. The Zabbix API provides a method to obtain this information, and using zabbix_utils makes this process much simpler.
This method returns a unique identifier for the host, which can be used further. However, for our test project, we will use a manually specified host identifier.
Step 2. Retrieve Host Triggers
With the hostid in hand, the next step is to retrieve all triggers associated with this host. Triggers contain the conditions that trigger the alerts. We need to collect information about all triggers so that we can then use it to select actions that match all the conditions.
This request returns complete information about the triggers for the host. We get not only the triggers but also their tags, associated host and host groups, and discovery rule information. All this information will be necessary to check the conditions of the actions.
Step 3. Initialize Trigger Metadata
At this stage, objects for each trigger are created to store their metadata. This is done using the Trigger class, which includes information about the trigger such as its name, ID, associated host groups, hosts, tags, templates, and operations.
Here’s the code defining the Trigger class:
classTrigger:def__init__(self, trigger):self.name=trigger["description"]self.triggerid=trigger["triggerid"]self.hostgroups= [g["groupid"] forgintrigger["hostgroups"]]self.hosts= [h["hostid"] forhintrigger["hosts"]]self.tags= {t["tag"]: t["value"] fortintrigger["tags"]}self.tmpl_triggerid=self.triggeridself.lld_rule=trigger["discoveryRule"] or {}iftrigger["templateid"] !="0":self.tmpl_triggerid=trigger["templateid"]self.templates= []self.messages= []self._conditions= {"0": self.hostgroups,"1": self.hosts,"2": [self.triggerid],"3": trigger["event_name"] ortrigger["description"],"4": trigger["priority"],"13": self.templates,"25": self.tags.keys(),"26": self.tags, }defeval_condition(self, operator, value, trigger_data):# equals or does not equalifoperatorin ["0", "1"]:equals=operator=="0"ifisinstance(value, dict) andisinstance(trigger_data, dict):ifvalue["tag"] intrigger_data:ifvalue["value"] ==trigger_data[value["tag"]]:returnequalselifvalueintrigger_dataandisinstance(trigger_data, list):returnequalselifvalue==trigger_data:returnequalsreturnnotequals# contains or does not containifoperatorin ["2", "3"]:contains=operator=="2"ifisinstance(value, dict) andisinstance(trigger_data, dict):ifvalue["tag"] intrigger_data:ifvalue["value"] intrigger_data[value["tag"]]:returncontainselifvalueintrigger_data:returncontainsreturnnotcontains# is greater/less than or equalsifoperatorin ["5", "6"]:greater=operator!="5"try:ifint(value) <int(trigger_data):returnnotgreaterifint(value) ==int(trigger_data):returnTrueifint(value) >int(trigger_data):returngreaterexcept:raiseValueError("Values must be numbers to compare them" )defselect_templates(self, templates):fortemplateintemplates:ifself.tmpl_triggeridin [t["triggerid"] fortintemplate["triggers"]]:self.templates.append(template["templateid"])ifself.lld_rule.get("templateid") in [d["itemid"] fordintemplate["discoveries"] ]:self.templates.append(template["templateid"])defselect_actions(self, actions):selected_actions= []foractioninactions:conditions= []if"filter"inaction:conditions=action["filter"]["conditions"]eval_formula=action["filter"]["eval_formula"]# Add actions without conditions directlyifnotconditions:selected_actions.append(action)continuecondition_check= {}forconditioninconditions:if (condition["conditiontype"] !="6"andcondition["conditiontype"] !="16" ):if (condition["conditiontype"] =="26"andisinstance(condition["value"], str) ):condition["value"] = {"tag": condition["value2"],"value": condition["value"], }ifcondition["conditiontype"] inself._conditions:condition_check[condition["formulaid"] ] =self.eval_condition(condition["operator"],condition["value"],self._conditions[condition["conditiontype"] ], )else:condition_check[condition["formulaid"] ] =Trueforformulaid, bool_resultincondition_check.items():eval_formula=eval_formula.replace(formulaid, str(bool_result))
# Evaluate the final condition formulaifeval(eval_formula):selected_actions.append(action)returnselected_actionsdefselect_operations(self, actions, mediatypes):messages_metadata= []foractioninself.select_actions(actions):messages_metadata+=self.check_operations("operations", action, mediatypes )messages_metadata+=self.check_operations("update_operations", action, mediatypes )messages_metadata+=self.check_operations("recovery_operations", action, mediatypes )returnmessages_metadata
defcheck_operations(self, optype, action, mediatypes):messages_metadata= []optype_mapping= {"operations": "0", # Problem event"recovery_operations": "1", # Recovery event"update_operations": "2", # Update event }operations=copy.deepcopy(action[optype])# Processing "notify all involved" scenariosforidx, _inenumerate(operations):ifoperations[idx]["operationtype"] notin ["11", "12"]:continue# Copy operation as a template for reuseop_template=copy.deepcopy(operations[idx])deloperations[idx]# Checking for message sending operationsforkeyin [kforkin ["operations", "update_operations"] ifk!=optype ]:ifnotaction[key]:continue# Checking for message sending type operationsforopin [oforoinaction[key] ifo["operationtype"] =="0" ]:# Copy template for the current operationoperation=copy.deepcopy(op_template)operation.update( {"operationtype": "0","opmessage_usr": op["opmessage_usr"],"opmessage_grp": op["opmessage_grp"], } )operation["opmessage"]["mediatypeid"] =op["opmessage" ]["mediatypeid"]operations.append(operation)foroperationinoperations:ifoperation["operationtype"] !="0":continue# Processing "all mediatypes" scenarioifoperation["opmessage"]["mediatypeid"] =="0":formediatypeinmediatypes:operation["opmessage"]["mediatypeid"] =mediatype["mediatypeid" ]messages_metadata.append(self.create_messages(optype_mapping[optype], action, operation, [mediatype ] ) )else:messages_metadata.append(self.create_messages(optype_mapping[optype],action,operation,mediatypes ) )returnmessages_metadatadefcreate_messages(self, optype, action, operation, mediatypes):message=Message(optype, action, operation)message.select_mediatypes(mediatypes)self.messages.append(message)returnmessage
The code for creating Trigger class objects for each of the retrieved triggers:
This loop iterates through all triggers and saves them in a dictionary called triggers_metadata, where the key is the triggerid and the value is the trigger object.
Step 4. Retrieve Template Information
The next step is to obtain data about the templates associated with all the triggers:
This request returns information about all templates linked to the host’s triggers being examined. Executing a single query for all triggers is a more optimal solution than making individual requests for each trigger. This information will be needed for evaluating the “Template” condition in actions.
Step 5. Get Actions and Media Types
Next, we obtain the list of actions and media types configured in the system:
Here we retrieve actions that define how and to whom alerts are sent, and mediatypes through which users can receive notifications (for example, email or SMS).
Step 6. Match Triggers with Templates and Actions
At this stage, each trigger is associated with the corresponding templates and actions:
Here, for each trigger, we update information about its templates and configured actions for sending notifications. The list of associated actions is determined by checking the conditions specified in them against the accumulated data for each trigger.
For each operation of the corresponding trigger action, a Message class object is created:
classMessage:def__init__(self, optype, action, operation):self.optype=optypeself.mediatypename=""self.actionid=action["actionid"]self.actionname=action["name"]self.operationid=operation["operationid"]self.mediatypeid=operation["opmessage"]["mediatypeid"]self.subject=operation["opmessage"]["subject"]self.message=operation["opmessage"]["message"]self.default_msg=operation["opmessage"]["default_msg"]self.users= [u["userid"] foruinoperation["opmessage_usr"]]self.groups= [g["usrgrpid"] forginoperation["opmessage_grp"]]self.recipients= []# Escalation period set to action's period if not specifiedself.esc_period=operation.get("esc_period", "0")ifself.esc_period=="0":self.esc_period=action["esc_period"]# Use action's escalation period if unsetself.esc_step_from=self.multiply_time(self.esc_period, int(operation.get("esc_step_from", "1")) -1 )ifoperation.get("esc_step_to", "0") !="0":self.repeat_count=str(int(operation["esc_step_to"]) -int(operation["esc_step_from"]) +1 )# If not a problem event, set repeat count to 1elifself.optype!="0":self.repeat_count="1"# Infinite repeat count if esc_step_to is 0else:self.repeat_count=“∞”defmultiply_time(self, time_str, multiplier):# Multiply numbers within the time stringresult=re.sub(r"(\d+)",lambdam: str(int(m.group(1)) *multiplier),time_str )ifresult[0] =="0":return"0"returnresultdefselect_mediatypes(self, mediatypes):formediatypeinmediatypes:ifmediatype["mediatypeid"] ==self.mediatypeid:self.mediatypename=mediatype["name"]# Select message templates related to operation typemsg_template= [mforminmediatype["message_templates"]if (m["recovery"] ==self.optypeandm["eventsource"] =="0" ) ]# Use default message if applicableifmsg_templateandself.default_msg=="1":self.subject=msg_template[0]["subject"]self.message=msg_template[0]["message"]defselect_recipients(self, user_groups, recipients):forgroupidinself.groups:ifgroupidinuser_groups:self.users+=user_groups[groupid]foruseridinself.users:ifuseridinrecipients:recipient=copy.deepcopy(recipients[userid])ifself.mediatypeidinrecipient.sendto:recipient.mediatype =Trueself.recipients.append(recipient)
Each such object represents a separate message sent to users (recipients) and will contain all message information – its subject, text, recipients, and escalation parameters.
Step 7. Collect User and Group Identifiers
After matching the triggers with actions, the process of collecting unique identifiers for users and groups starts:
This code snippet collects the IDs of all users and groups involved in the operations for each trigger. This is necessary to perform only one request to the Zabbix API for all involved users and their groups, rather than making separate requests for each trigger.
Step 8. Obtain User and Group Information
The next step is to collect detailed information about users and user groups:
Here we gather data about users, including their role and media types through which they receive notifications, as well as data about user groups, including access rights to host groups and the list of users in each group. All this information will be needed to check access to the host with the triggers we are working with.
Step 9. Match Users and Groups with Triggers
After obtaining user information, we match users and groups with their respective rights to receive notifications. Here we also link users with groups, updating the information regarding rights and groups for each user.
foruseridin userids:ifuseridin users:user= users[userid] recipients[userid] =Recipient(user)forgroupinuser["usrgrps"]:ifgroup["usrgrpid"] in usergroups: recipients[userid].permissions.update([h["id"]forhin usergroups[group["usrgrpid"]]["hostgroup_rights"]ifint(h["permission"]) >1 ])forgroupidin groupids:ifgroupidin usergroups:group= usergroups[groupid] user_groups[group["usrgrpid"]] = []foruseringroup["users"]: user_groups[group["usrgrpid"]].append(user["userid"])ifuser["userid"] in recipients: recipients[user["userid"]].groups.update(group["usrgrpid"])elifuser["userid"] in users: recipients[user["userid"]] =Recipient(users[user["userid"]]) recipients[user["userid"]].permissions.update([h["id"]forhingroup["hostgroup_rights"]ifint(h["permission"]) >1 ])
This code fragment connects each user with their groups and vice versa, creating a complete list of users with their access rights to the host, and thus their eligibility to receive notifications about events for this host.
For each recipient, a Recipient class object is created containing data about the recipient, such as the notification address, access rights to hosts, configured mediatypes, etc.
Here’s the code that describes the Recipient class:
classRecipient:def__init__(self, user):self.userid=user["userid"]self.username=user["username"]self.fullname="{name}{surname}".format(**user).strip()self.type=user["role"]["type"]self.groups=set([g["usrgrpid"] forginuser["usrgrps"]])self.has_right=Falseself.permissions=set()self.sendto= {m["mediatypeid"]: m["sendto"] forminuser["medias"] ifm["active"] =="0" }# Check if the user is a super admin (type 3)ifself.type=="3":self.has_right=True
Step 10. Match Messages with Recipients
Finally, we match recipients with specific messages from Step 6:
This step completes the main process – each message is assigned to the relevant recipients.
Step 11. Check Recipient Access Rights and Output the Result
Before the actual output of the result with the list of recipients, we can perform a check of the recipients’ message rights and filter only those who have the corresponding rights to receive notifications for the events related to the trigger, or those who have all configured media types specified and active. After these actions, the information can be output in any convenient way – whether it be exporting to a file or displaying it on the screen:
All the examples and code snippets described above have been compiled to create a solution demonstrating the algorithm for obtaining notification recipients for triggers associated with the selected host. We have implemented this algorithm as a simple web interface to make the result more illustrative and convenient for familiarization.
This interface allows users to enter the host’s ID. The script then processes the data and provides a list of notification recipients associated with the triggers on that host. The web interface uses asynchronous requests to the Zabbix API and the zabbix_utils library to ensure fast data processing and ease of use with many triggers and users.
This lets you familiarize yourself with the theoretical steps and code examples and also try to put this solution into action.
Please note once again that the code in this project is for demonstration purposes, may not be optimal, or could contain errors. Use it as an example or a base for your project, but not as a complete tool.
The web interface’s complete source code and installation instructions can be found on GitHub.
Conclusion
In this article, we explored a practical example of using the zabbix_utils library to solve the task of obtaining alert recipients for triggers associated with a selected Zabbix host using the Zabbix API. We detailed the key steps, from setting up the environment and initializing trigger metadata to working with notification recipients and optimizing performance with asynchronous requests.
Using zabbix_utils allowed us to optimize and accelerate interaction with the Zabbix API, expanding the capabilities of the Zabbix web interface and increasing efficiency when working with large volumes of data. Thanks to support for asynchronous processing and selective API requests, it is possible to significantly reduce the load on the server and improve system performance when working with Zabbix, which is especially important in large infrastructures.
We hope this example will assist you in implementing your own solutions based on the Zabbix API and zabbix_utils, and demonstrate the possibilities for optimizing your interaction with the Zabbix API.
With Zabbix Cloud you can near-instantly deploy a feature-complete Zabbix environment fine-tuned for best possible performance.
Have you ever wanted to deploy a Zabbix instance in just a few clicks without having to worry about creating orchestrations or writing scripts to achieve this task? What about always having the latest stable Zabbix version without having to go through the upgrade procedure yourself? And then there’s scalability – what if we told you that we can offer you a Zabbix instance that can be rescaled at a moment’s notice with the most optimal performance configuration for your monitoring workloads?
No, you’re not dreaming (try pinching yourself) – you’re simply looking at our latest offering – Zabbix Cloud.
Introducing – Zabbix Cloud
With Zabbix Cloud, anyone can deploy their own Zabbix instance with a push of a button. Forget about allocating dedicated hardware, installing packages or configuring docker containers. All you have to do is name your instance, select a compute offering and a region and you’re good to go!
With Zabbix Cloud you will get:
7 Compute tiers
5 Datacenter regions
Initial 10GB of storage free of charge
Full Zabbix feature set
A Zabbix instance optimized for best possible performance
Customizable history retention periods
Ability to define access filters and encrypt Zabbix connections
Automatic version updates and node backups
Zabbix Cloud does not limit your monitoring in any way – Zabbix Cloud nodes are fully capable of leveraging the same data collection, processing and analysis method as an on-prem Zabbix instance.
But how about instead of us talking about Zabbix Cloud, we give you a chance to deploy a trial Zabbix Cloud node – you know what they say – “Show, don’t tell”. Anyone can sign up for a free 5 day trial and check out Zabbix Cloud for themselves – no billing information required!
Note that Zabbix Cloud is currently in Early access. During the early access period sign-ups for Zabbix Cloud will processed and accepted in batches, which means it may take some time for us to process your Zabbix Cloud sign-up request.
Deploying a Zabbix Cloud node
Deploying a Zabbix Cloud node can be done with just a few clicks. Simply press the “Create new node” button, give your node a name and select your Region, Compute tier and Disk size. Once the node deployment is complete, you can access your Cloud Zabbix instance via its DNS name and the provided login credentials for the Admin account.
In case you forgot to copy or lost the initial password – the initial password can be copied to clipboard, cleared and reset by accessing the Overview tab of the Node configuration section.
Configure a new Zabbix Cloud node
Upgrading Zabbix Cloud node compute tier and storage space
There are only two limiting factors for Zabbix Cloud nodes – the available storage space and the number of maximum supported new values per second for a particular compute tier.
Once a maximum supported number of new values per second (NVPS) for the current compute tier is reached, the values exceeding the limit will be discarded at random. You can either reduce the number of collected metrics to match the compute tier NVPS limitations or upgrade your node to a higher compute tier to support the required number of NVPS. Upgrading to a higher compute tier can be done from the Upgrade tab of the Node Configuration section.
Disk utilization can also be increased from the Upgrade tab of the Node configuration section. Note that once you have increased your Zabbix Cloud node storage you will not be able to decrease it!
In addition, storage space usage can be adjusted by modifying the history retention periods. This can be done in the History tab of the Node configuration section. Here you can adjust storage periods for various types of history, trend and auditlog data. Reducing the storage periods will also reduce the total space usage on the current node.
Zabbix Cloud users can upgrade the Zabbix Cloud node Compute tier and Disk size
Automatic upgrades to the latest version
With Zabbix Cloud you don’t have to worry about manually upgrading your Zabbix Cloud nodes to the latest minor or major releases. Once the latest Zabbix release passes the internal testing and QA for Zabbix Cloud deployment, your Zabbix Cloud instance will be automatically upgraded to the latest version during the weekly maintenance periods chosen by you under the Node configuration section.
The upgrade to the latest Zabbix major release can be postponed but it cannot be cancelled. Eventually, your Zabbix cloud node will be automatically upgraded to the latest major version.
This ensures that your Zabbix Cloud nodes will always have all of the latest features, performance improvements and security fixes applied on them after passing a thorough internal QA process.
Backing up your Zabbix cloud node
Zabbix Cloud provides two options for performing Zabbix Cloud node backups:
Free automatic weekly backups
Manual backups with an attached monthly cost
Manual backups can be performed from the Backups tab of the Node configuration section. Here you can also see the next scheduled automatic backup and restore your Zabbix Cloud node from an existing backup. Currently Zabbix Cloud node backups cannot be exported from Zabbix Cloud and existing Zabbix instances cannot be migrated to Zabbix Cloud.
Zabbix Cloud nodes are automatically backed up on a weekly basis
Maintenance windows
Each of your Zabbix Cloud nodes is required to have at least 1 hour long weekly maintenance window defined in the Maintenance tab of the Node configuration section.
During the maintenance the following upgrades might be performed on your Zabbix Cloud node:
Be upgraded to the latest Zabbix release
Have the latest security fixes applied on the nodes
Have the latest platform level upgrades applied on the nodes
Be optimized for best possible performance
Zabbix nodes may be taken offline during the maintenance period if the maintenance tasks require it.
Zabbix Cloud nodes are required to have weekly maintenance window of at least 1 hour assigned to them
Conclusion
With Zabbix Cloud, deploying a fully optimized Zabbix instance is easier than ever. Automated upgrades and backups ensure that Zabbix Cloud will position itself as a streamlined, secure and up-to-date product with 24/7 availability and the latest Zabbix features available to everyone, no matter their technical proficiency in managing, tuning and upgrading Zabbix environments.
On top of that, Zabbix provides a large selection of professional services with the goal of helping our users to configure and troubleshoot their monitoring workflows, deliver custom templates, integrate Zabbix nodes with 3rd party solutions and more! Check out the full list of Zabbix professional services and see how we can further enhance your Zabbix experience.
Zabbix plays a crucial role in monitoring all kinds of “things” – IoT devices,domains, cloud infrastructures and more. It can also be integrated with third-party solutions – for example, with Oxidized for configuration backup monitoring. Given the nature of Zabbix, it usually contains a lot of confidential information as well as (more importantly) some kind of elevated access to network elements while being used by operators, engineers, and customers. This requires that Zabbix as a product should be as secure as possible.
Zabbix has upped their security game and is actively working with HackerOne to take full advantage of the reach of their global community by providing a bug bounty program. And though it doesn’t happen too often, from time to time a security issue arises in Zabbix or one of its dependencies, warranting the release of a Security Advisory.
Table of Contents
The issue
Zabbix typically releases a Security Advisory and might even assign a CVE to the issue. Cool, that is what we expect from reputable software developers. They even inform their customers with support contracts before publishing the advisory, in order to allow them to patch installations beforehand.
Unfortunately, if you don’t have a support contract you’re expected to find out about these security advisories on your own, either by monitoring the Security Advisory page or by monitoring the published CVEs for Zabbix. NIST has a public API that can be used and that works well, but the issue with CVE’s is that they are often incomplete and thus useless. For example, CVE-2024-22119 contains far less information than the advisory.
Currently, Zabbix does not publish an API for their Security Advisories. There is the public tracker which contains all entries and can be queried via API, but because it is unstructured text, it is really hard to parse.
The solution
We want to automatically be notified of new security advisories, and the only data source that contains all data in a structured way is the Zabbix Security Advisory page. However, structured doesn’t mean easily parseable – in fact, it is just raw HTML. We could try to solve this issue in Zabbix, but the easier solution in this case is to scrape the page and generate a JSON file which then can be parsed by Zabbix to achieve our goal, which is automated notifications of new advisories.
Webscraping
We’ve chosen to scrape the Zabbix site using Rust, utilizing the Scraper crate to parse the HTML and flesh out the relevant parts we want. Without going into too much detail, the interesting information is stored in 2 tables, one with the table-simple class applied and one with the table-vertical class applied. Using CSS selectors (which is what the Scraper crate requires), we can retrieve the information we want.
This information is then stored in a struct, which gets added to a hashmap. The result is stored in a vector, which is added to a struct, which eventually is used to generate the JSON we require. Phew.
The ‘reports’ array contains one entry per advisory, and each entry has the following layout. Unsurprisingly, this closely matches the information that is available on the Zabbix Security Advisory page:
Now, we could provide you with the code of the scraping tool and wish you good luck with making sure the tool runs every X hours and somehow, somewhere stores the resulting JSON for Zabbix to parse. That would be the easy way out, right?
Instead, we’ve chosen to host the Rust program as an AWS Lambda function, triggered every 2 hours by the AWS EventBridge Scheduler and with some code added to the Rust program (function?) to upload the resulting JSON to an AWS S3 bucket. This chain of AWS products not only makes sure that our cloud bill increases, but also guarantees we don’t have to host (and maintain!) anything ourselves.
Now that the data is available in JSON, it’s fairly easy to parse it using Zabbix. Using the HTTP Agent data collection, we download the JSON from AWS. The URI is stored in the {$ZBX_ADVISORY_URI} macro, which allows for easy modification. By default, it points to the JSON file hosted on AWS S3. This retrieval is done by the Retrieve the Zabbix Security Advisories item, which acts as the source for every other operation. It retrieves the JSON every hour, and with the JSON being generated every 2 hours, the maximum delay between Zabbix publishing a new advisory and you getting it into Zabbix is 3 hours.
The retrieve the Zabbix Security Advisories item acts as a master item for the Last Updated item. This item uses a JSONPath preprocessing step to flesh out the information we want: $.last_updated.secs. The resulting data is stored as unixtime so that we mere mortals can easily read when the last update of the JSON file was performed.
A trigger is configured for this item to ensure that the JSON file isn’t too old. The trigger JSON Feed is out of date has the following expression: last(/Zabbix Security Advisories/zbx_sec.last_updated)>{$ZBX_ADVISORY_UPDATE_INTERVAL}*{$ZBX_ADVISORY_UPDATE_THRESHOLD}
By default, {$ZBX_ADVISORY_UPDATE_INTERVAL} is set to 2 hours (which is the interval the file gets updated by our tool) and {$ZBX_ADVISORY_UPDATE_THRESHOLD} is set to 3. So, when the JSON file hasn’t been updated within the last 6 hours, this trigger will trigger.
The item Number of advisories uses the same principle, where a JSONPath preprocessing step is used to flesh out the information we want: $.reports. However, as $.reports is an array, we can use functions on it. In this case .length(), which returns an integer. This number is used in the associated trigger A new Zabbix Security Advisory has been published, which simply triggers when the value changes.
This is all very cool, but the JSON has a lot more information, including details about each report. In order to get these details into Zabbix, we use a discovery rule to ‘loop’ through the JSON and create items based on what we’ve discovered: Discover Advisories. This rule uses (again) a JSONPath preprocessing step to get the details we want: $.reports[*][*]. Based on the resulting data (which is a single report in this case), 2 LLD Macros are assigned: {#ZBXREF} – based on the JSONpath $.zbxref and {{#CVEREF} – based on the JSONpath $.cveref.
For each discovered report, 8 items are created. They all work using the same principle, so I will only describe one: Advisory {#ZBXREF} / {#CVEREF} – Acknowledgement. This item uses the master item Zabbix Security Advisories, just like all other items described so far. JSONPath is once again used to get the information we want. The expression $.reports[*][“{#ZBXREF}”].acknowledgement.first() provides exactly what we need, where we combine a LLD macro ({#ZBXREF}) and a JSONpath function (.first()) to first ‘select’ the correct advisory in the JSON and then retrieve the value.
All other 7 items work like this, and there is only one exception: Advisory {#ZBXREF} / {#CVEREF} – Components. The ‘components’ value in the JSON file is actually an array with 1 or more items, describing which components might be affected. But we cannot store arrays in Zabbix, so we use another preprocessing step to convert the array into a string. A few lines of Javascript is all we need:
First, we parse the JSON input (‘value’) into an array, only to apply the javascript .toString() function on it. The toString method of arrays calls join() internally, which joins the array and returns one string containing each array element separated by commas, which is exactly what we want: a string, separated by commas.
To make working with these advisories easier, each item has the componenttag applied, with the value zabbix_security. If the item belongs to an advisory, the advisory tag is added with the value of {#ZBXREF} (which is the advisory number/name). That way, we can easily filter on all Zabbix Security items, filter on all items for a single advisory, and (to make things even better) the type tag is also applied, with the actual type being ‘workaround’ or ‘description.’ This allows for filtering on all Zabbix Security items, of the type ‘score’ (et cetera) to easily gain insight into the different advisories and their score, synopsis, description, components, et cetera.
Dashboard
The tags on the items allow for filtering, but with Zabbix 7.0 we can use all great new nifty features, such as the Item Navigator widget combined with the Item Value widget. Let’s take a look at what configuring such a dashboard might look like if you set up the Item Navigator widget as follows:
And then ‘link’ the Item Value widget to it:
You should get a somewhat decent dashboard. It isn’t perfect (given that the Item Value widget only seems to be able to display a single line of text) but it’s something.
Disclaimer
Though we use this functionality ourselves, this all comes without any guarantee. The technology used to retrieve data (screen scraping) is mediocre at best and could break at any moment if and when Zabbix changes the layout of their page.
An audit improves the security of a product, specifically the “non-repudiation” aspect in threat-models (risks are reduced when threat-agents cannot deny they did malicious activity). Zabbix 5.0 already had audit functionality, which received a major rewrite in 6.0 and several updates since then. In this blog post, we will go through them and get an overall picture of what has changed (and why).
The server side work on 6.0 was mostly done and further improved in 7.0. Front-end work is still ongoing (due to a larger scope). The main goal of a Zabbix audit is to track all configuration and settings changes – who, when, and what. This is an enterprise-level requirement, but non-enterprise users can also benefit.
Table of Contents
The situation before Zabbix 6.0
When a host or template is added, only its name is recorded, without info about items, triggers, tags, etc. The linking of the template on the host is not audited. Everything on the screen is an audit done by the front-end, except the script execution. Zabbix Server itself actually does a lot of configuration changes, including adding and updating hosts and updating items (during LLD or when linking templates during auto-registration or network discovery), but there is no audit for that at all. There are also non-configuration changes (events) we want to audit, including:
Script execution (already audited in 5.0):
Reloading passive proxy config data (ZBXNEXT-1580), added in 6.2:
HA node status change (ZBXNEXT-6923), added in 6.0, history push API requests, and sending data to Zabbix server via API (ZBXNEXT-8541), added in 7.0:
Audit overview
Most Zabbix server audit logic is in:
a) Linking of templates (as a result of auto-registration or network discovery) with updates to:
Hosts
Items
Triggers
Graphs
Discovery Rules (and prototypes of everything above)
Web Scenarios
b) LLD, with the following entities created from prototypes:
Hosts
Items
Triggers
Graphs
New audit goals
In addition to the main functional requirement to “track all configuration and settings changes,” there are additional requirements aimed at making all audits faster and easier to manage:
All audits are now stored in a single table (Simpler and faster SQL queries)
Bulk SQL inserts and efficient ids generation
The audit of a particular entity stays longer than this entity. If an entity – (host or user) is deleted – the audit for it stays
The audit has an independent housekeeping schedule
It is still possible to disable the audit
CUID
Zabbix uses an ids table to generate ids:
When something (items, triggers etc.) needs to be generated, the related row in the ids table gets locked. This represents a problem for generating audit rows, because an audit can be generated independently by the server and front-end:
So, we could end up in a situation where a user cannot create an item because the server is holding a lock on the ids table while generating thousands of new LLD items. That is why a new method for generating ID was used for audits:
Thanks to it, the front-end and server can independently generate ids for audit entries without locks. The chance of collision is astronomically low.
System user
When it is not clear under which user an audit entry needs to be generated, it is recorded under “System user.” Most of the audits done by Server are done under “System user.” One exception is “script execution,”” since it is clear which user clicked on the script execution button. However, under which user should the server record audit entries when new items are generated during LLD? We could track down which user created the LLD rule, but what if the LLD rule was then modified by another user? For such cases, “System user” is used.
RecordSetID
From the spec: “To have the ability to recognize that some set of audit log records was created during the processing of a separate operation, a new column “Recordset ID” for audit log records will be provided. Each audit log record of the separate operation will have the same recordset ID. The recordset ID will be generated using the CUID algorithm.”
We can see that 2 graphs were created in a single operation (e.g. during the linking of one template with 2 graphs).
Audit details
A new audit contains much more information on what was changed with new details:
Upgrade patch
The warning, old auditlog, and auditlog_details tables are removed during the upgrade patch to 6.0. A new auditlog table is created, and the schema is updated.
auditid is now CUID
userid can be NULL (no more foreign reference on users table)
username is added
resource_cuid is added(alternative to resource, only for HA)
recordsetid is added
note and other auditlog_details table data now is in details (JSON)
BulkSQL
It is much more efficient to execute SQL queries in bulk. Zabbix already relies on bulk SQL queries:
Inserting and/or updating thousands of new items in one query is much faster than running thousands of individual queries. There are many reasons why this is the case, but the most basic answer is that DBs are designed this way. Another reason is that a large single query in PostgreSQL needs to start the planner/optimizer once, and then it would be able to properly analyze this large query and create an efficient execution plan.
When running thousands of separate queries, the planner/optimizer needs to be started for each query, and every time it would analyze the small query and decide there is not much it can do. When a server is doing some configuration changes, like LLD or templates linking during auto-registration or network discovery, it will insert/update/delete items/triggers and also auditlog entries in one large query.
Performance impact
Quick performance tests showed that the audit slows the server at most by 4-5%. The larger the setup, the smaller the impact will be.
Storage impact and administration
Zabbix audits can generate a lot of data. If your setup generates a lot of configuration, audits can eventually overrun the storage space. In this case, there are several audit configurations that could be helpful.
First of all, an audit can be disabled for all Zabbix, including the front-end:
Disabling audit is not advised, however – this option exists mostly as a possible workaround. Audit is enabled by default and Zabbix is developed and tested with audit enabled.
Log system actions button:
A disabled audit done by Zabbix server during auto-registration, network discover, and LLD. On some systems, these can generate a lot of configurations and audits, for example when LLD discovers hundreds of new devices every minute.
This could help reduce the storage impact while preserving all other audit functionality.
Housekeeping schedule:
If a host, trigger, or graph is deleted (by housekeeper or manually), the audit generated for it stays (as it exists in a separate table).
A Zabbix audit has its own independent housekeeping schedule, and it can be adjusted to suit your environment.
One of the new features in Zabbix 7.0 LTS is proxy load balancing. As the documentation says:
Proxy load balancing allows monitoring hosts by a proxy group with automated distribution of hosts between proxies and high proxy availability.
If one proxy from the proxy group goes offline, its hosts will be immediately distributed among other proxies having the least assigned hosts in the group.
Table of Contents
Proxy group is the new construct that enables Zabbix server to make dynamic decisions about the monitoring responsibilities within the group(s) of proxies. As you can see in the documentation, the proxy group has only a minimal set of configurable settings.
One important background information to understand is that Zabbix server always knows (within reasonable timeframe) which proxies in the proxy groups are online and which are not. That’s because all active proxies connect to the Zabbix server every 1 second by default (DataSenderFrequency setting in the proxy), and Zabbix server connects to the passive proxies also every 1 second by default (ProxyDataFrequency setting in the server), so if those connections are not happening anymore, then something is wrong with using the proxy.
Initially Zabbix server will balance the hosts between the proxies in the proxy group. It can also rebalance the hosts later if needed, the algorithm is described in the documentation. That’s something we don’t need to configure (that’s the “automated distribution of hosts” mentioned above). The idea is that, at any given time, any host configured to be monitored by the proxy group is monitored by one proxy only.
Now let’s see how the actual connections work with active and passive Zabbix agents. The active/passive modes of the proxies (with the Zabbix server connectivity) don’t matter in this context, but I’m using active proxies in my tests for simplicity.
Disclaimer: These are my own observations from my own Zabbix setup using 7.0.0, and they are not necessarily based on any official Zabbix documentation. I’m open for any comments or corrections in any case.
At the very end of this post I have included samples of captured agent traffic for each of the cases mentioned below.
Passive agents monitored by a proxy group
For passive agents the proxy load balancing really is this simple: Whenever a proxy goes down in a proxy group, all the hosts that were previously monitored by that proxy will then be monitored by the other available proxies in the same proxy group.
There is nothing new to configure in the passive agents, only the usual Server directive to allow specific proxies (IP addresses, DNS names, subnets) to communicate with the agent.
As a reminder, a passive agent means that it listens to incoming requests from Zabbix proxies (or the Zabbix server), and then collects and returns the requested data. All relevant firewalls also need to be configured to allow the connections from the Zabbix proxies to the agent TCP port 10050.
As yet another reminder, each agent (or monitored host) can have both passive and active items configured, which means that it will both listen to incoming Zabbix requests but also actively request any active tasks from Zabbix proxies or servers. But again, this is long-existing functionality, nothing new in Zabbix 7.0.
Active agents monitored by a proxy group
For active agents the proxy load balancing needs a bit new tweaking in the agent side.
By definition, an active agent is the party that initiates the connection to the Zabbix proxy (or server), to TCP port 10051 by default. The configuration happens with the ServerActive directive in the agent configuration. According to the official documentation, providing multiple comma-separated addresses in the ServerActive directive has been possible for ages, but it is for the purpose of providing data to multiple independent Zabbix installations at the same time. (Think about a Zabbix agent on a monitored host, being monitored by both a service provider and the inhouse IT department.)
Using semicolon-separated server addresses in ServerActive directive has been possible since Zabbix 6.0 when Zabbix servers are configured in high-availability cluster. That requires specific Zabbix server database implementation so that all the cluster nodes use the same database, and some other shared configurations.
Now in Zabbix 7.0 this same configuration style can be used for the agent to connect to all proxies in the proxy group, by entering all the proxy addresses in the ServerActive configuration, semicolon-separated. However, to be exact, this is not described in the ServerActive documentation as of this writing. Rather, it specifically says “More than one Zabbix proxy should not be specified from each Zabbix server/cluster.” But it works, let’s see how.
Using multiple semicolon-separated proxy addresses works because of the new redirection functionality in the proxy-agent communication: Whenever an active agent sends a message to a proxy, the proxy tells the agent to connect to another proxy, if the agent is currently assigned to some other proxy. The agent then ceases connecting to that previous proxy, and starts using the proxy address provided in the redirection instead. Thus the agent converges to using only that one designated proxy address.
In this simple example the Zabbix server determined that the agent should be monitored by Proxy 1, so when the agent initially contacted Proxy 1 (because its IP address is first in the ServerActive list), the proxy responded normally and agent was happy with that.
In case the Zabbix server had for any reason determined that the agent should be monitored by Proxy 2, then Proxy 1 would have responded with a redirection, and agent would have followed that. (There will be examples of redirections in the capture files below.)
To be clear, this agent redirection from the proxy group works only with Zabbix 7.0 agents as of this writing.
Note: In the initial version of this post I used comma-separated proxy addresses in ServerActive (instead of semicolon-separated), and that caused duplicate connections from the agent to the designated proxy (because the agent is not equipped to recognize that it connects to the same proxy twice), eventually causing data duplication in Zabbix database. Using comma-separated proxy addresses is thus not a working solution for proxy load balancing usage.
If the host-proxy assignments are changed by the Zabbix server for balancing the load between the proxies, the previously designated proxy will redirect the agent to the correct proxy address, and the situation is optimized again.
Side note: When configuring the proxies in Zabbix UI, there is a new Address for active agents field. That is the address value that is used by the proxies when responding with redirection messages to agents.
Proxy group failure scenarios with active agents
Proxy goes down
If the designated proxy of an active agent goes offline so that it doesn’t respond to the agent anymore, agent realizes the situation, discards the redirection information it had, and reverts to using the proxy addresses from ServerActive directive again.
Now, this is an interesting case because of some timing dependencies. In the proxy group configuration there is the Failover period configuration that controls the Zabbix server’s sensitivity to proxy availability in regards to agent rebalancing within the proxy group. Thus, if the agent reverts to using the other proxies faster than Zabbix server recognizes the situation and notifies the other proxies in the proxy group, the agent will get redirection responses from the other proxies, telling it to use the currently offline proxy. And the same happens again: agent fails to connect to the redirected proxy, and reverts to using the other locally configured proxies, and so on.
In my tests this looping was not very intense, only two rounds every second, so it was not very significant network-wise, and the situation will converge automatically when the Zabbix server has notified the proxies about the host rebalancing.
So this temporary looping is not a big deal. The takeaway is that the whole system converges automatically from a failed proxy.
After the failed proxy has recovered to online mode, the agents stay with their designated proxies in the proxy group.
As mentioned in the beginning, Zabbix server will automatically rebalance the hosts again after some time if needed.
Proxy is online but unreachable from the active agent
Another interesting case is one where the proxy itself is running and communicating with Zabbix server, thus being in online mode in the proxy group, but the active agent is not able to reach it, while still being able to connect to the other proxies in the group. This can happen due to various Internet-related routing issues for example, if the proxies are geographically distributed and far away from the agent.
Let’s start with the situation where the agent is currently monitored by Proxy 2 (as per the last picture above). When the failure starts and agent realizes that the connections to Proxy 2 are not succeeding anymore, the agent reverts to using the configured proxies in ServerActive, connecting to Proxy 1.
But, Proxy 1 knows (by the information given by Zabbix server) that Proxy 2 is still online and that the agent should be monitored by Proxy 2, so Proxy 1 responds to the agent with a redirection.
Obviously that won’t work for the agent as it doesn’t have connectivity to Proxy 2 anymore.
This is a non-recoverable situation (at least with the current Zabbix 7.0.0) while the reachability issue persists: The agent keeps on contacting Proxy 1, keeps receiving the redirection, and the same repeats over and over again.
Note that it does not matter if the agent is now locally reconfigured to only use Proxy 1 in this situation, because the load balancing of the hosts in the proxy group is not controlled by any of the agent-local configuration. The proxy group (led by Zabbix server) has the only authority to assign the hosts to the proxies.
One way to escape from this situation is to stop the unreachable Proxy 2. That way the Zabbix server will eventually notice that Proxy 2 is offline, and the hosts will be automatically rebalanced to other proxies in the group, thus removing the agent-side redirection to the unreachable proxy.
Keep this potential scenario in mind when planning proxy groups with proxy location diversity.
This is also something to think about if your Zabbix proxies have multiple network interfaces, where Zabbix server connectivity is using different interface from the agent connectivity. In that case the same problem can occur due to your own configurations.
Closing words
All in all, proxy load balancing looks very promising feature as it does not require any network-level tricks to achieve load balancing and high availability. In Zabbix 7.0 this is a new feature, so we can expect some further development for the details and behavior in the upcoming releases.
Appendix: Sample capture files
Ideally these capture files should be viewed with Wireshark version 4.3.0rc1 or newer because only the latest Wireshark builds include support for latest Zabbix protocol features. Wireshark 4.2.x should also show most of the Zabbix packet fields. Use display filter “zabbix” to see only the Zabbix protocol packets, but when examining cases more carefully you should also check the plain TCP packets (without any display filter) to get more understanding about the cases.
These samples are taken with Zabbix components version 7.0.0, using default timers in the Zabbix process configurations, and 20 seconds as the proxy group failover period.
Agent connected to Proxy 2, but Proxy 2 keeps sending redirects
Proxy 2 was assigned the agent before frame #1074, so it took over the monitoring and accepted the agent connections
Proxy 1 was later restarted (but agent didn’t try to connect to it yet)
The agent was manually restarted before frame #1498 and it connected to Proxy 1 again, was given a redirection to Proxy 2, and continued with Proxy 2 again
In this article, we will explore the capabilities of the new asynchronous modules of the zabbix_utils library. Thanks to asynchronous execution, users can expect improved efficiency, reduced latency, and increased flexibility in interacting with Zabbix components, ultimately enabling them to create efficient and reliable monitoring solutions that meet their specific requirements.
There is a high demand for the Python library zabbix_utils. Since its release and up to the moment of writing this article, zabbix_utils has been downloaded from PyPI more than 15,000 times. Over the past week, the library has been downloaded more than 2,700 times. The first article about the zabbix_utils library has already gathered around 3,000 views. Among the array of tools available, the library has emerged as a popular choice, offering developers and administrators a comprehensive set of functions for interacting with Zabbix components such as Zabbix server, proxy, and agents.
Considering the demand from users, as well as the potential of asynchronous programming to optimize interaction with Zabbix, we are pleased to present a new version of the library with new asynchronous modules in addition to the existing synchronous ones. The new zabbix_utils modules are designed to provide a significant performance boost by taking advantage of the inherent benefits of asynchronous programming to speed up communication between Zabbix and your service or script.
From expedited data retrieval and real-time event monitoring to enhanced scalability, asynchronous programming empowers you to build highly efficient, flexible, and reliable monitoring solutions adapted to meet your specific needs and challenges.
The new version of zabbix_utils and its asynchronous components may be useful in the following scenarios:
Mass data gathering from multiple hosts: When it’s necessary to retrieve data from a large number of hosts simultaneously, asynchronous programming allows requests to be executed in parallel, significantly speeding up the data collection process;
Mass resource exporting: When templates, hosts or problems need to be exported in parallel. This parallel execution reduces the overall export time, especially when dealing with a large number of resources;
Sending alerts from or to your system: When certain actions need to be performed based on monitoring conditions, such as sending alerts or running scripts, asynchronous programming provides rapid condition processing and execution of corresponding actions;
Scaling the monitoring system: With an increase in the number of monitored resources or the volume of collected data, asynchronous programming provides better scalability and efficiency for the monitoring system.
Installation and Configuration
If you already use the zabbix_utils library, simply updating the library to the latest version and installing all necessary dependencies for asynchronous operation is sufficient. Otherwise, you can install the library with asynchronous support using the following methods:
By using pip:
~$ pip install zabbix_utils[async]
Using [async] allows you to install additional dependencies (extras) needed for the operation of asynchronous modules.
The process of working with the asynchronous version of the zabbix_utils library is similar to the synchronous one, except for some syntactic differences of asynchronous code in Python.
Working with Zabbix API
To work with the Zabbix API in asynchronous mode, you need to import the AsyncZabbixAPI class from the zabbix_utils library:
from zabbix_utils import AsyncZabbixAPI
Similar to the synchronous ZabbixAPI, the new AsyncZabbixAPI can use the following environment variables: ZABBIX_URL, ZABBIX_TOKEN, ZABBIX_USER, ZABBIX_PASSWORD. However, when creating an instance of the AsyncZabbixAPI class you cannot specify a token or a username and password, unlike the synchronous version. They can only be passed when calling the login() method. The following usage scenarios are available here:
Use preset values of environment variables, i.e., not pass any parameters to AsyncZabbixAPI:
Pass only the Zabbix API address as input, which can be specified as either the server IP/FQDN address or DNS name (in this case, the HTTP protocol will be used) or as an URL of Zabbix API:
api = AsyncZabbixAPI(url="127.0.0.1")
After declaring an instance of the AsyncZabbixAPI class, you need to call the login() method to authenticate with the Zabbix API. There are two ways to do this:
After completing all needed API requests, it is necessary to call logout() to close the API session if authentication was done using username and password, and also close the asynchronous sessions:
The asynchronous class AsyncSender has been added, which also helps to send values to the Zabbix server or proxy for items of the Zabbix Trapper data type.
AsyncSender can be imported as follows:
from zabbix_utils import AsyncSender
Values can be sent in a group, for this it is necessary to import ItemValue:
In the example, the chunk size is set to 2. So, 5 values passed in the code above will be sent in three requests of two, two, and one value, respectively.
If your server has multiple network interfaces, and values need to be sent from a specific one, the AsyncSender provides the option to specify a source_ip for sent values:
AsyncSender also supports reading connection parameters from the Zabbix agent/agent2 configuration file. To do this, you need to set the use_config flag and specify the path to the configuration file if it differs from the default /etc/zabbix/zabbix_agentd.conf:
Getting values from Zabbix Agent/Agent2 by item key.
In cases where you need the functionality of our standart zabbix_get utility but native to your Python project and working asynchronously, consider using the AsyncGetter class. A simple example of its usage looks like this:
The new version of the zabbix_utils library provides users with the ability to implement efficient and scalable monitoring solutions, ensuring fast and reliable communication with the Zabbix components. Asynchronous way of interaction gives a lot of room for performance improvement and flexible task management when handling a large volume of requests to Zabbix components such as Zabbix API and others.
We have no doubt that the new version of zabbix_utils will become an indispensable tool for developers and administrators, helping them create more efficient, flexible, and reliable monitoring solutions that best meet their requirements and expectations.
To provide the best experiences, we use technologies like cookies to store and/or access device information. Consenting to these technologies will allow us to process data such as browsing behavior or unique IDs on this site. Not consenting or withdrawing consent, may adversely affect certain features and functions.
Functional
Always active
The technical storage or access is strictly necessary for the legitimate purpose of enabling the use of a specific service explicitly requested by the subscriber or user, or for the sole purpose of carrying out the transmission of a communication over an electronic communications network.
Preferences
The technical storage or access is necessary for the legitimate purpose of storing preferences that are not requested by the subscriber or user.
Statistics
The technical storage or access that is used exclusively for statistical purposes.The technical storage or access that is used exclusively for anonymous statistical purposes. Without a subpoena, voluntary compliance on the part of your Internet Service Provider, or additional records from a third party, information stored or retrieved for this purpose alone cannot usually be used to identify you.
Marketing
The technical storage or access is required to create user profiles to send advertising, or to track the user on a website or across several websites for similar marketing purposes.

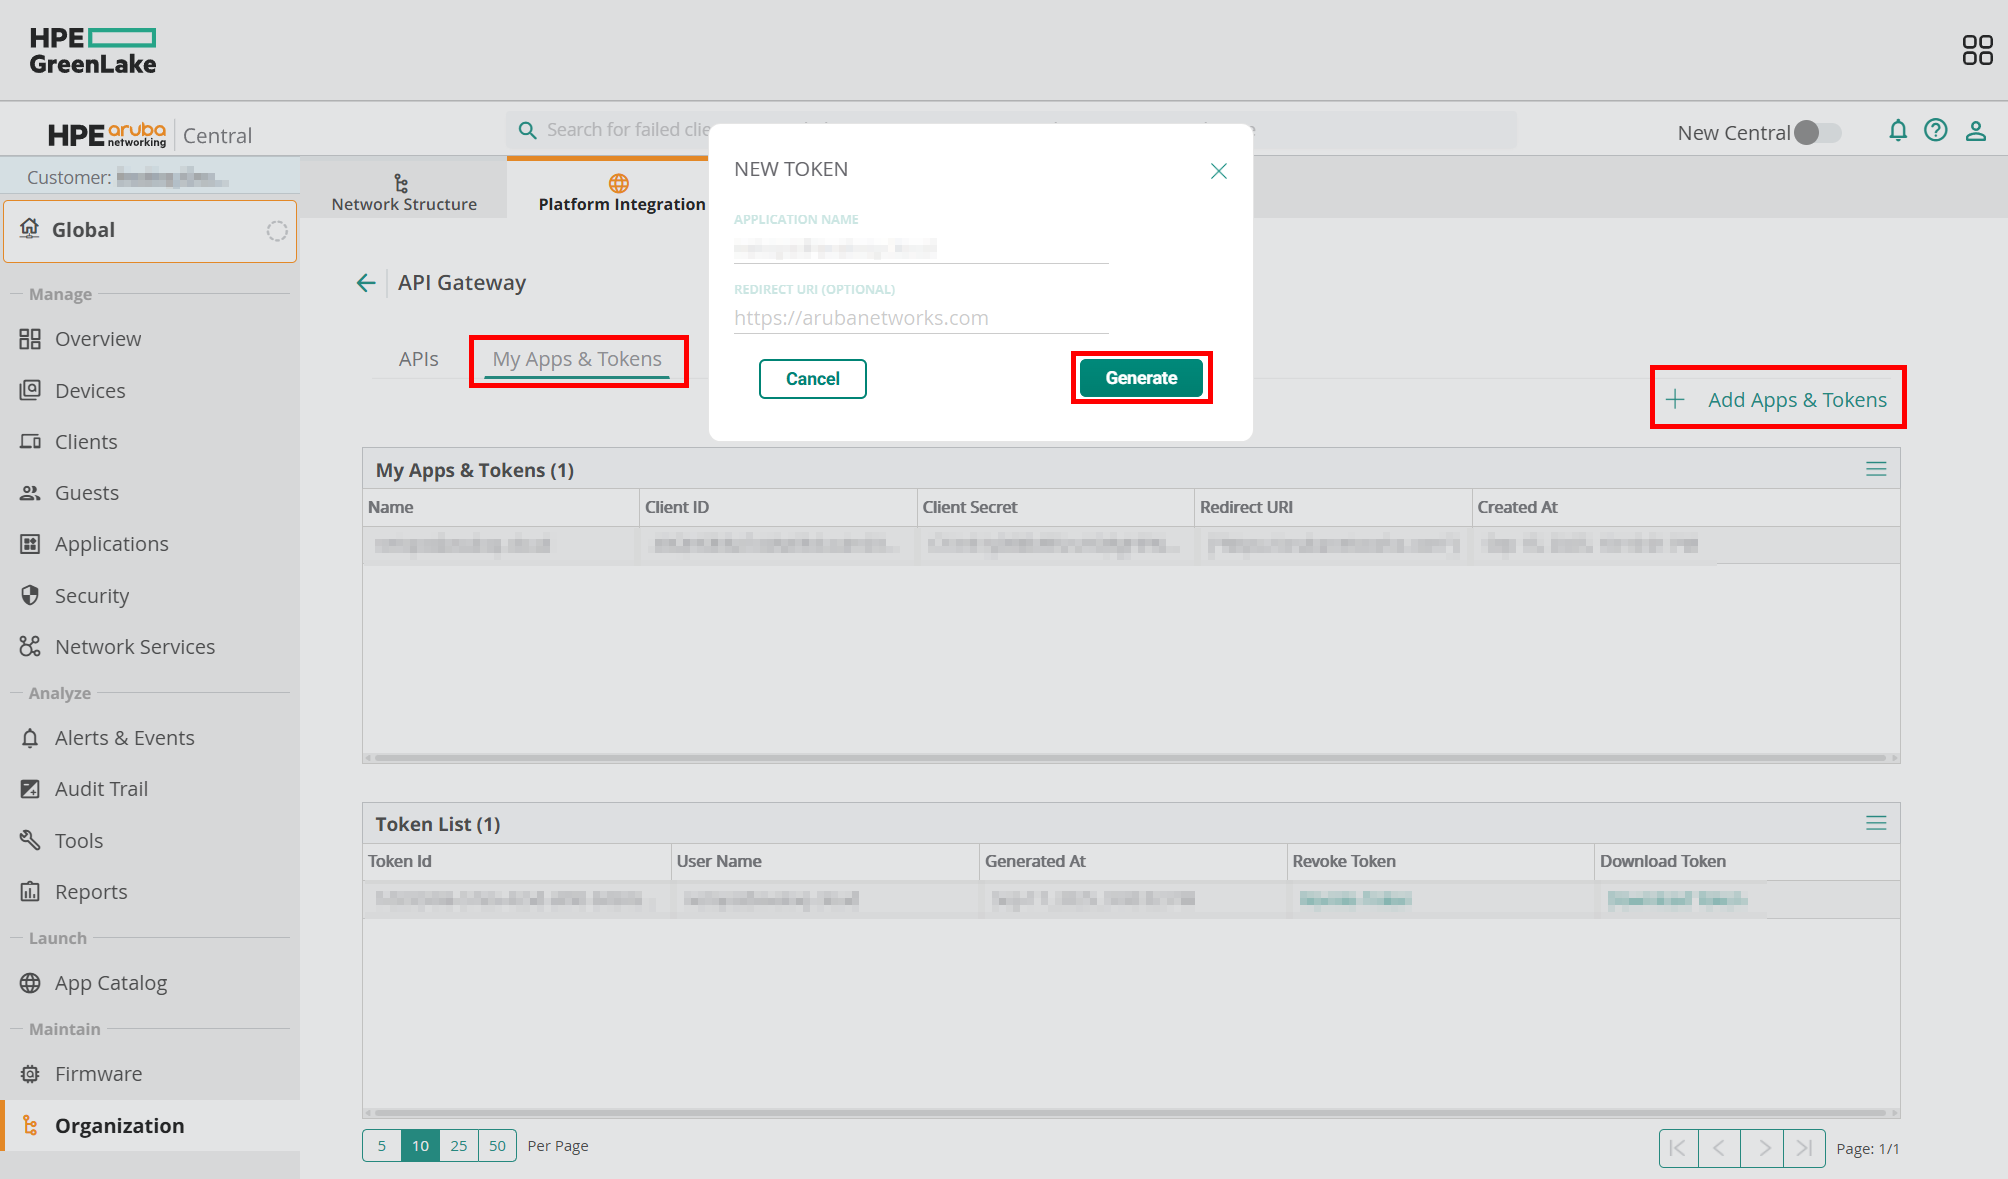
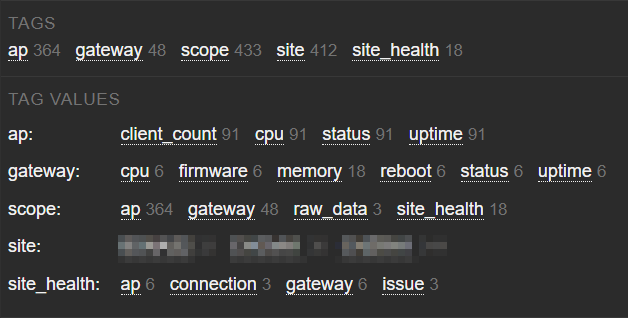
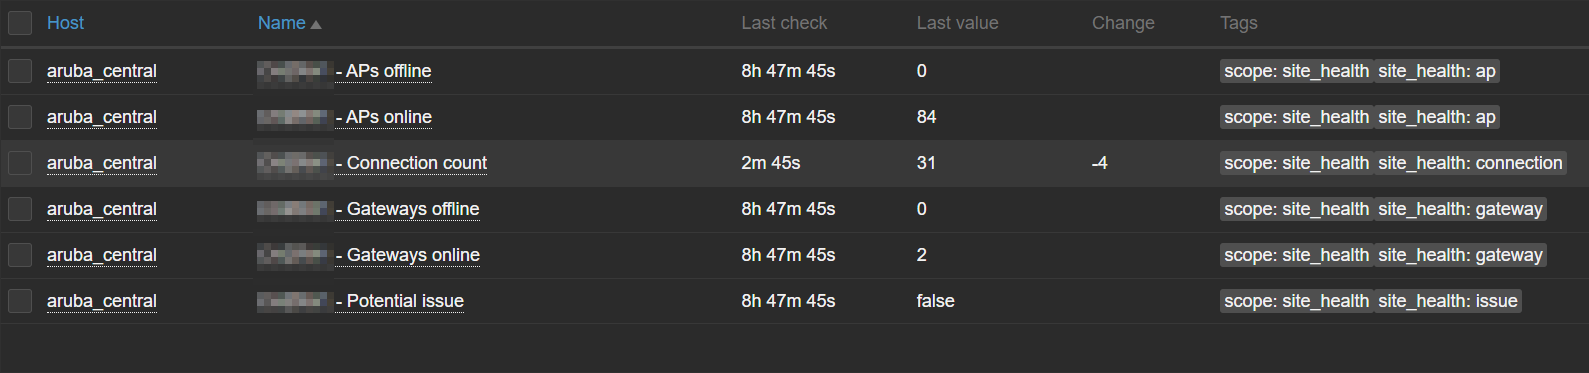
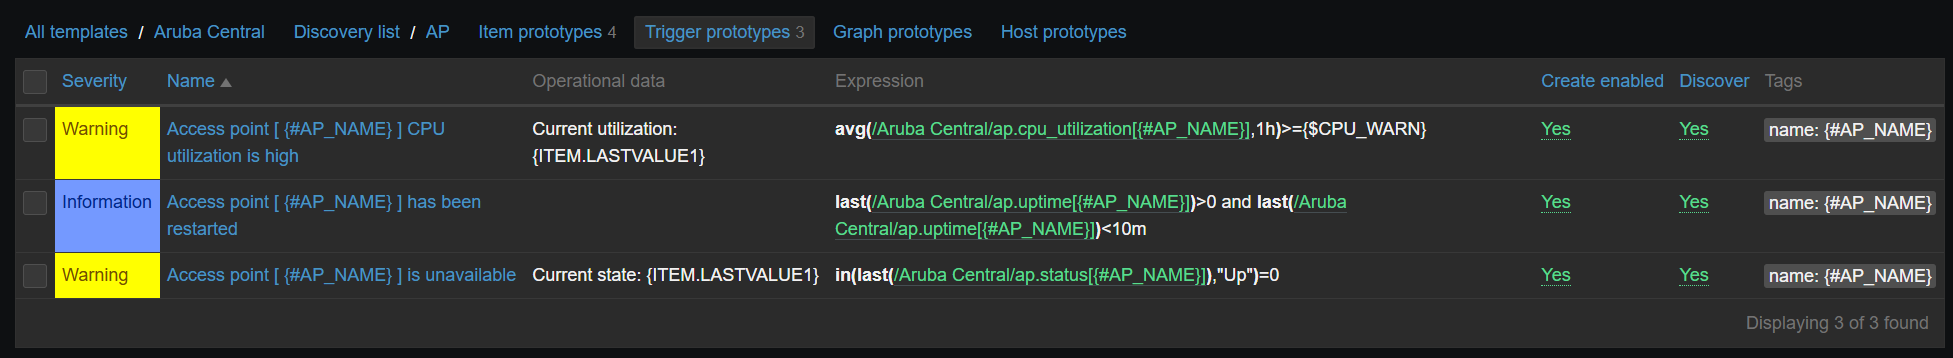

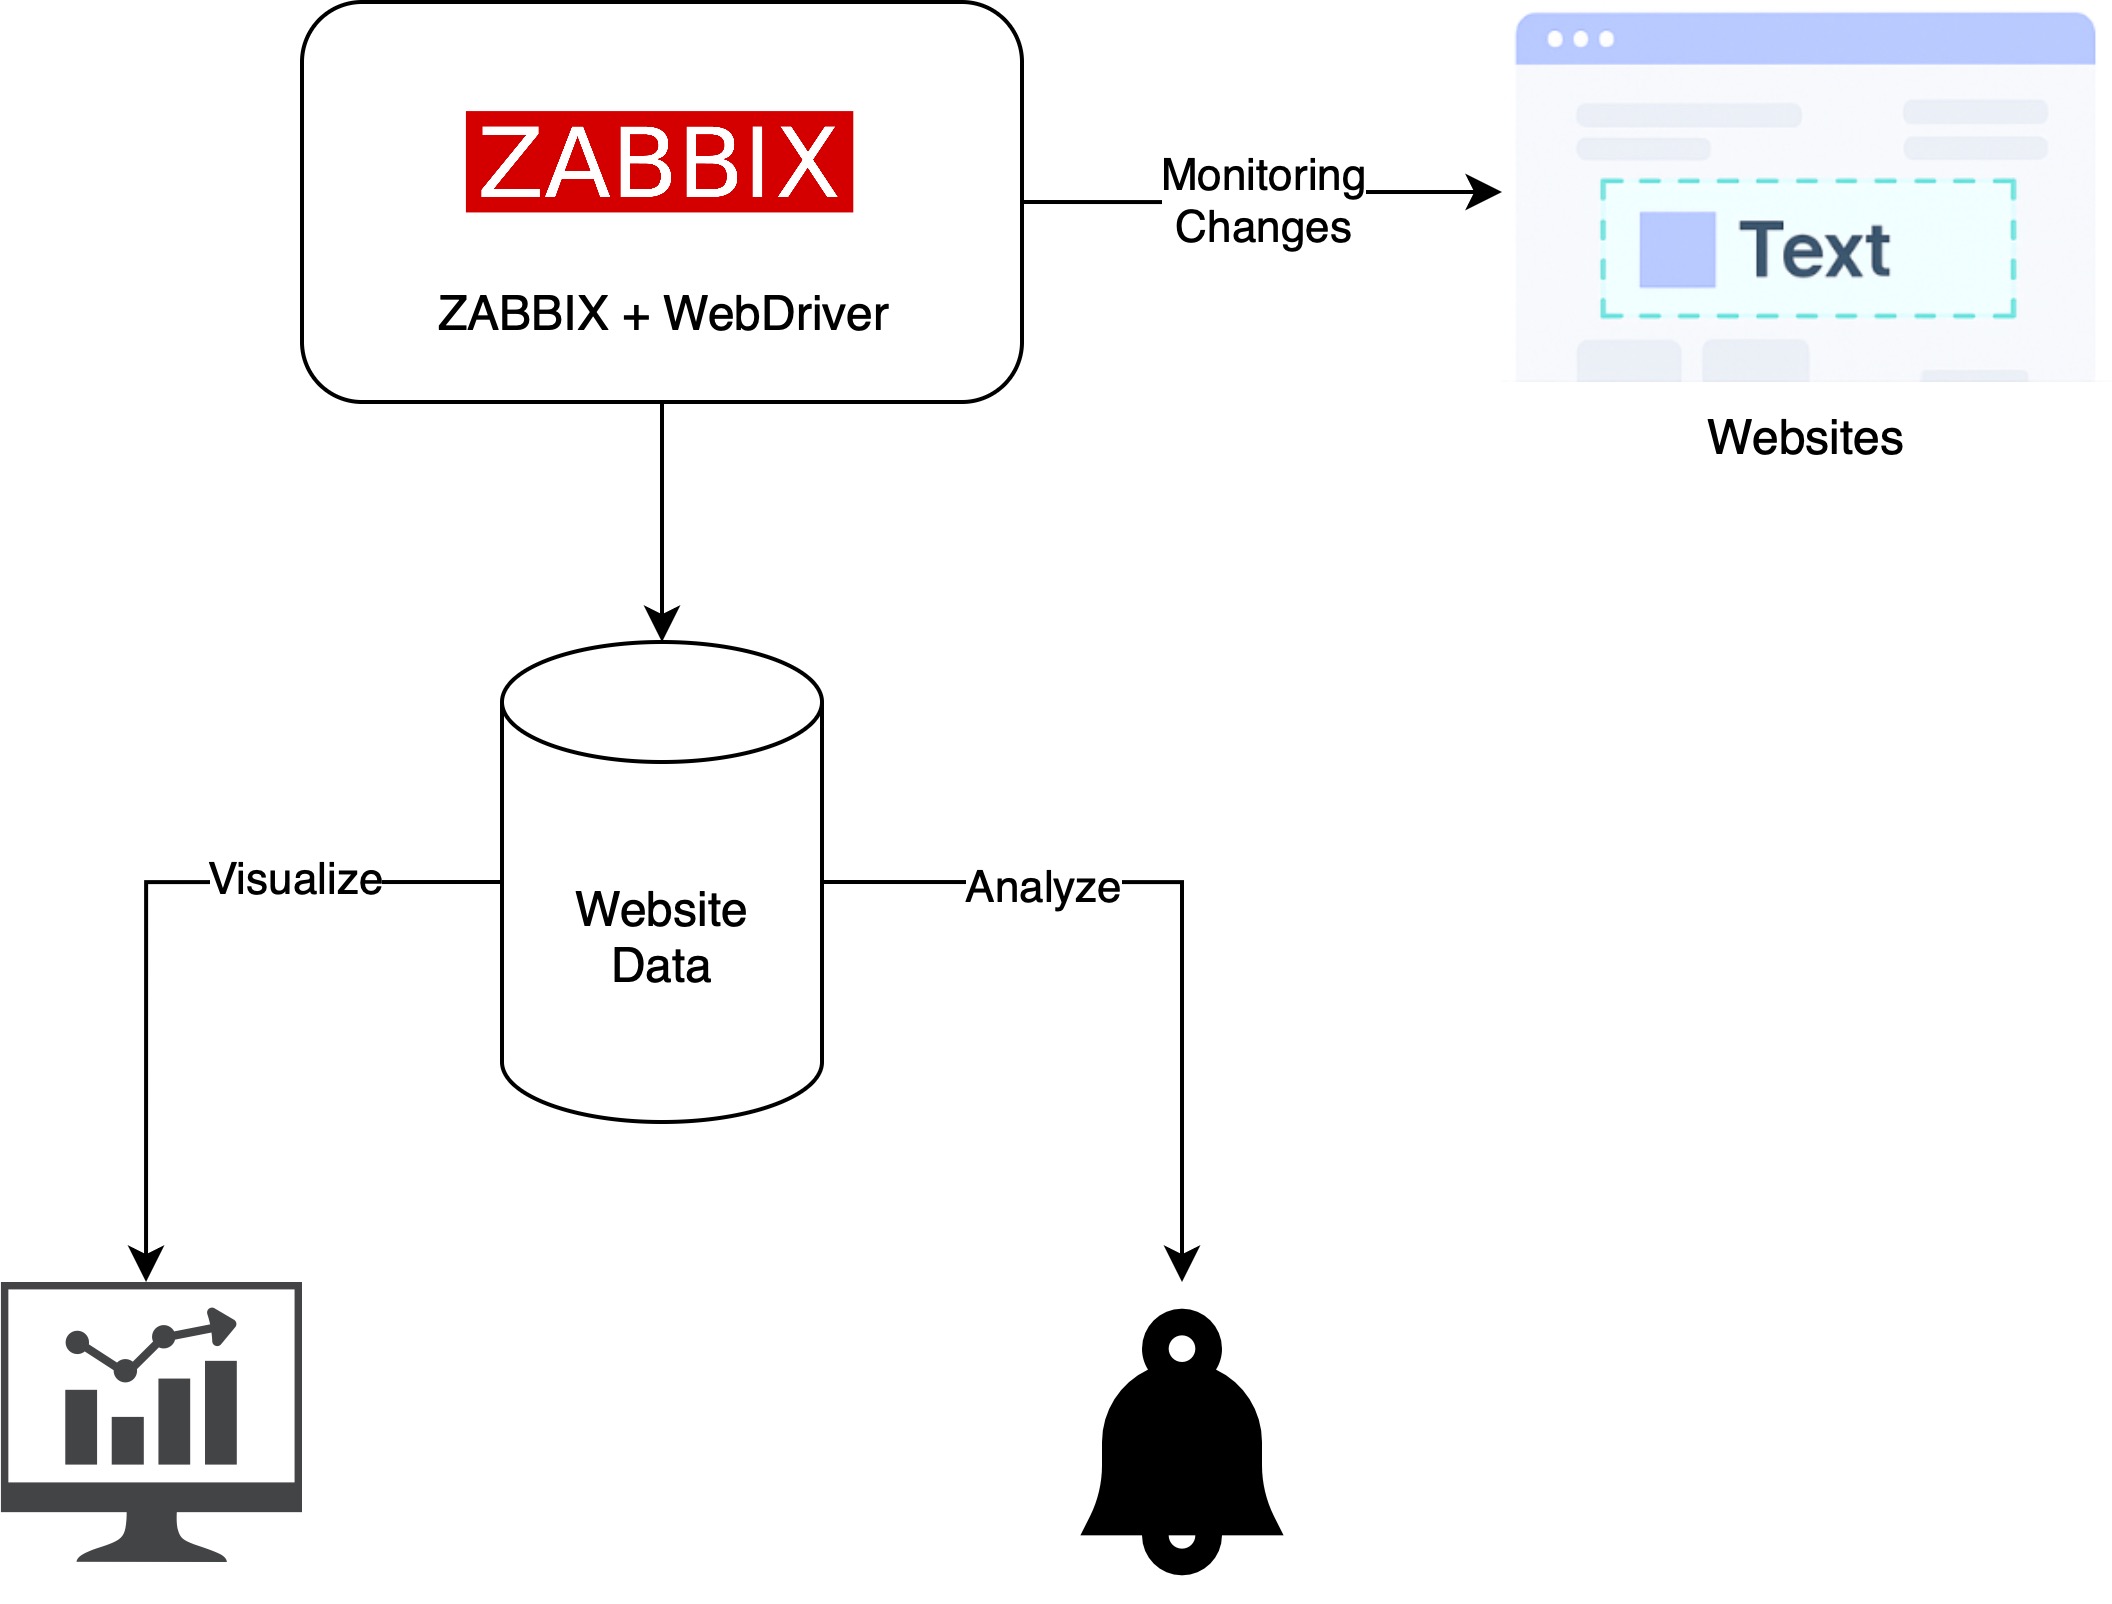
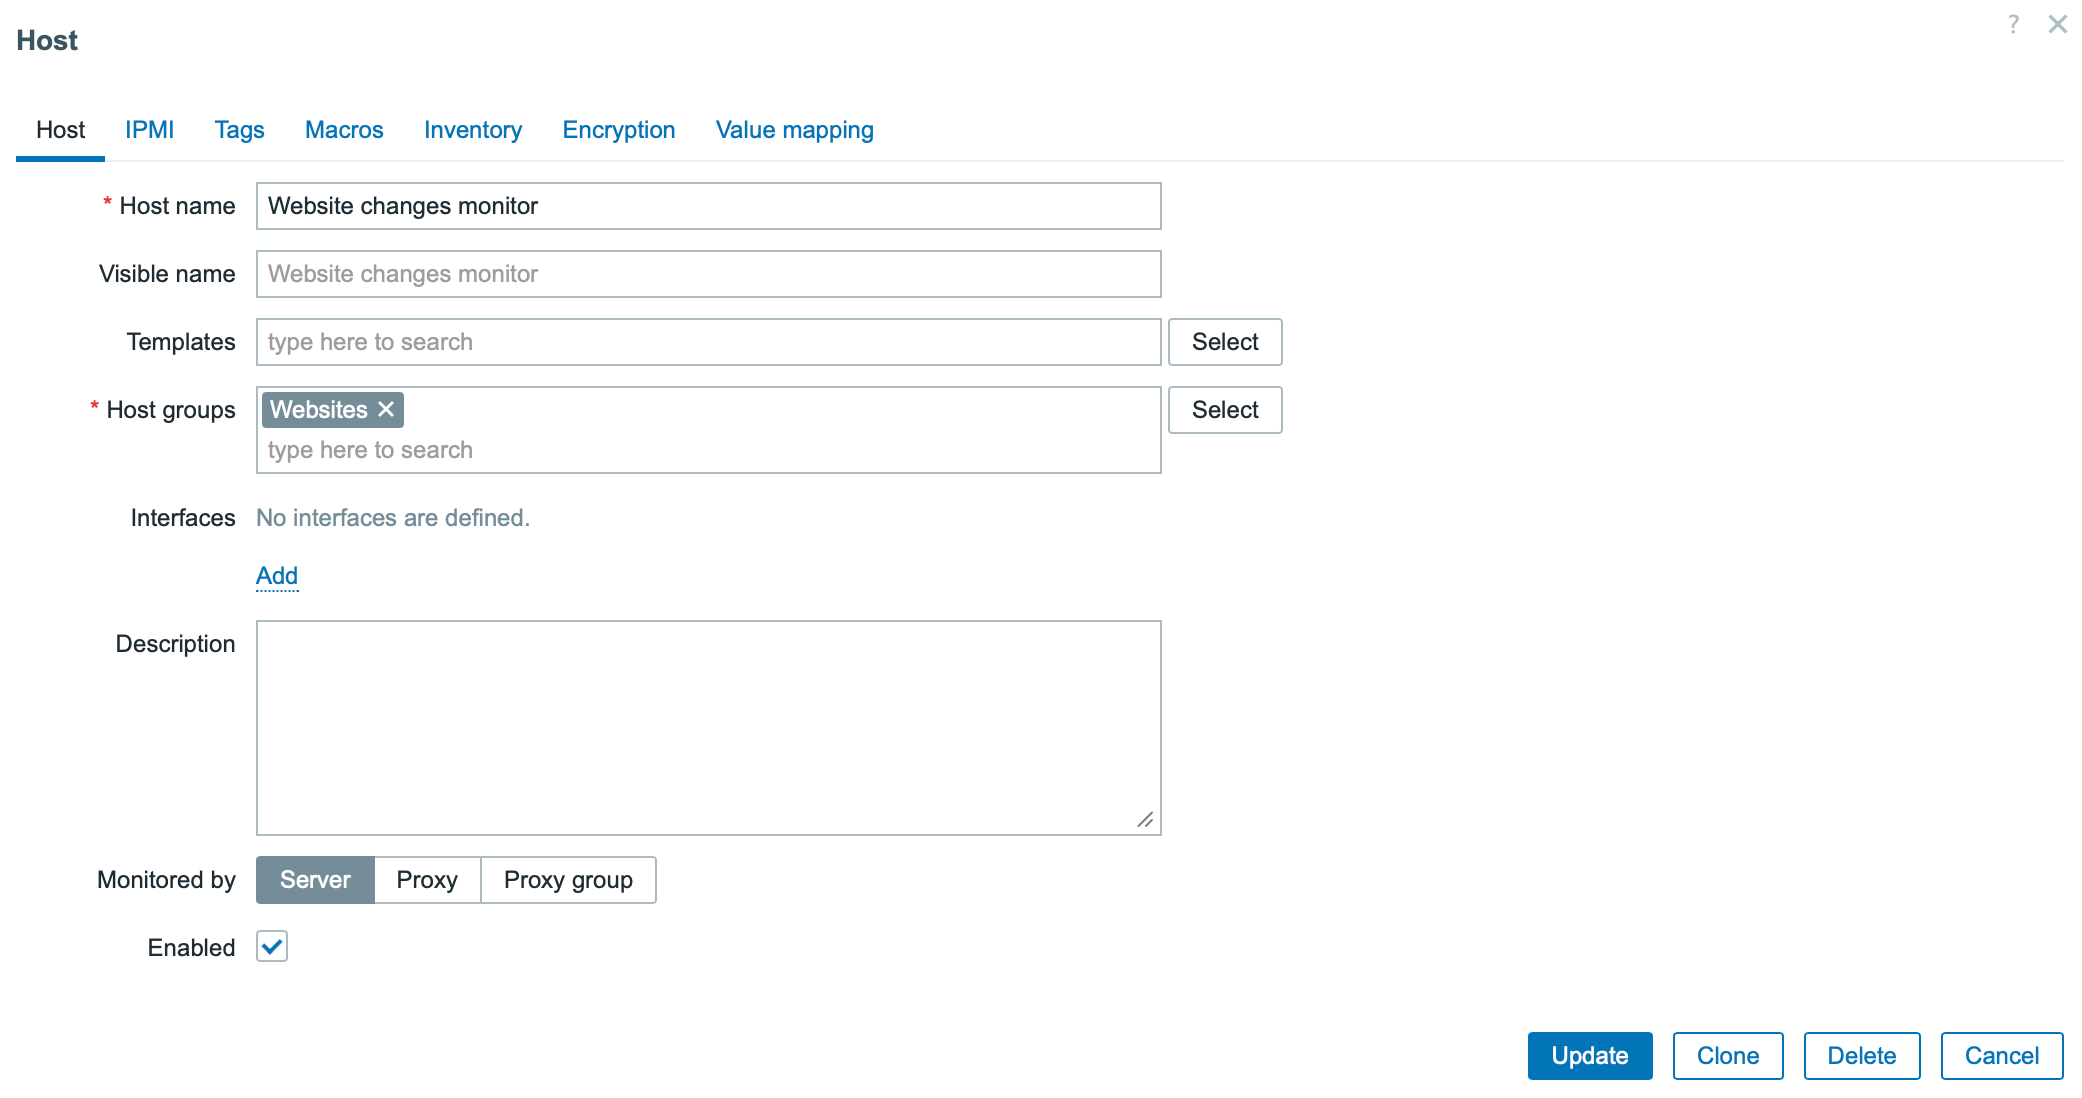
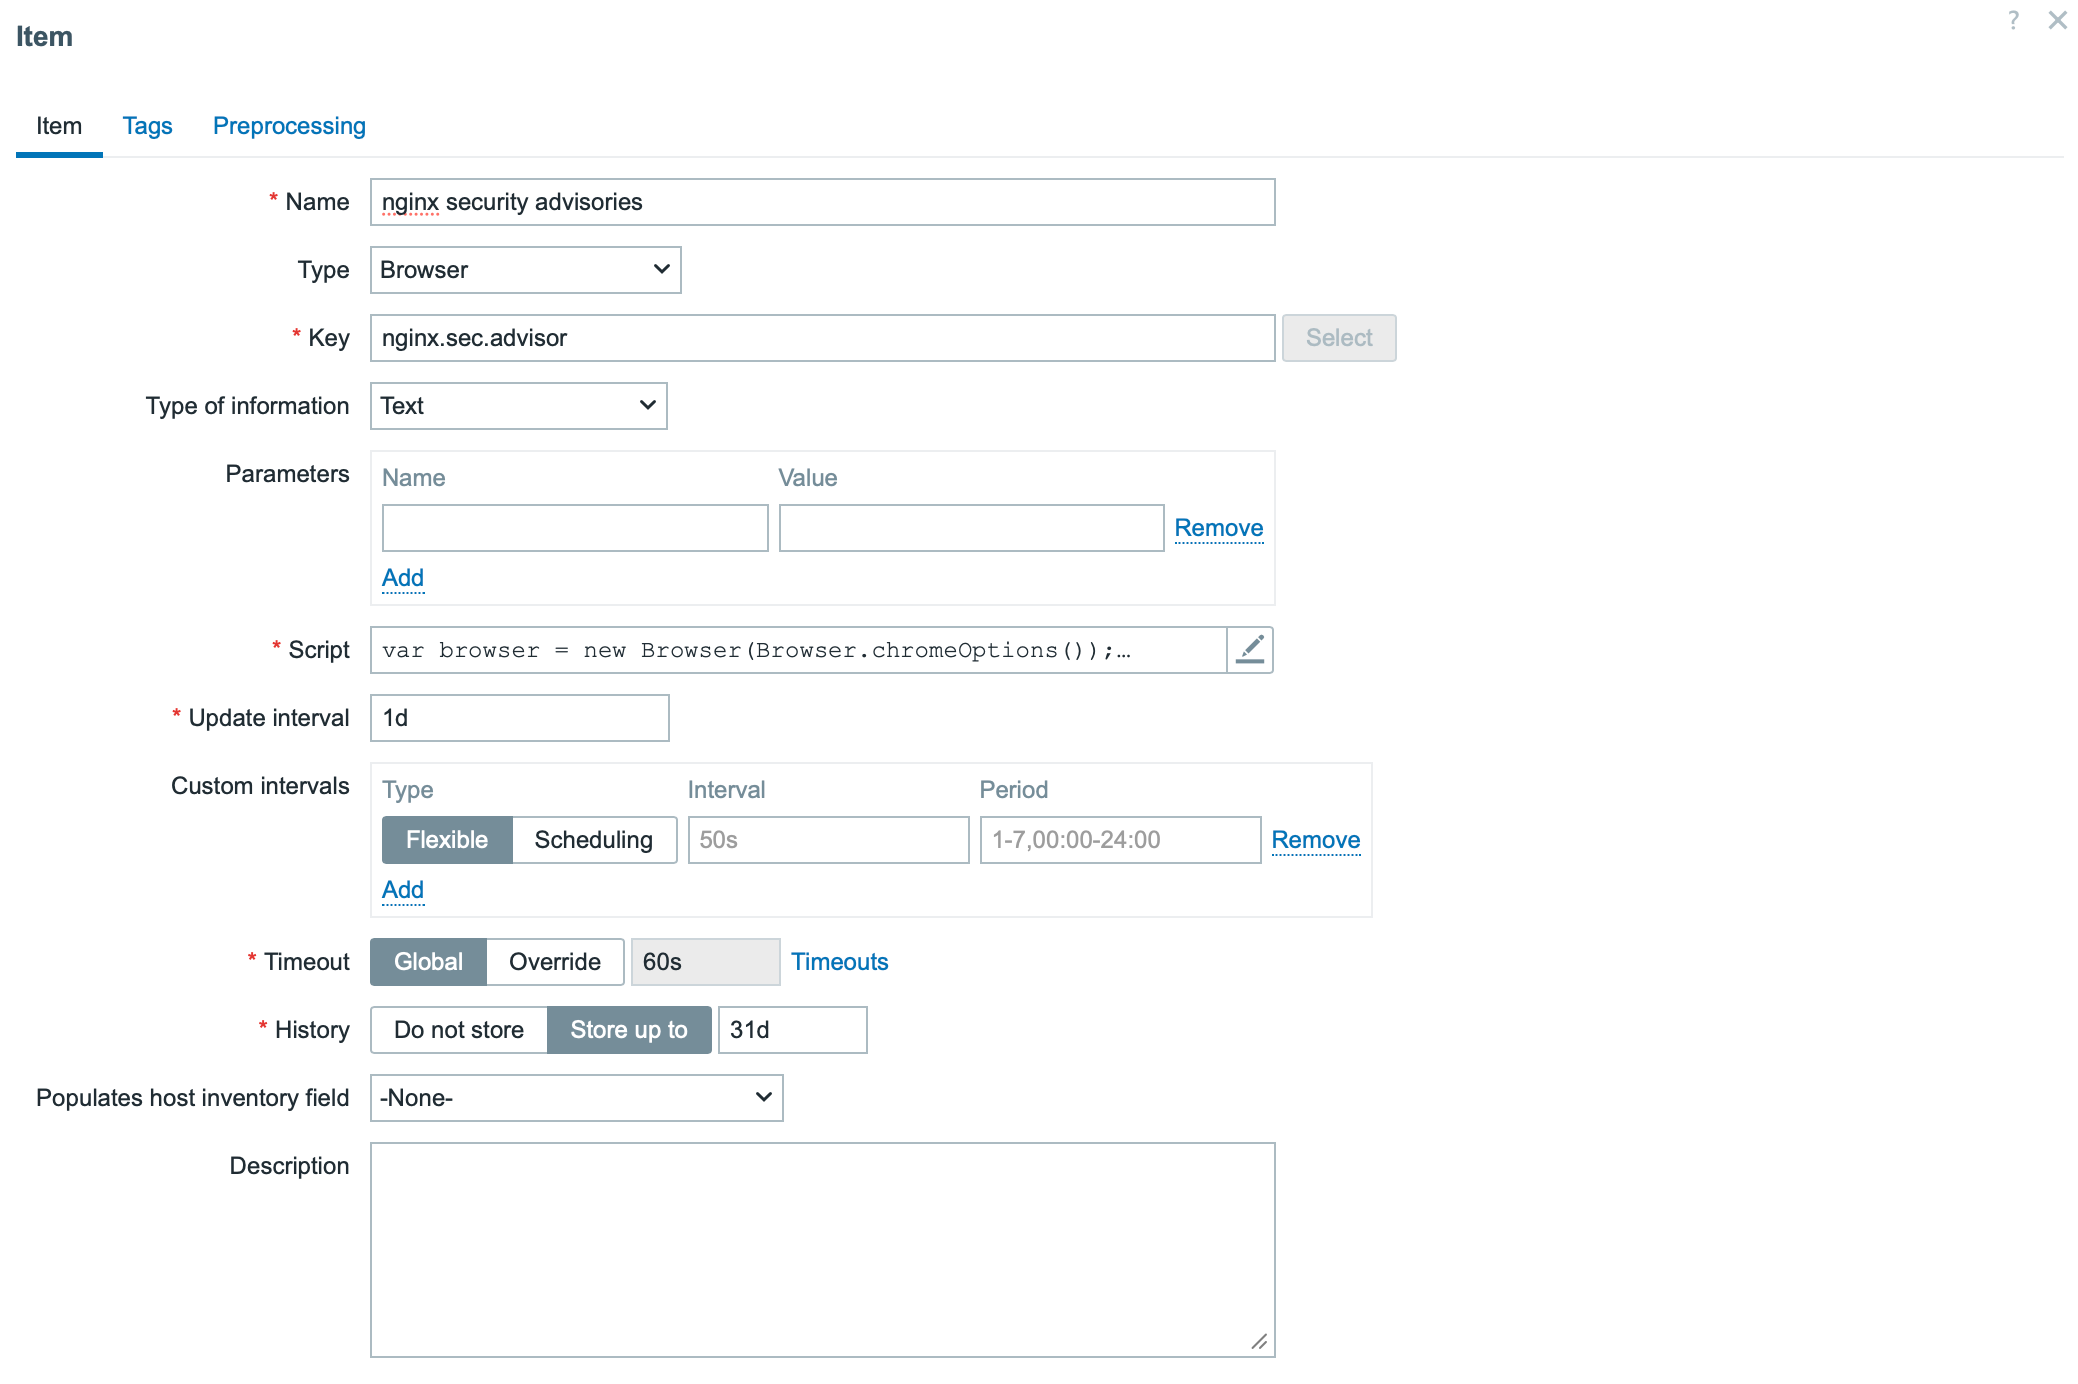


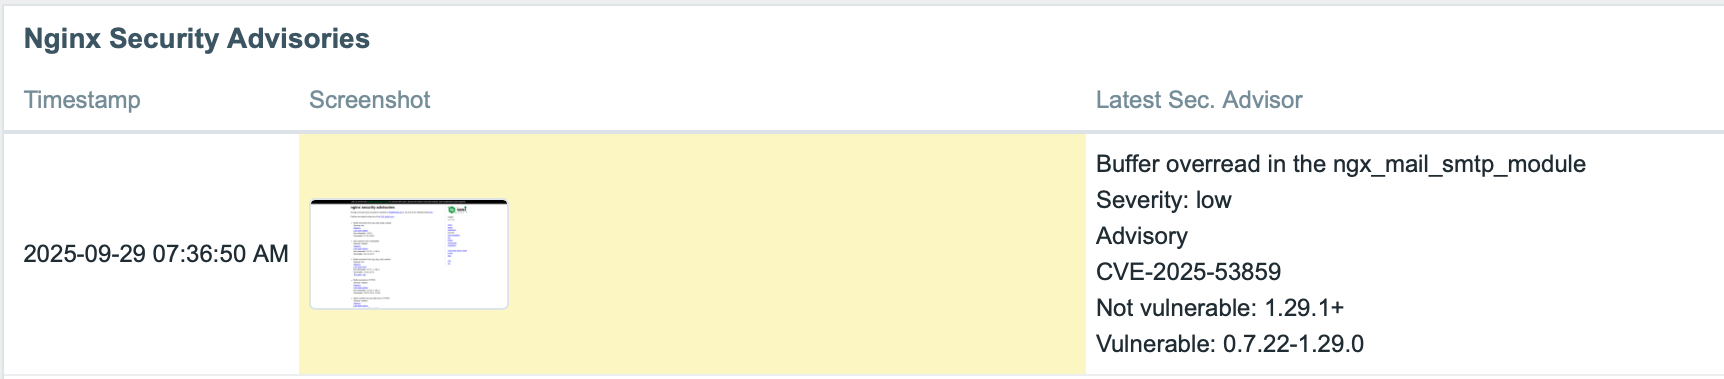

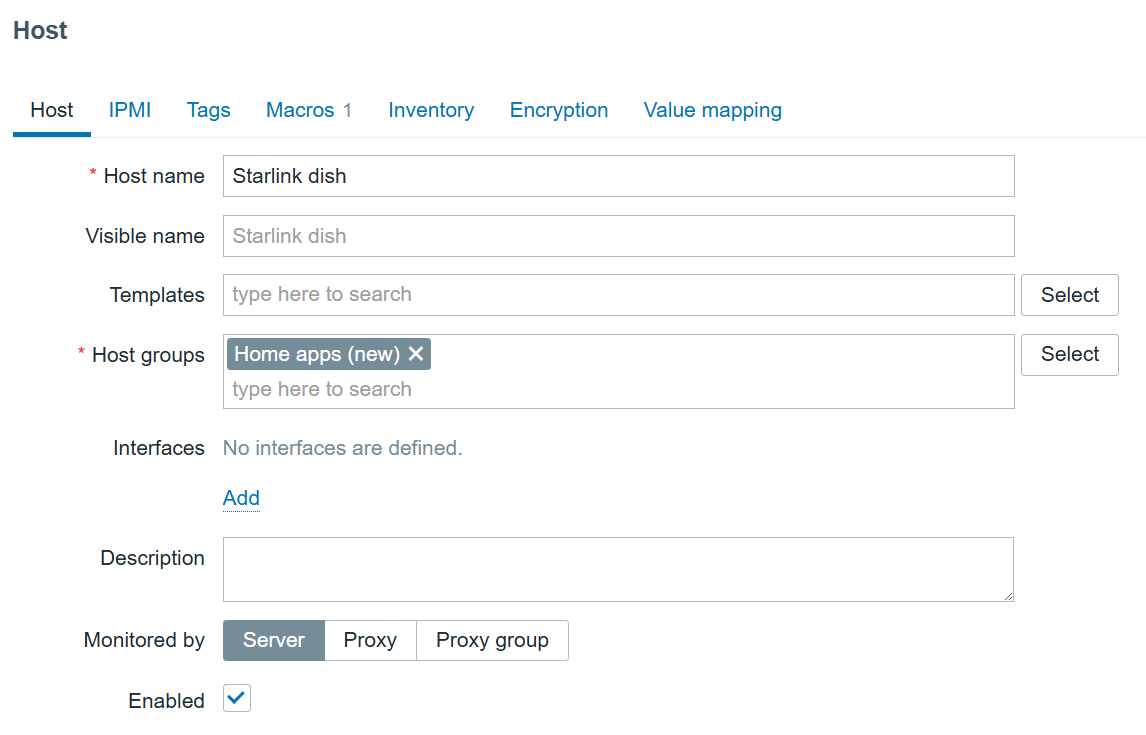
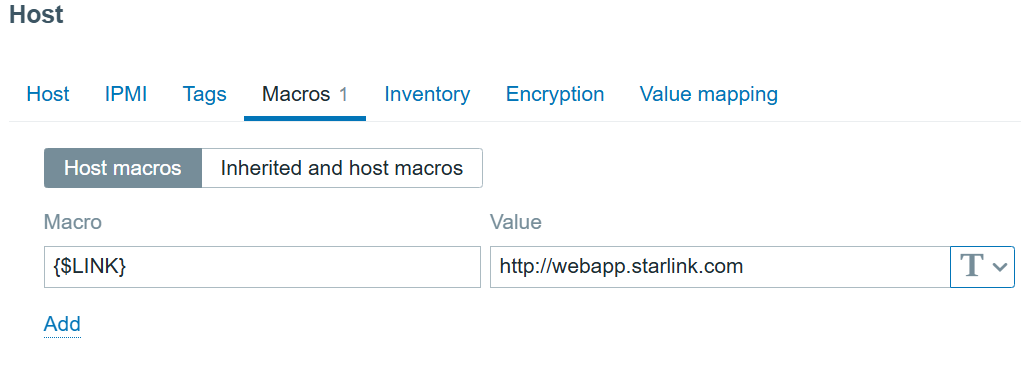
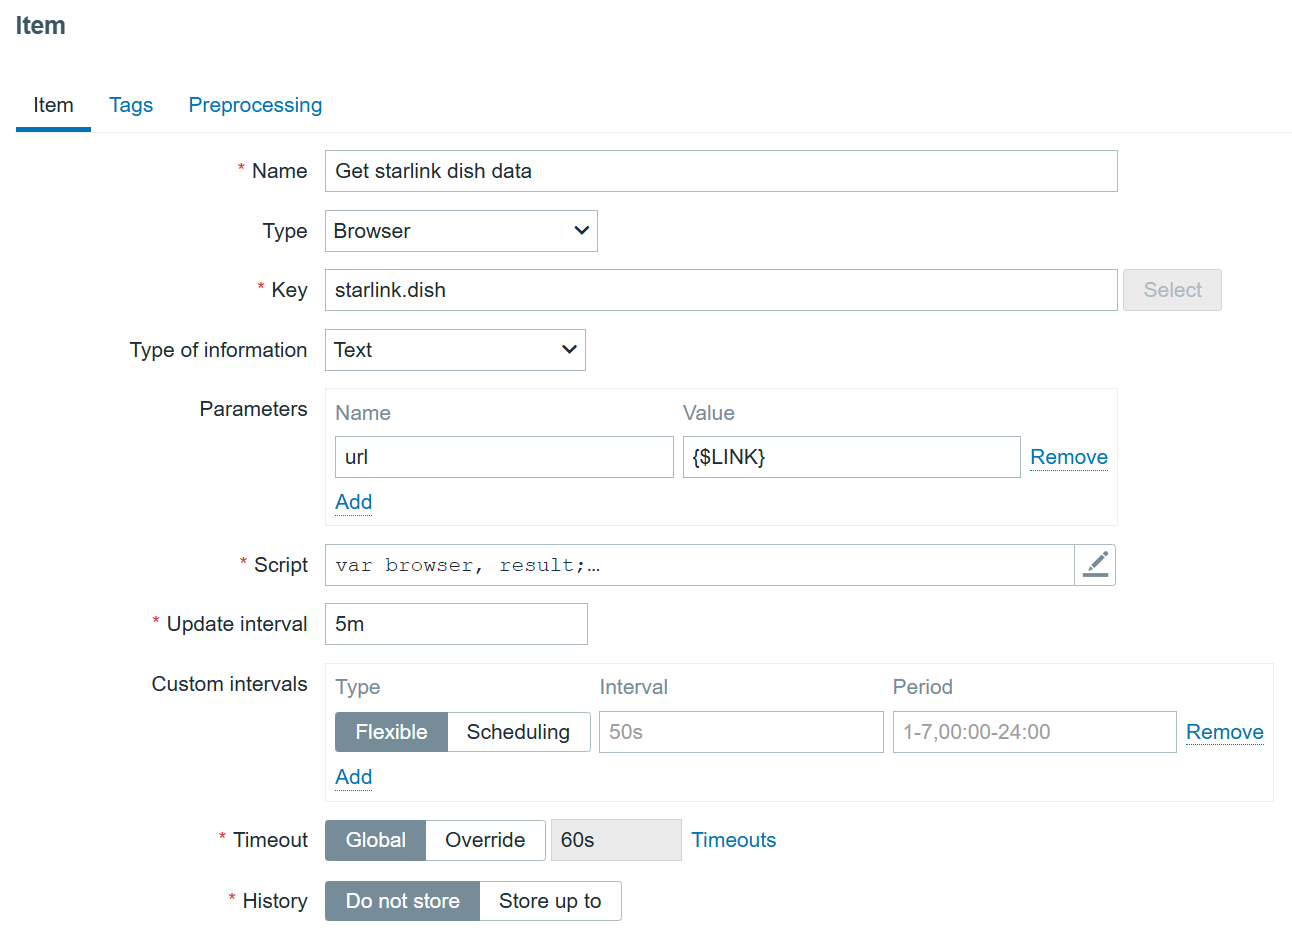
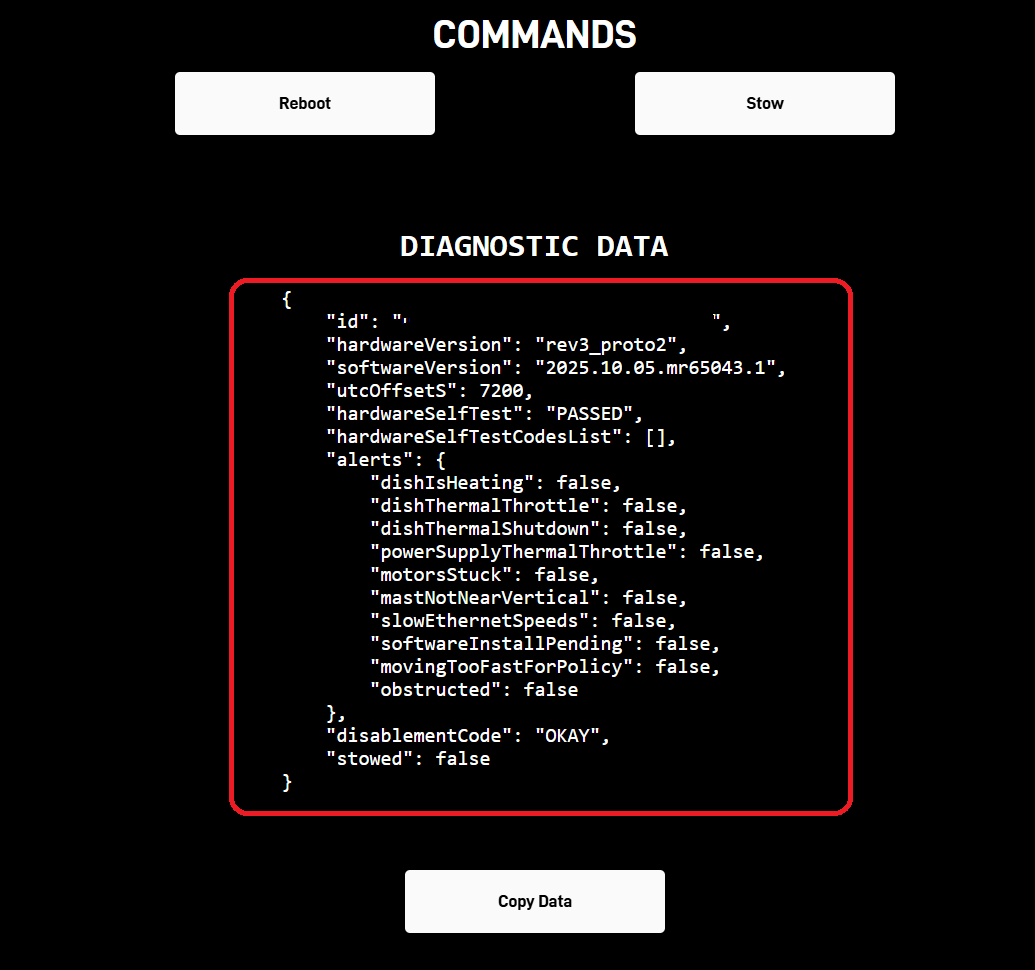
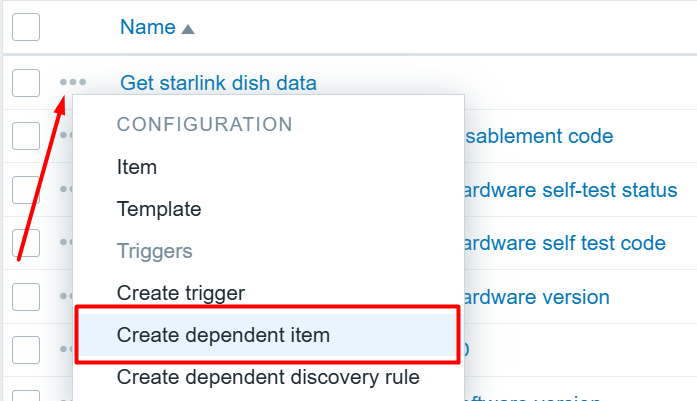
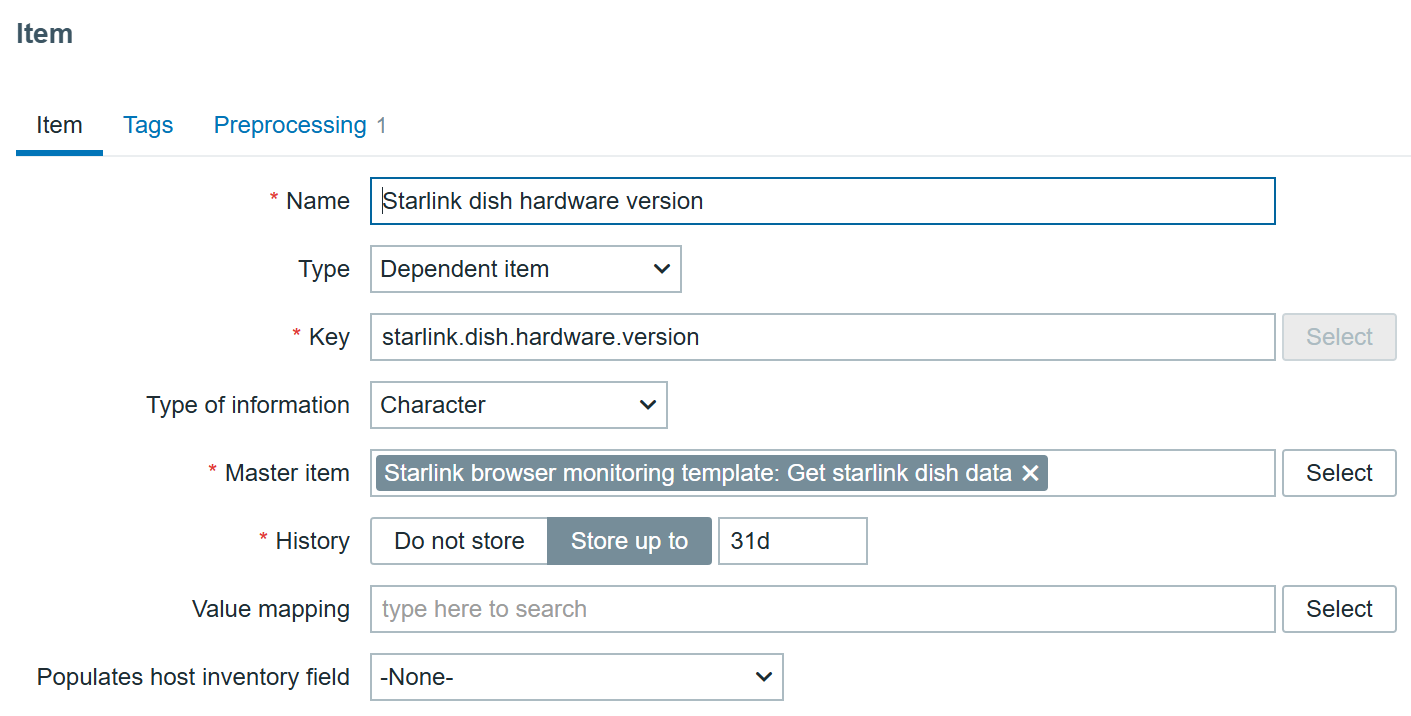
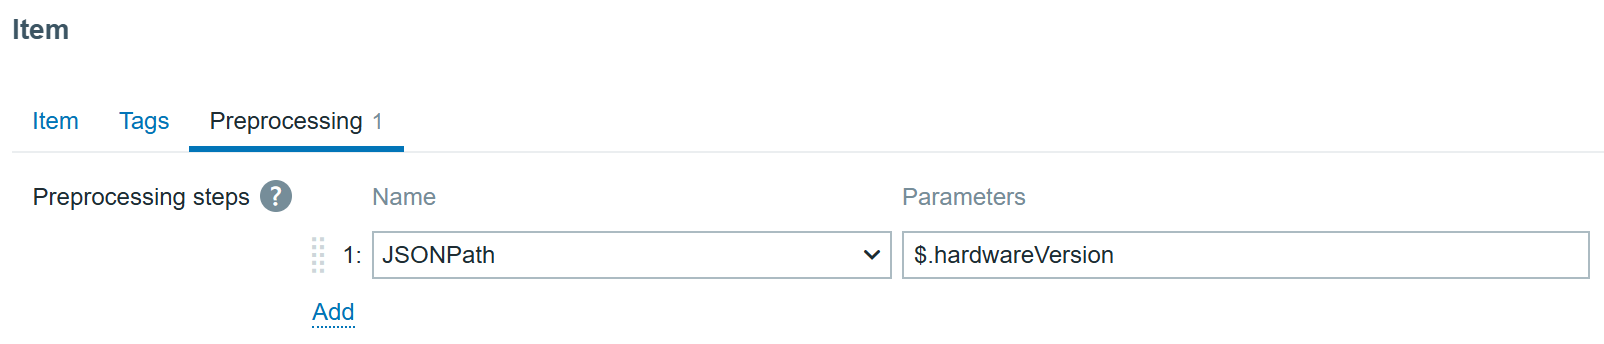

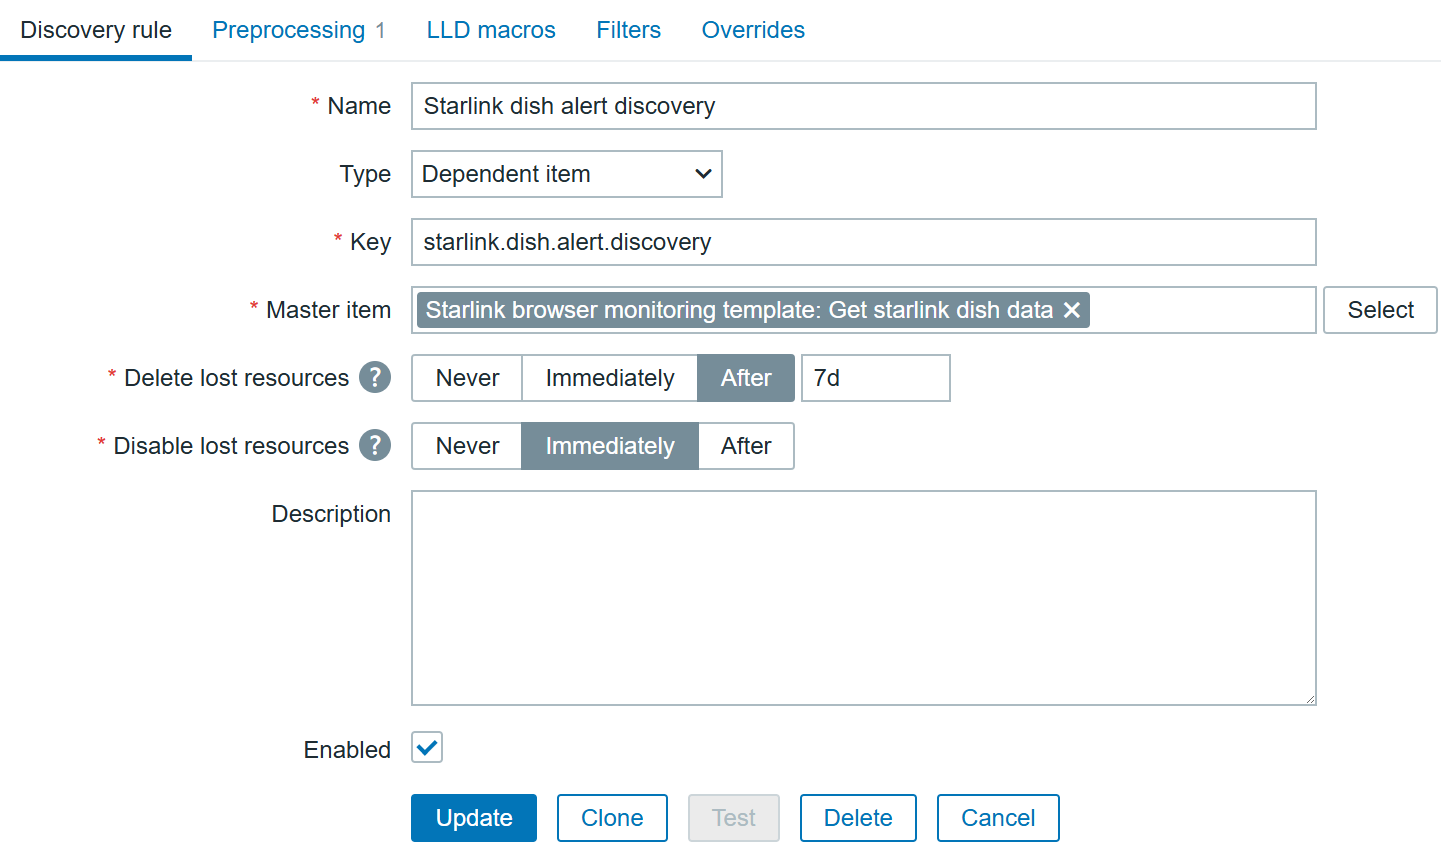
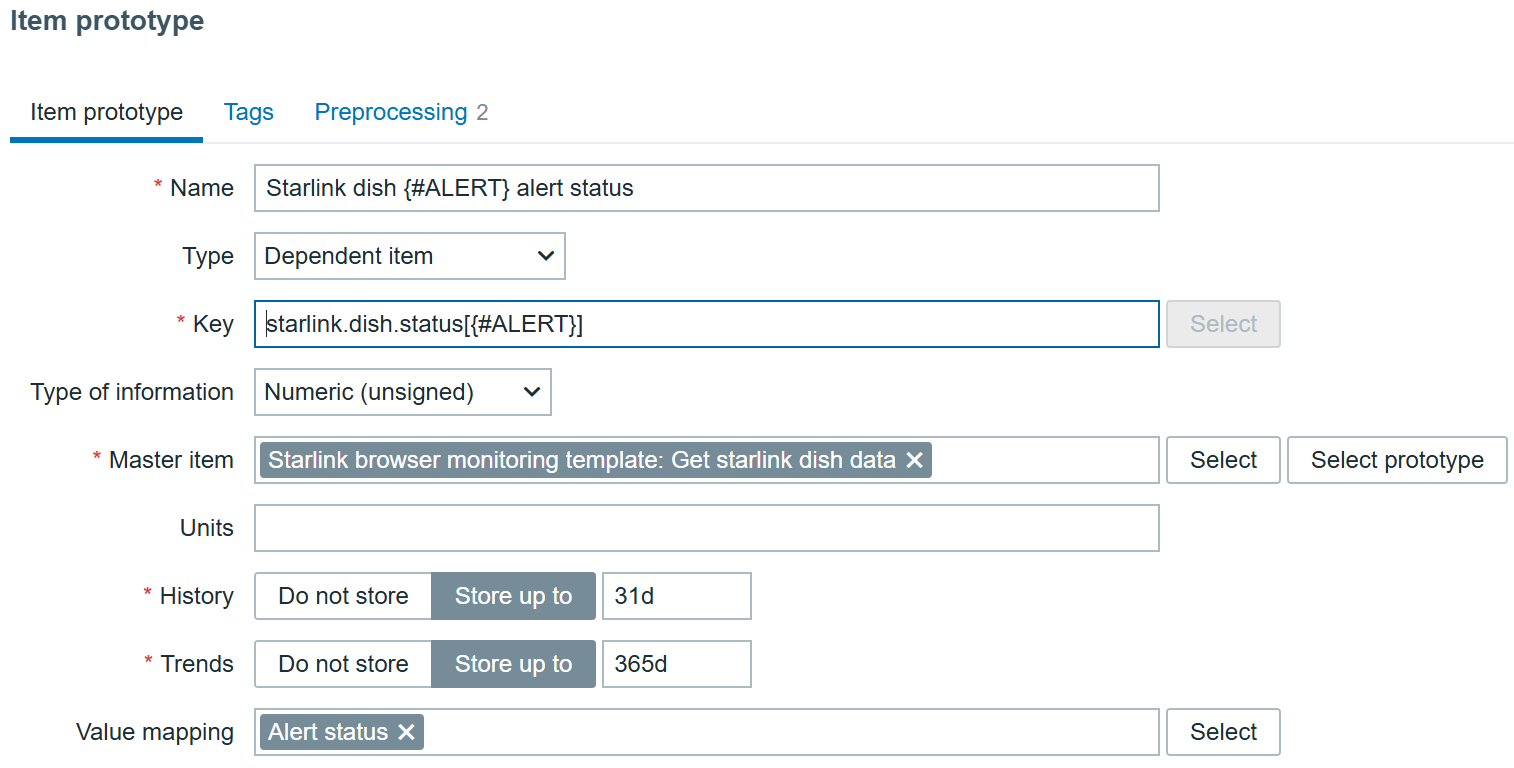
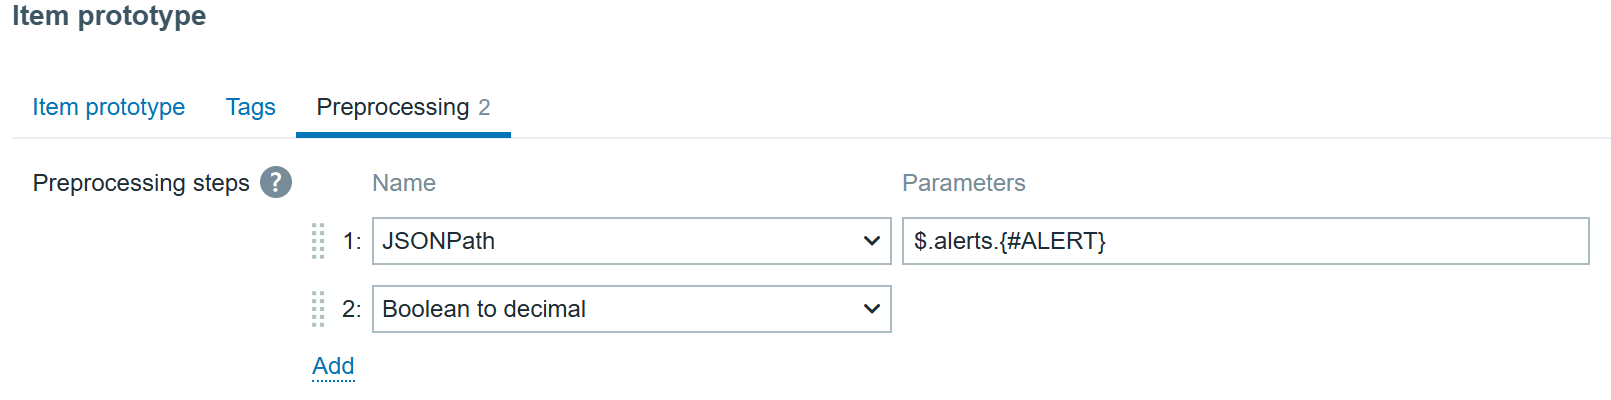
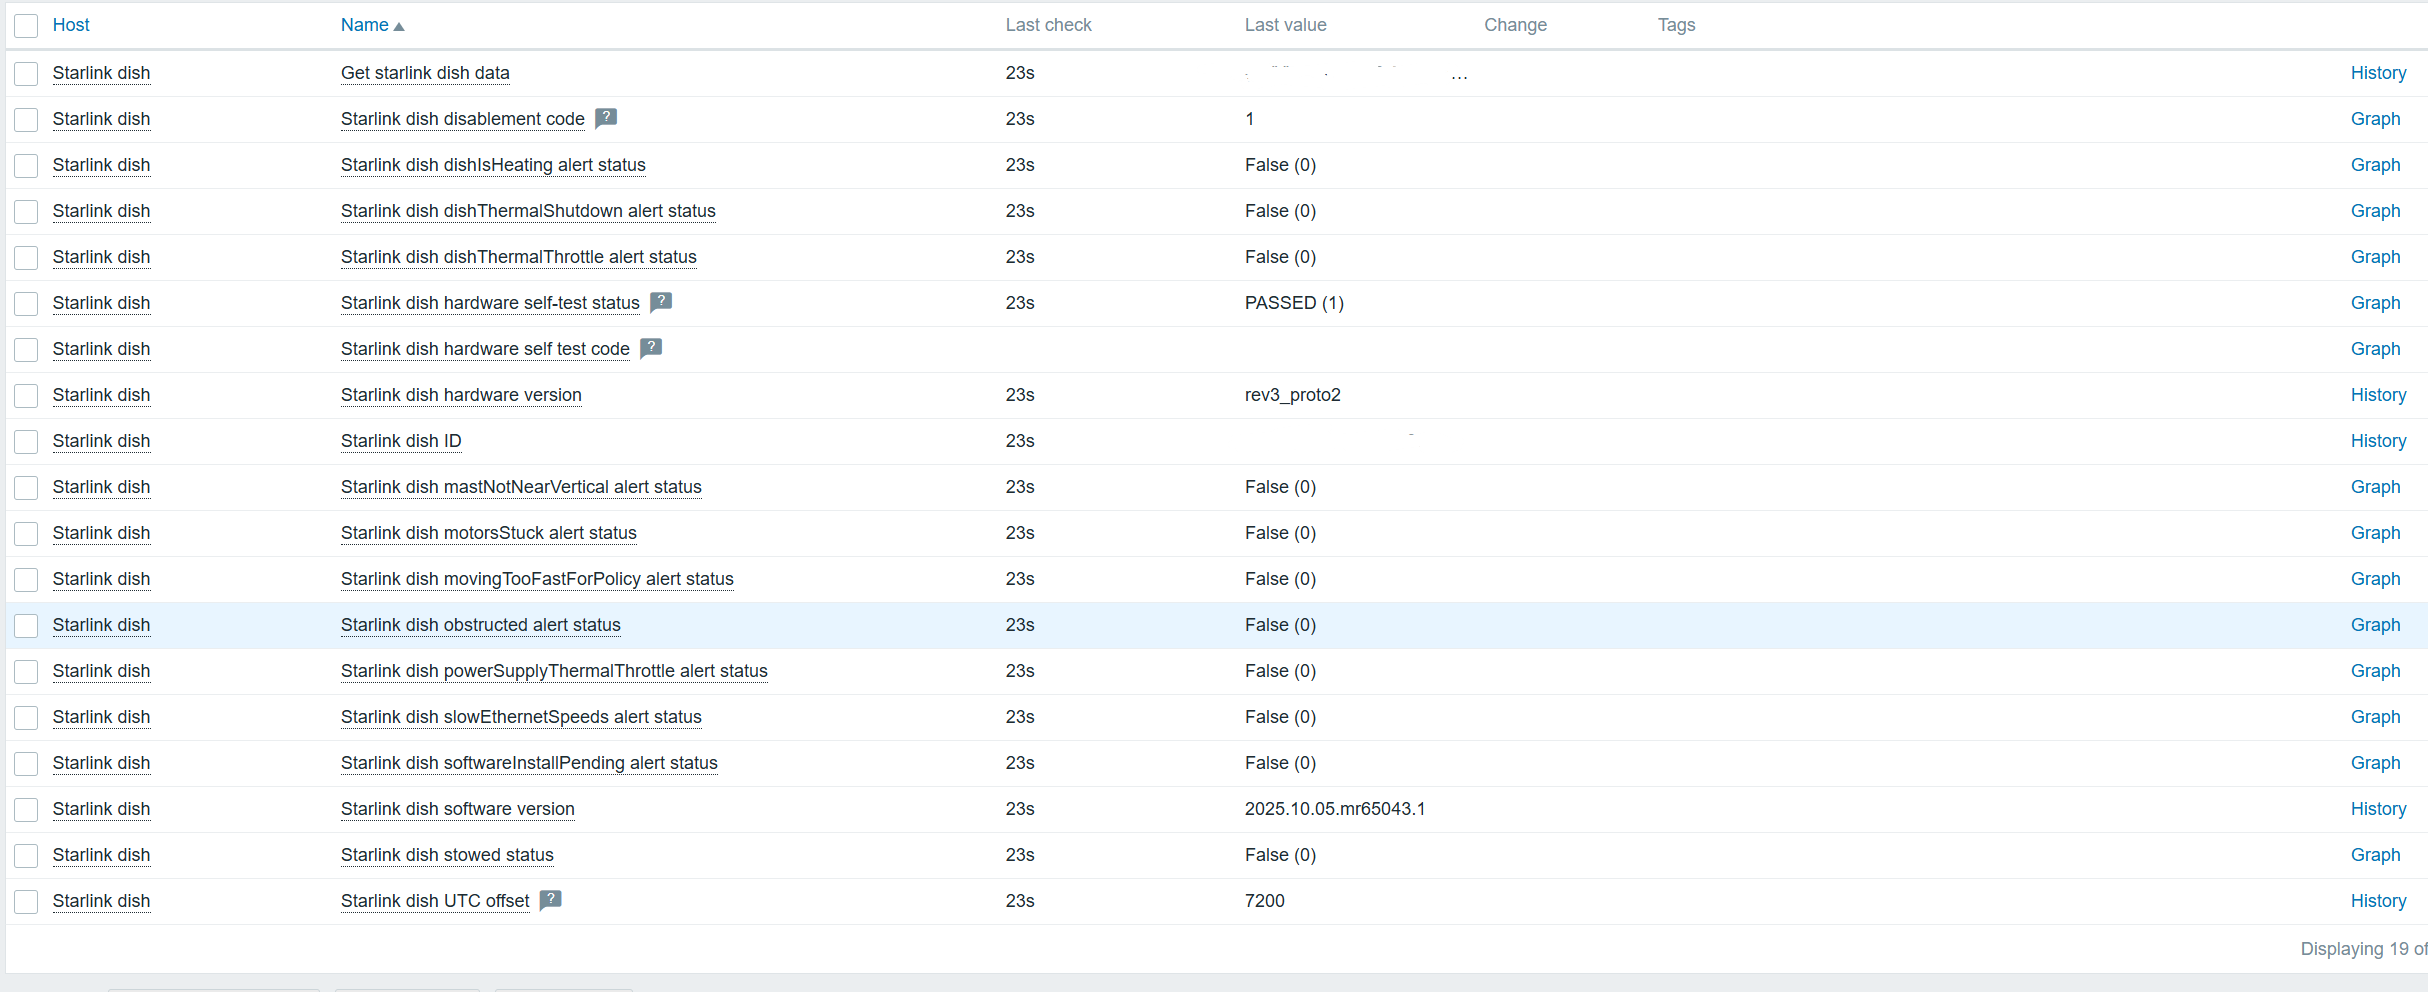
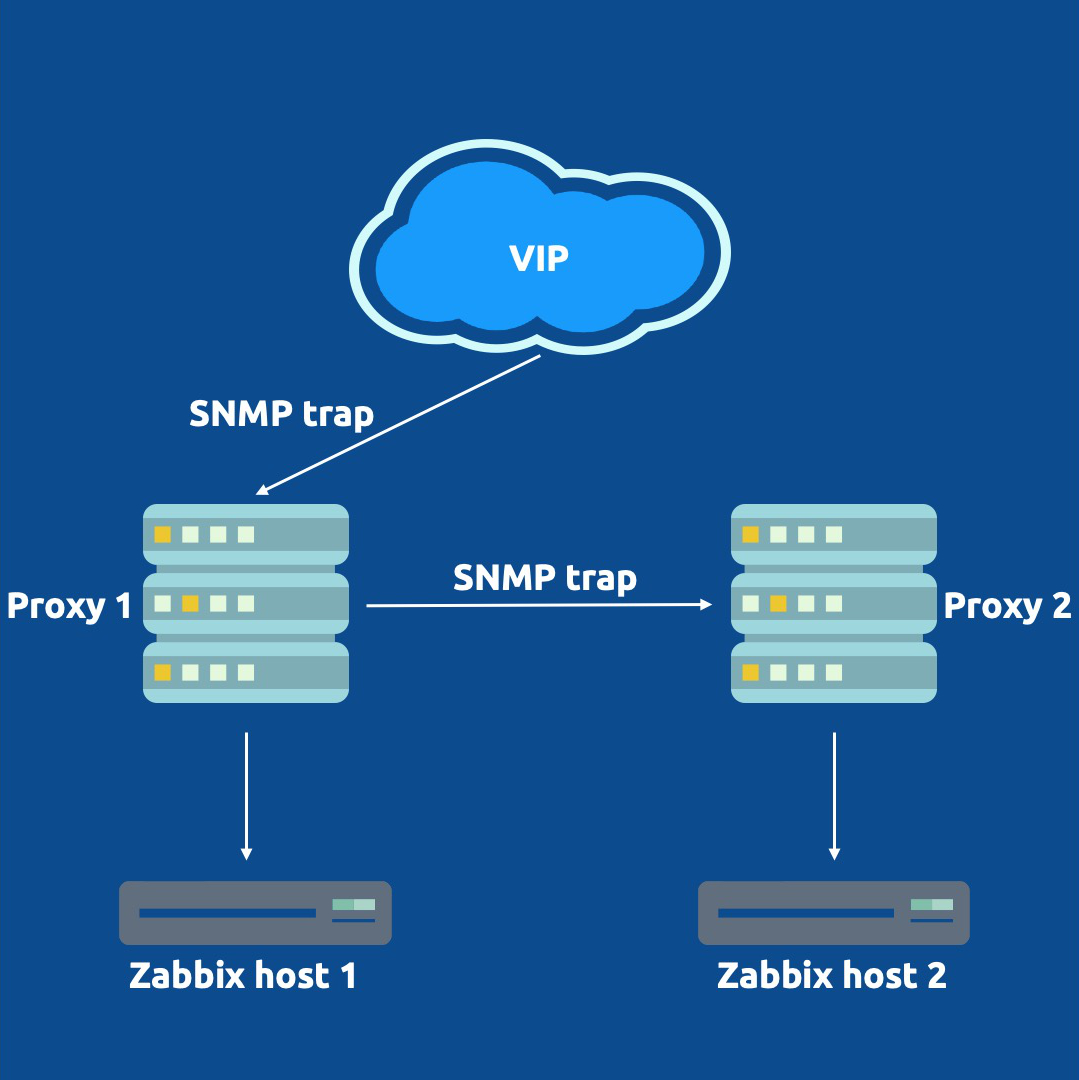
 Never expose your keys publicly!