Post Syndicated from James Beswick original https://aws.amazon.com/blogs/compute/monitoring-and-troubleshooting-serverless-data-analytics-applications/
This series is about building serverless solutions in streaming data workloads. The application example used in this series is Alleycat, which allows bike racers to compete with each other virtually on home exercise bikes.
The first four posts have explored the architecture behind the application, which is enabled by Amazon Kinesis, Amazon DynamoDB, and AWS Lambda. This post explains how to monitor and troubleshoot issues that are common in streaming applications.
To set up the example, visit the GitHub repo and follow the instructions in the README.md file. Note that this walkthrough uses services that are not covered by the AWS Free Tier and incur cost.
Monitoring the Alleycat application
The business requirements for Alleycat state that it must handle up to 1,000 simultaneous racers. With each racer emitting a message every second, each 5-minute race results in 300,000 messages.

While the architecture can support this throughput, the settings for each service determine how the workload scales up. The deployment templates in the GitHub repo do not use sufficiently high settings to handle this amount of data. In the section, I show how this results in errors and what steps you can take to resolve the issues. To start, I run the simulator for several races with the maximum racers configuration set to 1,000.
Monitoring the Kinesis stream
The monitoring tab of the Kinesis stream provides visualizations of stream metrics. This immediately shows that there is a problem in the application when running at full capacity:
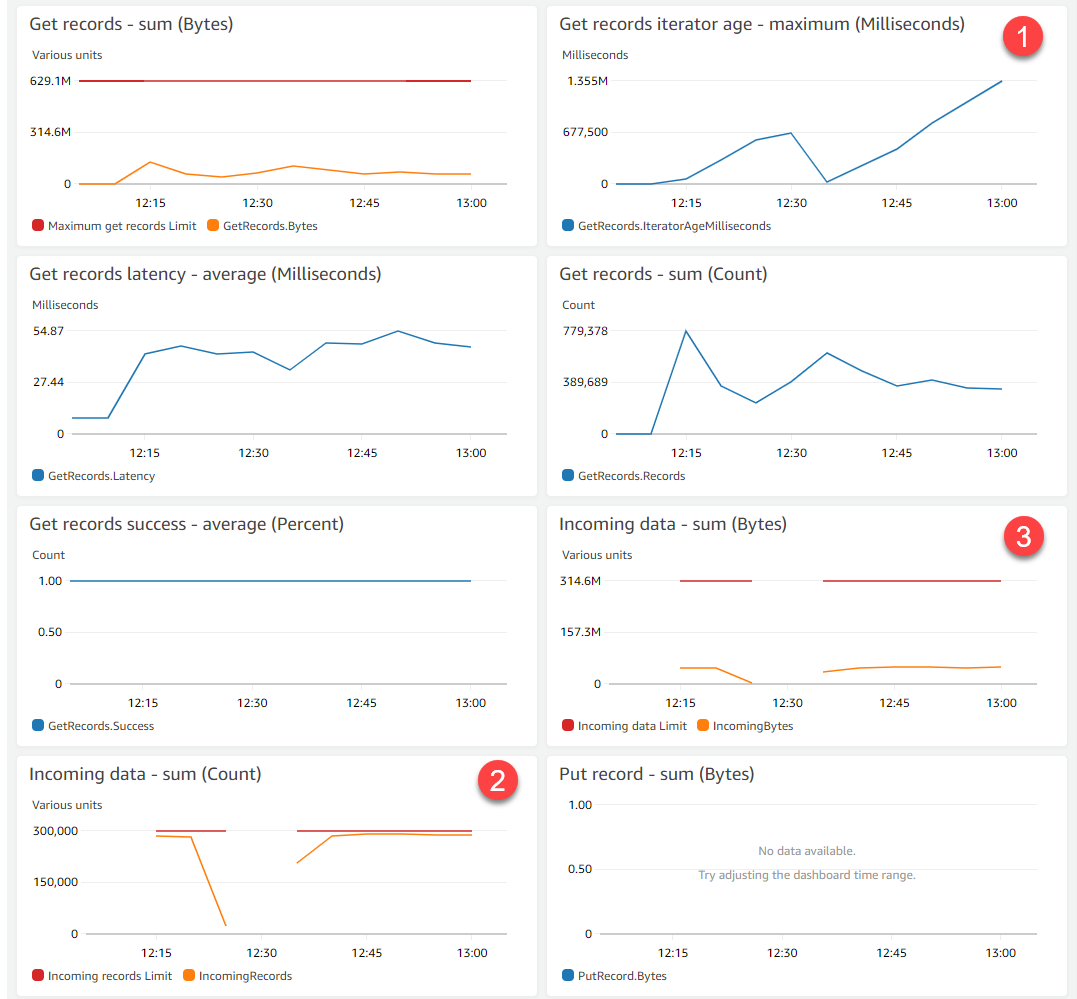
- The iterator age is growing, indicating that the data consumers are falling behind the data producers. The Get records graph also shows the number of records in the stream growing.
- The Incoming data (count) metric shows the number of separate records ingested by the stream. The red line indicates the maximum capacity of this single-shard stream. With 1,000 active racers, this is almost at full capacity.
- However, the Incoming data – sum (bytes) graph shows that the total amount of data ingested by the stream is currently well under the maximum level shown by the red line.
There are two solutions for improving the capacity on the stream. First, the data producer application (the Alleycat frontend) could combine messages before sending. It’s currently reaching the total number of messages per second but the total byte capacity is significantly below the maximum. This action improves message packing but increases latency since the frontend waits to group messages.
Alternatively, you can add capacity by resharding. This enables you to increase (or decrease) the number of shards in a stream to adapt to the rate of data flowing through the application. You can do this with the UpdateShardCount API action. The existing stream goes into an Updating status and the stream scales by splitting shards. This creates two new child shards that split the partition keyspace of the parent. It also results in another, separate Lambda consumer for the new shard.
Monitoring the Lambda function
The monitoring tab of the consuming Lambda function provides visualization of metrics that can highlight problems in the workload. At full capacity, the monitoring highlights issues to resolve:

- The Duration chart shows that the function is exceeding its 15-second timeout, when the function normally finishes in under a second. This typically indicates that there are too many records to process in a single batch or throttling is occurring downstream.
- The Error count metric is growing, which highlights either logical errors in the code or errors from API calls to downstream resources.
- The IteratorAge metric appears for Lambda functions that are consuming from streams. In this case, the growing metric confirms that data consumption is falling behind data production in the stream.
- Concurrent executions remain at 1 throughout. This is set by the parallelization factor in the event source mapping and can be increased up to 10.
Monitoring the DynamoDB table
The metric tab on the application’s table in the DynamoDB console provides visualizations for the performance of the service:

- The consumed Read usage is well within the provisioned maximum and there is no read throttling on the table.
- Consumed Write usage, shown in blue, is frequently bursting through the provisioned capacity.
- The number of Write throttled requests confirms that the DynamoDB service is throttling requests since the table is over capacity.
You can resolve this issue by increasing the provisioned throughput on the table and related global secondary indexes. Write capacity units (WCUs) provide 1 KB of write throughput per second. You can set this value manually, use automatic scaling to match varying throughout, or enable on-demand mode. Read more about the pricing models for each to determine the best approach for your workload.
Monitoring Kinesis Data Streams
Kinesis Data Streams ingests data into shards, which are fixed capacity sequences of records, up to 1,000 records or 1 MB per second. There is no limit to the amount of data held within a stream but there is a configurable retention period. By default, Kinesis stores records for 24 hours but you can increase this up to 365 days as needed.
Kinesis is integrated with Amazon CloudWatch. Basic metrics are published every minute, and you can optionally enable enhanced metrics for an additional charge. In this section, I review the most commonly used metrics for monitoring the health of streams in your application.
Metrics for monitoring data producers
When data producers are throttled, they cannot put new records onto a Kinesis stream. Use the WriteProvisionedThroughputExceeded metric to detect if producers are throttled. If this is more than zero, you won’t be able to put records to the stream. Monitoring the Average for this statistic can help you determine if your producers are healthy.
When producers succeed in sending data to a stream, the PutRecord.Success and PutRecords.Success are incremented. Monitoring for spikes or drops in these metrics can help you monitor the health of producers and catch problems early. There are two separate metrics for each of the API calls, so watch the Average statistic for whichever of the two calls your application uses.
Metrics for monitoring data consumers
When data consumers are throttled or start to generate errors, Kinesis continues to accept new records from producers. However, there is growing latency between when records are written and when they are consumed for processing.
Using the GetRecords.IteratorAgeMilliseconds metric, you can measure the difference between the age of the last record consumed and the latest record put to the stream. It is important to monitor the iterator age. If the age is high in relation to the stream’s retention period, you can lose data as records expire from the stream. This value should generally not exceed 50% of the stream’s retention period – when the value reaches 100% of the stream retention period, data is lost.
If the iterator age is growing, one temporary solution is to increase the retention time of the stream. This gives you more time to resolve the issue before losing data. A more permanent solution is to add more consumers to keep up with data production, or resolve any errors that are slowing consumers.
When consumers exceed the ReadProvisionedThroughputExceeded metric, they are throttled and you cannot read from the stream. This results in a growth of records in the stream waiting for processing. Monitor the Average statistic for this metric and aim for values as close to 0 as possible.
The GetRecords.Success metric is the consumer-side equivalent of PutRecords.Success. Monitor this value for spikes or drops to ensure that your consumers are healthy. The Average is usually the most useful statistic for this purpose.
Increasing data processing throughput for Kinesis Data Streams
Adjusting the parallelization factor
Kinesis invokes Lambda consumers every second with a configurable batch size of messages. It’s important that the processing in the function keeps pace with the rate of traffic to avoid a growing iterator age. For compute intensive functions, you can increase the memory allocated in the function, which also increases the amount of virtual CPU available. This can help reduce the duration of a processing function.
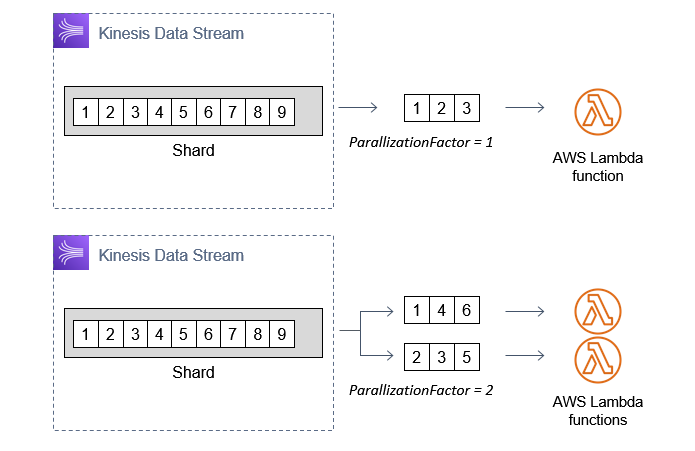
If this is not possible or the function is falling behind data production in the stream, consider increasing the parallelization factor. By default, this is set to 1, meaning that each shard has a single instance of a Lambda function it invokes. You can increase this up to 10, which results in multiple instances of the consumer function processing additional batches of messages.
Using enhanced fan-out to reduce iterator age
Standard consumers use a pull model over HTTP to fetch batches of records. Each consumer operates in serial. A stream with five consumers averages 200 ms of latency each, meaning it takes up to 1 second for all five to receive batches of records.
You can improve the overall latency by removing any unnecessary data consumers. If you use Kinesis Data Firehose and Kinesis Data Analytics on a stream, these count as consumers too. If you can remove subscribers, this helps with over data consumption throughput.
If the workload needs all of the existing subscribers, use enhanced fan-out (EFO). EFO consumers use a push model over HTTP/2 and are independent of each other. With EFO, the same five consumers in the previous example would receive batches of messages in parallel, using dedicated throughput. Overall latency averages 70 ms and typically data delivery speed is improved by up to 65%. There is an additional charge for this feature.

To learn more about processing streaming data with Lambda, see this AWS Online Tech Talk presentation.
Conclusion
In this post, I show how the existing settings in the Alleycat application are not sufficient for handling the expected amount of traffic. I walk through the metrics visualizations for Kinesis Data Streams, Lambda, and DynamoDB to find which quotas should be increased.
I explain which CloudWatch metrics can be used with Kinesis Data Stream to ensure that data producers and data consumers are healthy. Finally, I show how you can use the parallelization factor and enhanced fan-out features to increase the throughput of data consumers.
For more serverless learning resources, visit Serverless Land.