Post Syndicated from Andrew DeMaria original https://blog.cloudflare.com/automatic-remediation-of-kubernetes-nodes/

We use Kubernetes to run many of the diverse services that help us control Cloudflare’s edge. We have five geographically diverse clusters, with hundreds of nodes in our largest cluster. These clusters are self-managed on bare-metal machines which gives us a good amount of power and flexibility in the software and integrations with Kubernetes. However, it also means we don’t have a cloud provider to rely on for virtualizing or managing the nodes. This distinction becomes even more prominent when considering all the different reasons that nodes degrade. With self-managed bare-metal machines, the list of reasons that cause a node to become unhealthy include:
- Hardware failures
- Kernel-level software failures
- Kubernetes cluster-level software failures
- Degraded network communication
- Software updates are required
- Resource exhaustion1
Unhappy Nodes
We have plenty of examples of failures in the aforementioned categories, but one example has been particularly tedious to deal with. It starts with the following log line from the kernel:
unregister_netdevice: waiting for lo to become free. Usage count = 1
The issue is further observed with the number of network interfaces on the node owned by the Container Network Interface (CNI) plugin getting out of proportion with the number of running pods:
$ ip link | grep cali | wc -l
1088
This is unexpected as it shouldn’t exceed the maximum number of pods allowed on a node (we use the default limit of 110). While this issue is interesting and perhaps worthy of a whole separate blog, the short of it is that the Linux network interfaces owned by the CNI are not getting cleaned up after a pod terminates.
Some history on this can be read in a Docker GitHub issue. We found this seems to plague nodes with a longer uptime, and after rebooting the node it would be fine for about a month. However, with a significant number of nodes, this was happening multiple times per day. Each instance would need rebooting, which means going through our worker reboot procedure which looked like this:
- Cordon off the affected node to prevent new workloads from scheduling on it.
- Collect any diagnostic information for later investigation.
- Drain the node of current workloads.
- Reboot and wait for the node to come back.
- Verify the node is healthy.
- Re-enable scheduling of new workloads to the node.
While solving the underlying issue would be ideal, we needed a mitigation to avoid toil in the meantime — an automated node remediation process.
Existing Detection and Remediation Solutions
While not complicated, the manual remediation process outlined previously became tedious and distracting, as we had to reboot nodes multiple times a day. Some manual intervention is unavoidable, but for cases matching the following, we wanted automation:
- Generic worker nodes
- Software issues confined to a given node
- Already researched and diagnosed issues
Limiting automatic remediation to generic worker nodes is important as there are other node types in our clusters where more care is required. For example, for control-plane nodes the process has to be augmented to check etcd cluster health and ensure proper redundancy for components servicing the Kubernetes API. We are also going to limit the problem space to known software issues confined to a node where we expect automatic remediation to be the right answer (as in our ballooning network interface problem). With that in mind, we took a look at existing solutions that we could use.
Node Problem Detector
Node problem detector is a daemon that runs on each node that detects problems and reports them to the Kubernetes API. It has a pluggable problem daemon system such that one can add their own logic for detecting issues with a node. Node problems are distinguished between temporary and permanent problems, with the latter being persisted as status conditions on the Kubernetes node resources.2
Draino and Cluster-Autoscaler
Draino as its name implies, drains nodes but does so based on Kubernetes node conditions. It is meant to be used with cluster-autoscaler which then can add or remove nodes via the cluster plugins to scale node groups.
Kured
Kured is a daemon that looks at the presence of a file on the node to initiate a drain, reboot and uncordon of the given node. It uses a locking mechanism via the Kubernetes API to ensure only a single node is acted upon at a time.
Cluster-API
The Kubernetes cluster-lifecycle SIG has been working on the cluster-api project to enable declaratively defining clusters to simplify provisioning, upgrading, and operating multiple Kubernetes clusters. It has a concept of machine resources which back Kubernetes node resources and furthermore has a concept of machine health checks. Machine health checks use node conditions to determine unhealthy nodes and then the cluster-api provider is then delegated to replace that machine via create and delete operations.
Proof of Concept
Interestingly, with all the above except for Kured, there is a theme of pluggable components centered around Kubernetes node conditions. We wanted to see if we could build a proof of concept using the existing theme and solutions. For the existing solutions, draino with cluster-autoscaler didn’t make sense in a non-cloud environment like our bare-metal set up. The cluster-api health checks are interesting, however they require a more complete investment into the cluster-api project to really make sense. That left us with node-problem-detector and kured. Deploying node-problem-detector was simple, and we ended up testing a custom-plugin-monitor like the following:
apiVersion: v1
kind: ConfigMap
metadata:
  name: node-problem-detector-config
data:
  check_calico_interfaces.sh: |
    #!/bin/bash
    set -euo pipefail

    count=$(nsenter -n/proc/1/ns/net ip link | grep cali | wc -l)

    if (( $count > 150 )); then
      echo "Too many calico interfaces ($count)"
      exit 1
    else
      exit 0
    fi
  cali-monitor.json: |
    {
      "plugin": "custom",
      "pluginConfig": {
        "invoke_interval": "30s",
        "timeout": "5s",
        "max_output_length": 80,
        "concurrency": 3,
        "enable_message_change_based_condition_update": false
      },
      "source": "calico-custom-plugin-monitor",
      "metricsReporting": false,
      "conditions": [
        {
          "type": "NPDCalicoUnhealthy",
          "reason": "CalicoInterfaceCountOkay",
          "message": "Normal amount of interfaces"
        }
      ],
      "rules": [
        {
          "type": "permanent",
          "condition": "NPDCalicoUnhealthy",
          "reason": "TooManyCalicoInterfaces",
          "path": "/bin/bash",
          "args": [
            "/config/check_calico_interfaces.sh"
          ],
          "timeout": "3s"
        }
      ]
    }
Testing showed that when the condition became true, a condition would be updated on the associated Kubernetes node like so:
kubectl get node -o json worker1a | jq '.status.conditions[] | select(.type | test("^NPD"))'
{
  "lastHeartbeatTime": "2020-03-20T17:05:17Z",
  "lastTransitionTime": "2020-03-20T17:05:16Z",
  "message": "Too many calico interfaces (154)",
  "reason": "TooManyCalicoInterfaces",
  "status": "True",
  "type": "NPDCalicoUnhealthy"
}
With that in place, the actual remediation needed to happen. Kured seemed to do most everything we needed, except that it was looking at a file instead of Kubernetes node conditions. We hacked together a patch to change that and tested it successfully end to end — we had a working proof of concept!
Revisiting Problem Detection
While the above worked, we found that node-problem-detector was unwieldy because we were replicating our existing monitoring into shell scripts and node-problem-detector configuration. A 2017 blog post describes Cloudflare’s monitoring stack, although some things have changed since then. What hasn’t changed is our extensive usage of Prometheus and Alertmanager.
For the network interface issue and other issues we wanted to address, we already had the necessary exported metrics and alerting to go with them. Here is what our already existing alert looked like3:
- alert: CalicoTooManyInterfaces
  expr: sum(node_network_info{device=~"cali.*"}) by (node) >= 200
  for: 1h
  labels:
    priority: "5"
    notify: chat-sre-core chat-k8s
Note that we use a “notify” label to drive the routing logic in Alertmanager. However, that got us asking, could we just route this to a Kubernetes node condition instead?
Introducing Sciuro

Sciuro is our open-source replacement of node-problem-detector that has one simple job: synchronize Kubernetes node conditions with currently firing alerts in Alertmanager. Node problems can be defined with a more holistic view and using already existing exporters such as node exporter, cadvisor or mtail. It also doesn’t run on affected nodes which allows us to rely on out-of-band remediation techniques. Here is a high level diagram of how Sciuro works:
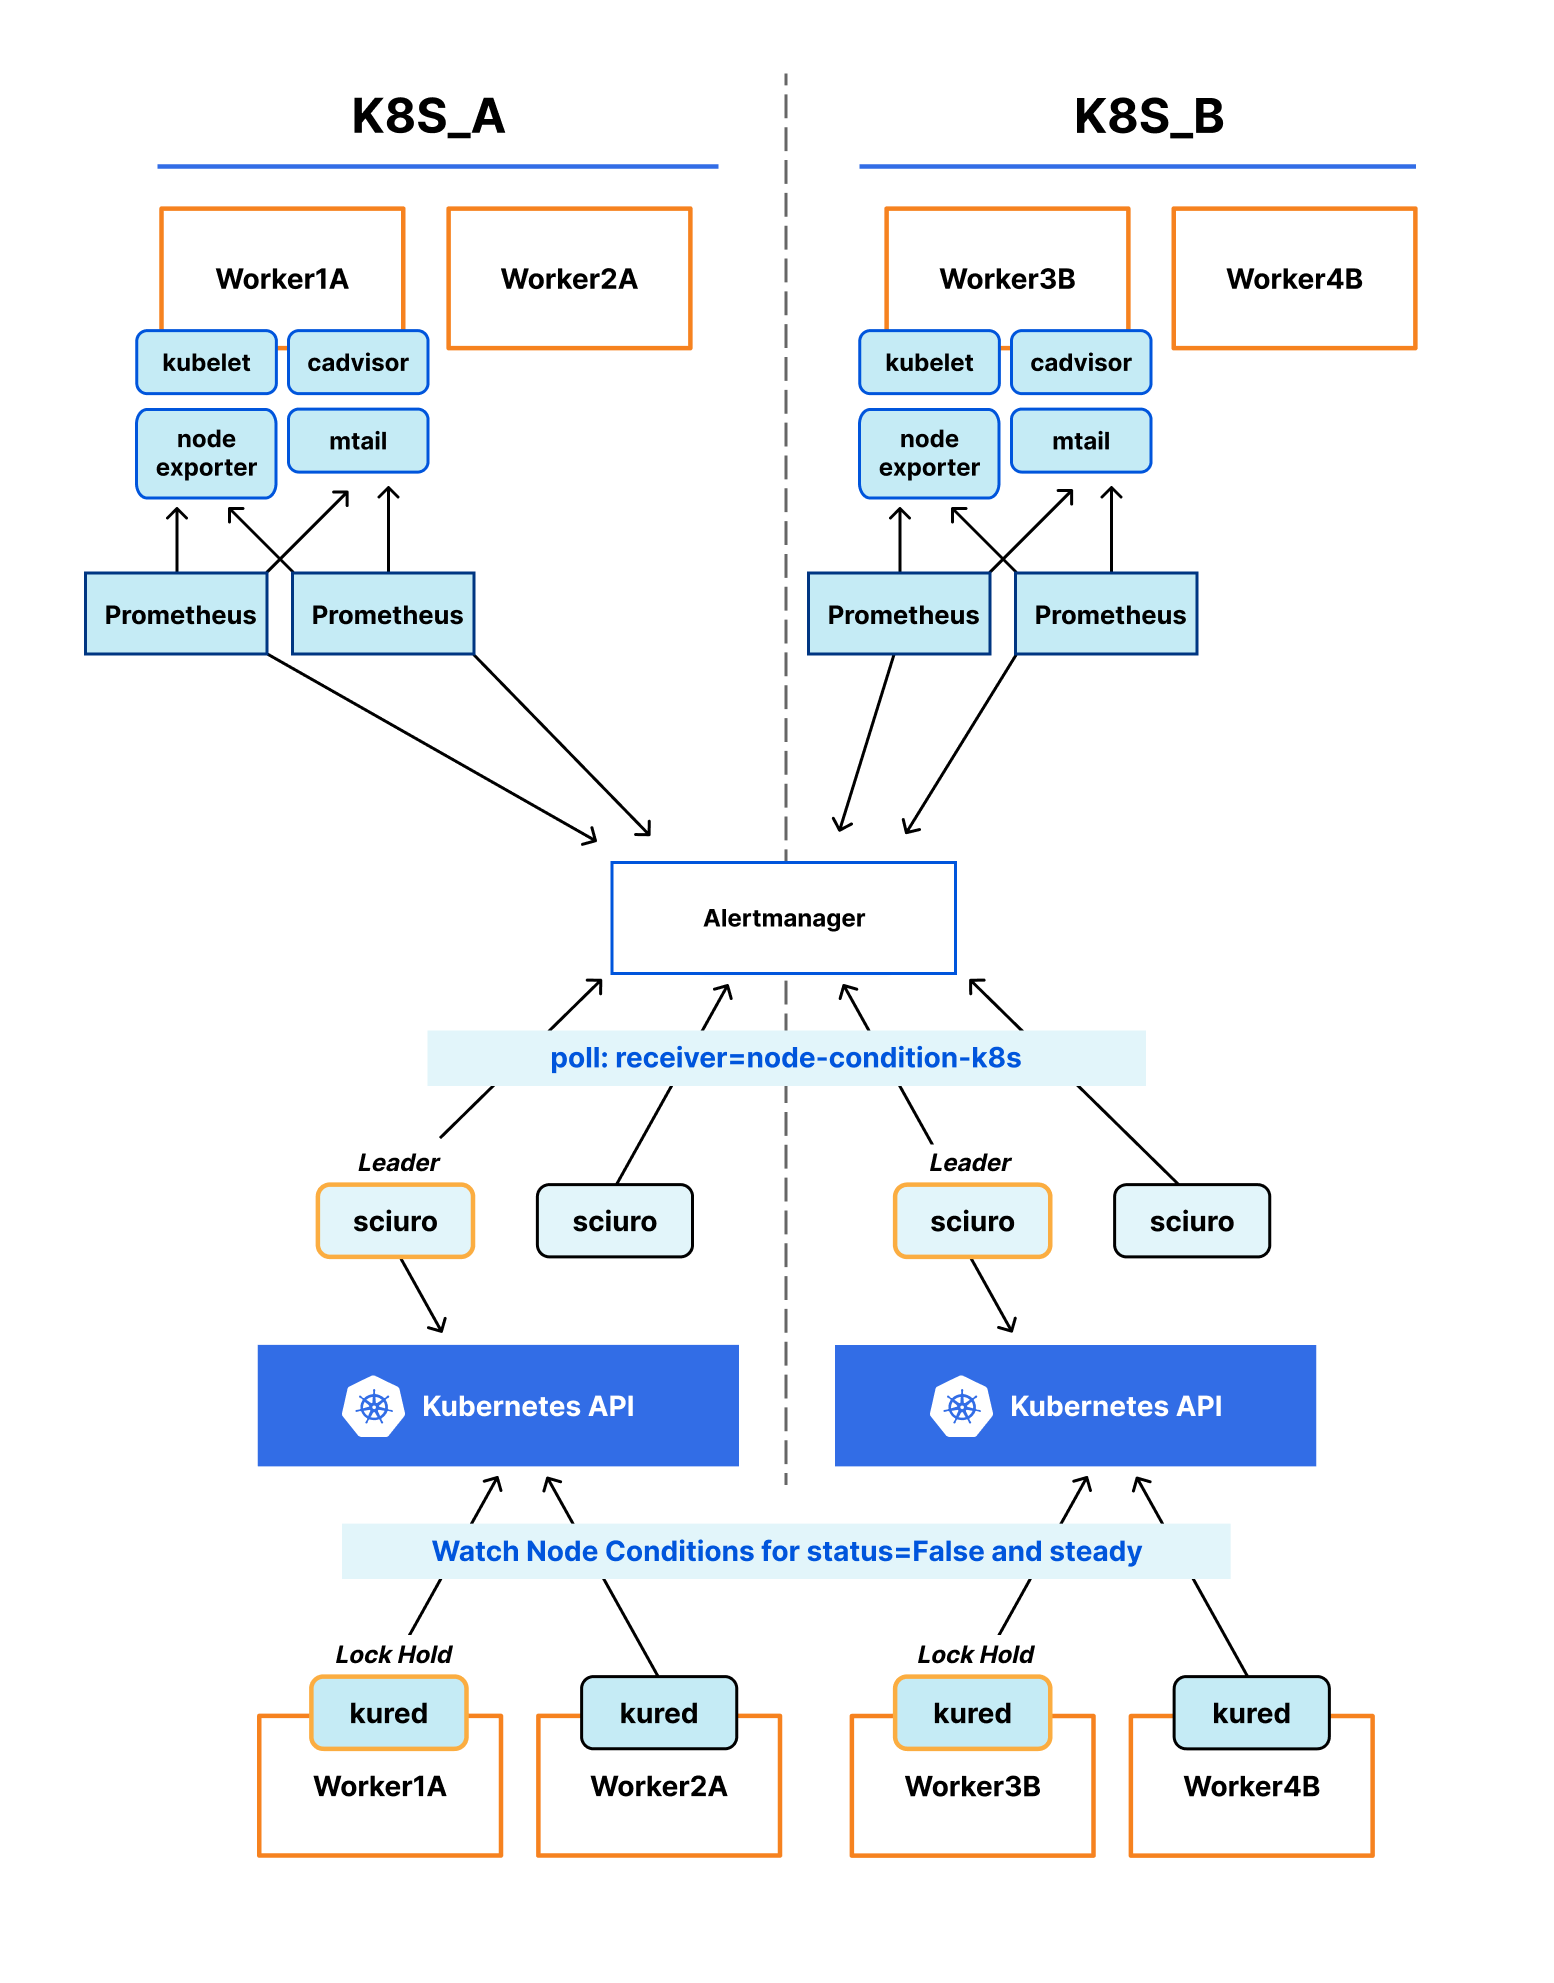
Starting from the top, nodes are scraped by Prometheus, which collects those metrics and fires relevant alerts to Alertmanager. Sciuro polls Alertmanager for alerts with a matching receiver, matches them with a corresponding node resource in the Kubernetes API and updates that node’s conditions accordingly.
In more detail, we can start by defining an alert in Prometheus like the following:
- alert: CalicoTooManyInterfacesEarly
  expr: sum(node_network_info{device=~"cali.*"}) by (node) >= 150
  labels:
    priority: "6"
    notify: node-condition-k8s
Note the two differences from the previous alert. First, we use a new name with a more sensitive trigger. The idea is that we want automatic node remediation to try fixing the node first as soon as possible, but if the problem worsens or automatic remediation is failing, humans will still get notified to act. The second difference is that instead of notifying chat rooms, we route to a target called “node-condition-k8s”.
Sciuro then comes into play, polling the Altertmanager API for alerts matching the “node-condition-k8s” receiver. The following shows the equivalent using amtool:
$ amtool alert query -r node-condition-k8s
Alertname                 	Starts At            	Summary
CalicoTooManyInterfacesEarly  2021-05-11 03:25:21 UTC  Kubernetes node worker1a has too many Calico interfaces
We can also check the labels for this alert:
$ amtool alert query -r node-condition-k8s -o json | jq '.[] | .labels'
{
  "alertname": "CalicoTooManyInterfacesEarly",
  "cluster": "a.k8s",
  "instance": "worker1a",
  "node": "worker1a",
  "notify": "node-condition-k8s",
  "priority": "6",
  "prometheus": "k8s-a"
}
Note the node and instance labels which Sciuro will use for matching with the corresponding Kubernetes node. Sciuro uses the excellent controller-runtime to keep track of and update node sources in the Kubernetes API. We can observe the updated node condition on the status field via kubectl:
$ kubectl get node worker1a -o json | jq '.status.conditions[] | select(.type | test("^AlertManager"))'
{
  "lastHeartbeatTime": "2021-05-11T03:31:20Z",
  "lastTransitionTime": "2021-05-11T03:26:53Z",
  "message": "[P6] Kubernetes node worker1a has too many Calico interfaces",
  "reason": "AlertIsFiring",
  "status": "True",
  "type": "AlertManager_CalicoTooManyInterfacesEarly"
}
One important note is Sciuro added the AlertManager_ prefix to the node condition type to prevent conflicts with other node condition types. For example, DiskPressure, a kubelet managed condition, could also be an alert name. Sciuro will also properly update heartbeat and transition times to reflect when it first saw the alert and its last update. With node conditions synchronized by Sciuro, remediation can take place via one of the existing tools. As mentioned previously we are using a modified version of Kured for now.
We’re happy to announce that we’ve open sourced Sciuro, and it can be found on GitHub where you can read the code, find the deployment instructions, or open a Pull Request for changes.
Managing Node Uptime
While we began using automatic node remediation for obvious problems, we’ve expanded its purpose to additionally keep node uptime low. Low node uptime is desirable to further reduce drift on nodes, keep the node initialization process well-oiled, and encourage the best deployment practices on the Kubernetes clusters. To expand on the last point, services that are deployed with best practices and in a high availability fashion should see negligible impact when a single node leaves the cluster. However, services that are not deployed with best practices will most likely have problems especially if they rely on singleton pods. By draining nodes more frequently, it introduces regular chaos that encourages best practices. To enable this with automatic node remediation the following alert was defined:
- alert: WorkerUptimeTooHigh
  expr: |
    (
      (
        (
              max by(node) (kube_node_role{role="worker"})
            - on(node) group_left()
              (max by(node) (kube_node_role{role!="worker"}))
          or on(node)
            max by(node) (kube_node_role{role="worker"})
        ) == 1
      )
    * on(node) group_left()
      (
        (time() - node_boot_time_seconds) > (60 * 60 * 24 * 7)
      )
    )
  labels:
    priority: "9"
    notify: node-condition-k8s
There is a bit of juggling with the kube_node_roles metric in the above to isolate the alert to generic worker nodes, but at a high level it looks at node_boot_time_seconds, a metric from prometheus node_exporter. Again the notify label is configured to send to node conditions which kicks off the automatic node remediation. One further detail is the priority here is set to “9” which is of lower precedence than our other alerts. Note that the message field of the node condition is prefixed with the alert priority in brackets. This allows the remediation process to take priority into account when choosing which node to remediate first, which is important because Kured uses a lock to act on a single node at a time.
Wrapping Up
In the past 30 days, we’ve used the above automatic node remediation process to action 571 nodes. That has saved our humans a considerable amount of time. We’ve also been able to reduce the time to repair for some issues as automatic remediation can act at all times of the day and with a faster response time.
As mentioned before, we’re open sourcing Sciuro and its code can be found on GitHub. We’re open to issues, suggestions, and pull requests. We do have some ideas for future improvements. For Sciuro, we may look to reduce latency which is mainly due to polling and potentially add a push model from Altermanager although this isn’t a need we’ve had yet. For the larger node remediation story, we hope to do an overhaul of the remediating component. As mentioned previously, we are currently using a fork of kured, but a future replacement component should include the following:
- Use out-of-band management interfaces to be able to shut down and power on nodes without a functional operating system.
- Move from decentralized architecture to a centralized one that can integrate more complicated logic. This might include being able to act on entire failure domains in parallel.
- Handle specialized nodes such as masters or storage nodes.
Finally, we’re looking for more people passionate about Kubernetes to join our team. Come help us push Kubernetes to the next level to serve Cloudflare’s many needs!
1Exhaustion can be applied to hardware resources, kernel resources, or logical resources like the amount of logging being produced.
2Nearly all Kubernetes objects have spec and status fields. The status field is used to describe the current state of an object. For node resources, typically the kubelet manages a conditions field under the status field for reporting things like if the node is ready for servicing pods.
3The format of the following alert is documented on Prometheus Alerting Rules.