Post Syndicated from Umesh Ramesh original https://aws.amazon.com/blogs/security/analyze-aws-waf-logs-using-amazon-opensearch-service-anomaly-detection-built-on-random-cut-forests/
This blog post shows you how to use the machine learning capabilities of Amazon OpenSearch Service (successor to Amazon Elasticsearch Service) to detect and visualize anomalies in AWS WAF logs. AWS WAF logs are streamed to Amazon OpenSearch Service using Amazon Kinesis Data Firehose. Kinesis Data Firehose invokes an AWS Lambda function to transform incoming source data and deliver the transformed data to Amazon OpenSearch Service. You can implement this solution without any machine learning expertise. AWS WAF logs capture a number of attributes about the incoming web request, and you can analyze these attributes to detect anomalous behavior. This blog post focuses on the following two scenarios:
- Identifying anomalous behavior based on a high number of web requests coming from an unexpected country (Country Code is one of the request fields captured in AWS WAF logs).
- Identifying anomalous behavior based on HTTP method for a read-heavy application like a content media website that receives unexpected write requests.
Log analysis is essential for understanding the effectiveness of any security solution. It helps with day-to-day troubleshooting, and also with long-term understanding of how your security environment is performing.
AWS WAF is a web application firewall that helps protect your web applications from common web exploits which could affect application availability, compromise security, or consume excessive resources. AWS WAF gives you control over which traffic sent to your web applications is allowed or blocked, by defining customizable web security rules. AWS WAF lets you define multiple types of rules to block unauthorized traffic.
Machine learning can assist in identifying unusual or unexpected behavior. Amazon OpenSearch Service is one of the commonly used services which offer log analytics for monitoring service logs, using dashboards and alerting mechanisms. Static, rule‑based analytics approaches are slow to adapt to evolving workloads, and can miss critical issues. With the announcement of real-time anomaly detection support in Amazon OpenSearch Service, you can use machine learning to detect anomalies in real‑time streaming data, and identify issues as they evolve so you can mitigate them quickly. Real‑time anomaly detection support uses Random Cut Forest (RCF), an unsupervised algorithm, which continuously adapts to evolving data patterns. Simply stated, RCF takes a set of random data points, divides them into multiple groups, each with the same number of points, and then builds a collection of models. As an unsupervised algorithm, RCF uses cluster analysis to detect spikes in time series data, breaks in periodicity or seasonality, and data point exceptions. The anomaly detection feature is lightweight, with the computational load distributed across Amazon OpenSearch Service nodes. Figure 1 shows the architecture of the solution described in this blog post.
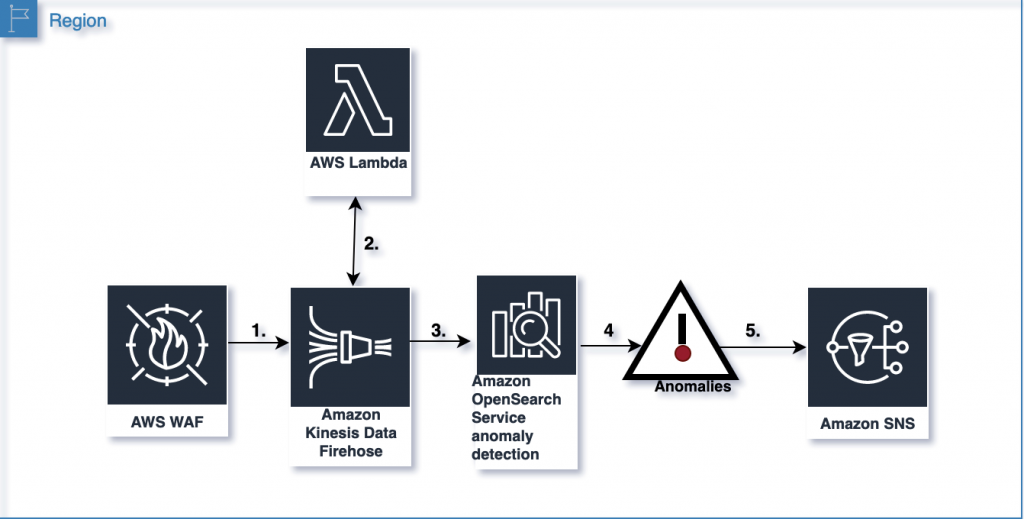
Figure 1: End-to-end architecture
The architecture flow shown in Figure 1 includes the following high-level steps:
- AWS WAF streams logs to Kinesis Data Firehose.
- Kinesis Data Firehose invokes a Lambda function to add attributes to the AWS WAF logs.
- Kinesis Data Firehose sends the transformed source records to Amazon OpenSearch Service.
- Amazon OpenSearch Service automatically detects anomalies.
- Amazon OpenSearch Service delivers anomaly alerts via Amazon Simple Notification Service (Amazon SNS).
Solution
Figure 2 shows examples of both an original and a modified AWS WAF log. The solution in this blog post focuses on Country and httpMethod. It uses a Lambda function to transform the AWS WAF log by adding fields, as shown in the snippet on the right side. The values of the newly added fields are evaluated based on the values of country and httpMethod in the AWS WAF log.
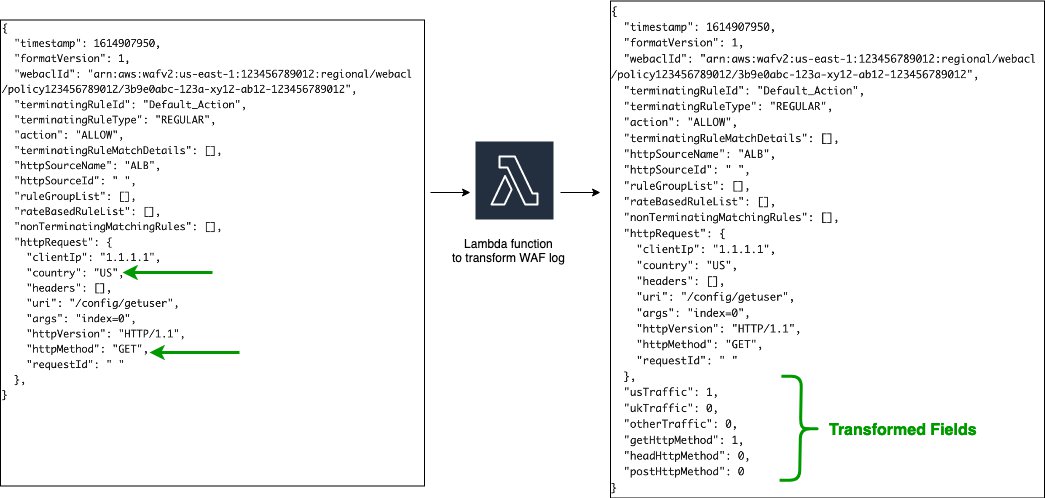
Figure 2: Sample processing done by a Lambda function
In this solution, you will use a Lambda function to introduce new fields to the incoming AWS WAF logs through Kinesis Data Firehose. You will introduce additional fields by using one-hot encoding to represent the incoming linear values as a “1” or “0”.
Scenario 1
In this scenario, the goal is to detect traffic from unexpected countries when serving user traffic expected to be from the US and UK. The function adds three new fields:
usTraffic
ukTraffic
otherTraffic
As shown in the lambda function inline code, we use the traffic_from_country function, in which we only want actions that ALLOW the traffic. Once we have that, we use conditions to check the country code. If the value of the country field in the web request captured in AWS WAF log is US, the usTraffic field in the transformed data will be assigned the value 1 while otherTraffic and ukTraffic will be assigned the value 0. The other two fields are transformed as shown in Table 1.
| Original AWS WAF log | Transformed AWS WAF log with new fields after one-hot encoding | ||
| Country | usTraffic | ukTraffic | otherTraffic |
| US | 1 | 0 | 0 |
| UK | 0 | 1 | 0 |
| All other country codes | 0 | 0 | 1 |
Table 1: One-hot encoding field mapping for country
Scenario 2
In the second scenario, you detect anomalous requests that use POST HTTP method.
As shown in the lambda function inline code, we use the filter_http_request_method function, in which we only want actions that ALLOW the traffic. Once we have that, we use conditions to check the HTTP _request method. If the value of the HTTP method in the AWS WAF log is GET, the getHttpMethod field is assigned the value 1 while headHttpMethod and postHttpMethod are assigned the value 0. The other two fields are transformed as shown in Table 2.
| Original AWS WAF log | Transformed AWS WAF log with new fields after one-hot encoding | ||
| HTTP method | getHttpMethod | headHttpMethod | postHttpMethod |
| GET | 1 | 0 | 0 |
| HEAD | 0 | 1 | 0 |
| POST | 0 | 0 | 1 |
Table 2: One-hot encoding field mapping for HTTP method
After adding these new fields, the transformed record from Lambda must contain the following parameters before the data is sent back to Kinesis Data Firehose:
| recordId | The transformed record must contain the same original record ID as is received from the Kinesis Data Firehose. |
| result | The status of the data transformation of the record (the status can be OK or Dropped). |
| data | The transformed data payload. |
AWS WAF logs are JSON files, and this anomaly detection feature works only on numeric data. This means that to use this feature for detecting anomalies in logs, you must pre-process your logs using a Lambda function.
Lambda function for one-hot encoding
Use the following Lambda function to transform the AWS WAF log by adding new attributes, as explained in Scenario 1 and Scenario 2.
After the transformation, the data that’s delivered to Amazon OpenSearch Service will have additional fields, as described in Table 1 and Table 2 above. You can configure an anomaly detector in Amazon OpenSearch Service to monitor these additional fields. The algorithm computes an anomaly grade and confidence score value for each incoming data point. Anomaly detection uses these values to differentiate an anomaly from normal variations in your data. Anomaly detection and alerting are plugins that are included in the available set of Amazon OpenSearch Service plugins. You can use these two plugins to generate a notification as soon as an anomaly is detected.
Deployment steps
In this section, you complete five high-level steps to deploy the solution. In this blog post, we are deploying this solution in the us-east-1 Region. The solution assumes you already have an active web application protected by AWS WAF rules. If you’re looking for details on creating AWS WAF rules, refer to Working with web ACLs and sample examples for more information.
Note: When you associate a web ACL with Amazon CloudFront as a protected resource, make sure that the Kinesis Firehose Delivery Stream is deployed in the us-east-1 Region.
The steps are:
- Deploy an AWS CloudFormation template
- Enable AWS WAF logs
- Create an anomaly detector
- Set up alerts in Amazon OpenSearch Service
- Create a monitor for the alerts
Deploy a CloudFormation template
To start, deploy a CloudFormation template to create the following AWS resources:
- Amazon OpenSearch Service and Kibana (versions 1.5 to 7.10) with built-in AWS WAF dashboards.
- Kinesis Data Firehose streams
- A Lambda function for data transformation and an Amazon SNS topic with email subscription.
To deploy the CloudFormation template
- Download the CloudFormation template and save it locally as Amazon-ES-Stack.yaml.
- Go to the AWS Management Console and open the CloudFormation console.
- Choose Create Stack.
- On the Specify template page, choose Upload a template file. Then select Choose File, and select the template file that you downloaded in step 1.
- Choose Next.
- Provide the Parameters:
- Enter a unique name for your CloudFormation stack.
- Update the email address for UserEmail with the address you want alerts sent to.
- Choose Next.
- Review and choose Create stack.
- When the CloudFormation stack status changes to CREATE_COMPLETE, go to the Outputs tab and make note of the DashboardLinkOutput value. Also note the credentials you’ll receive by email (Subject: Your temporary password) and subscribe to the SNS topic for which you’ll also receive an email confirmation request.
Enable AWS WAF logs
Before enabling the AWS WAF logs, you should have AWS WAF web ACLs set up to protect your web application traffic. From the console, open the AWS WAF service and choose your existing web ACL. Open your web ACL resource, which can either be deployed on an Amazon CloudFront distribution or on an Application Load Balancer.
To enable AWS WAF logs
- From the AWS WAF home page, choose Create web ACL.
- From the AWS WAF home page, choose Logging and metrics
- From the AWS WAF home page, choose the web ACL for which you want to enable logging, as shown in Figure 3:

Figure 3 – Enabling WAF logging
- Go to the Logging and metrics tab, and then choose Enable Logging. The next page displays all the delivery streams that start with aws-waf-logs. Choose the Kinesis Data Firehose delivery stream that was created by the Cloud Formation template, as shown in Figure 3 (in this example, aws-waf-logs-useast1). Don’t redact any fields or add filters. Select Save.

Create an Index template
Index templates lets you initialize new indices with predefined mapping. For example, in this case you predefined mapping for timestamp.
To create an Index template
- Log into the Kibana dashboard. You can find the Kibana dashboard link in the Outputs tab of the CloudFormation stack. You should have received the username and temporary password (Ignore the period (.) at the end of the temporary password) by email, at the email address you entered as part of deploying the CloudFormation template. You will be logged in to the Kibana dashboard after setting a new password.
- Choose Dev Tools in the left menu panel to access Kibana’s console.
- The left pane in the console is the request pane, and the right pane is the response pane.
- Select the green arrow at the end of the command line to execute the following PUT command.
- You should see the following response:
The command creates a template named awswaf and applies it to any new index name that matches the regular expression awswaf-*
Create an anomaly detector
A detector is an individual anomaly detection task. You can create multiple detectors, and all the detectors can run simultaneously, with each analyzing data from different sources.
To create an anomaly detector
- Select Anomaly Detection from the menu bar, select Detectors and Create Detector.
Figure 4- Home page view with menu bar on the left
- To create a detector, enter the following values and features:
Name and description
Name: aws-waf-country Description: Detect anomalies on other country values apart from “US” and “UK“ Data Source
Index: awswaf* Timestamp field: timestamp Data filter: Visual editor 
Figure 5 – Detector features and their values
- For Detector operation settings, enter a value in minutes for the Detector interval to set the time interval at which the detector collects data. To add extra processing time for data collection, set a Window delay value (also in minutes). This tells the detector that the data isn’t ingested into Amazon OpenSearch Service in real time, but with a delay. The example in Figure 6 uses a 1-minute interval and a 2-minute delay.
Figure 6 – Detector operation settings
- Next, select Create.
- Once you create a detector, select Configure Model and add the following values to Model configuration:
Feature Name: waf-country-other Feature State: Enable feature Find anomalies based on: Field value Aggregation method: sum() Field: otherTraffic The aggregation method determines what constitutes an anomaly. For example, if you choose min(), the detector focuses on finding anomalies based on the minimum values of your feature. If you choose average(), the detector finds anomalies based on the average values of your feature. For this scenario, you will use sum().The value otherTraffic for Field is the transformed field in the Amazon OpenSearch Service logs that was added by the Lambda function.

Figure 7 – Detector Model configuration
- Under Advanced Settings on the Model configuration page, update the Window size to an appropriate interval (1 equals 1 minute) and choose Save and Start detector and Automatically start detector.
We recommend you choose this value based on your actual data. If you expect missing values in your data, or if you want the anomalies based on the current value, choose 1. If your data is continuously ingested and you want the anomalies based on multiple intervals, choose a larger window size.
Note: The detector takes 4 to 5 minutes to start.
Figure 8 – Detector window size


Set up alerts
You’ll use Amazon SNS as a destination for alerts from Amazon OpenSearch Service.
Note: A destination is a reusable location for an action.
To set up alerts:
- Go to the Kibana main menu bar and select Alerting, and then navigate to the Destinations tab.
- Select Add destination and enter a unique name for the destination.
- For Type, choose Amazon SNS and provide the topic ARN that was created as part of the CloudFormation resources (captured in the Outputs tab).
- Provide the ARN for an IAM role that was created as part of the CloudFormation outputs (SNSAccessIAMRole-********) that has the following trust relationship and permissions (at a minimum):

Figure 9 – Destination
Note: For more information, see Adding IAM Identity Permissions in the IAM user guide.
- Choose Create.

Create a monitor
A monitor can be defined as a job that runs on a defined schedule and queries Amazon OpenSearch Service. The results of these queries are then used as input for one or more triggers.
To create a monitor for the alert
- Select Alerting on the Kibana main menu and navigate to the Monitors tab. Select Create monitor
- Create a new record with the following values:
Monitor Name: aws-waf-country-monitor Method of definition: Define using anomaly detector Detector: aws-waf-country Monitor schedule: Every 2 minutes - Select Create.

Figure 10 – Create monitor
- Choose Create Trigger to connect monitoring alert with the Amazon SNS topic using the below values:
Trigger Name: SNS_Trigger Severity Level: 1 Trigger Type: Anomaly Detector grade and confidence Under Configure Actions, set the following values:
Action Name: SNS-alert Destination: select the destination name you chose when you created the Alert above Message Subject: “Anomaly detected – Country” Message: <Use the default message displayed> - Select Create to create the trigger.
Figure 11 – Create trigger
Figure 12 – Configure actions


Test the solution
Now that you’ve deployed the solution, the AWS WAF logs will be sent to Amazon OpenSearch Service.
Kinesis Data Generator sample template
When testing the environment covered in this blog outside a production context, we used Kinesis Data Generator to generate sample user traffic with the template below, changing the country strings in different runs to reflect expected records or anomalous ones. Other tools are also available.
You will receive an email alert via Amazon SNS if the traffic contains any anomalous data. You should also be able to view the anomalies recorded in Amazon OpenSearch Service by selecting the detector and choosing Anomaly results for the detector, as shown in Figure 13.
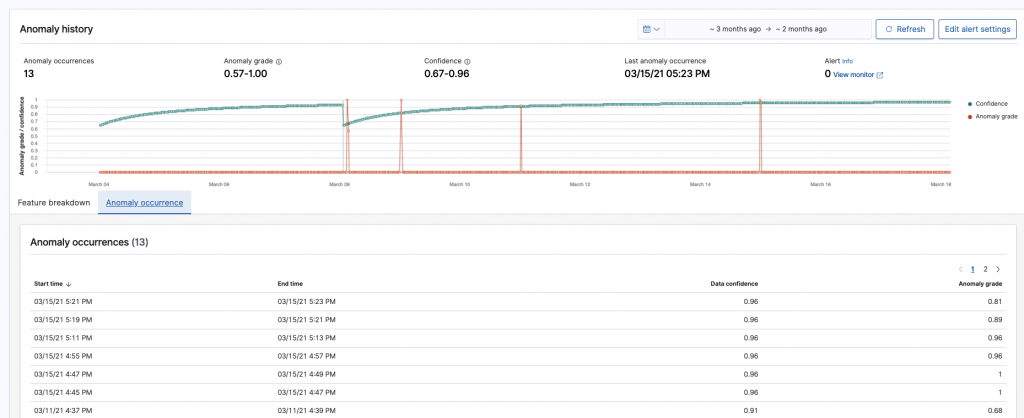
Figure 13 – Anomaly results
Conclusion
In this post, you learned how you can discover anomalies in AWS WAF logs across parameters like Country and httpMethod defined by the attribute values. You can further expand your anomaly detection use cases with application logs and other AWS Service logs. To learn more about this feature with Amazon OpenSearch Service, we suggest reading the Amazon OpenSearch Service documentation. We look forward to hearing your questions, comments, and feedback.
If you found this post interesting and useful, you may be interested in https://aws.amazon.com/blogs/security/how-to-improve-visibility-into-aws-waf-with-anomaly-detection/ and https://aws.amazon.com/blogs/big-data/analyzing-aws-waf-logs-with-amazon-es-amazon-athena-and-amazon-quicksight/ as further alternative approaches.
If you have feedback about this post, submit comments in the Comments section below.
Want more AWS Security news? Follow us on Twitter.