Post Syndicated from Kevin Low original https://aws.amazon.com/blogs/security/how-to-deploy-an-amazon-opensearch-cluster-to-ingest-logs-from-amazon-security-lake/
January 30, 2025: This post was republished to make the instructions clearer and compatible with OCSF 1.1.
Customers often require multiple log sources across their AWS environment to empower their teams to respond and investigate security events. In part one of this two-part blog post, I show you how you can use Amazon OpenSearch Service to ingest logs collected by Amazon Security Lake to facilitate near real-time monitoring.
Many customers use Security Lake to automatically centralize security data from Amazon Web Services (AWS) environments, software as a service (SaaS) providers, on-premises workloads, and cloud sources into a purpose-built data lake in their AWS environment. OpenSearch Service is a managed service that customers can use to deploy, operate, and scale OpenSearch clusters in the AWS Cloud. It natively integrates with Security Lake to enable customers to perform interactive log analytics and searches across large datasets, create enterprise visualization and dashboards, and perform analysis across disparate applications and logs. With Amazon OpenSearch Security Analytics, customers can also gain visibility into the security posture of their organization’s infrastructure, monitor for anomalous activity, detect potential security threats in near real time, and initiate alerts to pre-configured destinations.
Without using Amazon OpenSearch Service, customers would need to build, deploy and manage infrastructure for an analytics solution, such as an ELK stack.
Prerequisites
Security Lake should already be deployed. For details on how to deploy Security Lake, see Getting started with Amazon Security Lake. You will need AWS Identity and Access Management (IAM) permissions to manage Security Lake, OpenSearch Service, Amazon Cognito, AWS Secrets Manager, and Amazon Elastic Compute Cloud (Amazon EC2), and to create IAM roles to follow along with this post. The solution can be deployed in any AWS Region that has at least 3 Availability Zones, supports Security Lake, OpenSearch, and OpenSearch Ingestion.
Solution overview
The architecture diagram in Figure 1 shows the completed architecture of the solution.
- The OpenSearch Service cluster is deployed within a virtual private cloud (VPC) across three Availability Zones for high availability.
- The OpenSearch Service cluster ingests logs from Security Lake using an OpenSearch Ingestion pipeline.
- The cluster is accessed by end users through a public-facing proxy hosted on an Amazon EC2 instance.
- To reduce costs, the template doesn’t deploy a dead letter queue (DLQ) for the OpenSearch Ingestion pipeline. You can add one later if you want.
- Instead of a public facing proxy, you can deploy a VPN to access your cluster.
- Authentication to the cluster is managed with Amazon Cognito.
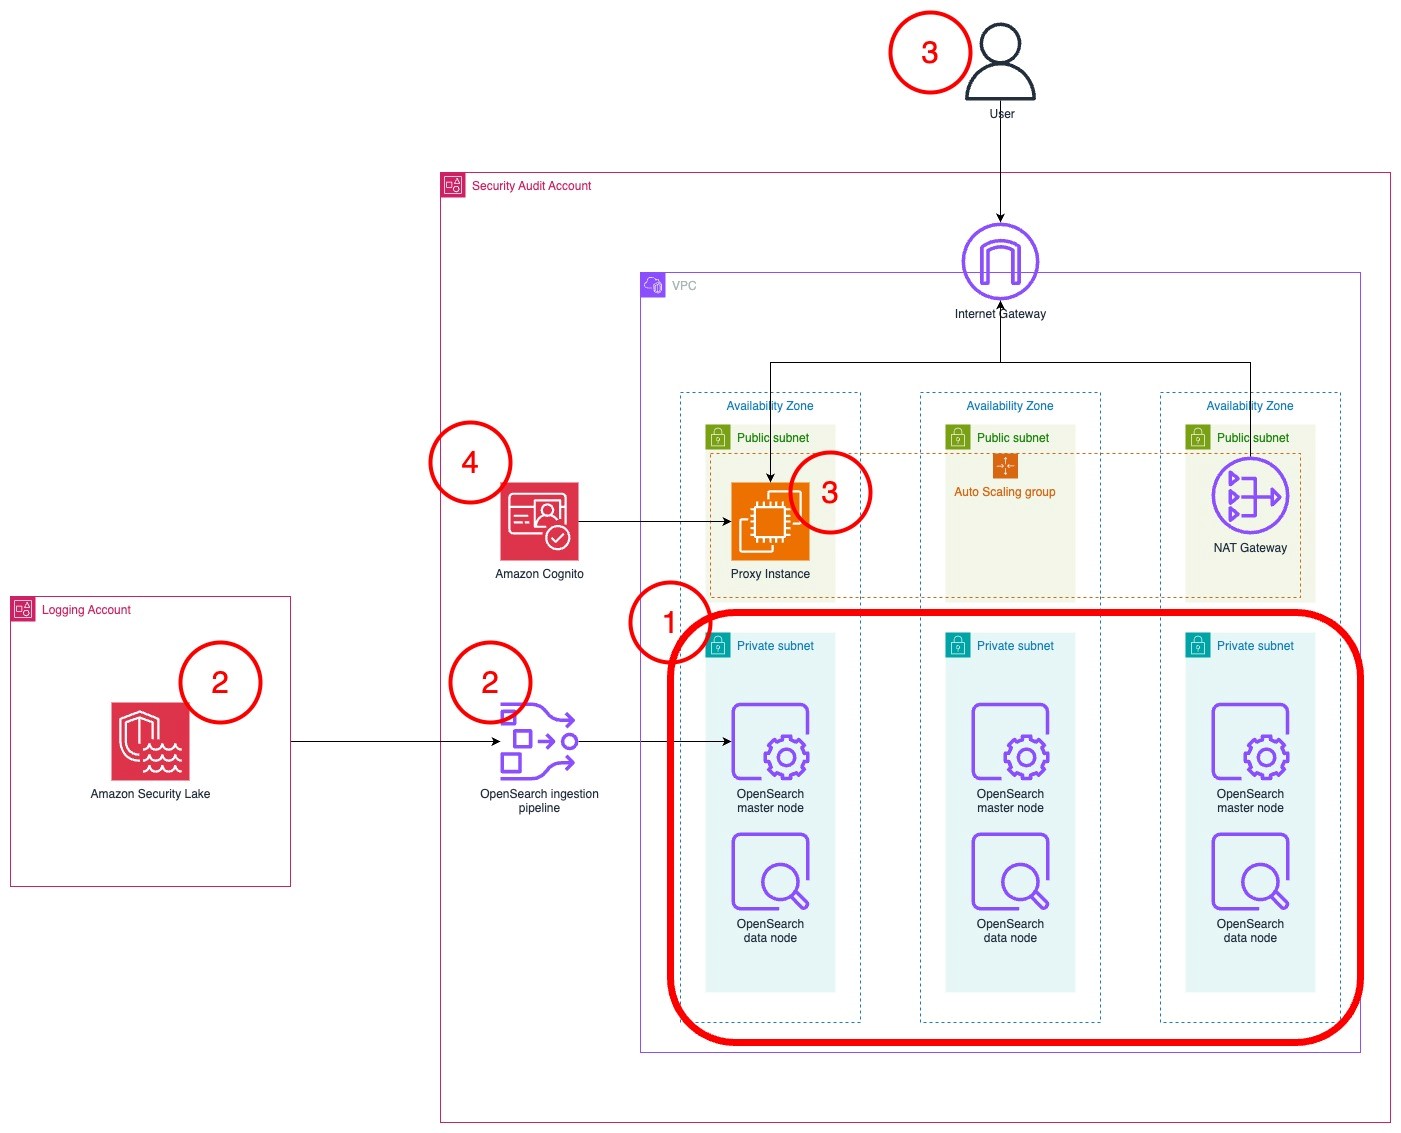
Figure 1: Solution architecture
Planning the deployment
This section will help you plan your OpenSearch service deployment, including what nodes you should choose, the amount of storage to allocate, and where to deploy the cluster.
Deciding instances for the OpenSearch Service master and data nodes
First, determine what instance type to use for the master and data nodes. If your workload generates less than 100 GB of Security Lake logs per day, we recommend using three m6g.large.search master nodes and three r6g.large.search data nodes. You can start small and scale up or scale out later. For more information about deciding the size and number of instances, see Get started with Amazon OpenSearch Service. Note the instance types that you have selected on a text editor because you will use this as an input for the AWS CloudFormation template that you will deploy later.
Configuring storage
To optimize your storage costs, you need to plan your data strategy. In this architecture, Security Lake is used for long-term log storage. Because Security Lake uses Amazon Simple Storage Service (Amazon S3), you can optimize long-term storage costs. You can configure OpenSearch Service to ingest priority logs based on the recent data that you can use for near-real time detection and alerting. Your team can query logs in Security Lake using its Zero-ETL integration with OpenSearch Service to analyze older logs.
Therefore, Security Lake should serve as your primary long-term log storage, with OpenSearch Service storing only the most recent logs.
The number of days of logs in OpenSearch Service will depend on how many days’ worth of data you need to investigate at a given time. I recommend storing 15 days of data in OpenSearch Service. This allows you to react to and investigate the most immediate security events while optimizing storage costs for older logs.
The next step is to determine the volume of logs generated by Security Lake.
- Sign in to the Security Lake delegated administrator account.
- Go to the AWS Management Console for Security Lake. Choose Usage in the navigation pane.
- On the Usage screen, select Last 30 days as the range of usage.
- Add the total Actual usage for the last 30 days for the data sources that you intend to send to OpenSearch. If you have used Security Lake for less than 30 days, you can use the Total predicted usage per month. Divide this figure by 30 to get the daily data volume.
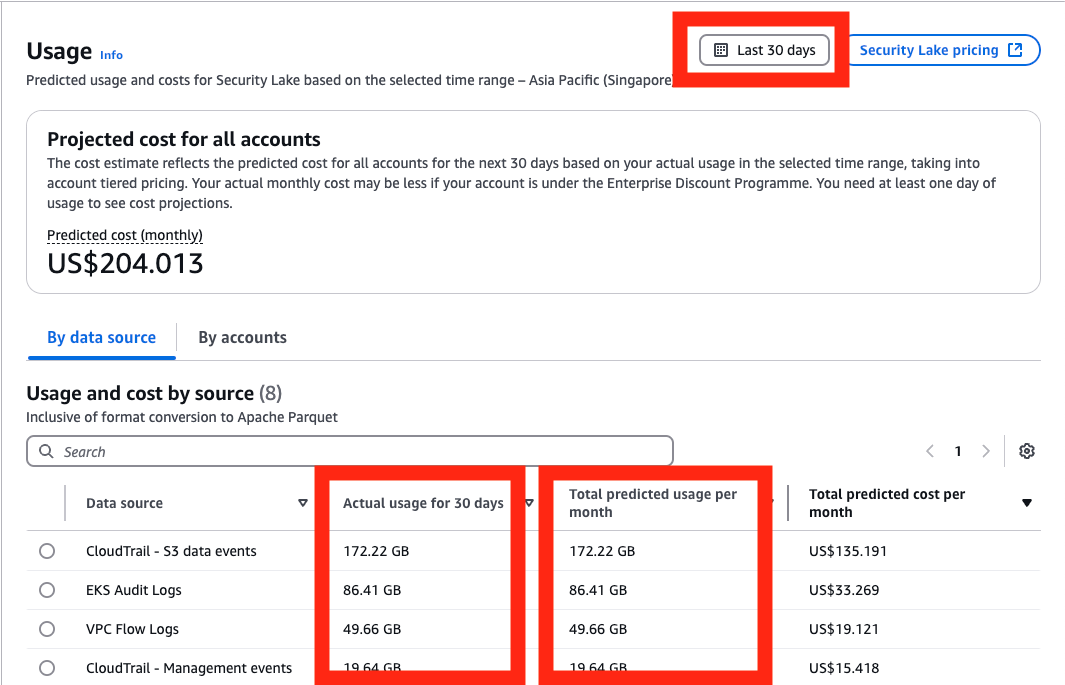
Figure 2: Select range of usage
To determine the total storage needed, multiply the data generated by Security Lake per day by the retention period you chose, then by 1.1 to account for the indexes, then multiply that number by 1.15 for overhead storage. For more information about calculating storage, see Get started with Amazon OpenSearch Service.
To determine the amount of Amazon Elastic Block Store (Amazon EBS) storage that you need per node, take the total amount of storage and divide it by the number of nodes that you have. Round that number up to the nearest whole number. You can increase the amount of storage after deployment when you have a better understanding of your workload. Make a note of this number in a text editor because you’ll use it as an input in the CloudFormation template later.
Example 1: 10 GB of Security Lake logs generated per day, stored for 30 days in OpenSearch Service in three nodes
- 10 GB of Security Lake logs stored for 30 days = 10 GB * 30 = 300 GB
- Account for additional space for indexes and overhead space = 300 GB * 1.1 * 1.15 = 379.5 GB
- Divide the storage required across three nodes, rounded up = 379.5/3 ≈ 127 GB per node
- You would need 127 GB per node in OpenSearch Service
Example 2: 200 GB of Security Lake logs generated per day, stored for 15 days in OpenSearch Service across six nodes
- 200 GB of Security Lake logs stored for 15 days = 200 GB * 15 = 3000 GB
- Account for additional space for indexes and overhead space = 3000 GB * 1.1 * 1.15 = 3795 GB
- Divide the storage required across three nodes, rounded up = 3795/6 ≈ 633 GB per node
- You would need 633 GB per node in OpenSearch Service
Where to deploy the cluster?
If you have an AWS Control Tower deployment or have a deployment modelled after the AWS Security Reference Architecture (AWS SRA), Security Lake should be deployed in the Log Archive account. Because security best practices recommend that the Log Archive account should not be frequently accessed, the OpenSearch Service cluster should be deployed into your Audit account or Security Tooling account.
You need to deploy your Security Lake subscriber in the same Region as your Security Lake roll-up Region. If you have more than one roll-up Region, choose the Region that collects logs from the Regions you want to monitor.
Your cluster needs to be deployed in the same Region as your Security Lake subscriber be able to access data.
Setting up the Security Lake subscriber
Before deploying the solution, create a Security Lake subscriber in your Security Lake roll-up Region so that OpenSearch Service can access data from Amazon Security Lake.
- Access the Security Lake console in your Log Archive account.
- Choose Subscribers in the navigation pane.
- Choose Create subscriber.
- On the Create subscriber page, enter a name, such as
OpenSearch-subscriber. - Under Data Access, select Under S3 notification type, select SQS queue.
- Under Subscriber credentials, enter the AWS account ID for the account you plan to deploy the OpenSearch cluster to, which should be your Security Tooling
- Enter
OpenSearchIngestion-<AWS account ID>under External ID.
Figure 3: Configuring the Security Lake subscriber
- Leave All log and event sources selected and choose Create.

After the subscriber has been created, you will need to collect information to facilitate the deployment.
To gather necessary information:
- Select the subscriber that you just created.
- Derive the S3 bucket name from the S3 bucket ARN and store it in a text editor. The Amazon Resource Name (ARN) is formatted as
arn:aws:s3:::<bucket name>. The bucket name should look likeaws-security-data-lake-<region>-xxxxx.
Figure 4: Derive the S3 bucket name from the Subscriber details page
- Go to the Amazon Simple Queue Service (Amazon SQS) console and select the SQS queue created as part of the Security Lake subscriber. It should look like
AmazonSecurityLake-xxxxxxxxx-Main-Queue. Note the queue’s ARN and URL in your text editor.
Figure 5: Relevant details from the SQS queue


Deploy the solution
To deploy the solution in your Security Tooling account, use a CloudFormation template. This template deploys the OpenSearch Service cluster, OpenSearch Ingestion pipeline, and an AWS Lambda function to initialize the cluster.
To deploy the OpenSearch cluster:
- To deploy the CloudFormation template that builds the OpenSearch service cluster, select the Launch Stack button.

- In the CloudFormation console, make sure that you are in the correct AWS account. You should be in your Security Tooling account. Also make sure that you have selected the same Region as your Security Lake subscriber.
- Enter a name for your stack. A name like
os-stack-<day>-<month>can help you keep track of deployments. - Enter the instance types and Amazon EBS volume size that you noted earlier.
- Enter the IP address range that you want to allow to access the proxy’s security group. You should limit this to your corporate IP range. You can set it as
0.0.0/0if you want to expose it to the public internet. - Fill in the details of the Security Lake bucket and the subscriber Amazon SQS queue ARN, URL, and Region.
Figure 6: Add stack parameters
- Check the acknowledgements in the Capabilities section.
- Choose Create stack to begin deploying the resources.
- It will take 20–30 minutes to deploy the multiple nested templates. Wait for the main stack (not the nested ones) to achieve the
CREATE_COMPLETEstatus before proceeding to the next step.
Note: If you encounter failures while deployment, you can download the CloudFormation file here and select Preserve successfully provisioned resources under Stack failure options while deploying. This will allow you to troubleshoot the stack deployment.
- Go to the Outputs pane of the main CloudFormation stack. Save the DashboardsProxyURL, OpenSearchInitRoleARN, and PipelineRole values in a text editor to refer to later.
Figure 7: The stacks in the CREATE_COMPLETE state with the outputs panel shown
- Open the DashboardsProxyURL value in a new tab.
Note: Because the proxy relies on a self-signed certificate, you will get an insecure certificate warning. You can safely ignore this warning and proceed. For a production workload, you should issue a trusted private certificate from your internal public key infrastructure or use AWS Private Certificate Authority.
- You will be presented with the Amazon Cognito sign-in page. Use
administratoras the username. - Access Secrets Manager to find the password. Select the secret that was created as part of the stack.
Figure 8: The Cognito password in Secrets Manager
- Choose Retrieve secret value to get the password.
Figure 9: Retrieve the secret value
- After signing in, you will be prompted to change your password and will be redirected to the OpenSearch dashboard.
- If you see a pop-up that states Start by adding your own data, select Explore on my own. On the next page, Introducing new OpenSearch Dashboards look & feel, choose Dismiss.
- If you see a pop-up that states Select your tenant, select Global, and then choose Confirm.
Figure 10: Select and confirm your tenant


To initialize the OpenSearch cluster:
- Choose the menu icon (three stacked horizontal lines) on the top left and select Security under the Management section.

Figure 11: Navigating to the Security page in the OpenSearch console
- Select Roles. On the Roles page, search for the
all_accessrole and select it. - Select Mapped users, and then select Manage mapping.
- On the Map user screen, choose Add another backend role. Paste the value for the OpenSearchInitRoleARN from the list of CloudFormation outputs. Choose Map.
Figure 12: Mapping the role on the Security page in the OpenSearch console
- Leave this tab open and return to the AWS Management console. Go to the AWS Lambda console and select the function named xxxxxx-OS_INIT.
- In the function screen, choose Test, and then Create new test event.
Figure 13: Creating the test event in the Lambda console
- Choose Invoke. The function should run for about 30 seconds. The execution results should show the component templates that have been created. This Lambda function creates the component and index templates to ingest Open Cybersecurity Framework (OCSF) formatted data, a set of indices and aliases that correspond with the OCSF classes generated by Security Lake, and a rollover policy that will rollover the index daily or if it becomes larger than 40 GB.
Figure 14: Invoking the Lambda function in the Lambda console


To set up the pipeline
- Return to the Map user page on the OpenSearch console.
- Choose Add another backend role. Paste the value of the PipelineRole from the CloudFormation template output. Choose This will allow the OpenSearch Ingestion to write to the cluster.
Figure 15: Mapping the OpenSearch Ingestion role
- Access the Amazon S3 console in the Log Archive account where Security Lake is hosted.
- Select the Security Lake bucket in your roll-up Region. It should look like
aws-security-data-lake-region-xxxxxxxxxx. - Choose Permissions, then Edit under Bucket policy.
- Add this policy to the end of the existing bucket policy. Replace the
Principalwith the ARN of thePipelineRoleand the name of your Security Lake bucket in theResourcesection.
Figure 16: The modified S3 bucket access policy
- Choose Save changes.


To upload the index patterns and dashboards
- Download the
Security-lake-objects.ndjsonfile by right-clicking on this link and selecting Save link as. - Access the Dashboards Management page through the navigation menu.
- Choose Saved objects in the navigation pane.
- On the Saved Objects page, choose Import on the right side of the screen.
Figure 17: Import saved objects
- Choose Import and select the
Security-lake-objects.ndjsonfile that you downloaded previously. - Leave Create new objects with unique IDs selected and choose Import.
- You can now view the ingested logs on the Discover page and visualizations on the Dashboards page, which you can find on the navigation bar.
Figure 18: The Discover page displaying ingested logs


Clean up
To avoid unwanted charges, delete the main CloudFormation template, named os-stack-<day>-<month> (not the nested stacks).
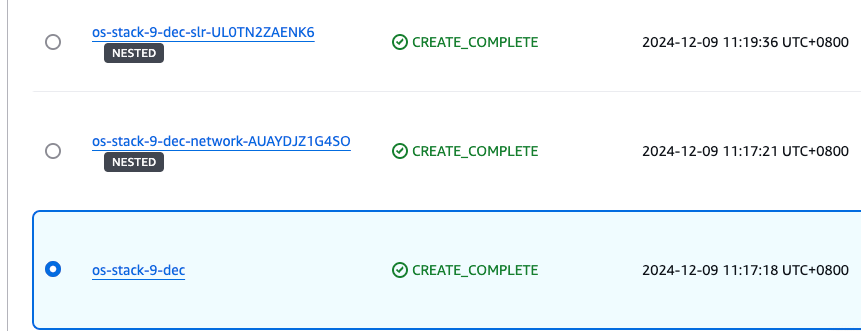
Figure 19: Select the main stack in the CloudFormation console
Modify the Security Lake bucket policy in the logging account to remove the section you added that trusted the PipelineRole. Be careful not to modify the rest of the policy because it could impact the functioning of Security Lake and other subscribers.
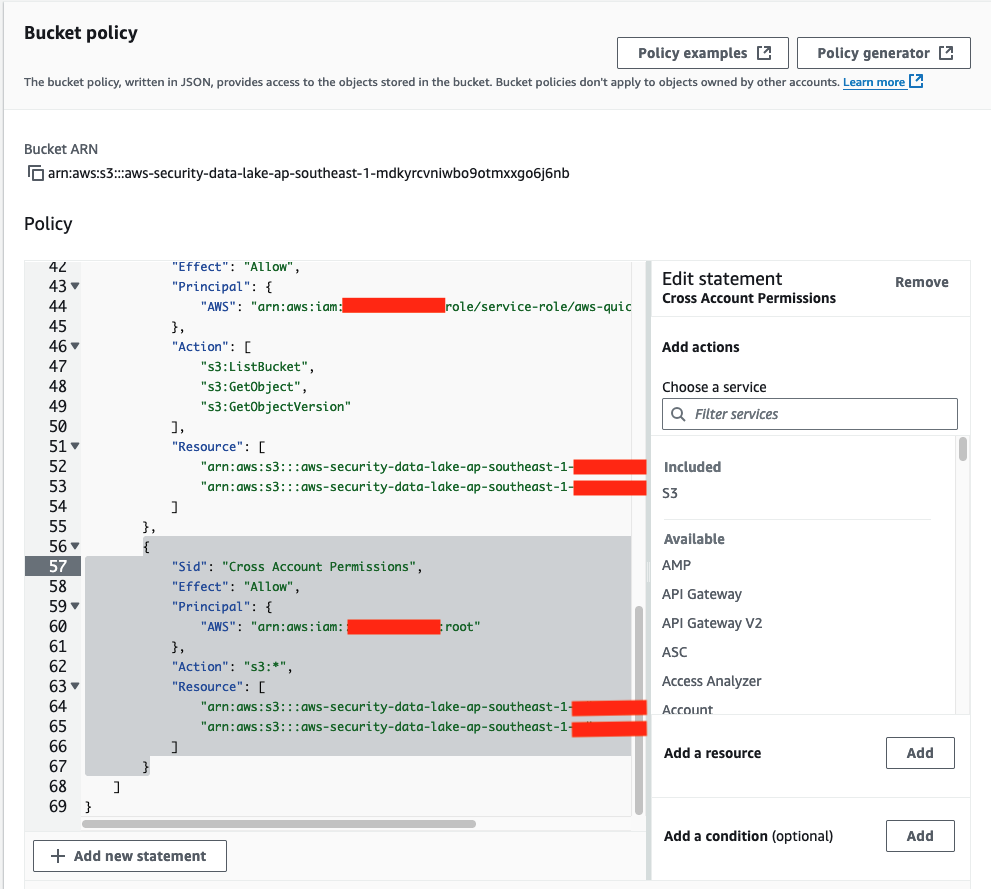
Figure 20: The S3 bucket policy with the relevant sections that needed to be deleted
Conclusion
In this post, you learned how to plan an OpenSearch deployment with Amazon OpenSearch Service to ingest logs from Amazon Security Lake. With this solution, you’re able to aggregate and manage logs with Security Lake and visualize and monitor those logs with OpenSearch Service. After deployment, monitor the OpenSearch Service metrics to determine if you need to scale this up or out for improved performance. In part 2, I will show you how to set up the Security Analytics detector to generate alerts to security findings in near-real time.
If you have feedback about this post, submit comments in the Comments section below. If you have questions about this post, contact AWS Support.