Post Syndicated from Severin Gassauer-Fleissner original https://aws.amazon.com/blogs/architecture/financial-crime-discovery-using-amazon-eks-and-graph-databases/
Discovering and solving financial crimes has become a challenge due to an increasing amount of financial data. While storing transactional payment data in a structured table format is useful for searching, filtering, and calculations, it is not always an ideal way to represent transactional data. For example, determining if there is a suspicious financial relationship between entity A and entity B is difficult to visualize in a table. Using tables, we would have to do SQL joins for every possible transaction from entity A to every possible subsequent transaction. We would then have to iterate this process until we found a relationship to entity B. Moreover, certain queries are challenging to run on a relational database management system (RDBMS). For example, it can be quite time consuming to discover which account received a minimum amount of $10,000,000 from other accounts.
Graph databases such as Amazon Neptune can be helpful with performing queries, because they can traverse the data and perform calculations simultaneously. Graphs enable us to represent transactions and parties over a multi-connected network, and discover patterns and chains of connections. It is common to use them in anti-money laundering (AML) applications, as they can help find patterns of suspicious transactions.
We needed a solution that could scale and process millions of transactions, by effectively using high memory and CPU configurations to perform complex queries quickly. As part of our customer demonstration to show how graph databases can help discover financial crimes, we also sourced a large dataset on which to test the solution. We used a graph database, Amazon Elastic Kubernetes Service (EKS), and Amazon Neptune, to search for suspicious financial chains across large amounts of transactional data in minutes.
Overview of our conceptual financial crime discovery solution

Figure 1. Workflow for financial crime discovery
We first needed to find a rules engine that could perform transaction inferencing and reasoning. It had to be able to process various rules on our data, be efficient, and able to scale. Next, we needed a straightforward way to ingest data into the solution. Once we had the data available, we needed to initiate a task to begin our inference job. Finally, we needed a location to store the result for further analysis and persistence, see Figure 1.
Using the AWS Cloud to scale up a graph database
We used multiple AWS services to create a fully automated end-to-end batch-based transaction process, shown in Figure 2. We used RDFox, which is an AWS Marketplace product, created by Oxford Semantic Technologies. RDFox is a high-performance in-memory graph database and semantic reasoner. To orchestrate RDFox, we used Amazon EKS Autoscaler to spin up a cluster to instantiate the RDFox container. Amazon EKS can spin up multiple containers for difference inference jobs and recycle the resources when the job finishes. We also used Amazon Neptune, an Amazon managed distributed graph database that can store up to 64 TiB of the results for diagnosis and long-term retention.
The data is stored in Amazon S3 buckets, which provide a streamlined way to feed a large dataset for processing.
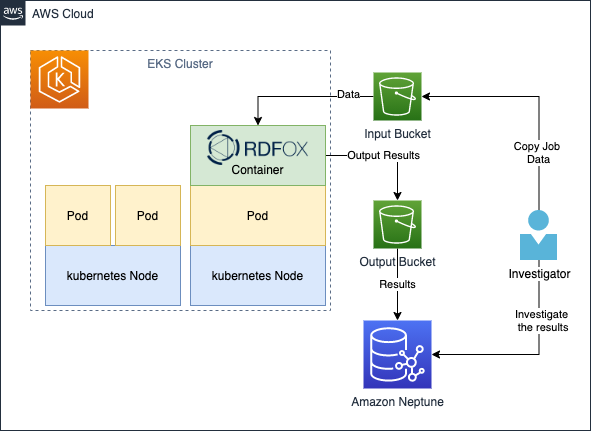
Figure 2. Architecture diagram for financial crime discovery
Financial crimes rules
The power of graphs can help discover financial crimes that are reflected in relationships and monetary transactions. To demonstrate this, we will write two rules to detect two scenarios:
- Given two suspicious parties X and Y, find out if there is a transactional relationship between them, and if so, provide the chain that connects them. This is a common scenario that financial institutions must detect.
- Given a chain identifying suspicious behavior, find out if the minimum transaction amount that reached the beneficiary exceeds a threshold of Z dollars.
Generating data
To generate data for testing, we used a synthetic data generator written in Python (see GitHub repo in References). The generator built two sets of graph artifacts – parties and transactions. Every transaction is being paired with two random parties, and this iterative process creates a network of connected transactions and parties.
We created a dataset with a small percentage (0.01%) of parties tagged as “Suspicious Party,” to simulate the preceding business scenario. Note that those parties will have transactions going both in and out. In some cases, this will collide with other suspicious parties and establish a chain. This method enables us to get simulated data without engineering the suspicious chains.
The test dataset used with this solution comprises 1M transactions and thousands of parties.
For more information on generating data, see GitHub: Transaction Chains Data Generator.
Walkthrough of the financial investigator workflow
Once deployed, this solution can assist investigators as follows:
- An investigator places the transactions and party data (nt triples) in a subdirectory within the input bucket. Typically, subdirectories can be named as a date or range of dates. In addition, the investigator uploads the particular rules (dlog files) and queries (rq files) that must be processed on the data.
- Once the data is ready, the investigator uploads a job spec file (simple JSON, see References section). This contains the description of what resources the job requires (CPUs and memory), along with other configurations for the job.
- Once the job spec has been uploaded to the bucket’s subdirectory, the job is automatically initiated. The Kubernetes scheduler will allocate enough resources to initiate the RDFox pod. The containers in the pod will then load, process, query results, and upload them to the output bucket.
- Once the data reaches the output bucket, an AWS Lambda function is initiated. This invokes the Amazon Neptune Bulk Loader, which asynchronously loads the results to the Neptune cluster in a parallelized manner.
- Once the load completes, the investigator gets an email notification that the job has been completed, and the results are ready for view.
Additionally:
- The investigator can upload multiple rules and queries, they will all be processed automatically.
- The investigator can launch multiple jobs with different/same data, and with different rules and queries at the same time.
- All jobs outputs are saved in a unique job ID subdirectory in the output bucket.
To create the solution in your account, follow the instruction here: GitHub repo
Prerequisites
For this walkthrough, you should have the following prerequisites:
- An AWS account
- RDFox license, request a free trial
- Terraform
- Familiarity with Kubernetes, Amazon Neptune, and SPARQL queries
Rules
We create two materialization rule sets to fetch the two scenarios described.
1. detect-suspicious-parties-pair.dlog
The purpose of this first set of rules is to detect chains that might exist between two suspicious parties. The idea of these chains is to represent all the possible relationships that contain monetary transfers between a suspicious originator and the beneficiary. This will include non-suspicious parties in the chain. The rule tags these chains with the “SuspiciousChain” flag.
2. detect-chains-exceed-100-dollars.dlog
This set of rules is designed to tag the chains identified by the first set of rules. It also contains a minimum amount of $100 passed to the beneficiary. We can change the amount to check for different compliance requirements. We tag those chains as “HighValueChain.”
Run the job and check your results
Now we can run our job, with the given data, rules, and two additional queries (to extract “SuspiciousChain” and “HighValueChain” respectively). The result of the queries will be loaded to Amazon Neptune automatically for persistent storage, and is made durably available for further analysis.
Let’s look at the results. The following query can be initiated against RDFox console or Amazon Neptune.
Visualization
PREFIX : <http://oxfordsemantic.tech/transactions/entities#>
PREFIX prop: <http://oxfordsemantic.tech/transactions/properties#>
PREFIX type: <http://oxfordsemantic.tech/transactions/classes#>
PREFIX tt: <http://oxfordsemantic.tech/transactions/tupletables#>
SELECT ?S ?P ?O WHERE {
?S a type:SuspiciousChain .
?S ?P ?O .
}

Figure 3. Visualizing suspicious chains
Whoa! Figure 3 might look complicated at first, but this is because we are visualizing every pair of suspicious parties that have a relationship with another suspicious party. Let’s filter the query to look only at a single particular chain, which exceeds a minimum of $100 to the beneficiary. The following query can be executed against RDFox console or Amazon Neptune.
PREFIX : <http://oxfordsemantic.tech/transactions/entities#>
PREFIX prop: <http://oxfordsemantic.tech/transactions/properties#>
PREFIX type: <http://oxfordsemantic.tech/transactions/classes#>
PREFIX tt: <http://oxfordsemantic.tech/transactions/tupletables#>
SELECT * WHERE {
?S ?P ?O
{
SELECT ?S WHERE {
?S a type:HighValueChain .
} Limit 1
}
}

Figure 4. Visualizing a particular chain
In Figure 4, we can see that Allison, the suspicious originator of the chain, has sent a transaction to Troy. Troy, who is not suspicious, sent the transaction to Karina. Karina is the suspicious beneficiary. We can also see additional information, such as the transaction amount that Karina received, and the chain length of 2 in this case.
In our testing, we were able to scale up to 500M transactions with 50M parties and process this in less than two hours! And we performed this at a significant lower cost when compared to running constant, fixed similar hardware.
Cleaning up
Follow Terraform cleanup instructions.
Conclusion
Graph databases are a powerful tool to apply reasoning on complex financial relationships. The combination of Amazon Web Services and the RDFox engine results in an automated, scalable, and cost-effective, thanks to the dynamic Kubernetes Cluster Autoscaler. Customers can use this solution and provide their investigators with a tool they can experiment and reason on financial transactions. This solution simplifies the process, and makes it easier to try different rules and queries on complex large data collections.
This blog post is written with Oxford Semantic.
![]()
References
Solution:
- Solution GitHub repository
- Data generator repository
- Low-level design documents and architecture
- Examples for submitting a job
Further reading
RDFox:
- Try RDFox for free
- Learn more about RDFox features
- Get RDFox on the AWS Marketplace
- An introduction to reasoning in RDFox
- The basics of SPARQL queries in RDFox
- Knowledge graphs versus relational databases
Other: