Post Syndicated from Praveen Panati original https://aws.amazon.com/blogs/big-data/use-amazon-codeguru-profiler-to-monitor-and-optimize-performance-in-amazon-kinesis-data-analytics-applications-for-apache-flink/
Amazon Kinesis Data Analytics makes it easy to transform and analyze streaming data and gain actionable insights in real time with Apache Flink. Apache Flink is an open-source framework and engine for processing data streams in real time. Kinesis Data Analytics reduces the complexity of building and managing Apache Flink applications using open-source libraries and integrating with other AWS services.
Kinesis Data Analytics is a fully managed service that takes care of everything required to run real-time streaming applications continuously and scale automatically to match the volume and throughput of your incoming data.
As you start building and deploying business-critical, highly scalable, real-time streaming applications, it’s important that you continuously monitor applications for health and performance, and optimize the application to meet the demands of your business.
With Amazon CodeGuru Profiler, developers and operations teams can monitor the following:
- Applications hosted on premises or Amazon Elastic Compute Cloud (Amazon EC2)
- Containerized applications running on Amazon Elastic Container Service (Amazon ECS) or Amazon Elastic Kubernetes Service (Amazon EKS)
- Serverless applications running on AWS Fargate or AWS Lambda
- Apache Flink applications running on Kinesis Data Analytics
You can use CodeGuru Profiler to analyze the application’s performance characteristics and bottlenecks in the application code by capturing metrics such as CPU and memory utilization. You can use these metrics and insights to identify the most expensive lines of code; optimize for performance; improve stability, latency, and throughput; and reduce operational cost.
In this post, we discuss some of the challenges of running streaming applications and how you can use Amazon Kinesis Data Analytics for Apache Flink to build reliable, scalable, and highly available streaming applications. We also demonstrate how to set up and use CodeGuru Profiler to monitor an application’s health and capture important metrics to optimize the performance of Kinesis Data Analytics for Apache Flink applications.
Challenges
Streaming applications are particularly complex in nature. The data is continuously generated from a variety of sources with varying amounts of throughput. It’s critical that the application infrastructure scales up and down according to these varying demands without becoming overloaded, and not run into operational issues that might result in downtime.
As such, it’s crucial to constantly monitor the application for health, and identify and troubleshoot the bottlenecks in the application configuration and application code to optimize the application and the underlying infrastructure to meet the demands while also reducing the operational costs.
What Kinesis Data Analytics for Apache Flink and CodeGuru Profiler do for you
With Kinesis Data Analytics for Apache Flink, you can use Java, Scala, and Python to process and analyze real-time streaming data using open-source libraries based on Apache Flink. Kinesis Data Analytics provides the underlying infrastructure for your Apache Flink applications. It handles core capabilities such as provisioning compute resources, parallel computation, automatic scaling, and application backups (implemented as checkpoints and snapshots) to rapidly create, test, deploy, and scale real-time data streaming applications using best practices. This allows developers to focus more on application development and less on Apache Flink infrastructure management.
With CodeGuru Profiler, you can quickly and easily monitor Kinesis Data Analytics for Apache Flink applications to:
- Identify and troubleshoot CPU and memory issues using CPU and memory (heap summary) utilization metrics
- Identify bottlenecks and the application’s most expensive lines of code
- Optimize application performance (latency, throughput) and reduce infrastructure and operational costs
Solution overview
In this post, we use a sample Java application deployed as a Kinesis Data Analytics application for Apache Flink, which consumes the records from Amazon Kinesis Data Streams and uses Apache Flink operators to generate real-time actionable insights. We use this sample to understand and demonstrate how to integrate with CodeGuru Profiler to monitor the health and performance of your Kinesis Data Analytics applications.
The following diagram shows the solution components.

At a high level, the solution covers the following steps:
- Set up, configure, and deploy a sample Apache Flink Java application on Kinesis Data Analytics.
- Set up CodeGuru Profiler.
- Integrate the sample Apache Flink Java application with CodeGuru Profiler.
- Use CodeGuru Profiler to analyze, monitor, and optimize application performance.
Set up a sample Apache Flink Java application on Kinesis Data Analytics
Follow the instructions in the GitHub repo and deploy the sample application that includes source code as well as AWS CloudFormation templates to deploy the Kinesis Data Analytics for Apache Flink application.
For this post, I deploy the stack in the us-east-1 Region.
After you deploy the sample application, you can test the application by running the following commands, and providing the correct parameters for the Kinesis data stream and Region.
The Java application has already been downloaded to an EC2 instance that has been provisioned by AWS CloudFormation; you just need to connect to the instance and run the JAR file to start ingesting events into the stream.
Set up CodeGuru Profiler
Set up and configure CodeGuru Profiler using the AWS Management Console. For instructions, see Set up in the CodeGuru Profiler console.
For this post, I create a profiling group called flinkappdemo in the us-east-1 Region.
In the next section, I demonstrate how to integrate the sample Kinesis Data Analytics application with the profiling group.
Integrate the sample Apache Flink Java application with CodeGuru Profiler
Download the source code that you deployed earlier and complete the following steps to integrate CodeGuru Profiler to the Java application:
- Include the CodeGuru Profiler agent in your application by adding the following dependencies to your
pom.xmlfile: - Add the CodeGuru Profiler agent configuration code to the Apache Flink Operators (functions), as shown in the following code.
Because multiple operators and operator instances can run on the same TaskManager JVM, and because one instance of the profiler can capture all events in a JVM, you just need to enable the profiler on an operator that is guaranteed to be present on all TaskManager JVMs. For this, you can pick the operator with the highest parallelism. In addition, you could instantiate the profiler as a singleton such that there is one instance per JVM.
- Build the application using the following command:
The preceding command packages the application into a JAR file.
- Copy and replace the JAR file in the Amazon Simple Storage Service (Amazon S3) bucket that was created as part of the CloudFormation stack.

- Choose Save changes to update the application.

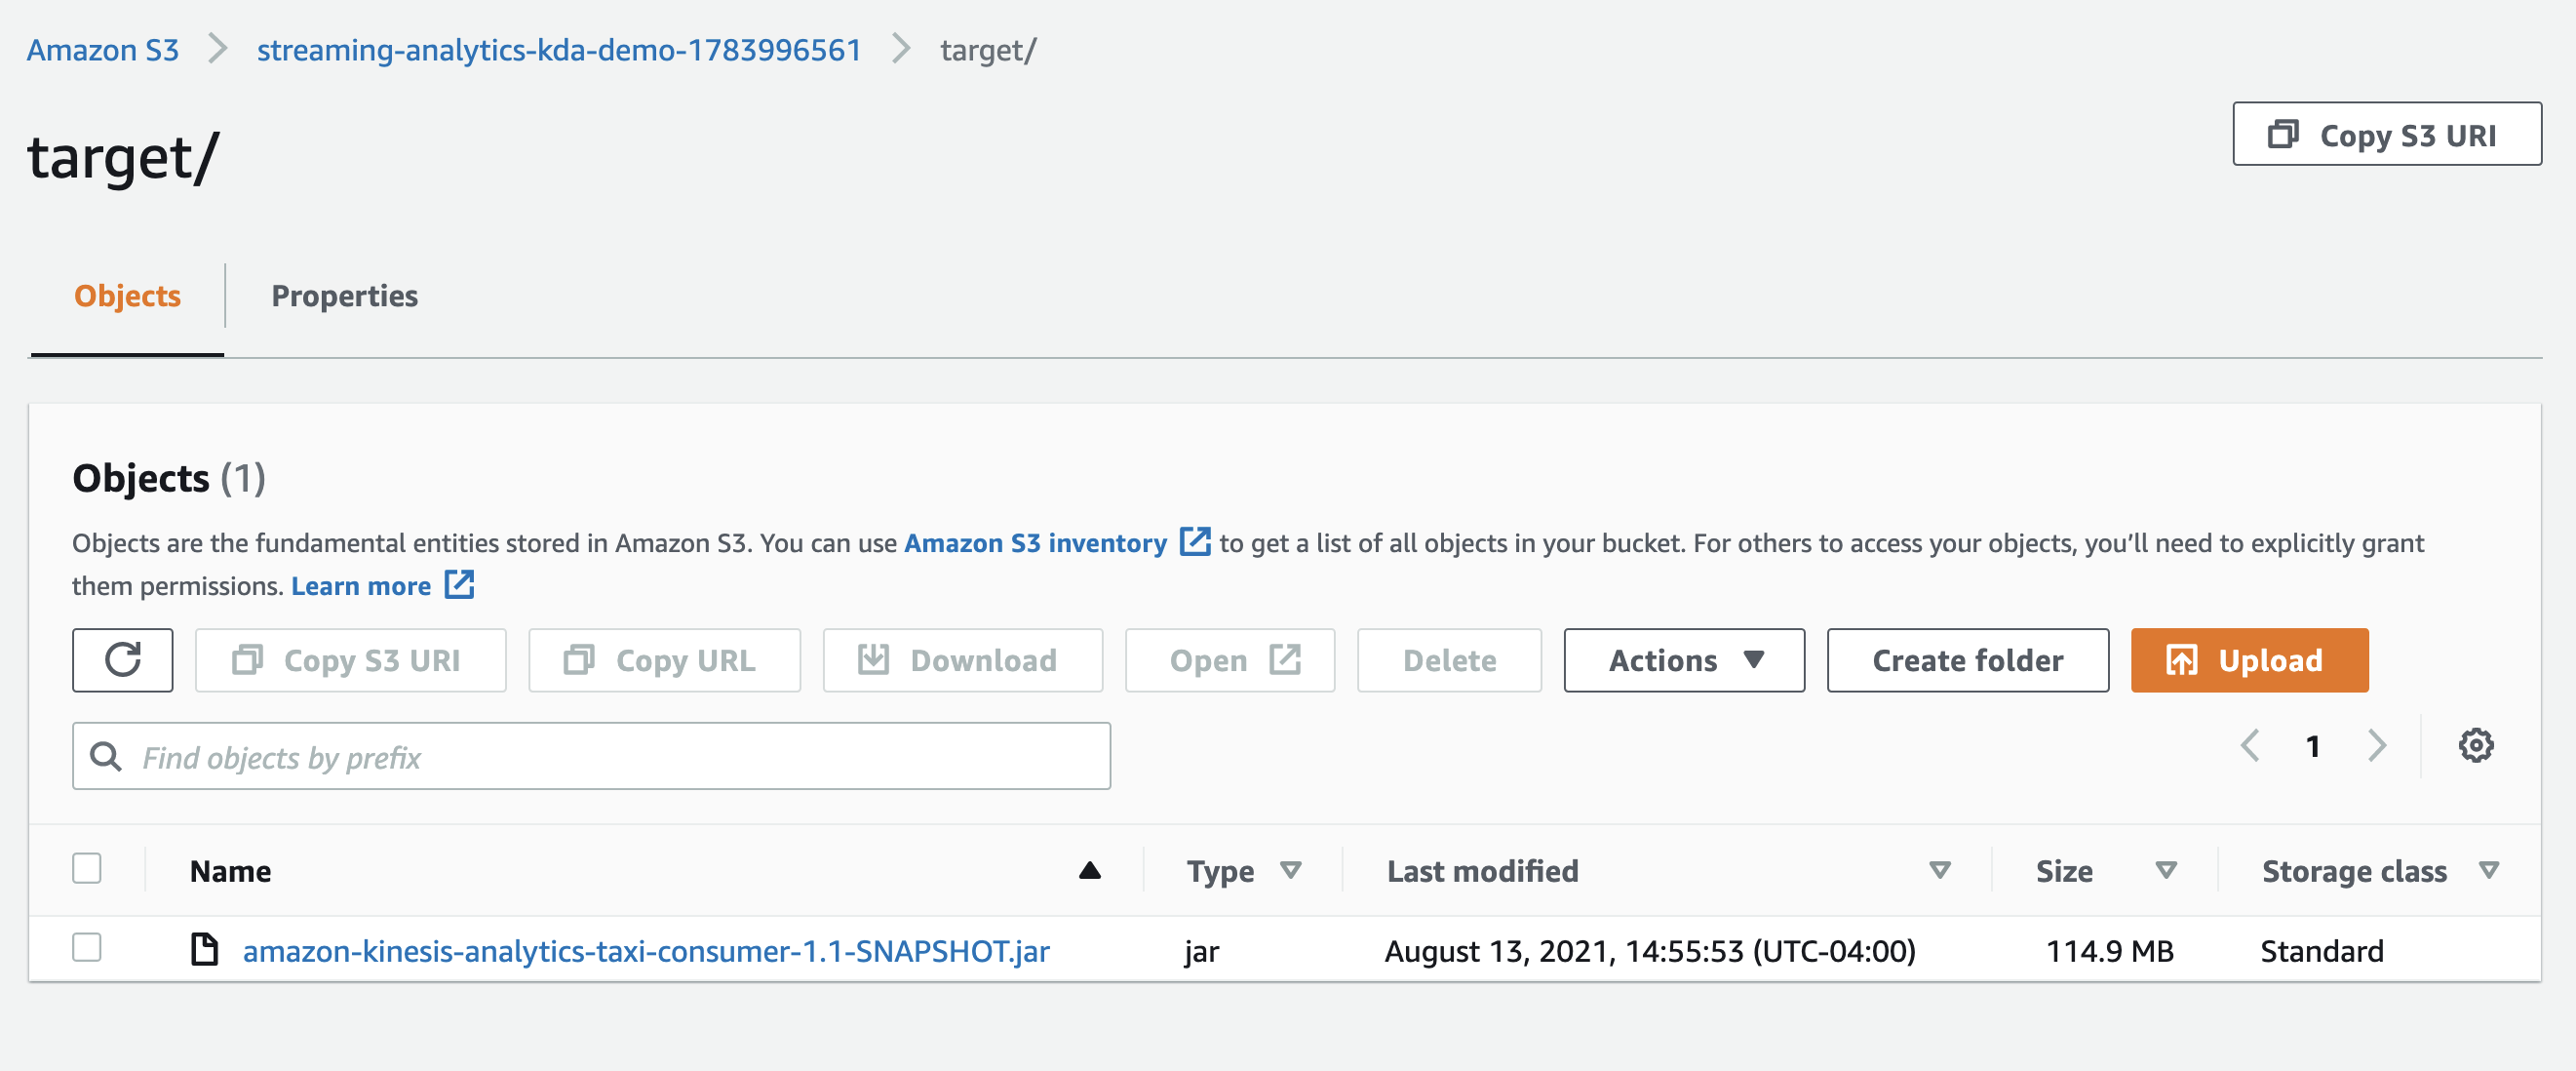
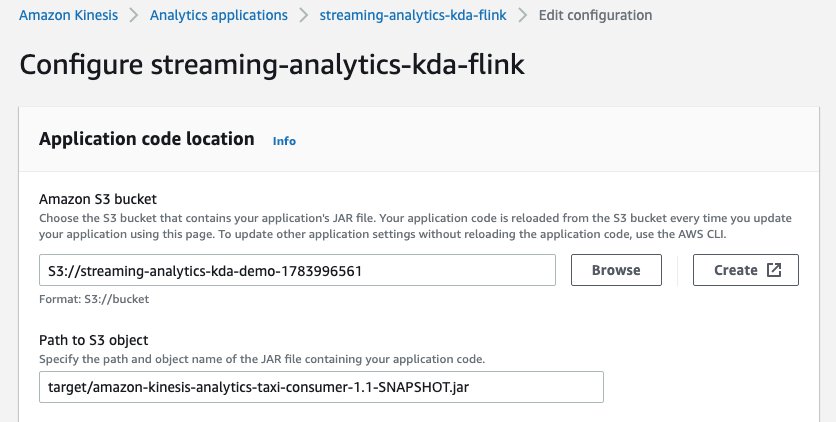
This step allows the application to use the latest JAR file that contains the CodeGuru Profiler code to start profiling the application.
Use CodeGuru Profiler to analyze, monitor, and optimize application performance
Now that the application has been configured to use CodeGuru Profiler, you can use the metrics and visualizations to explore profiling data collected from the application.
Run the following commands from when you set up your application to start ingesting data into the Kinesis data stream and enable CodeGuru Profiler to profile the application and gather metrics:
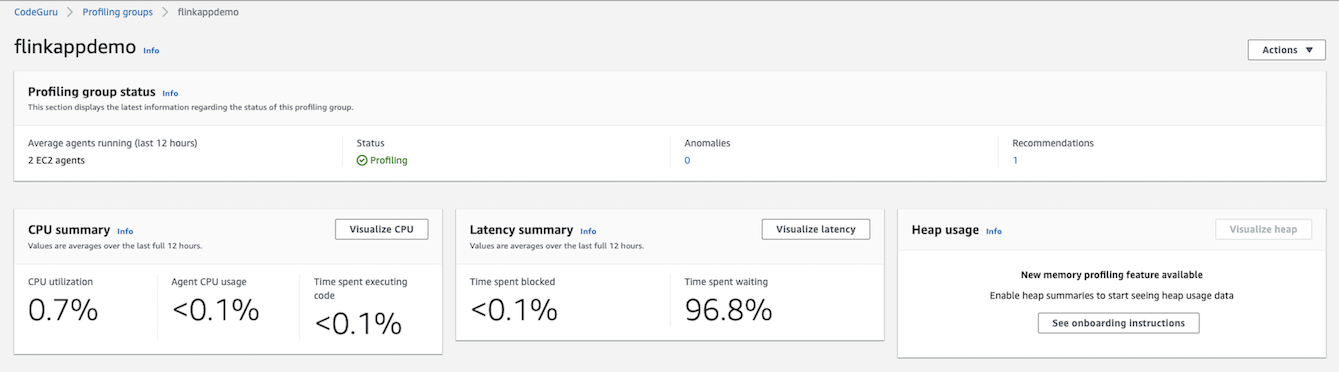
On the CodeGuru console, navigate to flinkappdemo on the Profiling groups page.
The summary page displays the status of your profiling group as well as the relevant metrics gathered while profiling the application.
In the following sections, we discuss the metrics and reports on this page in more detail.
CPU summary
Use this summary and the associated metrics CPU utilization and Time spent executing code to understand how much of the instance’s CPU resources are consumed by the application and how frequently the application’s JVM threads were in the RUNNABLE state. This helps you measure the application’s time spent running operations on the CPU so you can tune your application code and configuration.
With the CPU utilization metric, a low value (such as less than 10%) indicates your application doesn’t consume a large amount of the system CPU capacity. This means there could be an opportunity to scale in the application parallelism to reduce cost. A high value (over 90%) indicates your application is consuming a large amount of system CPU capacity. This means there is likely value in looking at your CPU profiles and recommendations for areas of optimization.
When examining the time spent running code, a high percentage (over 90%) indicates most of your application’s time is spent running operations on the CPU. A very low percentage (under 1%) indicates that most of your application was spent in other thread states (such as BLOCKED or WAITING) and there may be more value in looking at the latency visualization, which displays all non-idle thread states, instead of the CPU visualization.
For more information on understanding the CPU summary, see CPU summary.
Latency summary
Use this summary and the metrics Time spent blocked and Time spent waiting to understand what sections of the code are causing threads to block and threads that are waiting to tune your application code and configuration. For more information, see Latency summary.
The CPU summary and latency visualization can help you analyze the thread blocking and wait operations to further identify bottlenecks and tune your application’s performance and configuration.
Heap usage
Use this summary and the metrics Average heap usage and Peak heap usage to understand how much of your application’s maximum heap capacity is consumed by your application and to spot memory leaks. If the graph grows continuously over time, that could be an indication of a memory leak.
With the average heap usage metric, a high percentage (over 90%) could indicate that your application is close to running out of memory most of the time. If you wish to optimize this, the heap summary visualization shows you the object types consuming the most space on the heap. A low percentage (less than 10%) may indicate that your JVM is being provided much more memory than it actually requires and cost savings may be available by scaling in the application parallelism, although you should check the peak usage too.
Peak heap usage shows the highest percentage of memory consumed by your application seen by the CodeGuru Profiler agent. This is based on the same dataset as seen in the heap summary visualization. A high percentage (over 90%) could indicate that your application has high spikes of memory usage, especially if your average heap usage is low.
For more information on the heap summary, see Understanding the heap summary.
Anomalies and recommendation reports
CodeGuru Profiler uses machine learning to detect and alert on anomalies in your application profile and code. Use this to identify parts of the code for performance optimization and potential savings.
The issues identified during analysis are included in the recommendations report. Use this report to identify potential outages, latency, and other performance issues. For more information on how to work with anomalies and recommendations, see Working with anomalies and recommendation reports.
Visualizations
You can use visualizations associated with the preceding metrics to drill down further to identify what parts of the application configuration and application code are impacting the performance, and use these insights to improve and optimize application performance.
CodeGuru Profiler supports three types of visualizations and a heap summary to display profiling data collected from applications:
- The overview visualization explores by entry point to code
- The hotspot visualization finds low-level code where most time is spent
- You can inspect a visualization to get a focused view of named stack trace
- The heap summary displays the application’s heap usage over time
Let’s explore the profiling data collected from the preceding steps to observe and monitor application performance.
CPU utilization
The following screenshot shows the snapshot of the application’s profiling data in a flame graph visualization. This view provides a bottom-up view of the application’s profiling data, with the X-axis showing the stack profile and the Y-axis showing the stack depth. Each rectangle represents a stack frame. This visualization can help you identify specific call stacks that lead to inefficient code by looking at the top block function on CPU. This may indicate an opportunity to optimize.

Recommendation report with opportunities to optimize the application
Use the recommendation report to identify and correlate the sections of the application code that can be improved to optimize the application performance. In our example, we can improve the application code by using StringBuilder instead of String.format and by reusing the loggers rather than reinitializing them repetitively, and also by selectively applying the debug/trace logging, as recommended in the following report.


Hotspot visualization
The hotspot visualization shows a top-down view of the application’s profiling data. The functions that consume the most CPU time are at the top of the visualization and have the widest block. You can use this view to investigate functions that are computationally expensive.

Latency visualization
In this mode, you can visualize frames with different thread states, which can help you identify functions that spent a lot of time being blocked on shared resources, or waiting for I/O or sleeping. You can use this view to identify threads that are waiting or dependent on other threads and use it to improve latency on all or parts of your application.
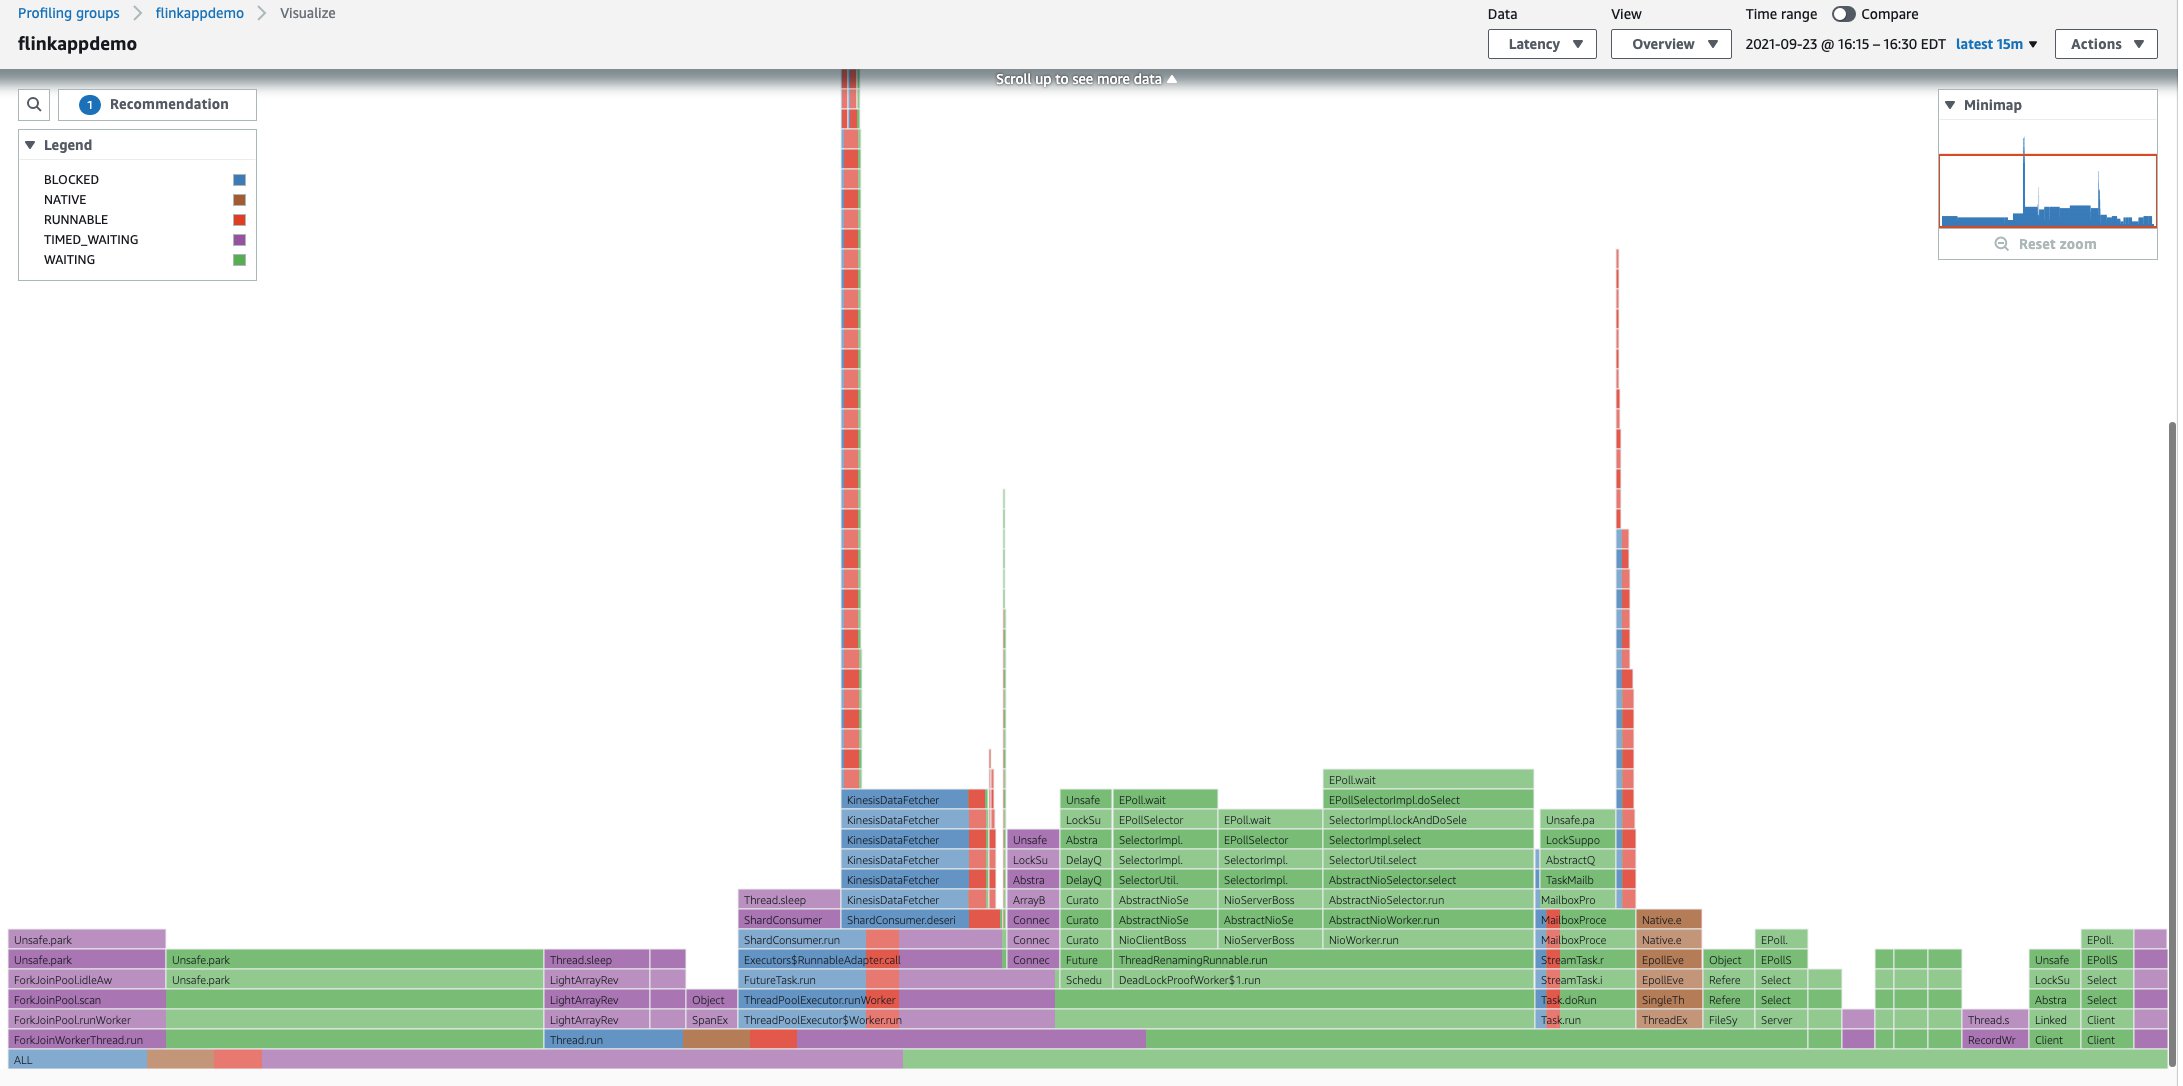
You can inspect a visualization to further analyze any frame by selecting a frame and then choosing (right-click) the frame and choosing Inspect.
Heap summary
This summary view shows how much heap space your application requires to store all objects required in memory after a garbage collection cycle. If this value continuously grows over time until it reaches total capacity, that could be an indication of a memory leak. If this value is very low compared to total capacity, you may be able to save money by reducing your system’s memory.

For more information on how to work and explore data with visualizations, refer to Working with visualizations and Exploring visualization data.
Clean up
To avoid ongoing charges, delete the resources you created from the previous steps.
- On the CodeGuru console, choose Profiling groups in the navigation pane.
- Select the
flinkappdemoprofiling group. - On the Actions meu, choose Delete profiling group.

- On the AWS CloudFormation console, choose Stacks in the navigation pane.
- Select the stack you deployed (
kinesis-analytics-taxi-consumer) and choose Delete.


Summary
This post explained how to configure, build, deploy, and monitor real-time streaming Java applications using Kinesis Data Analytics applications for Apache Flink and CodeGuru. We also explained how you can use CodeGuru Profiler to collect runtime performance data and metrics that can help you monitor application health and optimize your application performance.
For more information, see Build and run streaming applications with Apache Flink and Amazon Kinesis Data Analytics for Java Applications and the Amazon Kinesis Data Analytics Developer Guide.
Several customers are now using CodeGuru Profiler to monitor and improve application performance, and you too can start monitoring your applications by following the instructions in the product documentation. Head over to the CodeGuru console to get started today!
About the Author
 Praveen Panati is a Senior Solutions Architect at Amazon Web Services. He is passionate about cloud computing and works with AWS enterprise customers to architect, build, and scale cloud-based applications to achieve their business goals. Praveen’s area of expertise includes cloud computing, big data, streaming analytics, and software engineering.