Post Syndicated from David Hessler original https://aws.amazon.com/blogs/devops/best-practices-for-scaling-aws-cdk-adoption-within-your-organization/
Enterprises are constantly seeking ways to accelerate their journey to the cloud. Infrastructure as code (IaC) is crucial for automating and managing cloud resources efficiently. The AWS Cloud Development Kit (AWS CDK) lets you define your cloud infrastructure as code in your favorite programming language and deploy it using AWS CloudFormation. In this post, we will discuss strategies and best practices for accelerating CDK adoption within your organization. Our discussion begins after your organization has successfully completed a pilot. In this post, you will learn how to scale the lessons learned from the pilot project across your organization through platform engineering. You will learn how to reduce complexity through building reusable components, deploy with speed and safety via builder tooling, and accelerate project startup with an internal developer portal (IDP). We will conclude by discussing ways to participate in and benefit from the broader CDK community.
Before we dive in, let’s briefly discuss a new trend in technology: Platform Engineering. DevOps practices have helped IT organizations deliver software to customers more frequently and with higher quality. A recent evolution in DevOps is the introduction of platform engineering teams to build services, toolchains, and documentation to support workload teams. An important responsibility of the platform engineering team is governance of the software delivery process.
At Amazon, we have a long and storied history of leveraging platform engineering to accelerate deployments. This is why we are able to maintain 143 different compliance certifications and attestations while deploying 150 million times per year. Platform engineering increases productivity, reduces friction between ideas and implementation, and improves agility by accelerating the delivery of workloads via a secure, scalable, and reusable set of resources and components through self-service portals and developer tools. Platform Engineering is comprised of seven capabilities: Platform Architecture, Data Architecture, Platform Product Engineering, Data Engineering, Provisioning & Orchestration, Modern App Development and CI/CD. For more information on platform engineering visit the AWS Cloud Adoption Framework.
Establishing these capabilities takes several platform and workload teams working together. From an operating model standpoint, a workload team interacts with Platform Engineering in one of the three following ways (for more information, see Building a Cloud Operating Model):

Reduce Builder Complexity and Cognitive load with Reusable Components
So, how can the platform team incorporate CDK to accomplish their goals? One of the common objectives of the Platform Engineering team is to publish and curate reusable patterns called Constructs. Constructs provide a mechanism to create reusable, extensible, and common components that can be shared across multiple teams and projects.
Many customers write their own implementations for constructs to enforce security best practices such as encryption and specific AWS Identity and Access Management policies. For example, you might create a MyCompanyBucket that implements your organizations security requirements in place of the default Amazon S3 Bucket construct. This bucket configuration can be implemented and extended by multiple teams to ensure they are using components that are validated by your security and compliance teams.
For customers focused on data governance, CDK constructs can automatically add in best practices for recovery time objectives and recovery point objectives by ensuring backups and architecture meet an organization’s resilience policies. For advance customers looking to enforce data lifecycle policies, create uniform access controls, or emit required KPIs, CDK constructs can provide avenues to create safe and secure configuration by default. Applying CDK constructs to DataOps, customers can benefit from templated ETL pipelines that ensure data lineage metadata is maintained and data cleansing occurs.
Customers also build constructs for non-AWS resources. Teams can build Constructs for third-party builder tooling, observability systems, testing apparatuses and more. In this way, workload teams can codify AWS and non-AWS resources in one code base. There is a balance required when writing your own constructs between ensuring standardization and providing the freedom and flexibility of taking advantage of the growing ecosystems of CDK packages. Examples of this balance include AWS Solutions Constructs, as these are typically built upon standard constructs. Without extending standard constructs, the constructs you build will be harder for consumer to integrate with the larger CDK ecosystem since it uses standardize interfaces.
Construct Hub is a central destination for discovering and sharing cloud application design patterns and reference architectures defined for CDK, that are built and published by the AWS community. While AWS provides a public Construct Hub, enterprises can maintain their private Construct Hub inside their own AWS accounts (see construct-hub, the GitHub repository, or the CDK Workshop for more details). The primary objective in either case remains consistent: to provide shared libraries that can be readily utilized by different workload teams. This approach ensures enhanced consistency, reusability, and ultimately leads to cost reduction and faster development timelines.
One of the pitfalls customers often have with leveraging this approach is that Platform Engineering cannot keep up building reusable components to leverage the latest technology enhancements. This is where leveraging the lessons learned from a pilot really can help. A pilot team works with platform engineering to research and implement security best practices. Some customers have the platform engineering team act as approvers for new constructs in addition to authors of new constructs. In this model, a pilot team works to build construct(s) for a new technology. The platform engineers approve the new construct(s). Platform engineers ensure the pilot team meets required standards such as enforcing encryption at rest, encryption in transit, and least privilege. When approval occurs, the pilot team can publish the new construct(s) to Construct Hub. In this way, platform engineering can enable experimentation and innovation, rather than become a gatekeeper. Additionally, platform engineering teams can encourage and curate an inner-sourcing model for construct creation rather than being the sole creator of constructs.
Deploy Applications Using DevSecOps Best Practices
Application builders are most productive when their expertise is channeled towards writing code that directly addresses business challenges. While creating applications is a skill well within the grasp of many software developers, the complex task of deploying and operating these applications in line with organizational standards can be overwhelming, especially for those new to a team. This complexity often acts as a bottleneck, slowing down the experimentation process and delaying the realization of value from new application initiatives.
A solution to this challenge lies in automating the deployment pipeline and operational model. By employing thoroughly tested CDK (Cloud Development Kit) components that are shared across teams and validated through a robust CI/CD (Continuous Integration/Continuous Deployment) process, the burden on developers is significantly reduced. They no longer need to delve into the complexities of the organization’s deployment strategies, allowing them to concentrate on writing unique, innovative code. This approach not only streamlines the development process but also bridges the gap between development and operations, leading to more cohesive teams and faster, more efficient releases.
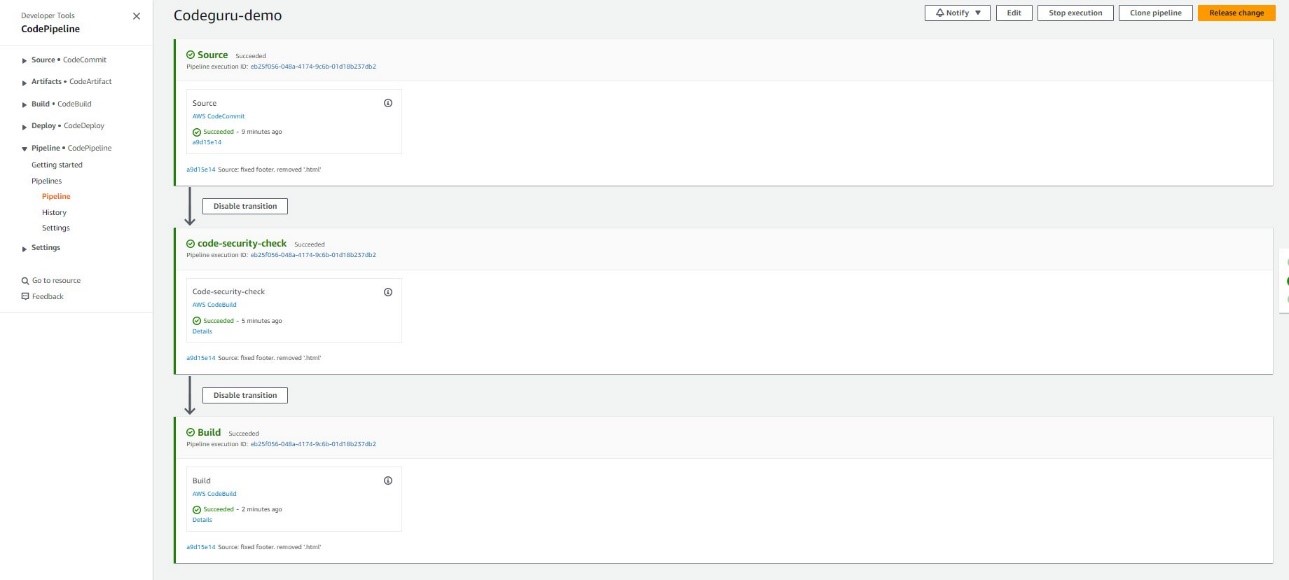
One key to high-quality software delivery is to have a proper Continuous Integration and Continuous Delivery (CI/CD) process in place. You can see CDK Pipelines: Continuous delivery for AWS CDK applications for practical examples. This high-level construct, powered by AWS CodePipeline, comes in handy when you need to go beyond test deployments with the cdk deploy command and build automated pipelines for production deployments to multiple environments in different regions and/or accounts.
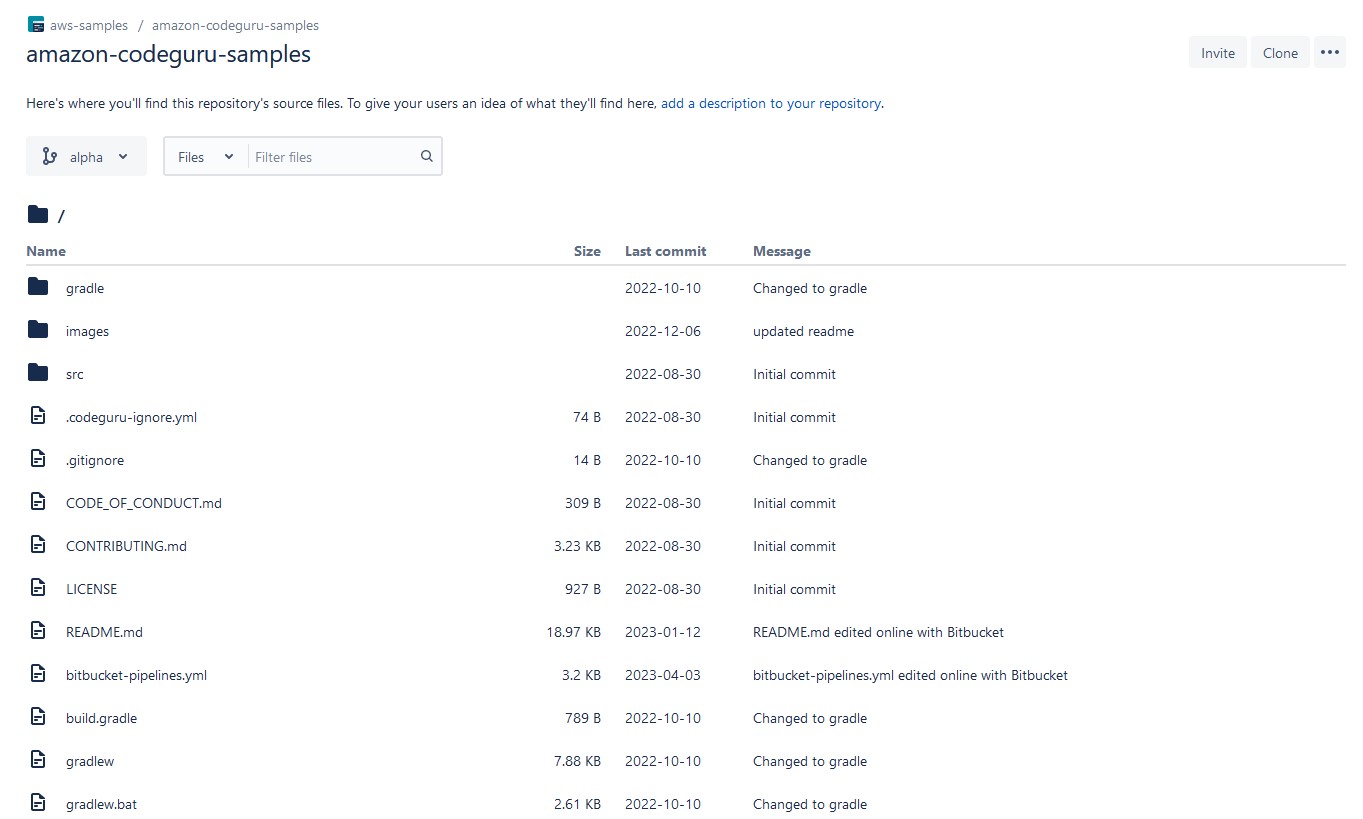
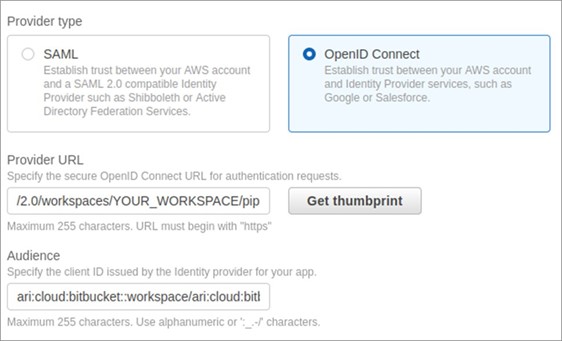
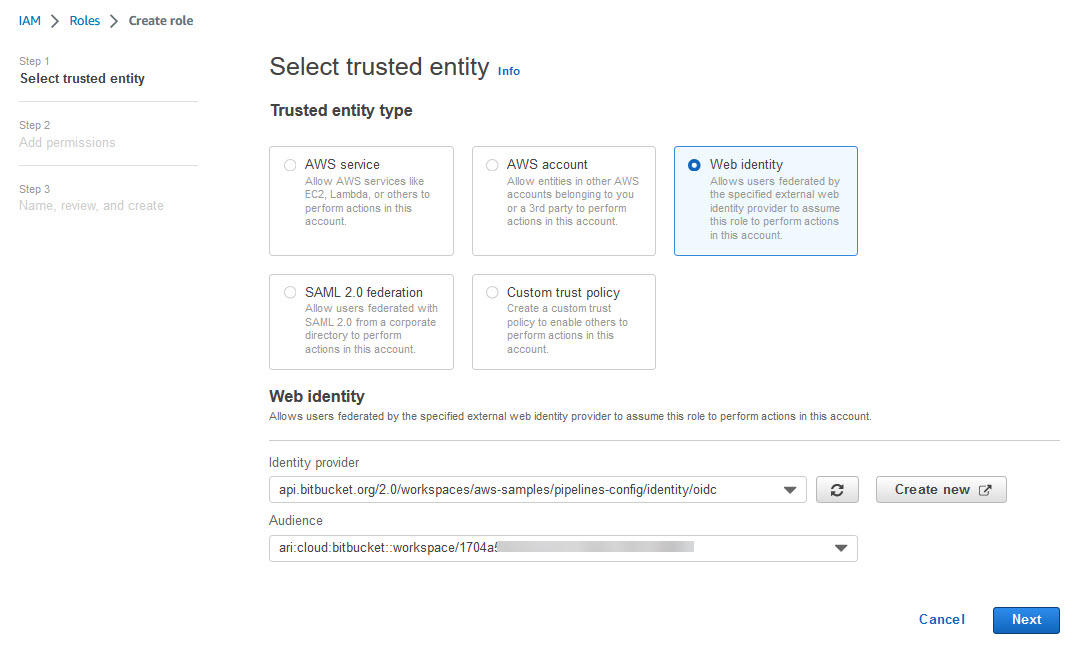
Whenever you commit your AWS CDK app’s source code into AWS CodeCommit, GitHub, GitLab, BitBucket, or Amazon CodeCatalyst source repository, AWS CDK Pipelines automatically builds, tests, and deploys a new version of the application. This pipeline automatically reconfigures itself to deploy as the resources in stacks changes or the environments being deployed to change. For GitHub Actions users, see CDK Pipelines for GitHub Workflows.
A number of teams are extending these pipelines and adding their own stages to ensure deployed code meets the organization’s quality, security, risk, compliance and cloud financial management criteria. For best practices of what automation to put inside the pipeline, see the AWS Deployment Pipeline Reference Architecture. By creating fully functional pipelines, platform engineering teams can reduce the cognitive load place on development teams and increase the developer experience. This strategy has two implementations: QuickStart pipelines and golden pipelines.
In QuickStart pipelines, these pipelines are created as a construct in your Construct Hub and treated similar to the above discussion on reusable components. While these pipelines offer simplified interfaces and a reduction in cognitive load, workload teams remain in control of the pipeline and are free to modify it. As a result, quality gates such as security or compliance tooling can be disabled by workload teams and controls inside the pipeline aren’t provable. This is suboptimal for organizations looking to reduce costs of compliance and audit. As the number of versions of the construct grows, teams can have difficulty governing which versions are used to ensure teams consume.
In golden pipelines, the pipelines are created as constructs, but deployed via a centralized team. Workload teams cannot control or modify these pipelines, so quality gates such as security and compliance tooling cannot be disabled. These controls become provable to stakeholders in security, risk and compliance such as auditors. Removing permissions from workload teams comes with costs. With golden pipelines, platform engineering teams often spend a majority of their time troubleshooting workload teams’ deployments. With so much time spent on troubleshooting, teams have little time to introduce new tooling to raise the security and quality standard, improve environment setup and organizational consistency, or improve audit evidence and enforcement.
Two mechanisms can augment these strategies. Traditional change control boards (CCB) can provide provability in situations where gathering evidence and enforcement are difficult. CCBs can benefit from CDK constructs that integrate IT Service Management (ITSM) approvals and fleet management processes into the pipeline and account creation processes. Alternatively, there is an emerging story with Software Supply Chain Level Artifacts (SLSA). These artifacts can be used as digital proof. In the Kubernetes space, we see this pattern with tools like Tekton chains where attestations associated with OCI images and Kyverno is used for to enforcement the presence of attestations (see Protect the pipe! Secure CI/CD pipelines with a policy-based approach using Tekton and Kyverno for details).
Multi-account and cross-region deployment with CDK
DevOps best practices suggest multiple stages of deployment and testing before deploying to production. On top of that, AWS recommends a dedicated account for each stage to simplify resource isolation and access control. This multi-account strategy helps organizations make best use of AWS resources and provides fine-grain controls (see Recommended OUs and accounts).
Often, you will have a designated AWS account, where all CI/CD pipelines reside. A deployment is executed by these pipelines to publish to other AWS accounts, which may correspond to development, staging, or production stages. For more information about a cross-account strategy in reference to CI/CD pipelines on AWS, see Building a Secure Cross-Account Continuous Delivery Pipeline.
Automated Governance
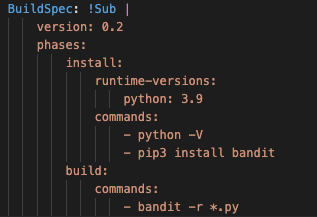
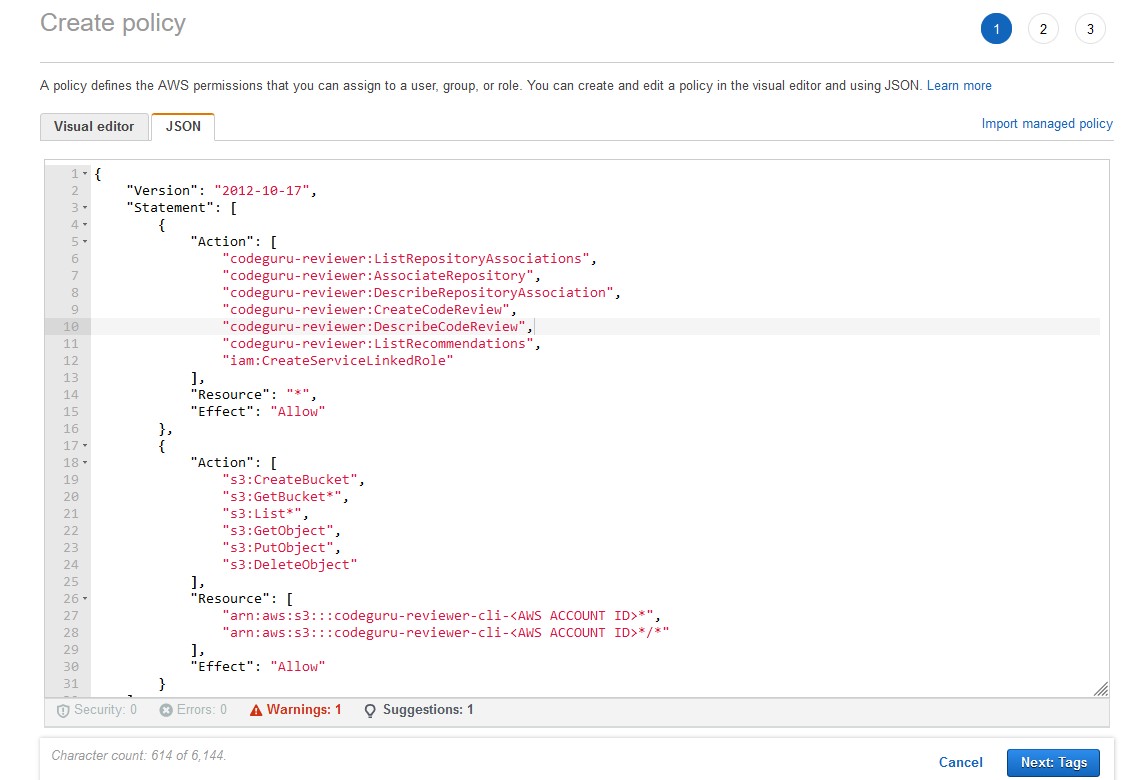
Many enterprise customers leverage CDK to enforce security controls and policies and can prevent security issues before deployment with tooling to analyze code as part of the deployment pipeline. Using the industry standard tooling of cdk-nag, many teams check applications for best practices using a combination of available rule packs. We are also seeing enterprises build their own Aspects to enforce additional requirements such as tagging requirements to manage and organize their deployed resources.
Customers can create CDK synthesized CloudFormation and add additional checkpoints with CloudFormation Guard to verify the output using policy-as-code domain-specific language (DSL) rules. Platform Engineering teams can build the rules and workload team can consume rules and run CloudFormation Guard inside the pipeline. There is an official construct that supports makes it easy to add CloudFormation Guard checks to your application.
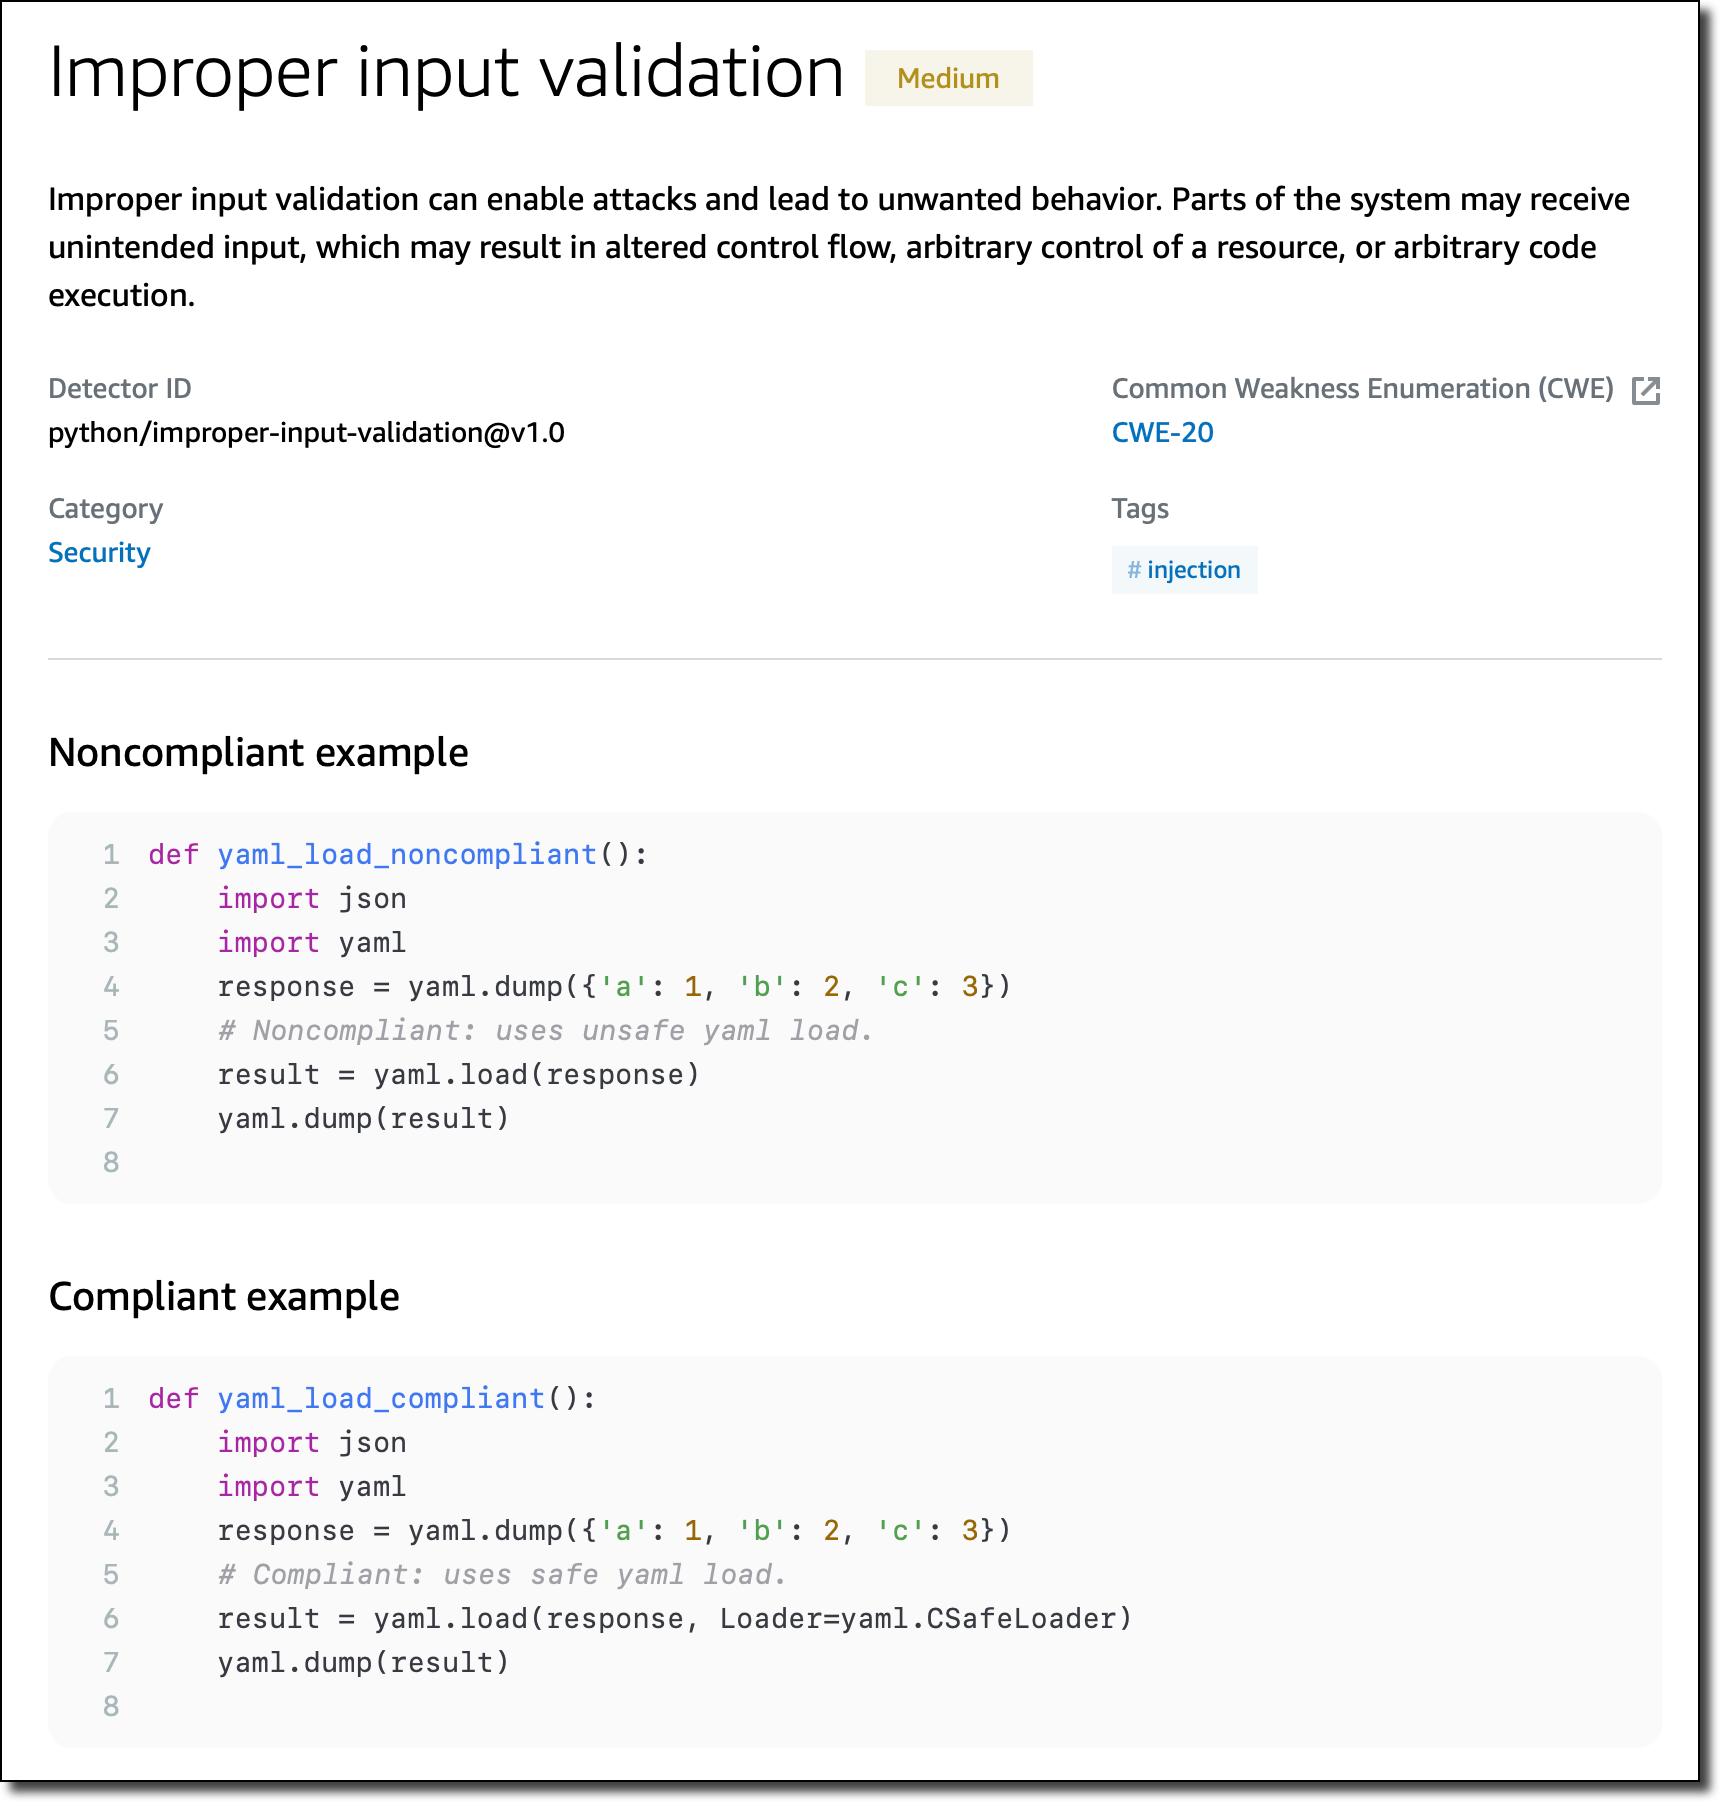
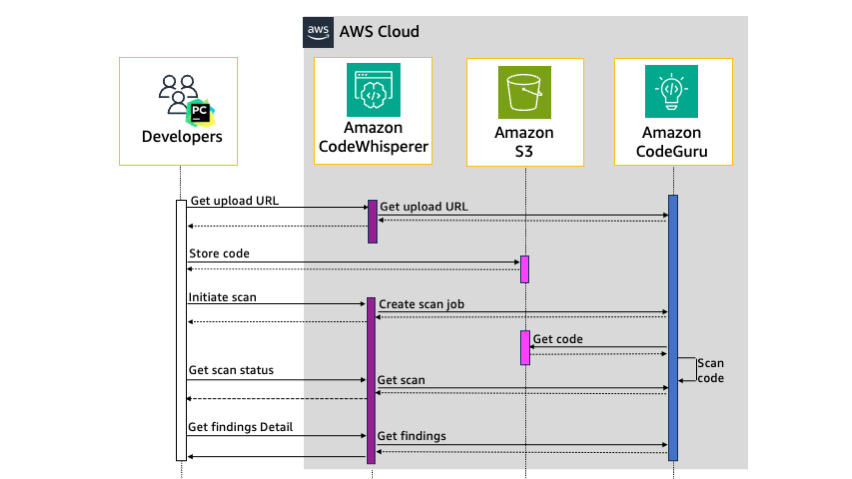
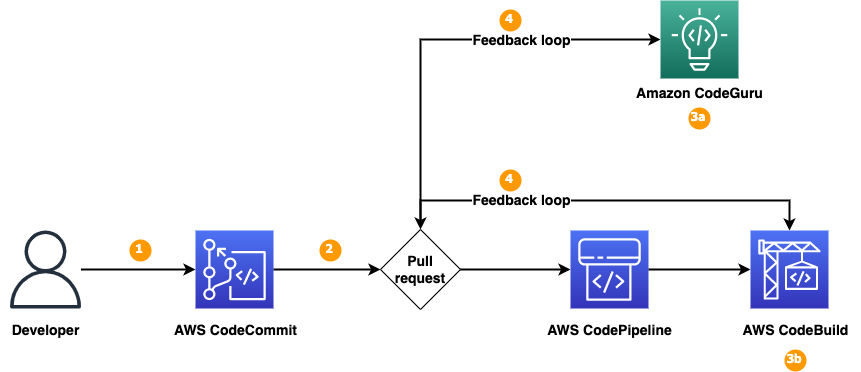
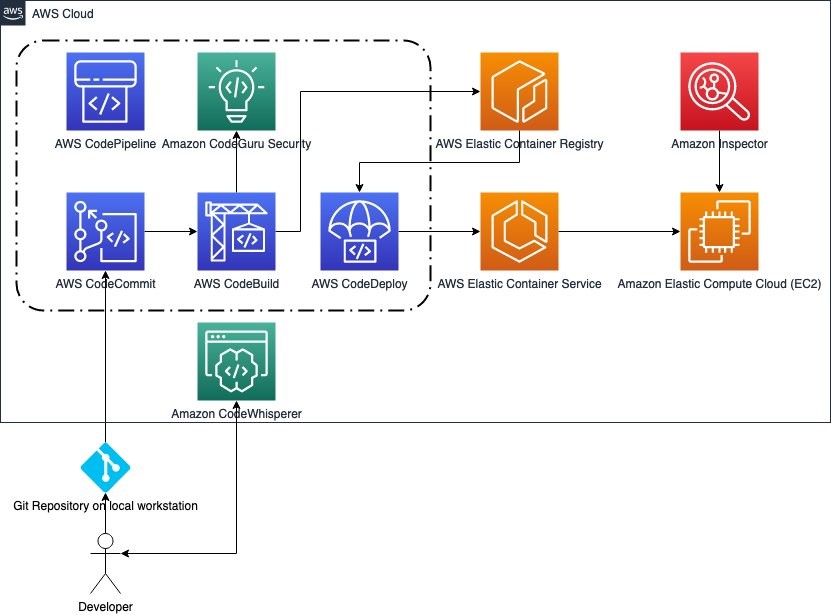
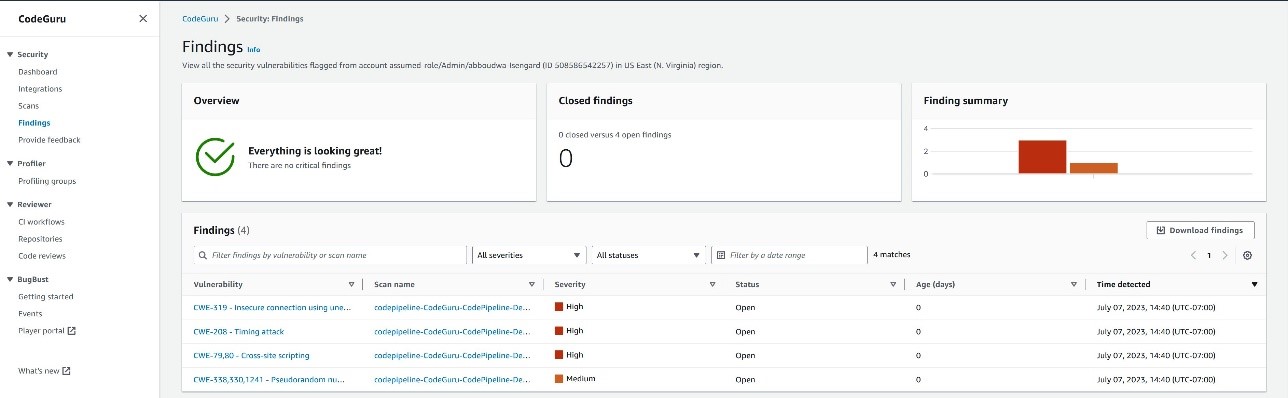
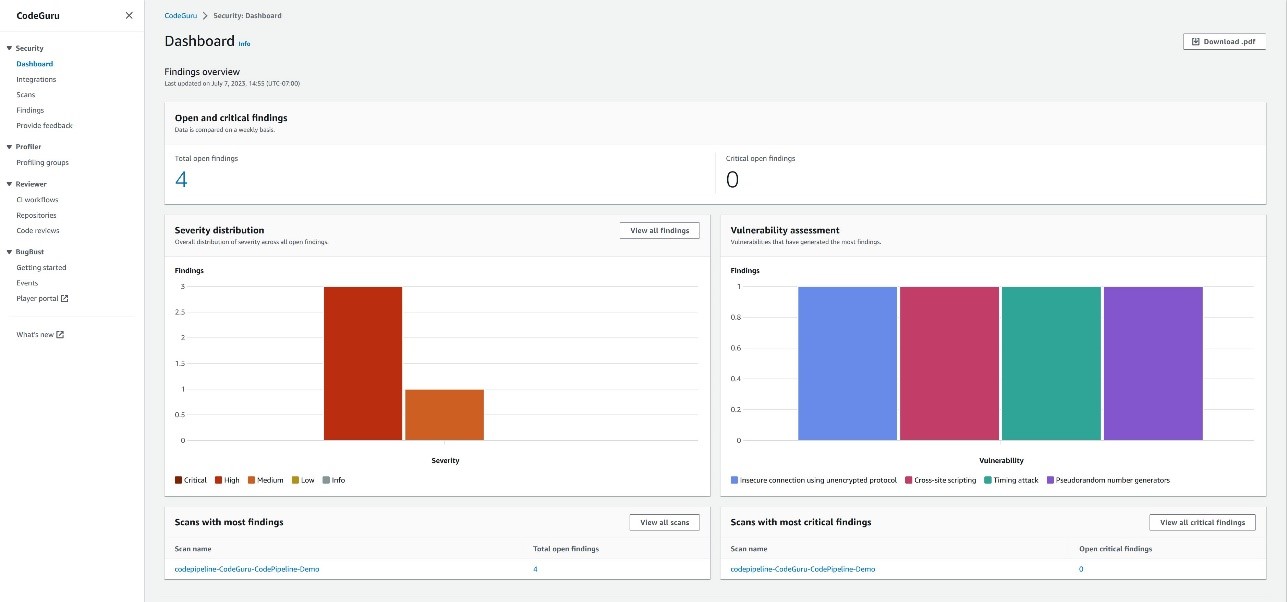
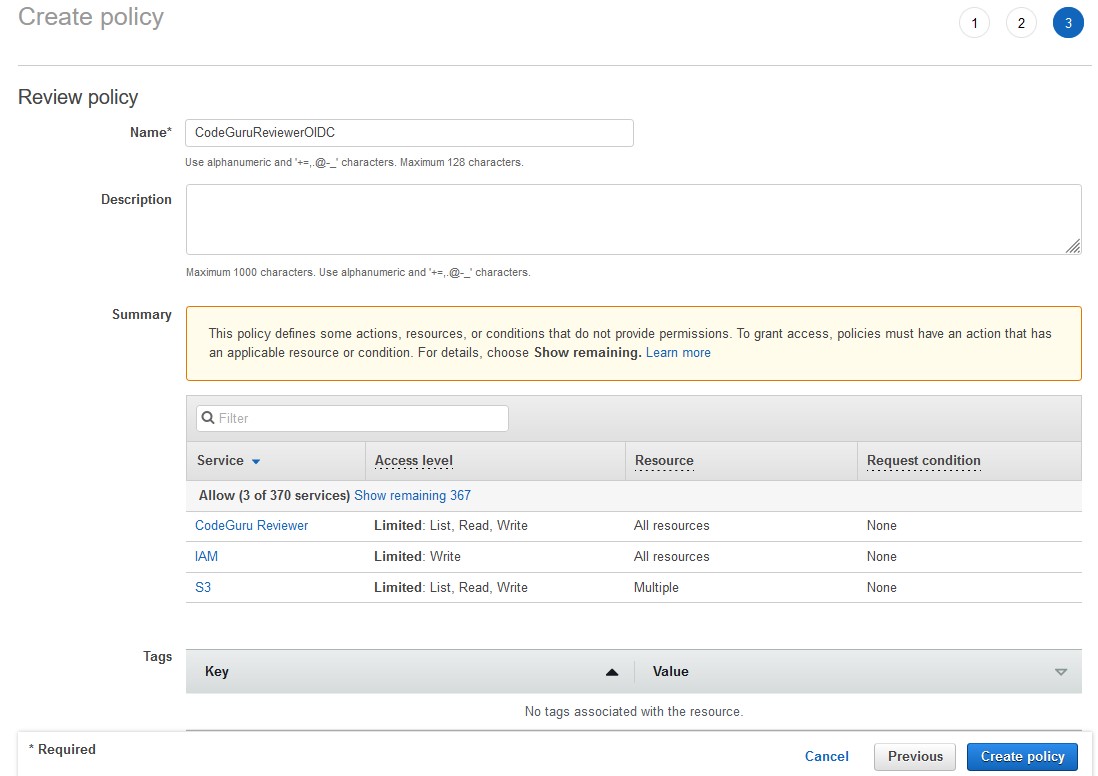
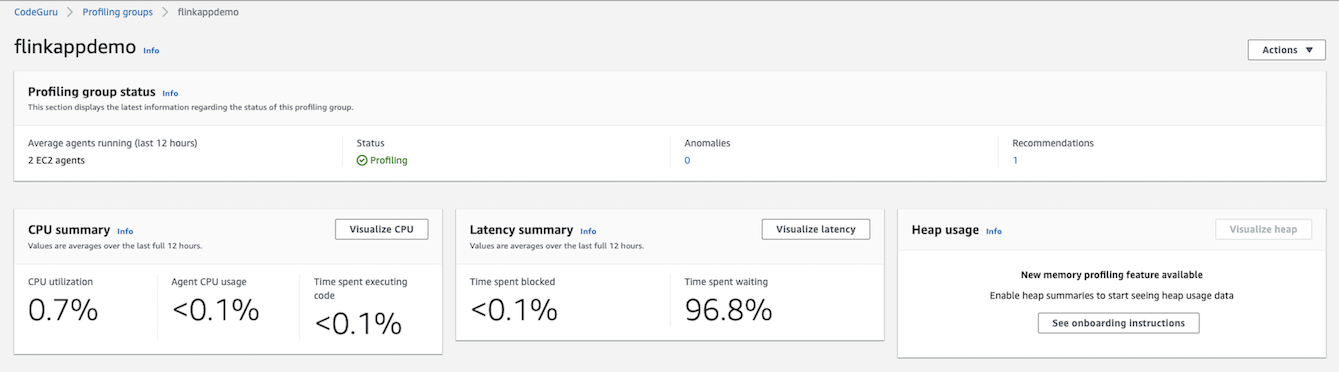
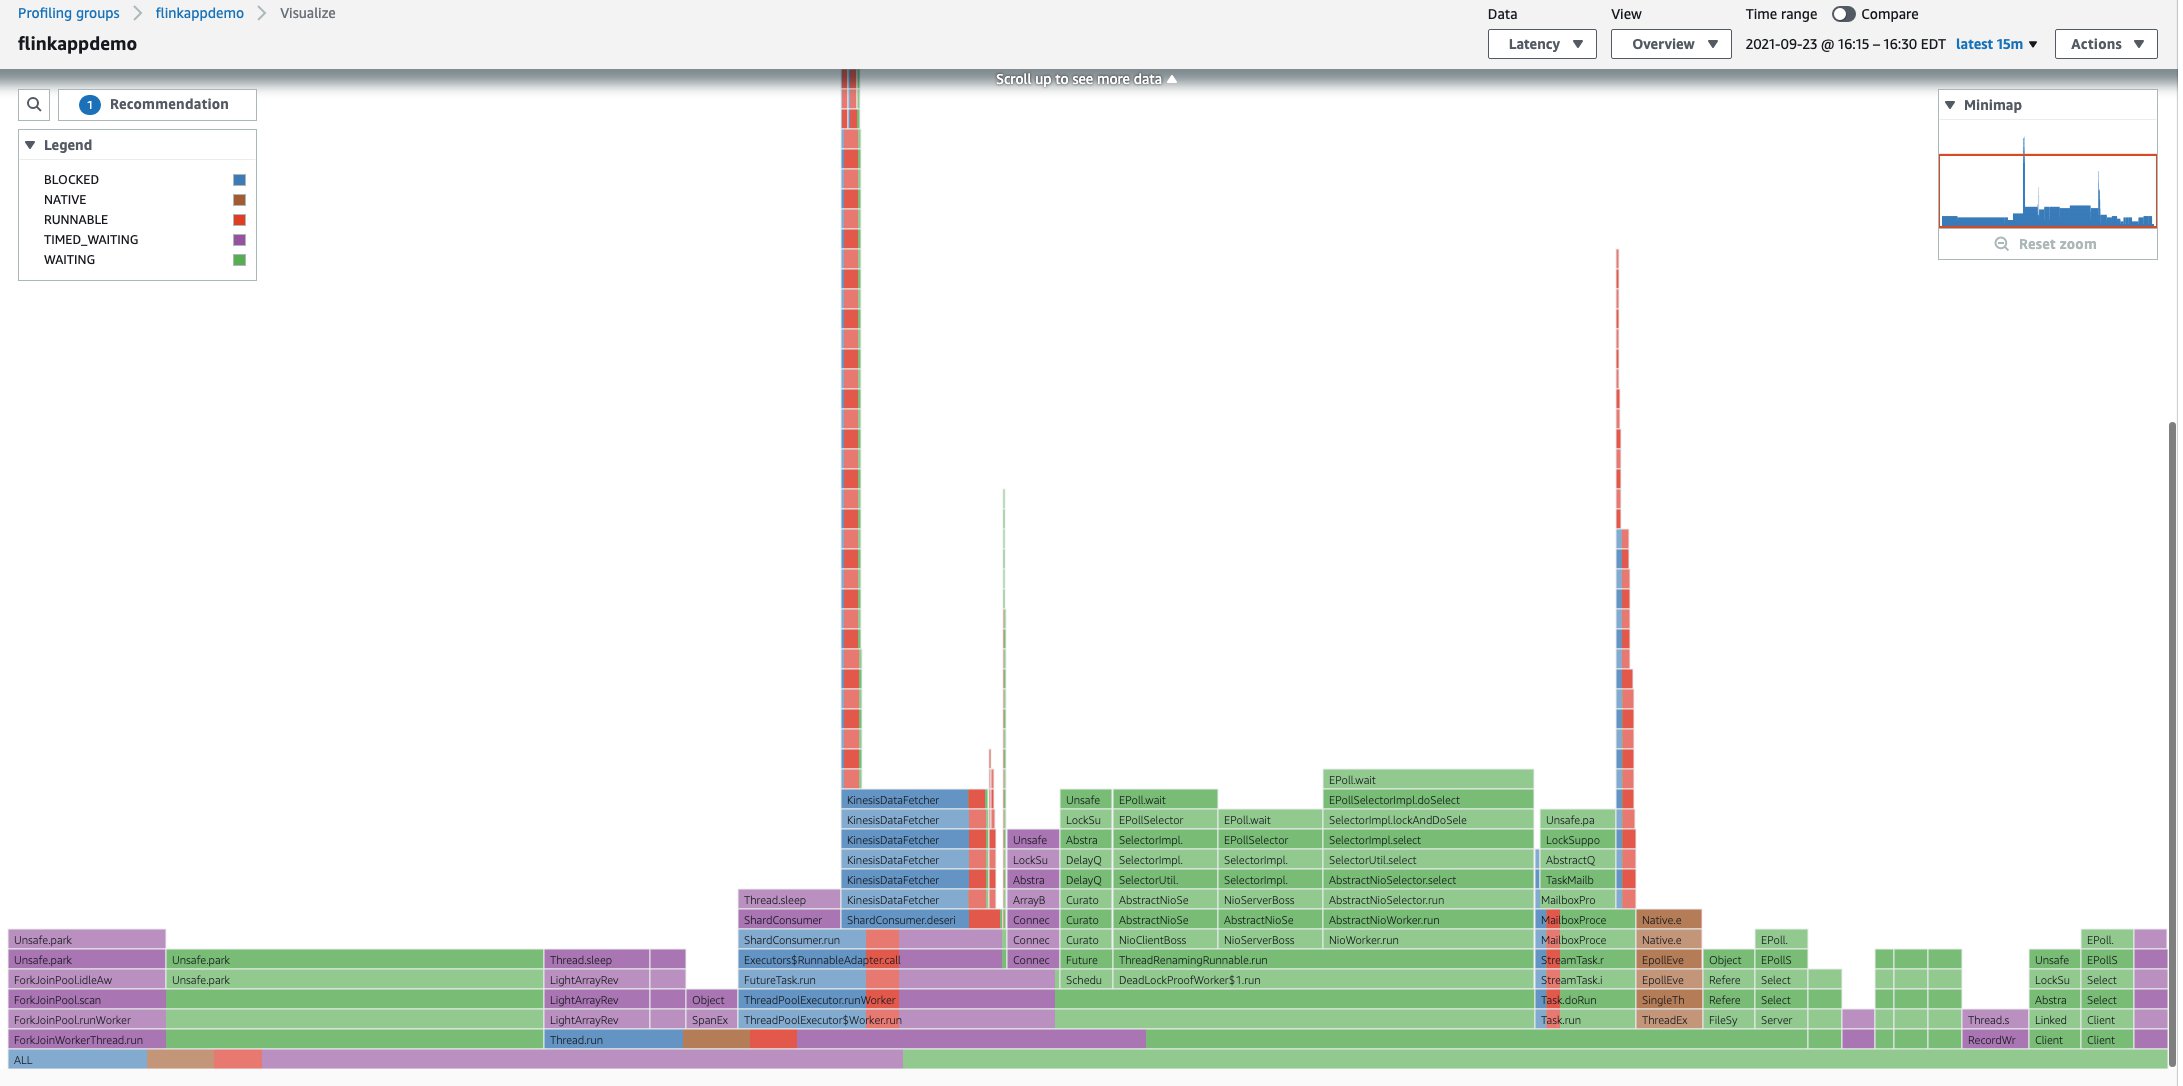
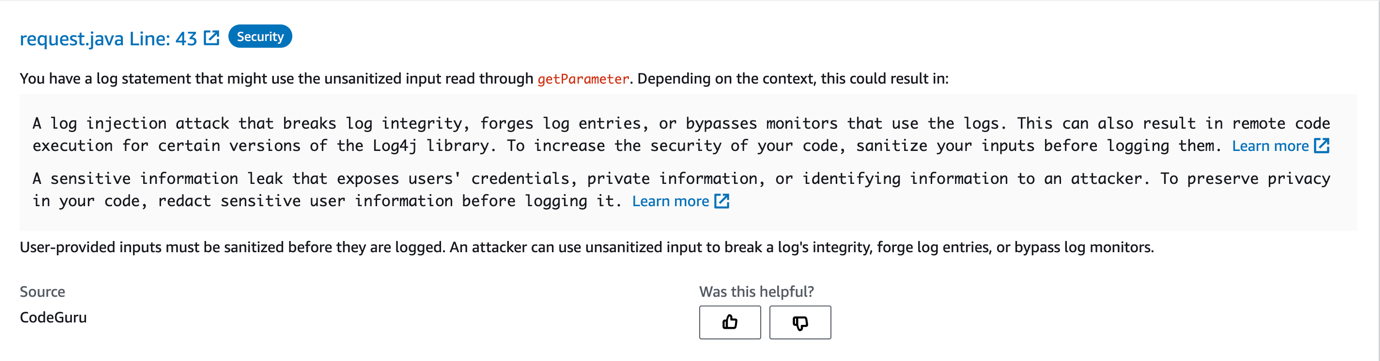
With AWS CDK, infrastructure is code. So, the standard tooling you already use to ensure quality and improve the builder experience should be used with CDK. If your organization has a code quality program, treat CDK applications no differently than web applications or microservices. Similarly, with Amazon CodeGuru Security and Amazon CodeWhisperer, builders can get actionable recommendations on how to improve both the security and quality on their CDK code as they would with any other type of application.
With Aspects, cdk-nag, and code quality tools, organizations can prevent security issues before they are deployed. However, it is also important to create controls that work after a deployment occurs. AWS CloudFormation Hooks allow customers to inspect resources prior to create, update, or delete CloudFormation Stacks or CDK Applications. With CloudFormation Hooks, Platform Engineering teams can provide warnings or prevent provisioning resources for non-compliant resources. These hooks can be created via CDK (see Build and Deploy CloudFormation Hooks using A CI/CD Pipeline for details).
Finally, you can deploy AWS Config’s conformance packs via CDK. These collections of rules you’re your organization insist on security standards at scale. If your organization wishes to build custom rules, teams can build reactive controls using higher level constructs for AWS Config Rules. While many of these patterns existed prior to CDK, CDK helps accelerate building and deploying cloud applications and controls by leveraging reusable components that are shared within the enterprise or by the community at large.
Operate the Application using Observability
The open-source community provides high-level construct libraries that expand basic monitoring capabilities for CDK applications. The cdk-monitoring-constructs project makes it easy to monitor CDK apps. Similarly, Cdk-wakeful takes that a step further, adding many additional services and provides easily configurable interfaces to automatically be notified by AWS System Manager Incident Manager, AWS Chatbot, or Amazon Simple Notification Service. By leveraging prebuilt solutions from the open-source community, you can focus on creating custom metrics and thresholds around your business logic. Platform Engineering teams can modify and extends 1open-source projects to help workload teams simplify their operations and emit health and status to centralized systems.
Accelerate New Project Startup with an Internal Developer Platform
An Internal Developer Platform (IDP) is built by platform engineering teams to build golden paths and enable developer self-service. These golden paths are expressed as a series of templates that the structure of a source control repository and files stored inside the repository. When the IDP uses these templates to create source code repositories, the resultant repository contains the following:
- A getting-started tutorial (usually in a README.md)
- Reference documentation
- Skeleton source code
- Dependency Management
- CI/CD pipeline template
- IaC template
- Observability configuration
With CDK, the CI/CD pipeline, IaC template, and observability configuration can all be a part of a single CDK application.
Platform engineering teams build golden paths and expose them using tools like Backstage, Humanitec, or Port. When building golden paths, there are two common approaches to the underlying project structure. Some organizations choose the approach where their IaC code repository is separate from the application code. Others choose to include everything in one repository. There is a healthy tension between how much to place inside a golden path vs a reusable component. In both strategies, platform engineering teams can avoid code duplication by leveraging CDK. The approach your organization chooses will dictate how you organize your reusable components. Below, we will walk through both options and the implications on reusable constructs.
Option 1: Everything in one repository
In this approach, all the code is contained in one repository: infrastructure, application, configuration, and deployment. This approach enables builders to collaborate, build features, and innovate together quickly, which is why it is the recommended approach. For more details, refer to the Best practices documentation. For examples, see AWS Deployment Reference Architecture for Applications.
This approach works best in teams that are “value-stream aligned.” Value-stream aligned teams have development and operations capabilities within the same team. These teams are organized around solving problems for customers rather than technical capabilities. Within the project, teams can organize around logical units such as application tier (API, database, etc.) or business capabilities (order management, product catalog, delivery services, etc.). In organizations that are value stream aligned, larger, highly conventionalized reusable components are better. An extreme example of this type of constructs is a single construct that contains all the code for an entire microservice. In these teams, the cognitive load focuses on the customer problem, so reducing the complexity of developing applications is critical to success.
Option 2: Separated application code pipeline
In this alternative approach, you can decouple your application code from your infrastructure by storing them in separate repositories and having separate pipelines. Separating the pipelines often leads to siloes and less collaboration between workload builders, who shift focus to developing features, and infrastructure engineers, who limit their efforts to building the infrastructure on which those applications run.
This approach works best in teams that are “matrixed.” A matrix organization is structured around technical capabilities (development, operations, security, business, etc.). In these cases, more modular constructs work better than constructs that are highly conventionalized. Experts from each organization can use CDK constructs as mechanisms to share their expertise across the entire organization. Examples of these types of constructs are monitoring, alerting, or security constructs prebuilt with hooks to plug in to centralized monitoring.
Building a Community of Practice with Platform Engineering
Scaling any new technology within a large organization requires the creation and enablement of a community that fosters collaboration, establishes best practices, and stays up to date with the changes in the ecosystem. In order to enable the creation of these communities of practice within your organization, AWS supports multiple public communities centered around the creation of content to educate and enable CDK users. Members of your organization’s community of practice can connect with other CDK development teams around the world through these public AWS supported communities.
Communities of Practice
A Community of Practice (CoP) is a group of people with shared interest who come together to learn, collaborate and develop expertise in a specific domain through informal interactions and knowledge sharing. Within your organization, establishing communities of practice around CDK has been proven to enable mentorship, problem solving, and reusable assets. To get started, your platform engineering team – the creators of reusable constructs and builder tooling with CDK – become early content creators for the community of practice. This establishes a feedback loop where CDK creators publicize their achievements via the CoP and consumers can ask questions and provide direct guidance to creators. Once the CoP has sustainably expanded by the initial group that established it, the CoP can start to add hack-a-thons or game days within your organization, which can bring innovation and solve organization-wide challenges. Fully mature communities of practices own curated wikis or databases of knowledge. They use mechanisms such as townhalls, office hours, newsletters, and chat channels to keep the community up to date. In this way, CDK expertise is diffused across the organization. At AWS, this diffusion of expertise has led to teams other than platform engineering becoming creators of reusable constructs. By expanding who can create reusable constructs, we are able to accelerate our own innovation.
Communities
There is a growing community that supports CDK, with many different platforms available providing content, code, examples and meetups. CDK is currently maintained by AWS with support from the community on AWS CDK GitHub page where you can contribute to the platform, raise issues, see the backlog and join discussions with active community members.
CDK.dev is the community driven hub around the CDK ecosystem. This site brings together all the latest blogs, videos, and educational content. It also provides links to join the community Slack platform.
CDK Patterns houses an open source collection of AWS Serverless architecture patterns built with CDK for developers to use. These patterns are sources via AWS Community Builders / AWS Heroes.
Finally, AWS re:Post provides a question-and-answer portal for the community to resolve.
The AWS Community Builders program offers technical resources, education, and networking opportunities to AWS technical enthusiasts and emerging thought leaders who are passionate about sharing knowledge and connecting with the technical community.
Communities of practice can leverage AWS public communities like cdk.dev to fill gaps in knowledge. Townhalls can benefit from speakers from AWS Heroes or community builders, frequent contributors to GitHub or re:Post, or speakers from CDK Day. Newsletters can aggregate and summarize the latest news from across all AWS channels. Once your community of practice establishes CDK competencies, this collaboration can also be bidirectional. For example, experts in your organization’s community can become AWS Heroes. Success stories can be shared via CDK Day, guest blog posts, and you might even speak at one of our major events such as AWS Summits, AWS re:Invent, AWS re:Inforce, or AWS re:Mars.
Final Thoughts
As we’ve said throughout this blog, with CDK, Infrastructure is code. This has enabled a paradigm shift in the infrastructure management space. Today, we see many customers such as Liberty Mutual, Scenario, Checkmarx, and Registers of Scotland establishing mature ecosystems using CDK. With an active open-source community, an AWS dev team for long term support, and multiple platforms for knowledge sharing, your builders can quickly learn, build, and innovate. Due to successful pilots, many organizations adopt CDK, become more agile, and innovate faster. This is exactly what happened at Amazon, where CDK is the first choice for building new services.
Organizations often scale and reduce complexity through platform engineering. These teams build higher level constructs by applying best practices, and provide CI/CD pipelines to accelerate deployments. Your deployment is safer using unit testing on your infrastructure as code and through robust security controls to provide guidance to builders at every stage: from author to operate.
Finally, establishing a community enables your organization to build its own mature ecosystem. Through both internal and open-source communities your builders can connect, discover, and grow.


 One-year anniversary of CloudFront Functions – I can’t believe it’s been


![git clone CodeCommit repo to Cloud9 using git clone command, readme.md file is created locally and pushed back to CodeCommit repo]](https://d2908q01vomqb2.cloudfront.net/7719a1c782a1ba91c031a682a0a2f8658209adbf/2022/02/02/Picture7.png)