Post Syndicated from Maisie Fernandes original https://aws.amazon.com/blogs/security/how-to-set-up-and-track-slas-for-resolving-security-hub-findings/
Your organization can use AWS Security Hub to gain a comprehensive view of your security and compliance posture across your Amazon Web Services (AWS) environment. Security Hub receives security findings from AWS security services and supported third-party products and centralizes them, providing a single view for identifying and analyzing security issues. Security Hub correlates findings and breaks them down into five severity categories: INFORMATIONAL, LOW, MEDIUM, HIGH, and CRITICAL. In this blog post, we provide step-by-step instructions for tracking Security Hub findings in each severity category against service-level agreements (SLAs) through visual dashboards.
SLAs are defined collaboratively by the Business, IT, and Security and Compliance teams within an organization. You can track Security Hub findings against your specific SLAs, and any findings that are in breach of an SLA can be escalated. You can also apply automation to alert the owners of the resources and remediate common security findings to improve your overall security posture.
Prerequisites
Security Hub uses service-linked AWS Config rules to perform security checks behind the scenes. To support these controls, you must enable AWS Config on all accounts, including the administrator and member accounts, in each AWS Region where Security Hub is enabled.
As a best practice, we recommend that you enable AWS Config and Security Hub across all of your accounts and Regions. For more information on how to do this, see Enabling and configuring AWS Config and Setting up Security Hub.
Solution overview
In this solution, you will learn two different ways to track your findings in Security Hub against the pre-defined SLA for each severity category.
Option 1: Use custom insights
Security Hub offers managed insights, which include a collection of related findings that identify a security issue that requires attention and intervention. You can view and take action on the insight findings. In addition to the managed insights, you can create custom insights to track issues and findings related to your resources in your environment.
Create a custom insight for SLA tracking
In this example, you set an SLA of 30 days for HIGH severity findings. This example will provide you with a view of the HIGH severity findings that were generated within the last 30 days and haven’t been resolved.
To create a custom insight to view HIGH severity findings from the last 30 days
- In the Security Hub console, in the left navigation pane, choose Insights.
- On the Insights page, choose Create insight, as shown in Figure 1.

Figure 1: Create insight in the Security Hub console
- On the Create insight page, in the search box, leave the following default filters: Workflow status is NEW, Workflow status is NOTIFIED, and Record state is ACTIVE, as show in Figure 2.
- To select the required grouping attribute for the insight, choose the search box to display the filter options. In the search box, choose the following filters and settings:
- Choose the Group by filter, and select WorkflowStatus.

Figure 2: Create insights using filters
- Choose the Severity label filter and enter HIGH.
- Choose the Created at filter and enter 30 to indicate the number of days you want to set as your SLA.
- Choose the Group by filter, and select WorkflowStatus.
- Choose Create insight again.
- For Insight name, enter a meaningful name (for this example, we entered UnresolvedHighSevFindings), and then choose Create insight again.


You can repeat the same steps for other finding severities – CRITICAL, MEDIUM, LOW, and INFORMATIONAL; you can change the number of days you specify for the Created at filter to meet your SLA requirements; or specify different workflow status settings. Note that the workflow status can have the following values:
- NEW – The initial state of a finding before you review it.
- NOTIFIED – Indicates that the resource owner has been notified about the security issue.
- SUPPRESSED – Indicates that you have reviewed the finding and no action is required.
- RESOLVED – Indicates that the finding has been reviewed and remediated.
Your custom insight will show the findings that meet the criteria you defined. For more information about creating custom insights, see Module 2: Custom Insights in the Security Hub Workshop.
Option 2: Build visualizations for Security Hub findings data by using Amazon QuickSight
We hear from our customers that your organizations are looking for a solution where you can quickly visualize the status of your Security Hub findings, to see which findings you need to take action on (NEW and NOTIFIED) and which you do not (SUPPRESSED and RESOLVED). You can achieve this by building a data analytics pipeline that uses Amazon EventBridge, Amazon Kinesis Data Firehose, Amazon Simple Storage Service (Amazon S3), Amazon Athena, and Amazon QuickSight. The data analytics pipeline enables you to detect, analyze, contain, and mitigate issues quickly.
This solution integrates Security Hub with EventBridge to set SLA rules to a specified period of your choice for each severity level. For example, you can set the SLA to 5 days for CRITICAL severity findings, 10 days for HIGH severity findings, 14 days for MEDIUM severity findings, 30 days for LOW severity findings, and 60 days for INFORMATIONAL severity findings.
Architecture overview
Figure 3 shows the architectural overview of the QuickSight solution workflow.
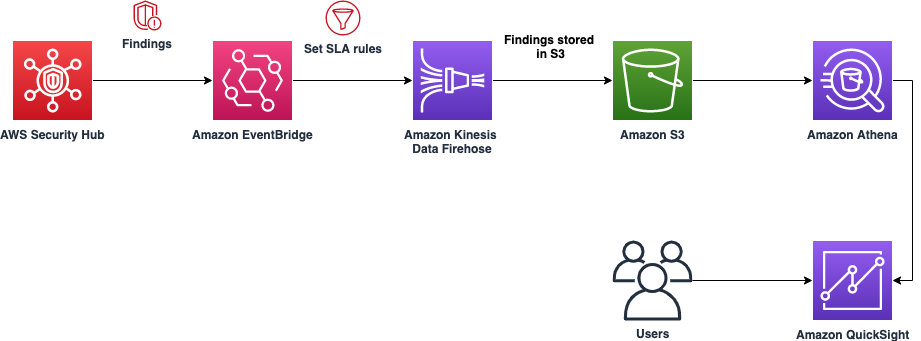
Figure 3: Architecture diagram for option 2, the QuickSight solution
In the QuickSight solution, Security Hub publishes the findings to EventBridge, and then an EventBridge rule (based on the SLA) is configured to deliver the findings to Kinesis Data Firehose. For example, if the SLA is 14 days for all MEDIUM severity findings, then those findings will be filtered by the rule and sent to Kinesis Data Firehose. Security Hub findings follow the AWS Security Finding Format (ASFF).
The following is a sample EventBridge rule that filters the Security Hub findings for MEDIUM severity and workflow status NEW, before publishing the findings to Kinesis Data Firehose, and then finally to Amazon S3 for storage. A workflow status of NEW and NOTIFIED should be included to catch all findings that require action.
After the findings are exported and stored in Amazon S3, you can use Athena to run queries on the data and you can use Amazon QuickSight to display the findings that violate your organization’s SLA. With Athena, you can create views of the original table as a logical table. You can also create a view for CRITICAL, HIGH, MEDIUM, LOW, and INFORMATIONAL severity findings.
For details about how to export findings and build a dashboard, see the blog post How to build a multi-Region AWS Security Hub analytic pipeline and visualize Security Hub data.
Visualize an SLA by using QuickSight
The QuickSight dashboard shown in Figure 4 is an example that shows all the MEDIUM severity findings that should be resolved within a 14 day SLA.
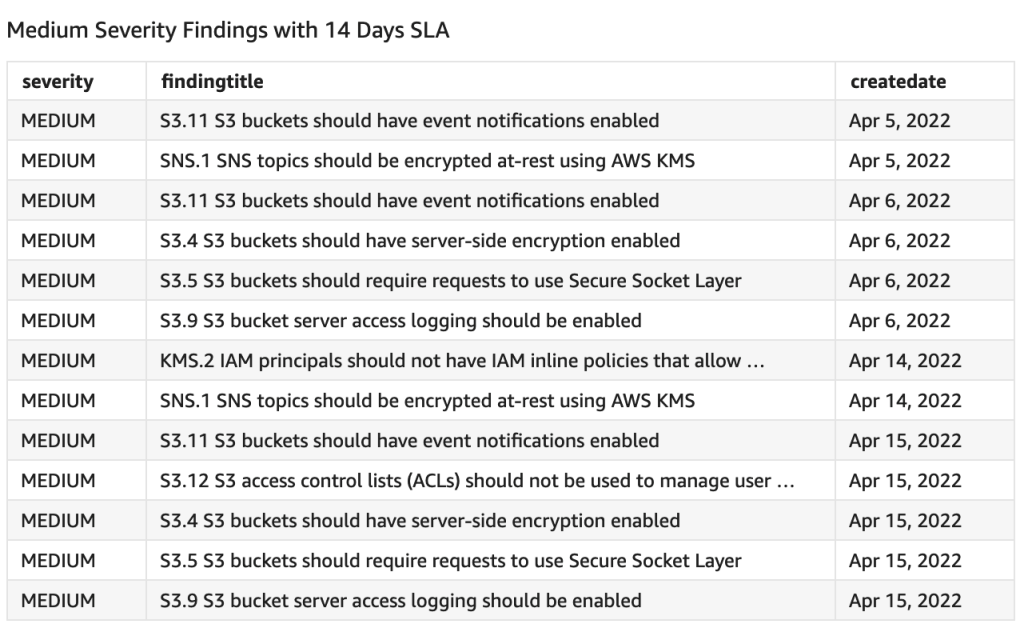
Figure 4: QuickSight table showing medium severity findings over a 14-day SLA
Using QuickSight, you can create different types of data visualizations to represent the exported Security Hub findings, which enables the decision makers in your organization to explore and interpret information in an interactive visual environment. For example, Figure 5 shows findings categorized by service.
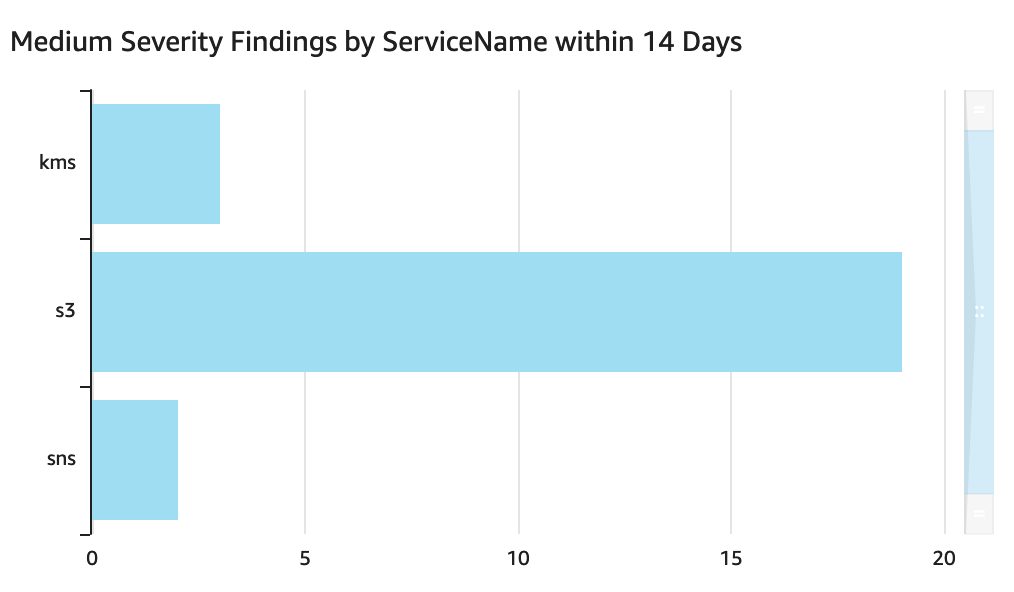
Figure 5: QuickSight visual showing MEDIUM severity findings for each service
As another example, Figure 6 shows findings categorized by severity.
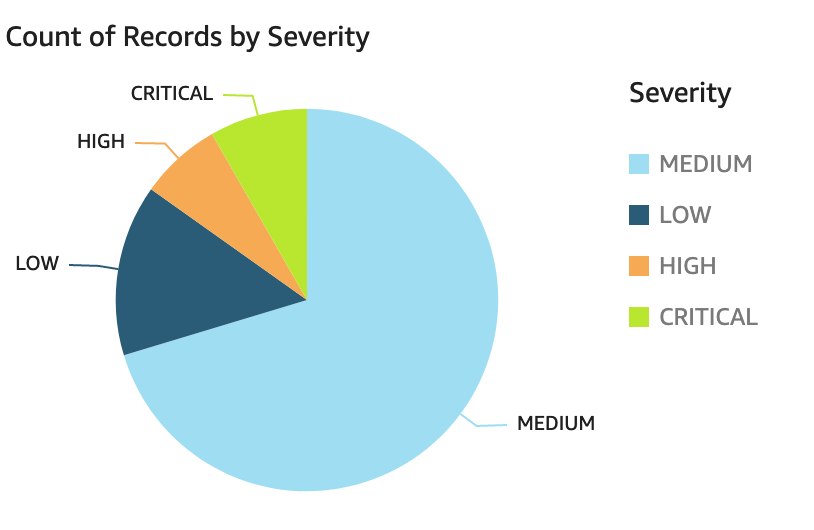
Figure 6: QuickSight visual showing findings by severity
For more information about visualizing Security Hub findings by using Amazon OpenSearch Service and Kibana, see the blog post Visualize Security Hub Findings using Analytics and Business Intelligence Tools.
Changing a finding’s severity
Over time, your organization might discover that there are certain findings that should be tracked at a lower or higher severity level than what is auto-generated from Security Hub. You can implement EventBridge rules with AWS Lambda functions to automatically update the severity of the findings as soon as they are generated.
To automate the finding severity change
- On the EventBridge console, create an EventBridge rule. For detailed instructions, see Getting started with Amazon EventBridge.
Figure 7: Create an EventBridge rule in the console
- Define the event pattern, including the finding generator ID or any other identifying fields for which you want to redefine the severity. Review the fields in the format, and choose your desired filters. The following is a sample of the event pattern.
- Specify the target as a Lambda function that will host the code to update the finding severity.
Figure 8: Select a target Lambda function
- In the Lambda function, use the BatchUpdateFindings API action to update the severity label as desired.
The following example Lambda code will update finding severity to INFORMATIONAL. This function requires Amazon CloudWatch write permissions, and requires permissions to invoke the Security Hub API action BarchUpdateFindings.
- The finding is generated with a new severity level, as updated in the Lambda function. For example, Figure 9 shows a finding that is generated as MEDIUM by default, but the configured EventBridge rule and Lambda function update the severity level to INFORMATIONAL.
Figure 9: Security Hub findings generated with updated severity level


Conclusion
This blog post walked you through two different solutions for setting up and tracking the SLAs for the findings generated by Security Hub. Reporting Security Hub findings for a given SLA in a dashboard view can help you prioritize findings and track whether findings are being remediated on time. This post also provided example code that you can use to modify the Security Hub severity for a specific finding. To further extend the solution and enable custom actions to remediate the findings, see the following:
- Correlate security findings with AWS Security Hub and Amazon EventBridge blog post
- Using custom actions to send findings and insight results to EventBridge in the AWS Security Hub User Guide
- How to Enable Custom Actions in AWS Security Hub blog post
- Automated Security Response on AWS Implementation Guide
If you have feedback about this post, submit comments in the Comments section below. If you have questions about this post, contact AWS Support.
Want more AWS Security news? Follow us on Twitter.