Post Syndicated from Jason Ng original https://aws.amazon.com/blogs/security/enhance-container-software-supply-chain-visibility-through-sbom-export-with-amazon-inspector-and-quicksight/
In this post, I’ll show how you can export software bills of materials (SBOMs) for your containers by using an AWS native service, Amazon Inspector, and visualize the SBOMs through Amazon QuickSight, providing a single-pane-of-glass view of your organization’s software supply chain.
The concept of a bill of materials (BOM) originated in the manufacturing industry in the early 1960s. It was used to keep track of the quantities of each material used to manufacture a completed product. If parts were found to be defective, engineers could then use the BOM to identify products that contained those parts. An SBOM extends this concept to software development, allowing engineers to keep track of vulnerable software packages and quickly remediate the vulnerabilities.
Today, most software includes open source components. A Synopsys study, Walking the Line: GitOps and Shift Left Security, shows that 8 in 10 organizations reported using open source software in their applications. Consider a scenario in which you specify an open source base image in your Dockerfile but don’t know what packages it contains. Although this practice can significantly improve developer productivity and efficiency, the decreased visibility makes it more difficult for your organization to manage risk effectively.
It’s important to track the software components and their versions that you use in your applications, because a single affected component used across multiple organizations could result in a major security impact. According to a Gartner report titled Gartner Report for SBOMs: Key Takeaways You Should know, by 2025, 60 percent of organizations building or procuring critical infrastructure software will mandate and standardize SBOMs in their software engineering practice, up from less than 20 percent in 2022. This will help provide much-needed visibility into software supply chain security.
Integrating SBOM workflows into the software development life cycle is just the first step—visualizing SBOMs and being able to search through them quickly is the next step. This post describes how to process the generated SBOMs and visualize them with Amazon QuickSight. AWS also recently added SBOM export capability in Amazon Inspector, which offers the ability to export SBOMs for Amazon Inspector monitored resources, including container images.
Why is vulnerability scanning not enough?
Scanning and monitoring vulnerable components that pose cybersecurity risks is known as vulnerability scanning, and is fundamental to organizations for ensuring a strong and solid security posture. Scanners usually rely on a database of known vulnerabilities, the most common being the Common Vulnerabilities and Exposures (CVE) database.
Identifying vulnerable components with a scanner can prevent an engineer from deploying affected applications into production. You can embed scanning into your continuous integration and continuous delivery (CI/CD) pipelines so that images with known vulnerabilities don’t get pushed into your image repository. However, what if a new vulnerability is discovered but has not been added to the CVE records yet? A good example of this is the Apache Log4j vulnerability, which was first disclosed on Nov 24, 2021 and only added as a CVE on Dec 1, 2021. This means that for 7 days, scanners that relied on the CVE system weren’t able to identify affected components within their organizations. This issue is known as a zero-day vulnerability. Being able to quickly identify vulnerable software components in your applications in such situations would allow you to assess the risk and come up with a mitigation plan without waiting for a vendor or supplier to provide a patch.
In addition, it’s also good hygiene for your organization to track usage of software packages, which provides visibility into your software supply chain. This can improve collaboration between developers, operations, and security teams, because they’ll have a common view of every software component and can collaborate effectively to address security threats.
In this post, I present a solution that uses the new Amazon Inspector feature to export SBOMs from container images, process them, and visualize the data in QuickSight. This gives you the ability to search through your software inventory on a dashboard and to use natural language queries through QuickSight Q, in order to look for vulnerabilities.
Solution overview
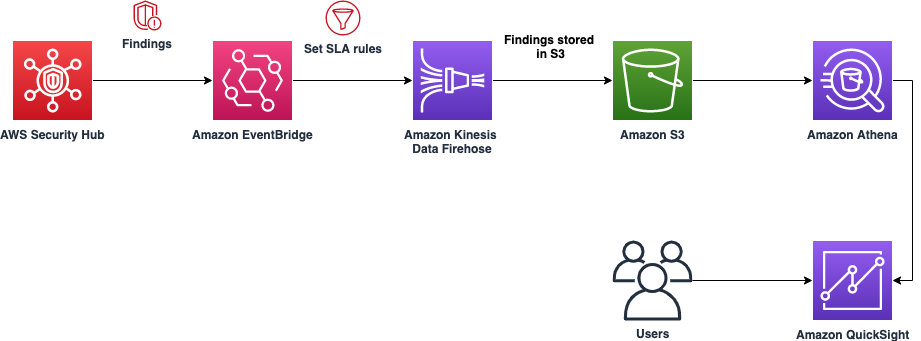
Figure 1 shows the architecture of the solution. It is fully serverless, meaning there is no underlying infrastructure you need to manage. This post uses a newly released feature within Amazon Inspector that provides the ability to export a consolidated SBOM for Amazon Inspector monitored resources across your organization in commonly used formats, including CycloneDx and SPDX.
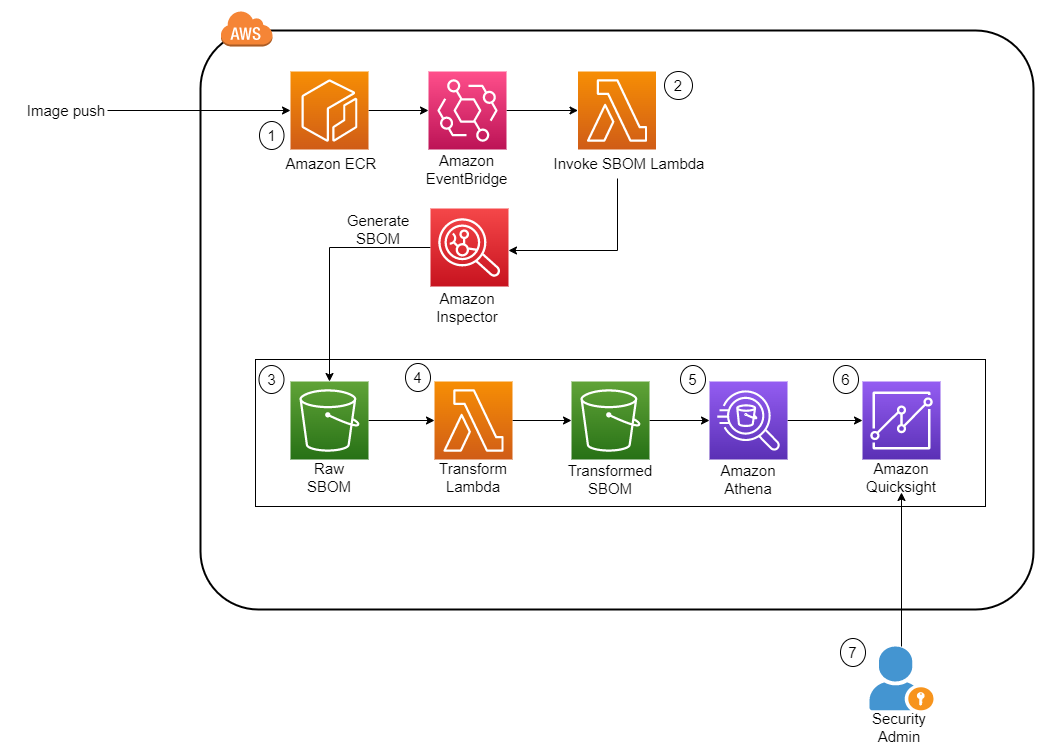
Figure 1: Solution architecture diagram
The workflow in Figure 1 is as follows:
- The image is pushed into Amazon Elastic Container Registry (Amazon ECR), which sends an Amazon EventBridge event.
- This invokes an AWS Lambda function, which starts the SBOM generation job for the specific image.
- When the job completes, Amazon Inspector deposits the SBOM file in an Amazon Simple Storage Service (Amazon S3) bucket.
- Another Lambda function is invoked whenever a new JSON file is deposited. The function performs the data transformation steps and uploads the new file into a new S3 bucket.
- Amazon Athena is then used to perform preliminary data exploration.
- A dashboard on Amazon QuickSight displays SBOM data.
Implement the solution
This section describes how to deploy the solution architecture.
In this post, you’ll perform the following tasks:
- Create S3 buckets and AWS KMS keys to store the SBOMs
- Create an Amazon Elastic Container Registry (Amazon ECR) repository
- Deploy two AWS Lambda functions to initiate the SBOM generation and transformation
- Set up Amazon EventBridge rules to invoke Lambda functions upon image push into Amazon ECR
- Run AWS Glue crawlers to crawl the transformed SBOM S3 bucket
- Run Amazon Athena queries to review SBOM data
- Create QuickSight dashboards to identify libraries and packages
- Use QuickSight Q to identify libraries and packages by using natural language queries
Deploy the CloudFormation stack
The AWS CloudFormation template we’ve provided provisions the S3 buckets that are required for the storage of raw SBOMs and transformed SBOMs, the Lambda functions necessary to initiate and process the SBOMs, and EventBridge rules to run the Lambda functions based on certain events. An empty repository is provisioned as part of the stack, but you can also use your own repository.
To deploy the CloudFormation stack
- Download the CloudFormation template.
- Browse to the CloudFormation service in your AWS account and choose Create Stack.
- Upload the CloudFormation template you downloaded earlier.
- For the next step, Specify stack details, enter a stack name.
- You can keep the default value of sbom-inspector for EnvironmentName.
- Specify the Amazon Resource Name (ARN) of the user or role to be the admin for the KMS key.
- Deploy the stack.
Set up Amazon Inspector
If this is the first time you’re using Amazon Inspector, you need to activate the service. In the Getting started with Amazon Inspector topic in the Amazon Inspector User Guide, follow Step 1 to activate the service. This will take some time to complete.
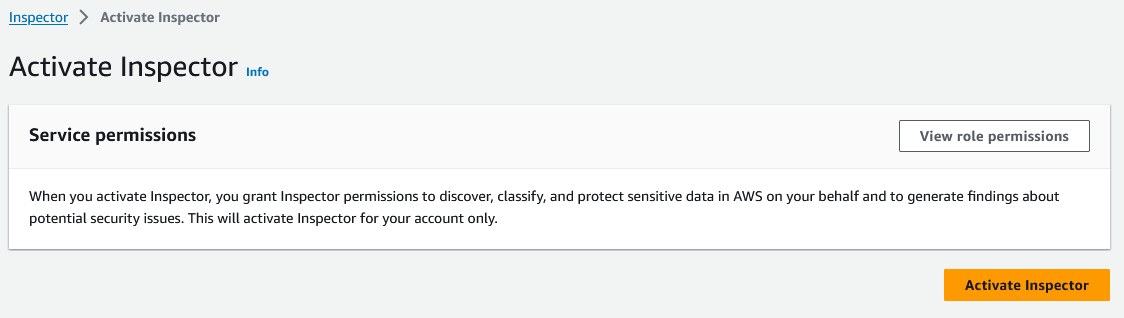
Figure 2: Activate Amazon Inspector
SBOM invocation and processing Lambda functions
This solution uses two Lambda functions written in Python to perform the invocation task and the transformation task.
- Invocation task — This function is run whenever a new image is pushed into Amazon ECR. It takes in the repository name and image tag variables and passes those into the create_sbom_export function in the SPDX format. This prevents duplicated SBOMs, which helps to keep the S3 data size small.
- Transformation task — This function is run whenever a new file with the suffix .json is added to the raw S3 bucket. It creates two files, as follows:
- It extracts information such as image ARN, account number, package, package version, operating system, and SHA from the SBOM and exports this data to the transformed S3 bucket under a folder named sbom/.
- Because each package can have more than one CVE, this function also extracts the CVE from each package and stores it in the same bucket in a directory named cve/. Both files are exported in Apache Parquet so that the file is in a format that is optimized for queries by Amazon Athena.
Populate the AWS Glue Data Catalog
To populate the AWS Glue Data Catalog, you need to generate the SBOM files by using the Lambda functions that were created earlier.
To populate the AWS Glue Data Catalog
- You can use an existing image, or you can continue on to create a sample image.
- Open an AWS Cloudshell terminal.
- Run the follow commands
- An image is pushed into the Amazon ECR repository in your account. This invokes the Lambda functions that perform the SBOM export by using Amazon Inspector and converts the SBOM file to Parquet.
- Verify that the Parquet files are in the transformed S3 bucket:
- Browse to the S3 console and choose the bucket named sbom-inspector-<ACCOUNT-ID>-transformed. You can also track the invocation of each Lambda function in the Amazon CloudWatch log console.
- After the transformation step is complete, you will see two folders (cve/ and sbom/)in the transformed S3 bucket. Choose the sbom folder. You will see the transformed Parquet file in it. If there are CVEs present, a similar file will appear in the cve folder.
The next step is to run an AWS Glue crawler to determine the format, schema, and associated properties of the raw data. You will need to crawl both folders in the transformed S3 bucket and store the schema in separate tables in the AWS Glue Data Catalog.
- On the AWS Glue Service console, on the left navigation menu, choose Crawlers.
- On the Crawlers page, choose Create crawler. This starts a series of pages that prompt you for the crawler details.
- In the Crawler name field, enter sbom-crawler, and then choose Next.
- Under Data sources, select Add a data source.
- Now you need to point the crawler to your data. On the Add data source page, choose the Amazon S3 data store. This solution in this post doesn’t use a connection, so leave the Connection field blank if it’s visible.
- For the option Location of S3 data, choose In this account. Then, for S3 path, enter the path where the crawler can find the sbom and cve data, which is s3://sbom-inspector-<ACCOUNT-ID>-transformed/sbom/ and s3://sbom-inspector-<ACCOUNT-ID>-transformed/cve/. Leave the rest as default and select Add an S3 data source.

Figure 3: Data source for AWS Glue crawler
- The crawler needs permissions to access the data store and create objects in the Data Catalog. To configure these permissions, choose Create an IAM role. The AWS Identity and Access Management (IAM) role name starts with AWSGlueServiceRole-, and in the field, you enter the last part of the role name. Enter sbomcrawler, and then choose Next.
- Crawlers create tables in your Data Catalog. Tables are contained in a database in the Data Catalog. To create a database, choose Add database. In the pop-up window, enter sbom-db for the database name, and then choose Create.
- Verify the choices you made in the Add crawler wizard. If you see any mistakes, you can choose Back to return to previous pages and make changes. After you’ve reviewed the information, choose Finish to create the crawler.
Figure 4: Creation of the AWS Glue crawler
- Select the newly created crawler and choose Run.
- After the crawler runs successfully, verify that the table is created and the data schema is populated.
Figure 5: Table populated from the AWS Glue crawler


Set up Amazon Athena
Amazon Athena performs the initial data exploration and validation. Athena is a serverless interactive analytics service built on open source frameworks that supports open-table and file formats. Athena provides a simplified, flexible way to analyze data in sources like Amazon S3 by using standard SQL queries. If you are SQL proficient, you can query the data source directly; however, not everyone is familiar with SQL. In this section, you run a sample query and initialize the service so that it can used in QuickSight later on.
To start using Amazon Athena
- In the AWS Management Console, navigate to the Athena console.
- For Database, select sbom-db (or select the database you created earlier in the crawler).
- Navigate to the Settings tab located at the top right corner of the console. For Query result location, select the Athena S3 bucket created from the CloudFormation template, sbom-inspector-<ACCOUNT-ID>-athena.
- Keep the defaults for the rest of the settings. You can now return to the Query Editor and start writing and running your queries on the sbom-db database.
You can use the following sample query.
Your Athena console should look similar to the screenshot in Figure 6.
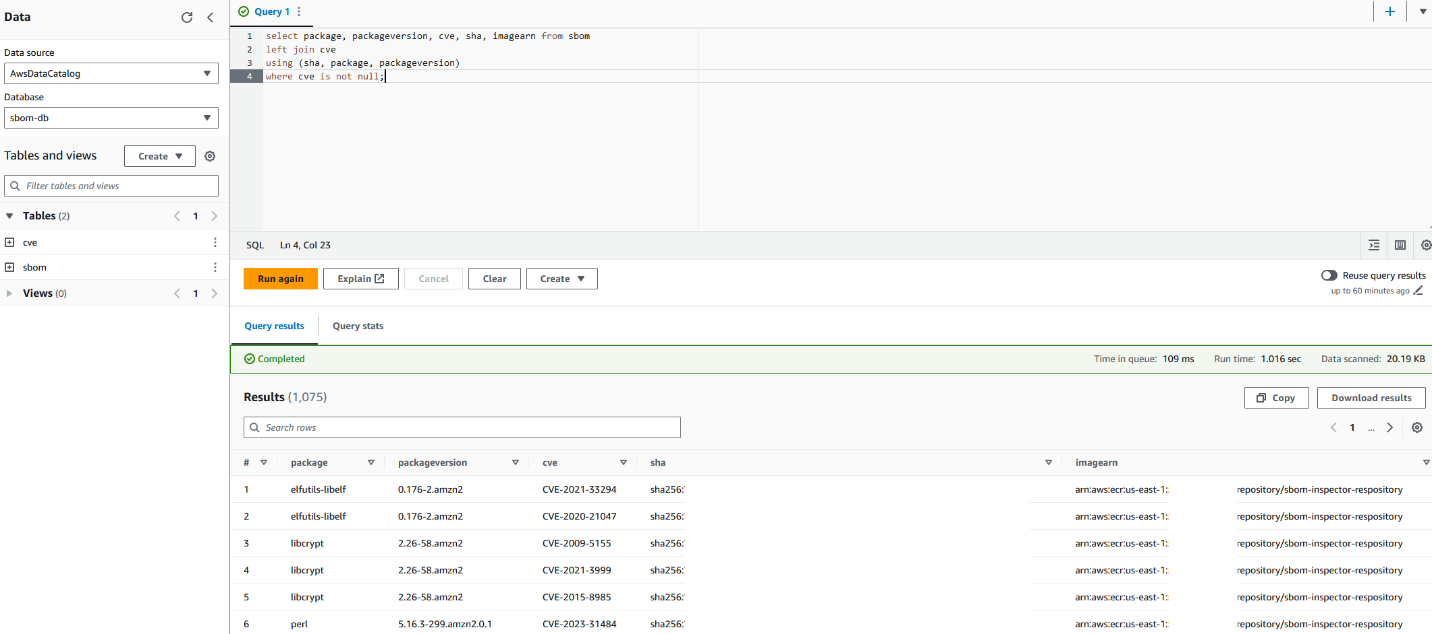
Figure 6: Sample query with Amazon Athena
This query joins the two tables and selects only the packages with CVEs identified. Alternatively, you can choose to query for specific packages or identify the most common package used in your organization.
Sample output:
Visualize data with Amazon QuickSight
Amazon QuickSight is a serverless business intelligence service that is designed for the cloud. In this post, it serves as a dashboard that allows business users who are unfamiliar with SQL to identify zero-day vulnerabilities. This can also reduce the operational effort and time of having to look through several JSON documents to identify a single package across your image repositories. You can then share the dashboard across teams without having to share the underlying data.
QuickSight SPICE (Super-fast, Parallel, In-memory Calculation Engine) is an in-memory engine that QuickSight uses to perform advanced calculations. In a large organization where you could have millions of SBOM records stored in S3, importing your data into SPICE helps to reduce the time to process and serve the data. You can also use the feature to perform a scheduled refresh to obtain the latest data from S3.
QuickSight also has a feature called QuickSight Q. With QuickSightQ, you can use natural language to interact with your data. If this is the first time you are initializing QuickSight, subscribe to QuickSight and select Enterprise + Q. It will take roughly 20–30 minutes to initialize for the first time. Otherwise, if you are already using QuickSight, you will need to enable QuickSight Q by subscribing to it in the QuickSight console.
Finally, in QuickSight you can select different data sources, such as Amazon S3 and Athena, to create custom visualizations. In this post, we will use the two Athena tables as the data source to create a dashboard to keep track of the packages used in your organization and the resulting CVEs that come with them.
Prerequisites for setting up the QuickSight dashboard
This process will be used to create the QuickSight dashboard from a template already pre-provisioned through the command line interface (CLI). It also grants the necessary permissions for QuickSight to access the data source. You will need the following:
- AWS Command Line Interface (AWS CLI) programmatic access with read and write permissions to QuickSight.
- A QuickSight + Q subscription (only if you want to use the Q feature).
- QuickSight permissions to Amazon S3 and Athena (enable these through the QuickSight security and permissions interface).
- Set the default AWS Region where you want to deploy the QuickSight dashboard. This post assumes that you’re using the us-east-1 Region.
Create datasets
In QuickSight, create two datasets, one for the sbom table and another for the cve table.
- In the QuickSight console, select the Dataset tab.
- Choose Create dataset, and then select the Athena data source.
- Name the data source sbom and choose Create data source.
- Select the sbom table.
- Choose Visualize to complete the dataset creation. (Delete the analyses automatically created for you because you will create your own analyses afterwards.)
- Navigate back to the main QuickSight page and repeat steps 1–4 for the cve dataset.
Merge datasets
Next, merge the two datasets to create the combined dataset that you will use for the dashboard.
- On the Datasets tab, edit the sbom dataset and add the cve dataset.
- Set three join clauses, as follows:
- Sha : Sha
- Package : Package
- Packageversion : Packageversion
- Perform a left merge, which will append the cve ID to the package and package version in the sbom dataset.

Figure 7: Combining the sbom and cve datasets

Next, you will create a dashboard based on the combined sbom dataset.
Prepare configuration files
In your terminal, export the following variables. Substitute <QuickSight username> in the QS_USER_ARN variable with your own username, which can be found in the Amazon QuickSight console.
Validate that the variables are set properly. This is required for you to move on to the next step; otherwise you will run into errors.
Next, use the following commands to create the dashboard from a predefined template and create the IAM permissions needed for the user to view the QuickSight dashboard.
Run the following commands to create the dashboard in your QuickSight console.
Note: Run the following describe-dashboard command, and confirm that the response contains a status code of 200. The 200-status code means that the dashboard exists.
Use the following update-dashboard-permissions AWS CLI command to grant the appropriate permissions to QuickSight users.
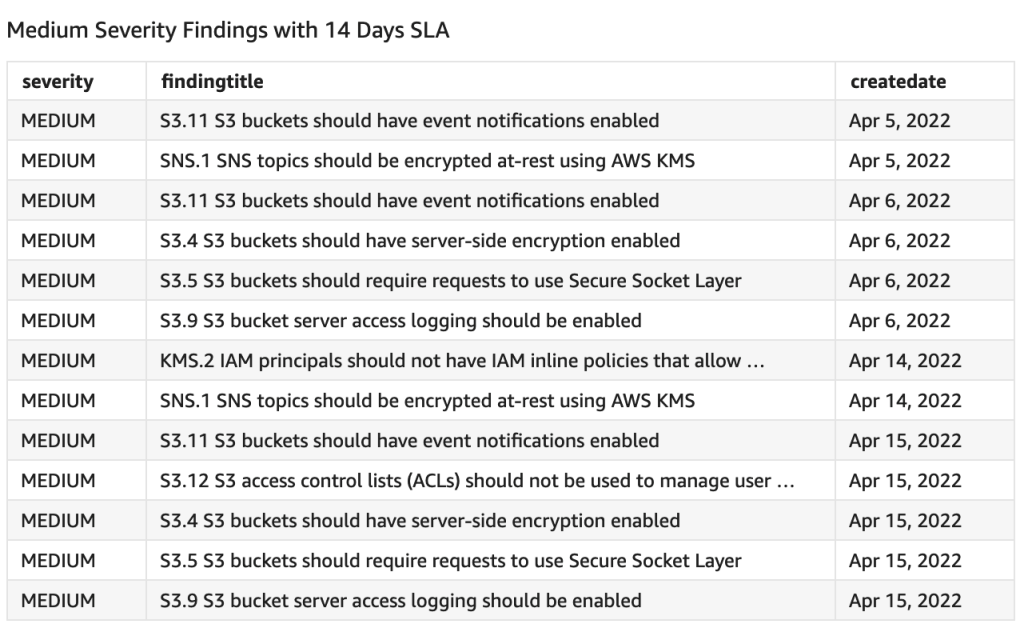
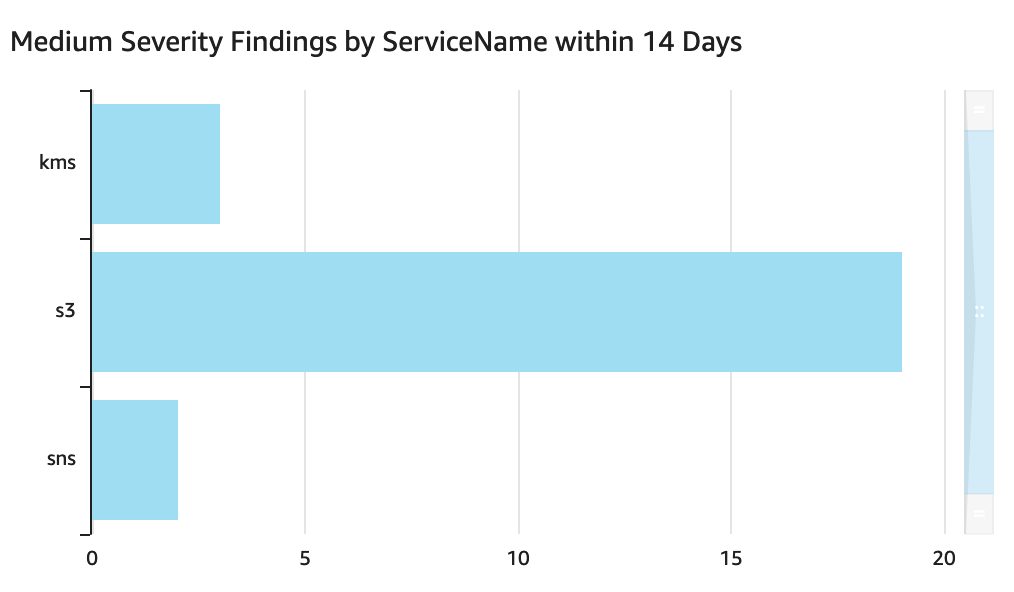
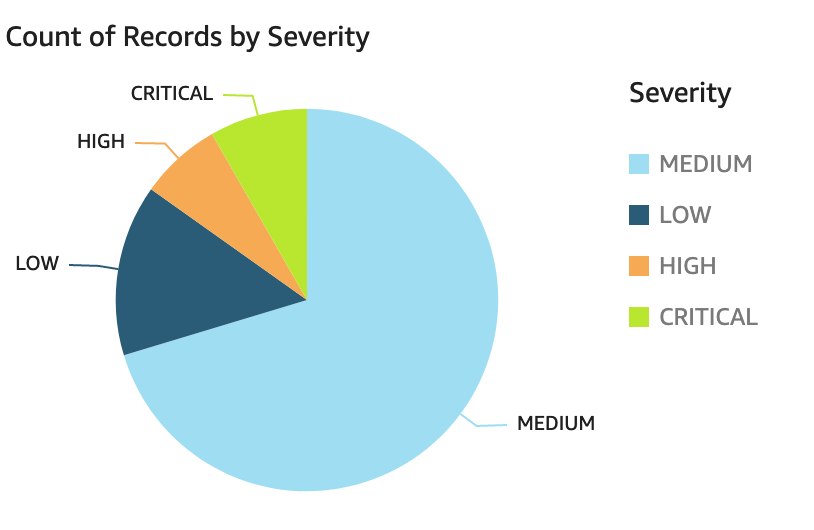
You should now be able to see the dashboard in your QuickSight console, similar to the one in Figure 8. It’s an interactive dashboard that shows you the number of vulnerable packages you have in your repositories and the specific CVEs that come with them. You can navigate to the specific image by selecting the CVE (middle right bar chart) or list images with a specific vulnerable package (bottom right bar chart).
Note: You won’t see the exact same graph as in Figure 8. It will change according to the image you pushed in.
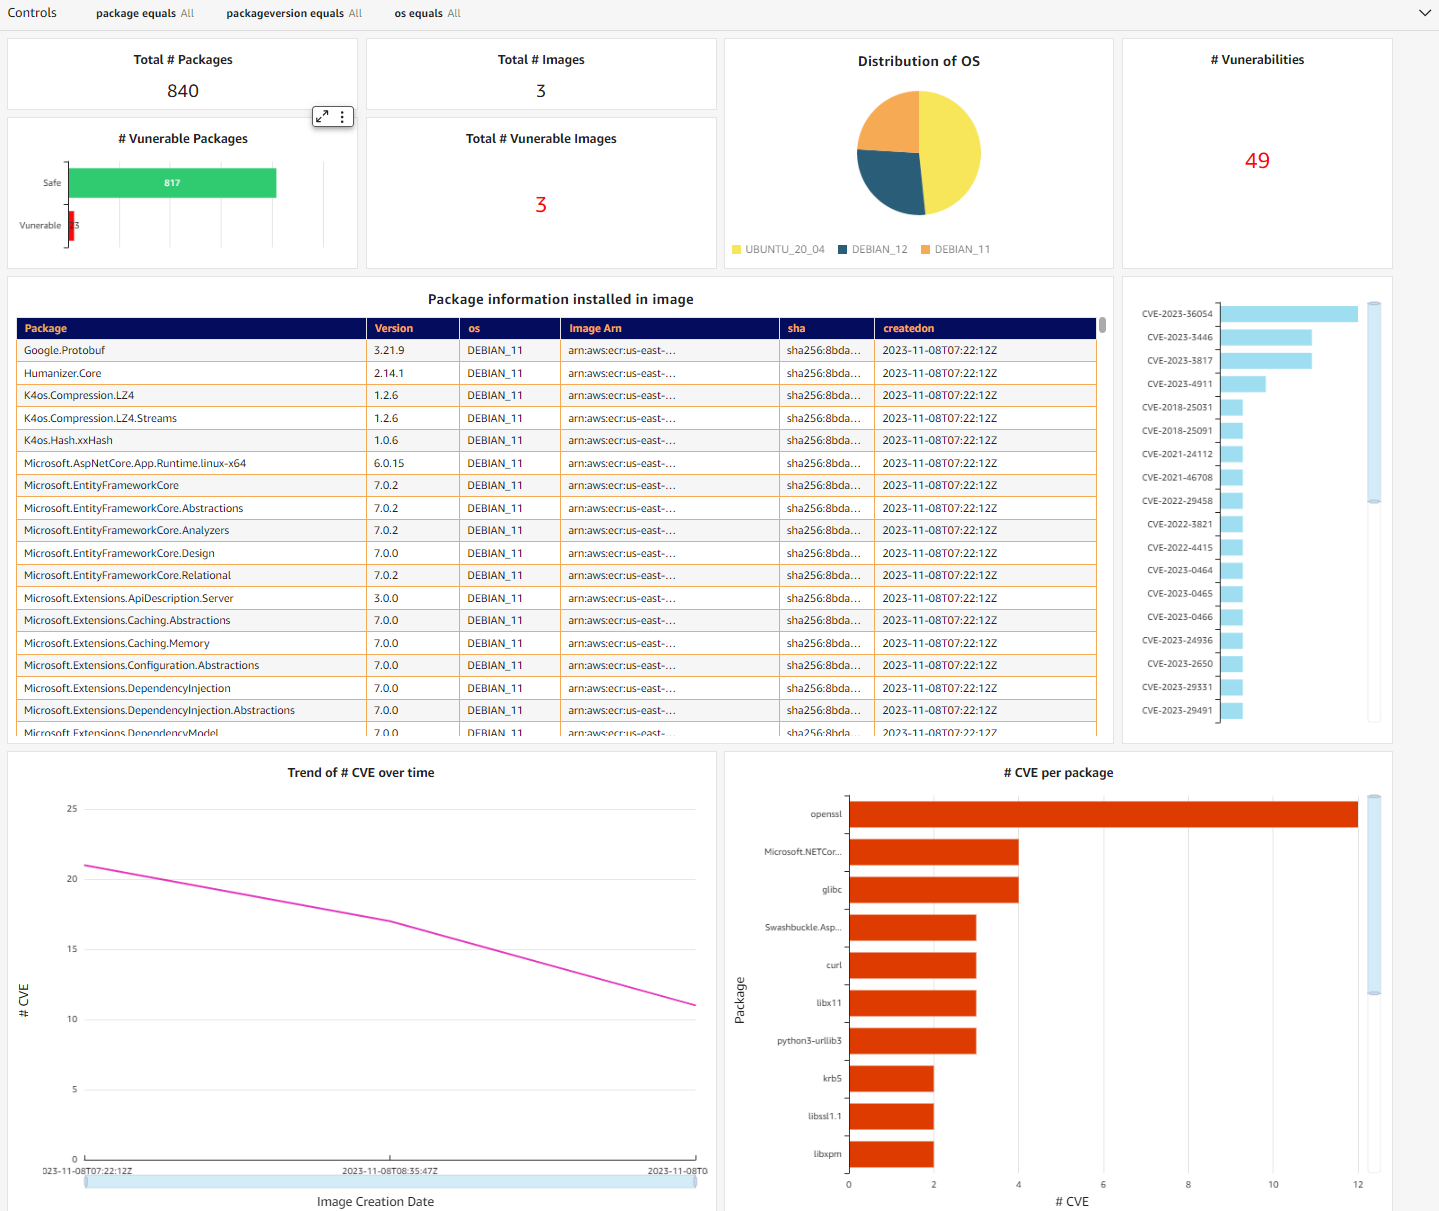
Figure 8: QuickSight dashboard containing SBOM information
Alternatively, you can use QuickSight Q to extract the same information from your dataset through natural language. You will need to create a topic and add the dataset you added earlier. For detailed information on how to create a topic, see the Amazon QuickSight User Guide. After QuickSight Q has completed indexing the dataset, you can start to ask questions about your data.
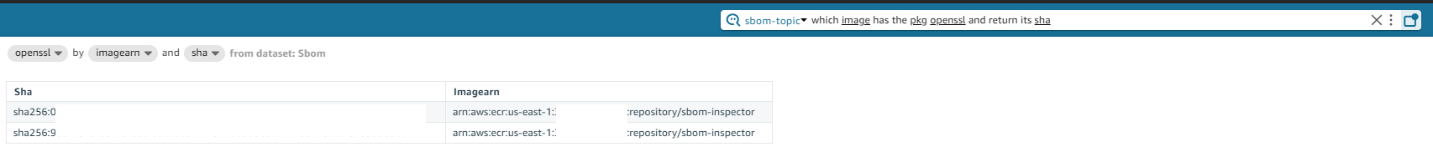
Figure 9: Natural language query with QuickSight Q
Conclusion
This post discussed how you can use Amazon Inspector to export SBOMs to improve software supply chain transparency. Container SBOM export should be part of your supply chain mitigation strategy and monitored in an automated manner at scale.
Although it is a good practice to generate SBOMs, it would provide little value if there was no further analysis being done on them. This solution enables you to visualize your SBOM data through a dashboard and natural language, providing better visibility into your security posture. Additionally, this solution is also entirely serverless, meaning there are no agents or sidecars to set up.
To learn more about exporting SBOMs with Amazon Inspector, see the Amazon Inspector User Guide.
If you have feedback about this post, submit comments in the Comments section below. If you have questions about this post, contact AWS Support.


 Once you create the data source Quicksight lists all the views and tables available under the specified database (in our case it is:- due_eventdb). Select the email_all_events view as data source.
 Select the event data location for analysis. There are mainly two options available which are a/ Import to Spice quicker analysis b/ Directly query your data. Please select the preferred options and then click on “visualize the data”.
 Now that you have selected a data source, you will be taken to a blank quick sight canvas (Blank analysis page) as shown in the following Image, please drag and drop what
  As part of this blog, we have displayed how to create some simple analysis graphs to visualize the engagement events.
 Select all the event dimensions that you want to put it as part of the Table in X axis. Amazon Quicksight table can be extended to show as many as tables columns, this completely depends upon the business requirement how much data marketers want to visualize.
 To create a Quicksight dashboards from the Quicksight analysis click Share menu option at the top right corner then select publish dashboard”. Provide required dashboard name while publishing the dashboard”. Same dashboard can be shared with multiple audiences in the Organization.
 Following is the final version of the dashboard. As mentioned above Quicksight dashboards can be shared with other stakeholders and also complete dashboard can be exported as excel sheet.


