Tag Archives: SLA

Real Life Business Service Monitoring

Post Syndicated from Alexander Petrov-Gavrilov original https://blog.zabbix.com/real-life-business-service-monitoring/24915/

Learn more about Zabbix business service monitoring features and check out our real-life use cases. The article is based on a Zabbix Summit 2022 speech by Aleksandrs Petrovs-Gavrilovs.

Business service monitoring with Zabbix

Hello everyone, my name is Alex and today I am going to write about Advanced business service and SLA monitoring and the related use cases.

Some of you may already be familiar with business services and the core idea behind them. In the vast majority of organizations, we have services that we provide to our customers or/and for internal use. The availability of those services is usually based either on hardware, software or people’s presence and availability. 

But no matter how well our monitoring is configured, there are times when we can miss how each specific device affects our business and that is where business service monitoring can help us.

With the help of business service monitoring it is possible to see what exactly is going on with your business depending on the state of every single part of your infrastructure. This allows us, the admins and service owners, to understand what it really means when a piece of hardware breaks or a device becomes unreachable. With business service monitoring, we see what exactly impacts our business and how severe the situation is, including calculating SLA (Service Level Agreement) and evaluating it against the defined SLO (Service Level Objective).

Business service hierarchy example

So let’s check out some examples of what business real-life business services may look like.

An average service tree example

In this example, we have a service tree that is based on support services. It has phones and phones are plugged into PBX, while PBX is plugged into the switch. And this is just one example, in reality, we could have a more complex infrastructure consisting of containers, CRM services and so on. And we of course monitor all of them, but what if we are interested in the business perspective as well?

To see the business perspective we need to go to the new service section in the main menu, where we can create and view the service tree itself. In addition, in the same section, we can configure the actions, which enable us to react in cases when something happens with one of the services.
We can also specify the SLO we strive to achieve and see SLA reports on the current situation.

Basic service overview

The service view also lets us see if we have problems affecting our services and track their root cause.

Service with active problems

Defining which service is affected by what problem is done by utilizing problem tags, which essentially link them together. Services can also have their own tags, which we use to group services and understand how one service relates to another. We can also use service tags to build an SLA report or execute actions in case a service is affected by a problem. Permissions too are based on service tags, allowing to creation of different views for different users.

But those are just the basics – what’s more interesting are the actual use cases. Let’s take a look at how Zabbix users actually use business service monitoring to their advantage based on real business examples. 

Business service tree for a financial institution

Real business service use cases can be helpful examples that can help you design your own Zabbix business service trees. Maybe you already have a similar business of your own and you need that starting point for everything to “click” – that starting point can be a real-life example.

Example service tree of a bank

The first example will seem a bit convoluted while actually being very straightforward. Here we can see an actual financial institution business service tree. You can see they have quite a lot of different interconnected services. First look at the service tree raw schema may be a bit confusing, but in Zabbix it’s pretty straightforward.

The internal service is connected to emails and emails are related to customer services at the same since we do need to communicate with the customers, not only internally! In addition, we also have to define services representing the underlying systems and applications which support our email services. That is easy to do with Zabbix services.

Easy to read e-mail service state

Imagine now, if you don’t have the services functionality at all, how fast can you check the status of the email service when all you have is only a list of problems for multiple devices? How can you check the service statistics for an entire year? That was the question that the service owners and administrators had in this use case and they solved it by defining Zabbix business service trees.

The “root” service

We start by defining the root business service – Financial institution. It is linked to 15 main services. The 15 services are grouped into internal or external ones. The lower-level services also contain the sub-services that the main services are based on. I.e., we have an Accounting service based on specific VM availability, where the accounting software resides on.

Detailed service tree

The services are divided into specific categories so the service owners can read the situation a lot easier without spending a lot of time figuring out which problem causes which situation. With a single click, the service owners can immediately see which components or child services each service is based on and the actual service SLA. This also gives the benefit of displaying the root cause problem and being able to quickly identify which child services are causing issues with a particular business service.

Parent-Child service relationship

Don’t forget, that the business service trees can be multi-level –  child services can have their own child services and services can also be interconnected with each other. For example – in the Parent-Child service relationship screenshot, we can see that we have an Accounting service. Accounting uses Microsoft services. Microsoft services are also used internally. So what happens when Microsoft services stop working? We will know that accounting will be affected, the internal services will be affected and we will see the exact chain of events – what and how exactly went wrong in the organization and which components need fixing.

Service state configuration

Services can have a varying impact on your business. Some services are more critical than others. Additional rules enable Zabbix to take the potential service impact into account. The first two additional rules analyze the percentage of affected child services and set the severity of the service problem accordingly.
But if the two most critical services are affected, that will immediately become a disaster. For example, online banking – you can imagine that any bank now has an online banking service and if it goes down – all the customers will be affected; it could even hit the news, not only monitoring. So of course they want to immediately know about that kind of a disaster, and with Zabbix services – they will. By defining additional rules and service weights, you can react to problems preemptively and fix the issues before they cause downtime for your end users.

SLA reporting

In Zabbix, we can choose for what periods SLA should be calculated – daily, weekly, monthly, yearly, or a mixed selection of those. Based on our selection, we can see real-time reports for services and as an example, by the end of the year or a day, understand what needs the most attention and review the service performance. Or to put in a closer-to-reality example – find out by accounting reports if the licenses were renewed in time so that the software which is used by accounting is always available.  We can also build a dashboard that will contain the reports, showing what is the current summary for the service so they can plan, buy new software, buy a new license and get new hardware and always be ahead again of whatever might happen.

Service state dashboard

Service permissions in user roles can be used to create different service views. This can be used to hide sensitive service information or simply display the services at the required level of detail. For example, a more detailed view can be provided for internal support users since they will need as much information as possible to fix any service-related issues. Separate views can be provided for Accounting and Management teams, showing only the relevant data to ensure a quick and reliable decision-making process. 

What if we want to make things even more simple for our Accounting and Management teams? We can use actions and scheduled report functionality to deliver the required information to the user’s mailbox without having them periodically log into Zabbix.

Service permissions

Business service tree for an MSP

Another example is an MSP (managed service provider) service tree. This use case is encountered pretty frequently and the tree is always easy to read even in the raw schema view as this:

Manager Service Provider service tree

We use a hosting company for our example. The company provides a particular set of services for its users. There are also some internal services that can also be used by the customers – for example, Zabbix itself.

Zabbix can be a great tool in MSP scenarios since it’s straightforward to provide customers with access to Zabbix and build a dashboard view with the latest statistics related to a particular user.
In this example, we can see the main service which is hosting, divided across customers, where each customer is a branch of that tree, using the hosting services the company provides. We also see that monitoring is a service itself because in this case customers also have the advantage of using Zabbix to get detailed information about the services they use and their current state. Seeing the current level of SLA for the servers they use and does it match the expectations.

Customer overview

The MSP, of course, retains the full view of the customers and all customers are equally important and deserve a proper quality of service so of course each customer will have an equal weight assigned to them. As soon as any customer has a problem, the related service will be marked with a high-level severity on the service tree. This way, the MSP will immediately see which customer is affected, making it possible to assist them as quickly as possible.

If you have a bigger environment – maybe you have hundreds of customers, you may opt out of defining service weights in your configuration since the number of services changes very rapidly. How can we react to global issues then?
We can use percentage rules instead of reacting to just the static weight number. This way, we can check is the problem related to a single customer or is it something global and everyone is now affected.

Root cause view in the services will allow you to start fixing everything immediately. Meanwhile, each customer can be informed individually using the service actions and conditions. This should be easy to do if we have properly named or tagged the services.

Customer service configuration

Don’t forget to define the permissions so that any customer, as Mooyani here, can have access to their Services immediately after login, ensuring that information not only remains private but also relevant for the current user.

Customer view

All information for Customers can be placed on their personal dashboards where they can see all the details whenever they need to. Monitoring the traffic going through their VMs, resource usage, application statuses and any other monitored entities. Don’t forget that service SLA reports can also be placed on Zabbix dashboards. This way your customers can see that the MSP meets the terms defined in the agreement and everything is performing as expected. 

To summarize – monitoring your infrastructure is great from any perspective, including business monitoring. it’s always a good idea to provide this view as an MSP to your customers, so they can see we meet the standards we define for ourselves and course promise for our users.

How to set up and track SLAs for resolving Security Hub findings

Post Syndicated from Maisie Fernandes original https://aws.amazon.com/blogs/security/how-to-set-up-and-track-slas-for-resolving-security-hub-findings/

Your organization can use AWS Security Hub to gain a comprehensive view of your security and compliance posture across your Amazon Web Services (AWS) environment. Security Hub receives security findings from AWS security services and supported third-party products and centralizes them, providing a single view for identifying and analyzing security issues. Security Hub correlates findings and breaks them down into five severity categories: INFORMATIONAL, LOW, MEDIUM, HIGH, and CRITICAL. In this blog post, we provide step-by-step instructions for tracking Security Hub findings in each severity category against service-level agreements (SLAs) through visual dashboards.

SLAs are defined collaboratively by the Business, IT, and Security and Compliance teams within an organization. You can track Security Hub findings against your specific SLAs, and any findings that are in breach of an SLA can be escalated. You can also apply automation to alert the owners of the resources and remediate common security findings to improve your overall security posture.

Prerequisites

Security Hub uses service-linked AWS Config rules to perform security checks behind the scenes. To support these controls, you must enable AWS Config on all accounts, including the administrator and member accounts, in each AWS Region where Security Hub is enabled.

As a best practice, we recommend that you enable AWS Config and Security Hub across all of your accounts and Regions. For more information on how to do this, see Enabling and configuring AWS Config and Setting up Security Hub.

Solution overview

In this solution, you will learn two different ways to track your findings in Security Hub against the pre-defined SLA for each severity category.

Option 1: Use custom insights

Security Hub offers managed insights, which include a collection of related findings that identify a security issue that requires attention and intervention. You can view and take action on the insight findings. In addition to the managed insights, you can create custom insights to track issues and findings related to your resources in your environment.

Create a custom insight for SLA tracking

In this example, you set an SLA of 30 days for HIGH severity findings. This example will provide you with a view of the HIGH severity findings that were generated within the last 30 days and haven’t been resolved.

To create a custom insight to view HIGH severity findings from the last 30 days

  1. In the Security Hub console, in the left navigation pane, choose Insights.
  2. On the Insights page, choose Create insight, as shown in Figure 1.
    Figure 1: Create insight in the Security Hub console

    Figure 1: Create insight in the Security Hub console

  3. On the Create insight page, in the search box, leave the following default filters: Workflow status is NEW, Workflow status is NOTIFIED, and Record state is ACTIVE, as show in Figure 2.
  4. To select the required grouping attribute for the insight, choose the search box to display the filter options. In the search box, choose the following filters and settings:
    1. Choose the Group by filter, and select WorkflowStatus.
      Figure 2: Create insights using filters

      Figure 2: Create insights using filters

    2. Choose the Severity label filter and enter HIGH.
    3. Choose the Created at filter and enter 30 to indicate the number of days you want to set as your SLA.
  5. Choose Create insight again.
  6. For Insight name, enter a meaningful name (for this example, we entered UnresolvedHighSevFindings), and then choose Create insight again.

You can repeat the same steps for other finding severities – CRITICAL, MEDIUM, LOW, and INFORMATIONAL; you can change the number of days you specify for the Created at filter to meet your SLA requirements; or specify different workflow status settings. Note that the workflow status can have the following values:

  • NEW – The initial state of a finding before you review it.
  • NOTIFIED – Indicates that the resource owner has been notified about the security issue.
  • SUPPRESSED – Indicates that you have reviewed the finding and no action is required.
  • RESOLVED – Indicates that the finding has been reviewed and remediated.

Your custom insight will show the findings that meet the criteria you defined. For more information about creating custom insights, see Module 2: Custom Insights in the Security Hub Workshop.

Option 2: Build visualizations for Security Hub findings data by using Amazon QuickSight

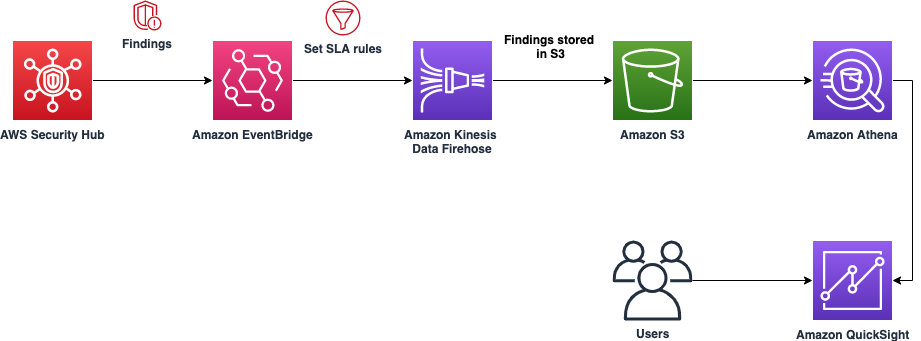
We hear from our customers that your organizations are looking for a solution where you can quickly visualize the status of your Security Hub findings, to see which findings you need to take action on (NEW and NOTIFIED) and which you do not (SUPPRESSED and RESOLVED). You can achieve this by building a data analytics pipeline that uses Amazon EventBridge, Amazon Kinesis Data Firehose, Amazon Simple Storage Service (Amazon S3), Amazon Athena, and Amazon QuickSight. The data analytics pipeline enables you to detect, analyze, contain, and mitigate issues quickly.

This solution integrates Security Hub with EventBridge to set SLA rules to a specified period of your choice for each severity level. For example, you can set the SLA to 5 days for CRITICAL severity findings, 10 days for HIGH severity findings, 14 days for MEDIUM severity findings, 30 days for LOW severity findings, and 60 days for INFORMATIONAL severity findings.

Architecture overview

Figure 3 shows the architectural overview of the QuickSight solution workflow.

Figure 3: Architecture diagram for option 2, the QuickSight solution

Figure 3: Architecture diagram for option 2, the QuickSight solution

In the QuickSight solution, Security Hub publishes the findings to EventBridge, and then an EventBridge rule (based on the SLA) is configured to deliver the findings to Kinesis Data Firehose. For example, if the SLA is 14 days for all MEDIUM severity findings, then those findings will be filtered by the rule and sent to Kinesis Data Firehose. Security Hub findings follow the AWS Security Finding Format (ASFF).

The following is a sample EventBridge rule that filters the Security Hub findings for MEDIUM severity and workflow status NEW, before publishing the findings to Kinesis Data Firehose, and then finally to Amazon S3 for storage. A workflow status of NEW and NOTIFIED should be included to catch all findings that require action.

{
  "source": ["aws.securityhub"],
  "detail-type": ["Security Hub Findings - Imported"],
  "detail": {
    "findings": {
      "Severity": {
        "Label": ["MEDIUM"]
      },
      "Workflow": {
        "Status": ["NEW"]
      }
    }
  }
}

After the findings are exported and stored in Amazon S3, you can use Athena to run queries on the data and you can use Amazon QuickSight to display the findings that violate your organization’s SLA. With Athena, you can create views of the original table as a logical table. You can also create a view for CRITICAL, HIGH, MEDIUM, LOW, and INFORMATIONAL severity findings.

For details about how to export findings and build a dashboard, see the blog post How to build a multi-Region AWS Security Hub analytic pipeline and visualize Security Hub data.

Visualize an SLA by using QuickSight

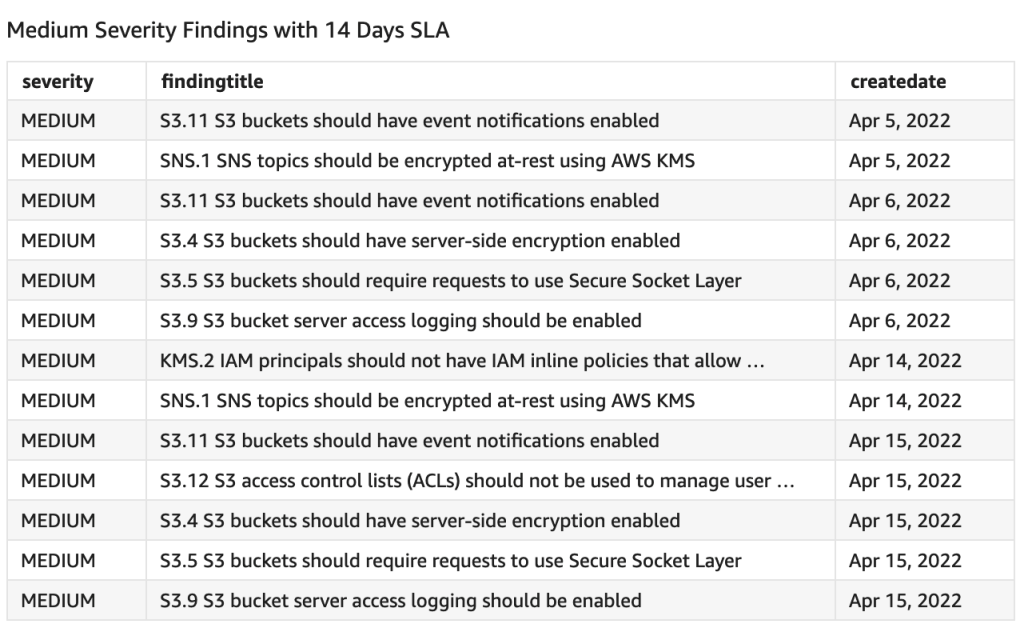
The QuickSight dashboard shown in Figure 4 is an example that shows all the MEDIUM severity findings that should be resolved within a 14 day SLA.

Figure 4: QuickSight table showing medium severity findings over a 14-day SLA

Figure 4: QuickSight table showing medium severity findings over a 14-day SLA

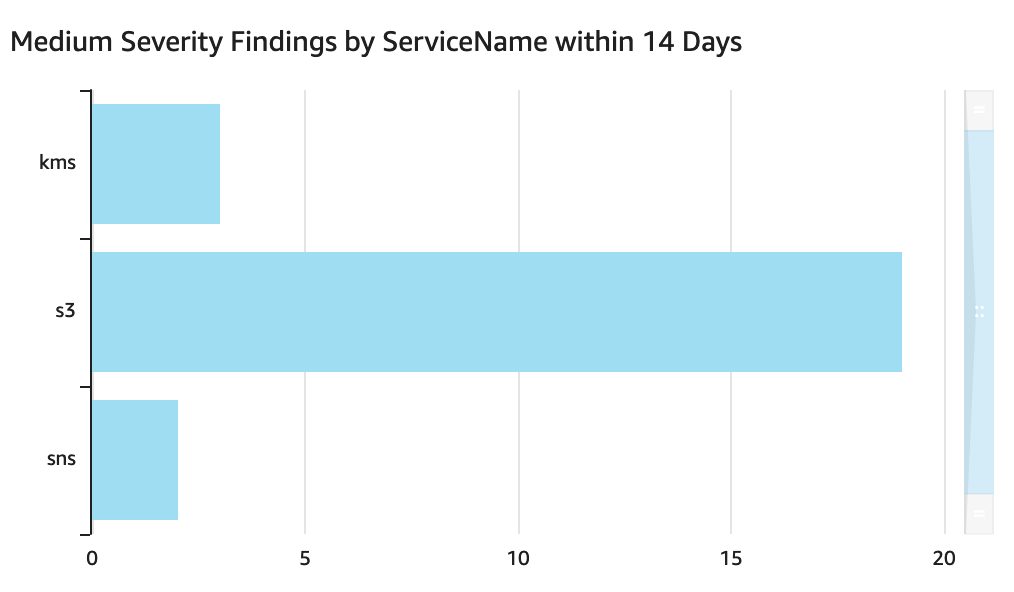
Using QuickSight, you can create different types of data visualizations to represent the exported Security Hub findings, which enables the decision makers in your organization to explore and interpret information in an interactive visual environment. For example, Figure 5 shows findings categorized by service.

Figure 5: QuickSight visual showing MEDIUM severity findings for each service

Figure 5: QuickSight visual showing MEDIUM severity findings for each service

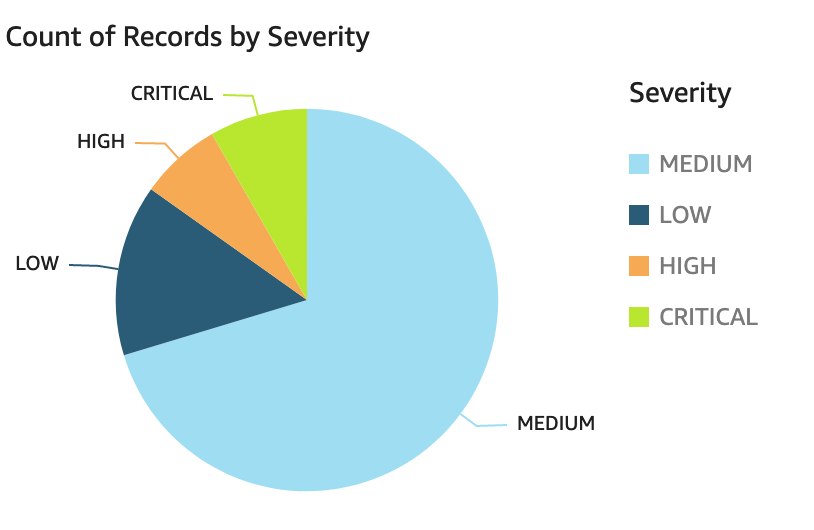
As another example, Figure 6 shows findings categorized by severity.

Figure 6: QuickSight visual showing findings by severity

Figure 6: QuickSight visual showing findings by severity

For more information about visualizing Security Hub findings by using Amazon OpenSearch Service and Kibana, see the blog post Visualize Security Hub Findings using Analytics and Business Intelligence Tools.

Changing a finding’s severity

Over time, your organization might discover that there are certain findings that should be tracked at a lower or higher severity level than what is auto-generated from Security Hub. You can implement EventBridge rules with AWS Lambda functions to automatically update the severity of the findings as soon as they are generated.

To automate the finding severity change

  1. On the EventBridge console, create an EventBridge rule. For detailed instructions, see Getting started with Amazon EventBridge.
    Figure 7: Create an EventBridge rule in the console

    Figure 7: Create an EventBridge rule in the console

  2. Define the event pattern, including the finding generator ID or any other identifying fields for which you want to redefine the severity. Review the fields in the format, and choose your desired filters. The following is a sample of the event pattern.
    {
      "source": ["aws.securityhub"],
      "detail-type": ["Security Hub Findings - Imported"],
      "detail": {
        "findings": {
            "GeneratorId": [
            "aws-foundational-security-best-practices/v/1.0.0/S3.4"
                        ],
          "RecordState": ["ACTIVE"],
          "Workflow": {
            "Status": ["NEW"]
          }
        }
      }
    }

  3. Specify the target as a Lambda function that will host the code to update the finding severity.
    Figure 8: Select a target Lambda function

    Figure 8: Select a target Lambda function

  4. In the Lambda function, use the BatchUpdateFindings API action to update the severity label as desired.

    The following example Lambda code will update finding severity to INFORMATIONAL. This function requires Amazon CloudWatch write permissions, and requires permissions to invoke the Security Hub API action BarchUpdateFindings.

    import logging
    import json, boto3
    import botocore.exceptions as boto3exceptions
    
    logger = logging.getLogger()
    logger.setLevel(os.environ.get('LOGLEVEL', 'INFO').upper())
    
    def lambda_handler(event, context):
        
        finding_id = ""
        product_arn = ""
        
        logger.info(event)
        
        for finding in event['detail']['findings']:
            
            #determine and log this Finding's ID
            finding_id = finding["Id"]
            product_arn = finding["ProductArn"]
            logger.info("Finding ID: " + finding_id)
            
        
            #determine and log this Finding's resource type
            resource_type = finding["Resources"][0]["Type"]
            logger.info("Resource Type is: " + resource_type)
    
            try:
                sec_hub_client = boto3.client('securityhub')
                response = sec_hub_client.batch_update_findings(
                    FindingIdentifiers=[
                    {
                        'Id': finding_id,
                        'ProductArn': product_arn
                    }
                    ],
                        Severity={"Label": "INFORMATIONAL"}
        
                    )
    
            except boto3exceptions.ClientError as error:
                logger.exception(f"Client error invoking batch update findings {error}")
            except boto3exceptions.ParamValidationError as error:
                logger.exception(f"The parameters you provided are incorrect: {error}")
    
        return {"statusCode": 200}

  5. The finding is generated with a new severity level, as updated in the Lambda function. For example, Figure 9 shows a finding that is generated as MEDIUM by default, but the configured EventBridge rule and Lambda function update the severity level to INFORMATIONAL.
    Figure 9: Security Hub findings generated with updated severity level

    Figure 9: Security Hub findings generated with updated severity level

Conclusion

This blog post walked you through two different solutions for setting up and tracking the SLAs for the findings generated by Security Hub. Reporting Security Hub findings for a given SLA in a dashboard view can help you prioritize findings and track whether findings are being remediated on time. This post also provided example code that you can use to modify the Security Hub severity for a specific finding. To further extend the solution and enable custom actions to remediate the findings, see the following:

 
If you have feedback about this post, submit comments in the Comments section below. If you have questions about this post, contact AWS Support.

Want more AWS Security news? Follow us on Twitter.

Maisie Fernandes

Maisie Fernandes

Maisie is a Senior Solutions Architect at AWS based in London. She is focused on helping public sector customers design, build, and secure scalable applications on AWS. Outside of work, Maisie enjoys traveling, running, and gardening.

Krati Singh

Krati Singh

Krati is a Senior Solutions Architect at AWS based in San Francisco Bay Area. She collaborates with small and medium business customers on their cloud journey and is passionate about security in the cloud. Outside of work, Krati enjoys reading, and an occasional hike on a nice weather day.

What’s Up, Home? – Zabbix the Weatherman

Post Syndicated from Janne Pikkarainen original https://blog.zabbix.com/whats-up-home-zabbix-the-weatherman/20897/

This week, I advanced my project on multiple fronts, so welcome to this little smorgasbord of different topics. In my future posts, I will go deeper into each topic as my project goes forward.

Zabbix the weatherman

Let me begin with a monitoring blooper.

As Zabbix has very well-working forecast/prediction functions for your usual IT capacity trending, I tried what happens if I let it predict the outdoor temperature based on recent temperatures. On my first try, this did not go as I planned.

You see, currently, here in Finland the temperatures change a lot during a 24 hours period: from nightly -10C or below temperatures to maybe +5C to +10C during the day. As I asked Zabbix to predict the weather based only on one hour of data one day ago, this did not go as planned.

OK, clearly the one hour worth of data was too little. What if ask Zabbix to base its forecast on one week worth of data?

The prediction slightly improves — at least it won’t predict a nuclear winter anymore — but only slightly. Zabbix in its little mind has no idea that the weather could get warmer due to the springtime. Or, in case Zabbix was right, I’ll let you know in a week.

Average data for Joe Average

As my monitoring setup collects more data, one thing I can get out of it will be averages. What’s the average temperature? What’s the average for this and that?

Above shows the average data for the last 24 hours, and on my Grafana dashboard the values change dynamically based on the time period I choose on it.

Who wouldn’t need home SLA reports?

Everybody knows how The Suits love their reports. I have this mental image where I think during their mornings they are like

[x] coffee
[x] warm bread
[x] orange juice
[x] classical music
[x] latest reports

And oh dear, their morning is ruined if the [x] is missing from the last entry. Poor Suits.

Anyway, as the recent Zabbix 6.0 brought us revamped Business Services Monitoring, why not use it for home monitoring, too? This part includes very much work in progress, but I will show you the current results.

When I’m finished, each room will be configured as its own Business Service. For now, I only have entered the room names and some other stuff. There is only one room with some actual content, for now, and it’s our bedroom. What happens if I click on it?

I will get to see if the lights and temperature are OK, both from a technical standpoint and for their values. In case the status would not be OK, the root cause column would show me the reason why everything is not OK — though I would not need to click my way this far, the data would be shown on the previous page already.

As for SLAs (Service Level Agreement, for example, if you promise that your service will be available 99.9% of the time, it better be or your customer will be a sad panda and yell at you), those are also a work in progress. Zabbix can be let to generate daily/weekly/whatever SLA reports for any of the configured Business Services. I have yet to build them, but I have one for my home router already.

Come on, it’s sunny, let’s go out, Zabbix!

True story: this morning my wife asked that could I add pollen monitoring to Zabbix. My non-technical wife is getting excited about home monitoring, too! (I think she’s only pretending. Still AWESOME!)
I still need to add pollen monitoring — the data is available as open data — but I initialized The Great Outdoors Monitoring in two other areas.

Where’s my train?

Just before creating this post, I proved to myself that I can show live train data on Grafana. I sure got a screenful, as I have not played around with GraphQL too much, and for now, I got way more trains than I planned to get, and the data contains extra fields I need to filter out with Grafana’s Organise Fields. Still, connection established! Wooooo!

What’s for lunch?

Only added one lunch restaurant for now, but in theory, I will receive an alert whenever the restaurant posts its new weekly lunch menu. Zabbix is configured to be a good netizen though and it will only try to fetch the menu every one hour on Monday morning, no point to poll them all week, so let’s see how this will work.

That’s all for now. See you next week!

I have been working at Forcepoint since 2014 and I am a walking monitoring unit. — Janne Pikkarainen

* Please note, that this blog post was originally written a few months ago, in early Spring, and the temperature records do not correspond to the actual weather at the time of publication.

The post What’s Up, Home? – Zabbix the Weatherman appeared first on Zabbix Blog.