Post Syndicated from Jen Sells original https://blog.cloudflare.com/using-analytics-engine-to-improve-analytics-engine/


Workers Analytics Engine is a new tool, announced earlier this year, that enables developers and product teams to build time series analytics about anything, with high dimensionality, high cardinality, and effortless scaling. We built Analytics Engine for teams to gain insights into their code running in Workers, provide analytics to end customers, or even build usage based billing.
In this blog post we’re going to tell you about how we use Analytics Engine to build Analytics Engine. We’ve instrumented our own Analytics Engine SQL API using Analytics Engine itself and use this data to find bugs and prioritize new product features. We hope this serves as inspiration for other teams who are looking for ways to instrument their own products and gather feedback.
Why do we need Analytics Engine?
Analytics Engine enables you to generate events (or “data points”) from Workers with just a few lines of code. Using the GraphQL or SQL API, you can query these events and create useful insights about the business or technology stack. For more about how to get started using Analytics Engine, check out our developer docs.
Since we released the Analytics Engine open beta in September, we’ve been adding new features at a rapid clip based on feedback from developers. However, we’ve had two big gaps in our visibility into the product.
First, our engineering team needs to answer classic observability questions, such as: how many requests are we getting, how many of those requests result in errors, what are the nature of these errors, etc. They need to be able to view both aggregated data (like average error rate, or p99 response time) and drill into individual events.
Second, because this is a newly launched product, we are looking for product insights. By instrumenting the SQL API, we can understand the queries our customers write, and the errors they see, which helps us prioritize missing features.
We realized that Analytics Engine would be an amazing tool for both answering our technical observability questions, and also gathering product insight. That’s because we can log an event for every query to our SQL API, and then query for both aggregated performance issues as well as individual errors and queries that our customers run.
In the next section, we’re going to walk you through how we use Analytics Engine to monitor that API.
Adding instrumentation to our SQL API
The Analytics Engine SQL API lets you query events data in the same way you would an ordinary database. For decades, SQL has been the most common language for querying data. We wanted to provide an interface that allows you to immediately start asking questions about your data without having to learn a new query language.
Our SQL API parses user SQL queries, transforms and validates them, and then executes them against backend database servers. We then write information about the query back into Analytics Engine so that we can run our own analytics.
Writing data into Analytics Engine from a Cloudflare Worker is very simple and explained in our documentation. We instrument our SQL API in the same way our users do, and this code excerpt shows the data we write into Analytics Engine:
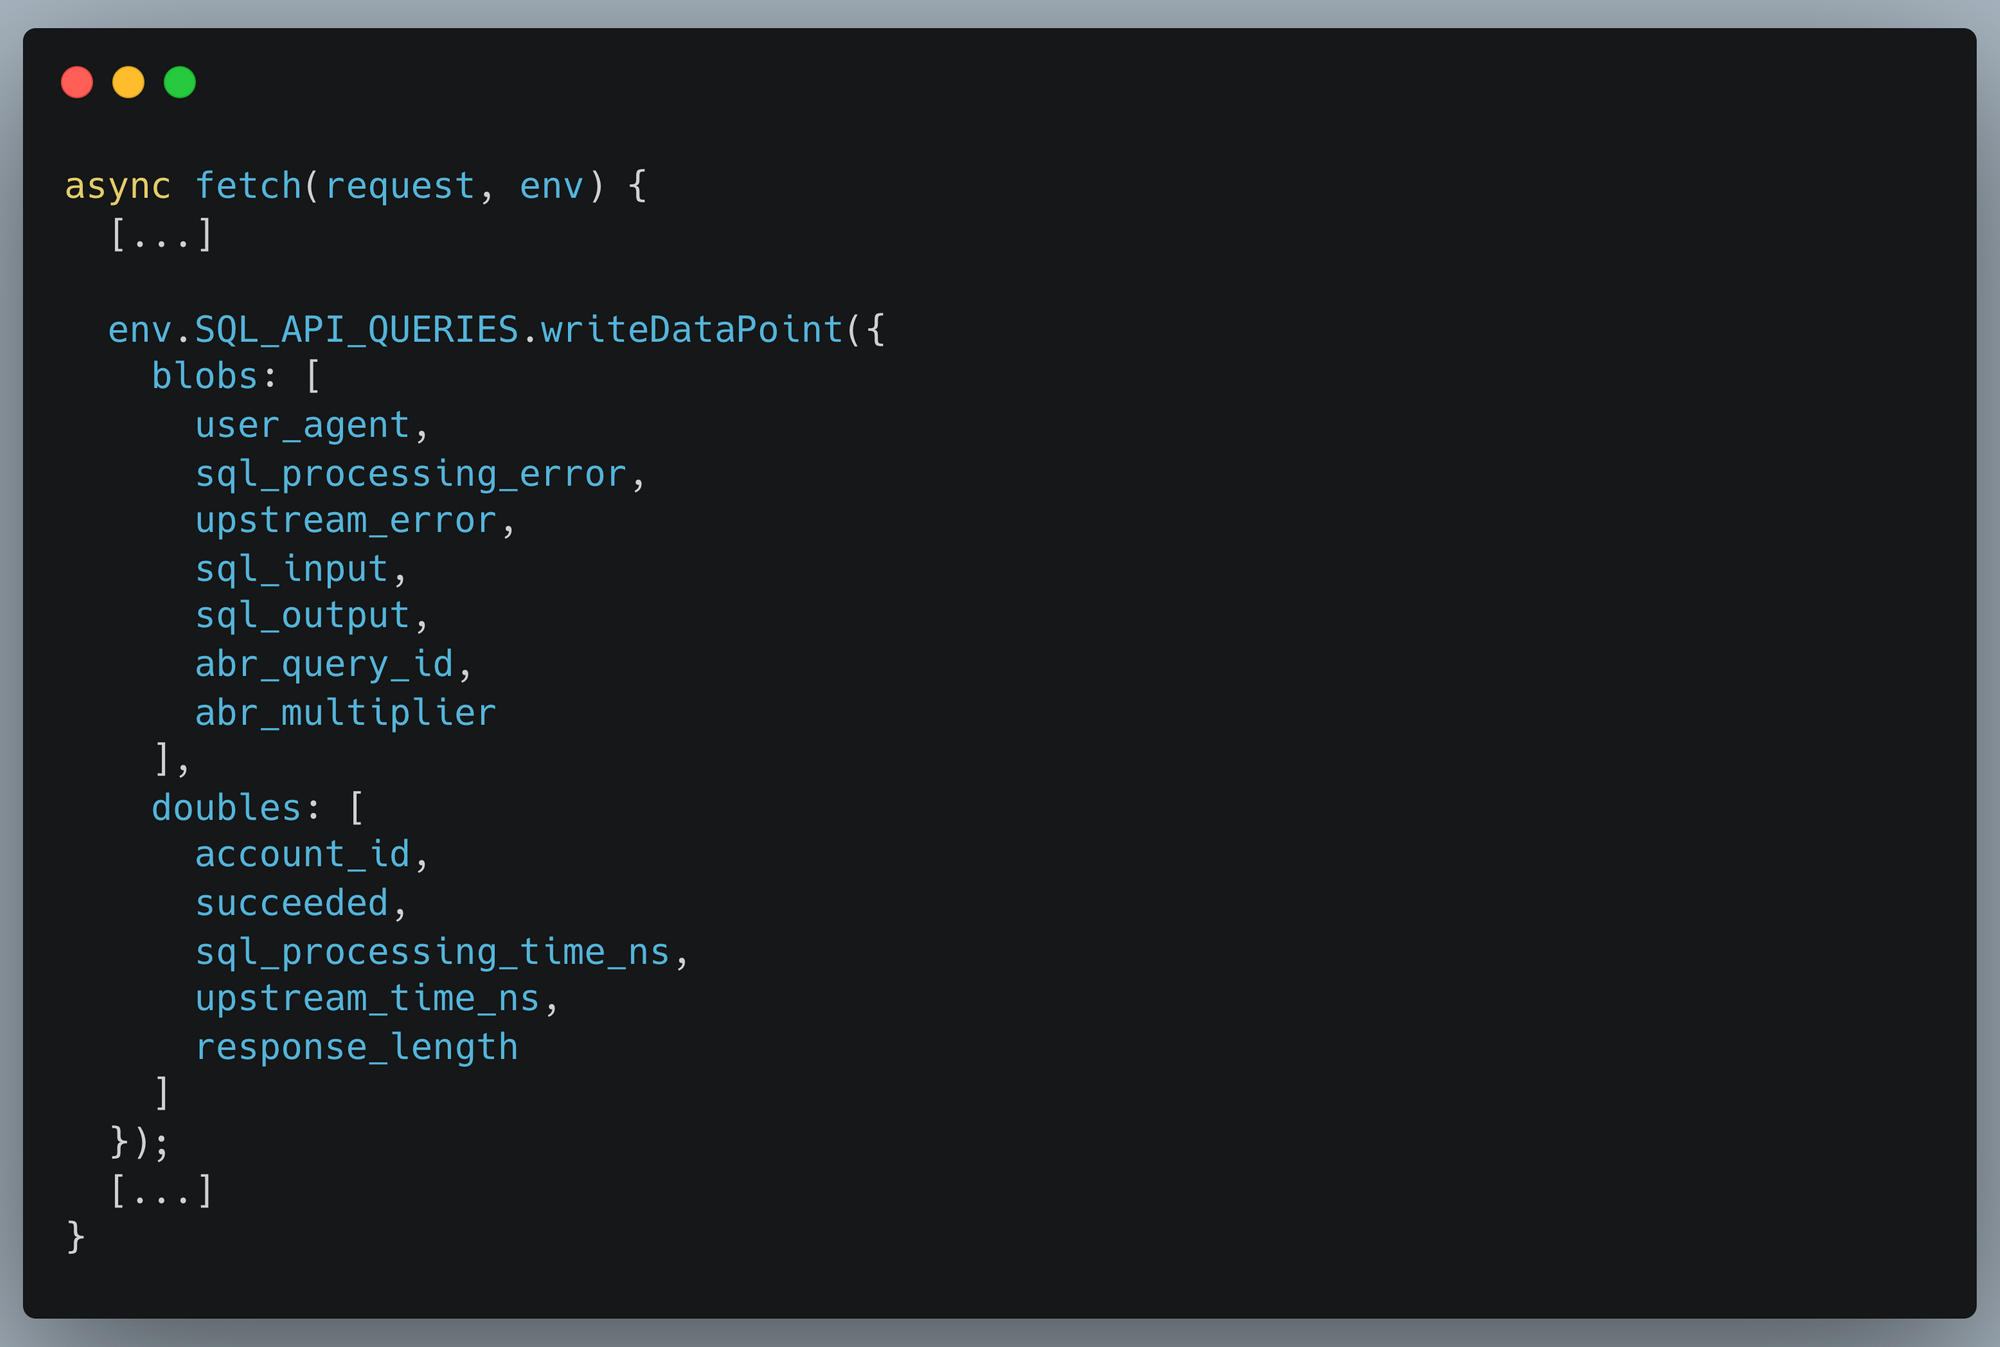
With that data now being stored in Analytics Engine, we can then pull out insights about every field we’re reporting.
Querying for insights
Having our analytics in an SQL database gives you the freedom to write any query you might want. Compared to using something like metrics which are often predefined and purpose specific, you can define any custom dataset desired, and interrogate your data to ask new questions with ease.
We need to support datasets comprising trillions of data points. In order to accomplish this, we have implemented a sampling method called Adaptive Bit Rate (ABR). With ABR, if you have large amounts of data, your queries may be returned sampled events in order to respond in reasonable time. If you have more typical amounts of data, Analytics Engine will query all your data. This allows you to run any query you like and still get responses in a short length of time. Right now, you have to account for sampling in how you make your queries, but we are exploring making it automatic.
Any data visualization tool can be used to visualize your analytics. At Cloudflare, we heavily use Grafana (and you can too!). This is particularly useful for observability use cases.
Observing query response times
One query we pay attention to gives us information about the performance of our backend database clusters:
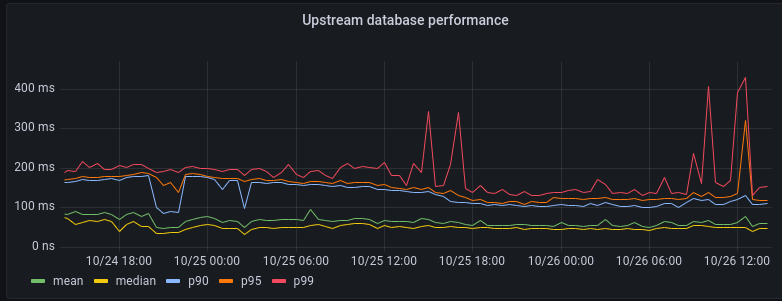
As you can see, the 99% percentile (corresponding to the 1% most complex queries to execute) sometimes spikes up to about 300ms. But on average our backend responds to queries within 100ms.
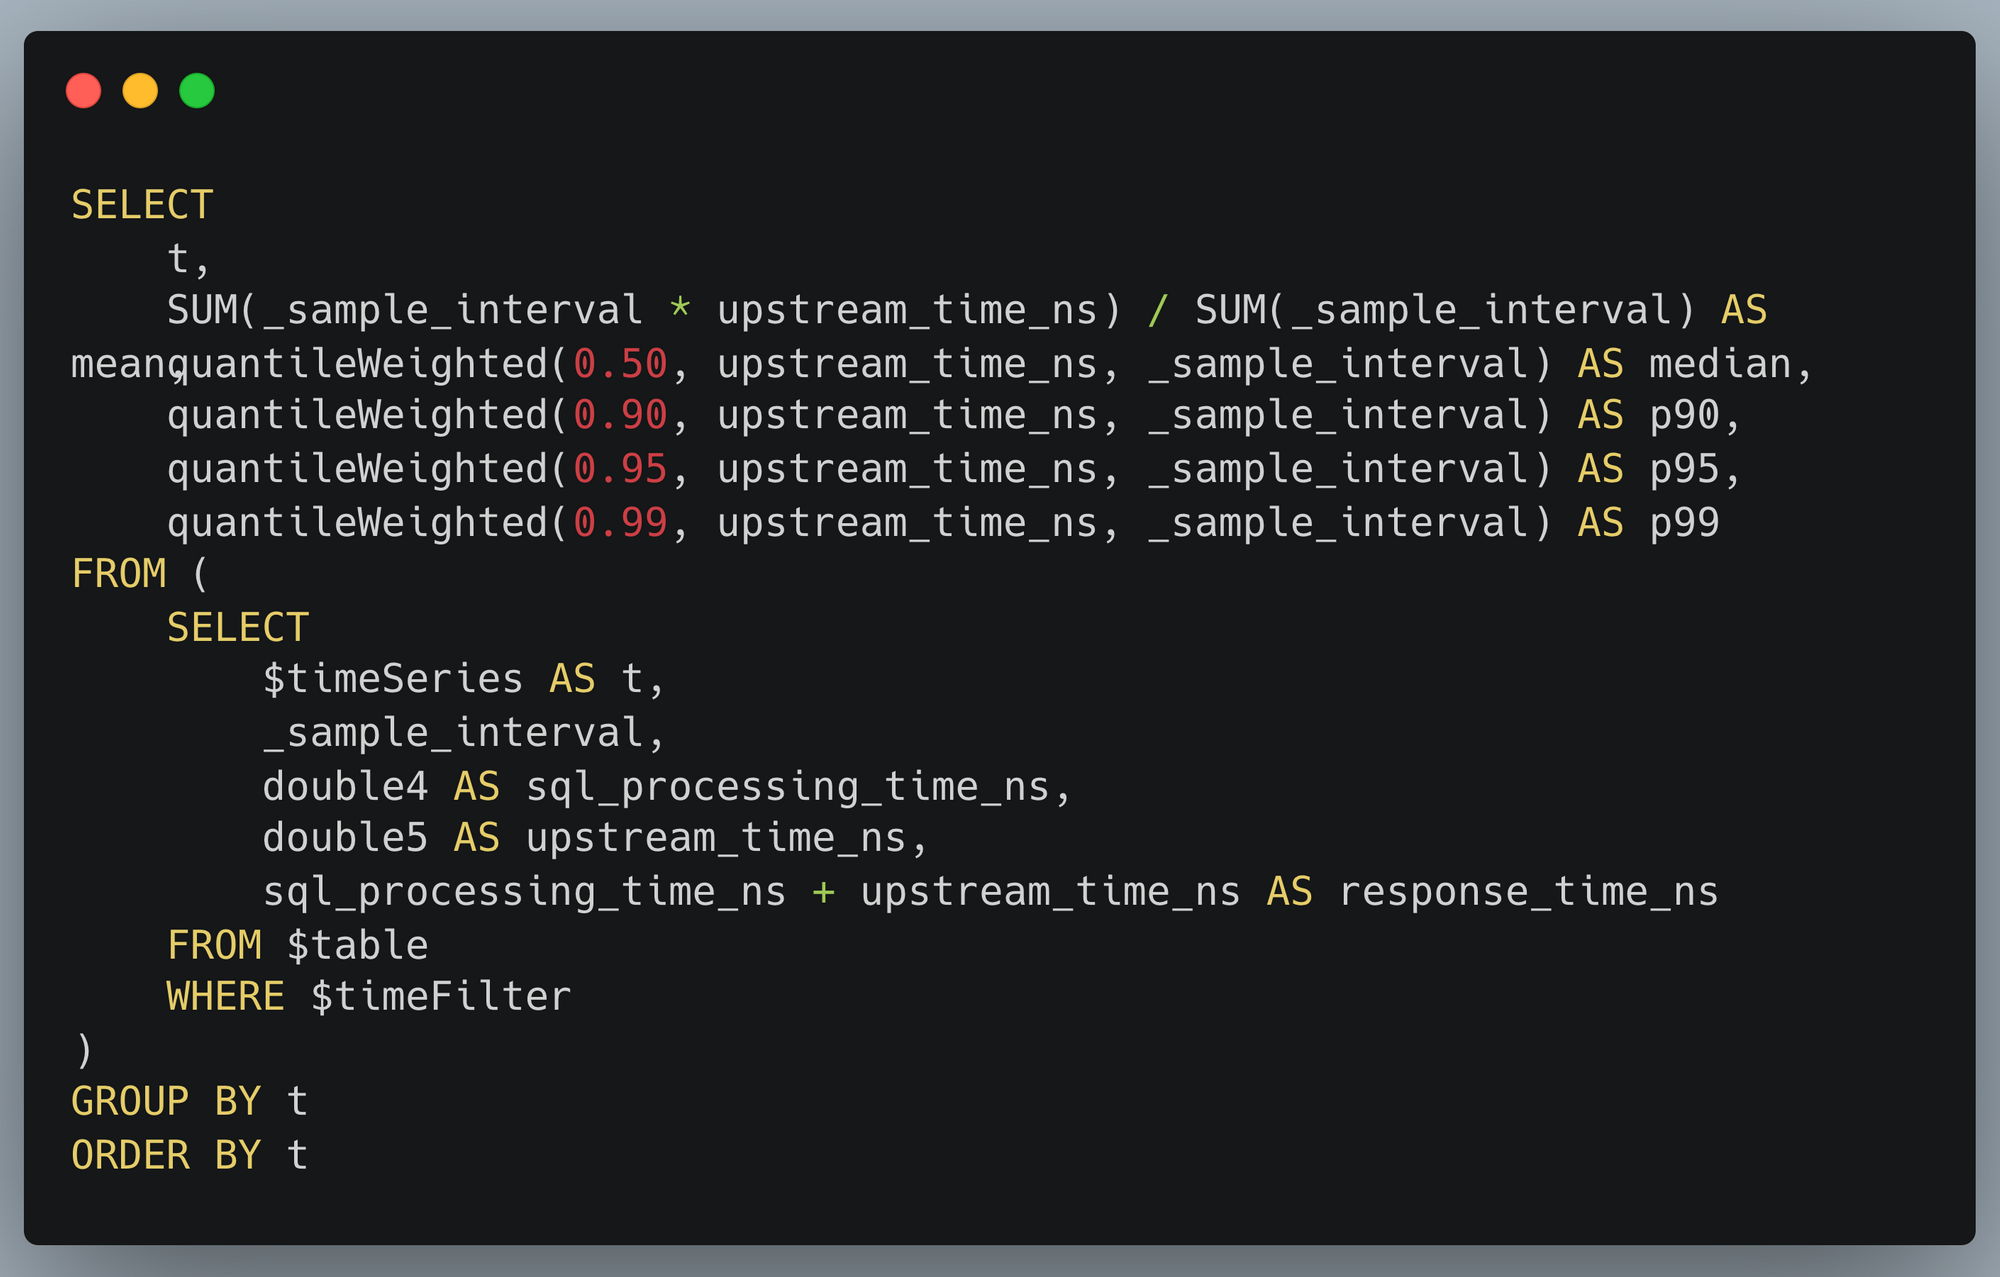
This visualization is itself generated from an SQL query:
Customer insights from high-cardinality data
Another use of Analytics Engine is to draw insights out of customer behavior. Our SQL API is particularly well-suited for this, as you can take full advantage of the power of SQL. Thanks to our ABR technology, even expensive queries can be carried out against huge datasets.
We use this ability to help prioritize improvements to Analytics Engine. Our SQL API supports a fairly standard dialect of SQL but isn’t feature-complete yet. If a user tries to do something unsupported in an SQL query, they get back a structured error message. Those error messages are reported into Analytics Engine. We’re able to aggregate the kinds of errors that our customers encounter, which helps inform which features to prioritize next.
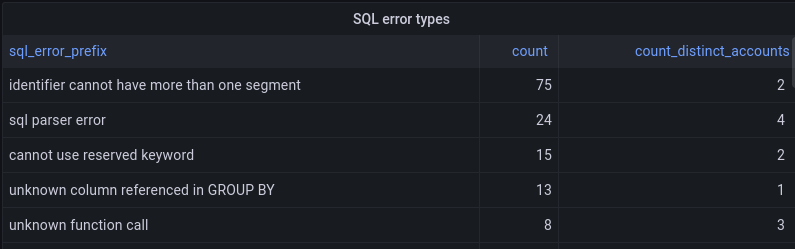
The SQL API returns errors in the format of type of error: more details, and so we can take the first portion before the colon to give us the type of error. We group by that, and get a count of how many times that error happened and how many users it affected:
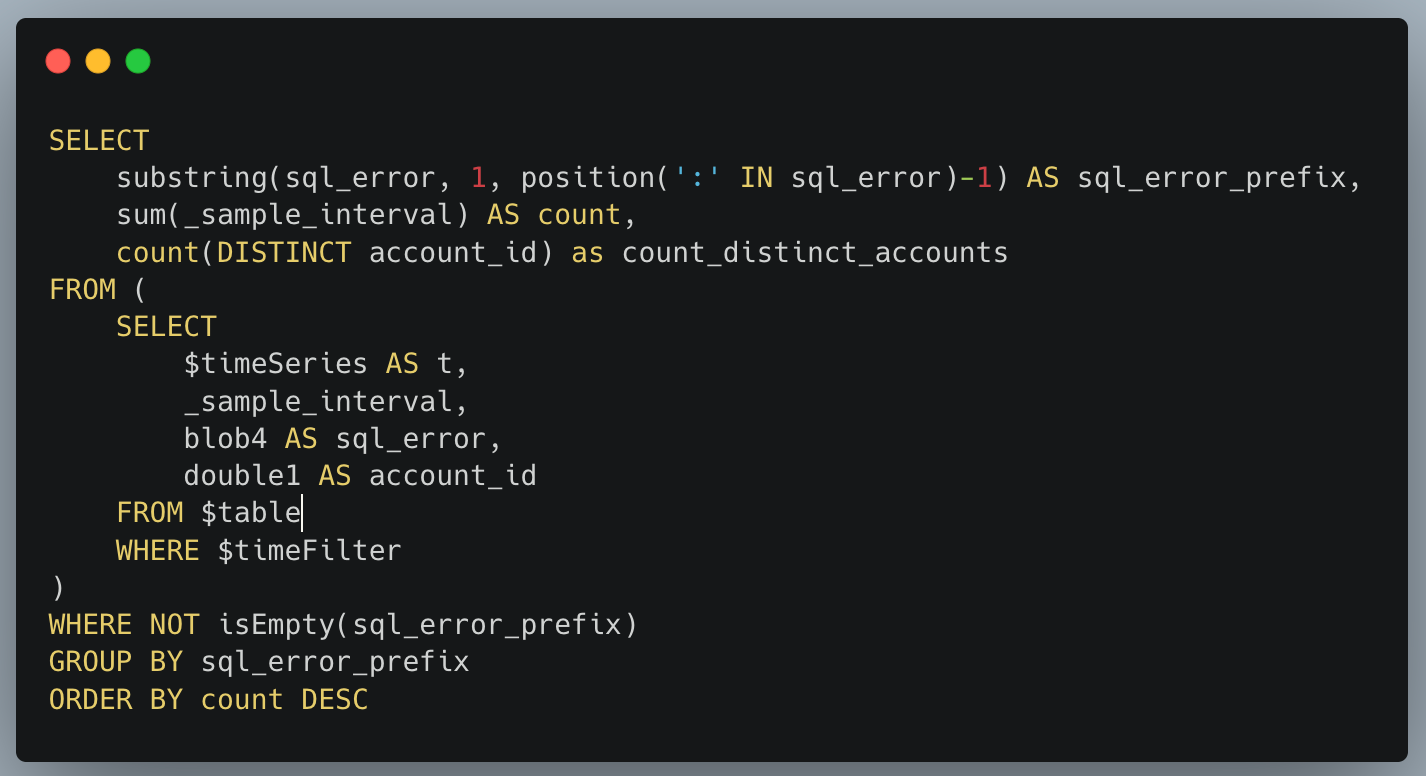
To perform the above query using an ordinary metrics system, we would need to represent each error type with a different metric. Reporting that many metrics from each microservice creates scalability challenges. That problem doesn’t happen with Analytics Engine, because it’s designed to handle high-cardinality data.
Another big advantage of a high-cardinality store like Analytics Engine is that you can dig into specifics. If there’s a large spike in SQL errors, we may want to find which customers are having a problem in order to help them or identify what function they want to use. That’s easy to do with another SQL query:
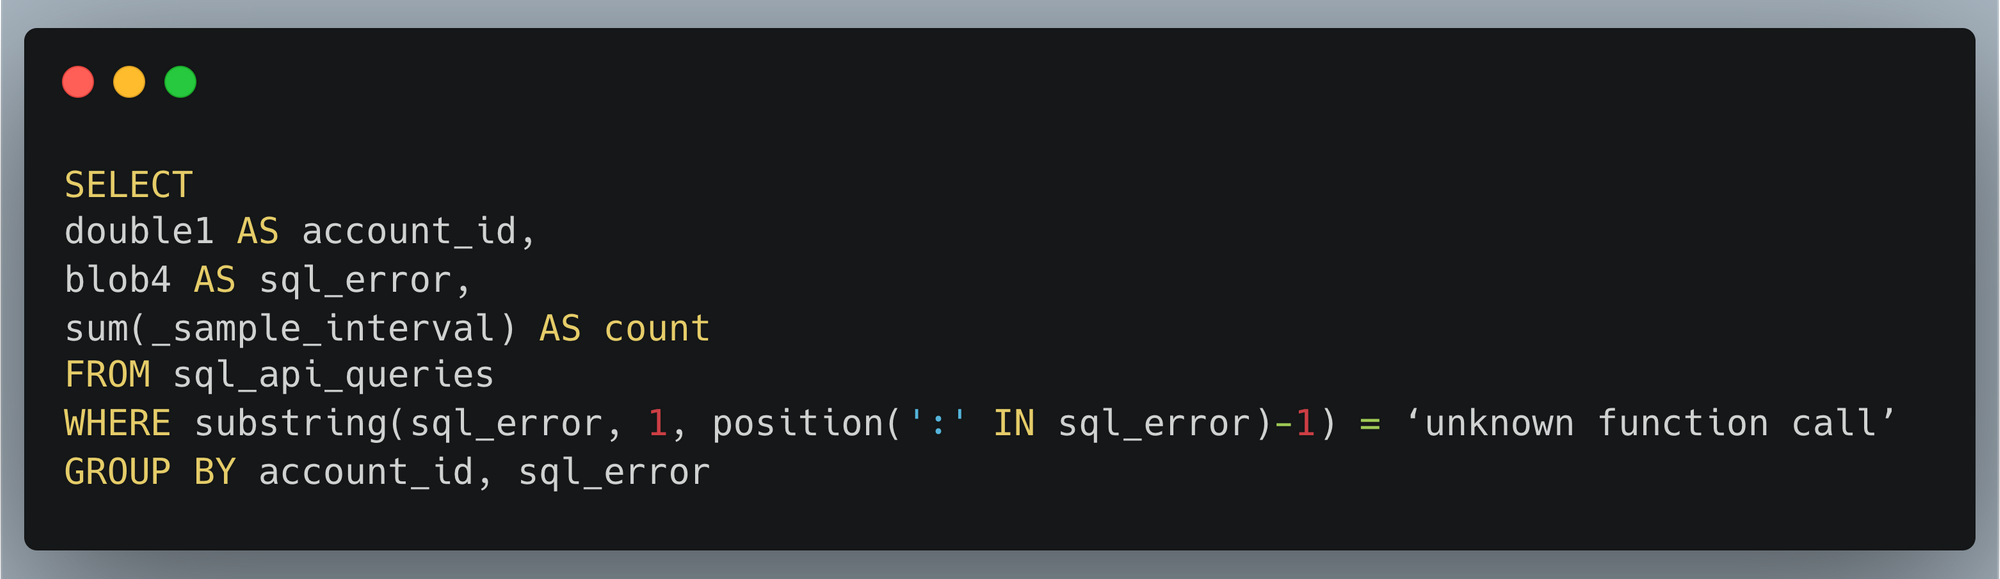
Inside Cloudflare, we have historically relied on querying our backend database servers for this type of information. Analytics Engine’s SQL API now enables us to open up our technology to our customers, so they can easily gather insights about their services at any scale!
Conclusion and what’s next
The insights we gathered about usage of the SQL API are a super helpful input to our product prioritization decisions. We already added support for substring and position functions which were used in the visualizations above.
Looking at the top SQL errors, we see numerous errors related to selecting columns. These errors are mostly coming from some usability issues related to the Grafana plugin. Adding support for the DESCRIBE function should alleviate this because without this, the Grafana plugin doesn’t understand the table structure. This, as well as other improvements to our Grafana plugin, is on our roadmap.
We also can see that users are trying to query time ranges for older data that no longer exists. This suggests that our customers would appreciate having extended data retention. We’ve recently extended our retention from 31 to 92 days, and we will keep an eye on this to see if we should offer further extension.
We saw lots of errors related to common mistakes or misunderstandings of proper SQL syntax. This indicates that we could provide better examples or error explanations in our documentation to assist users with troubleshooting their queries.
Stay tuned into our developer docs to be informed as we continue to iterate and add more features!
You can start using Workers Analytics Engine Now! Analytics Engine is now in open beta with free 90-day retention. Start using it today or join our Discord community to talk with the team.