All posts by Adnan Bilwani

Fine-tuning Operations at Slice using AWS DevOps Guru

Post Syndicated from Adnan Bilwani original https://aws.amazon.com/blogs/devops/fine-tuning-operations-at-slice-using-aws-devops-guru/

This guest post was authored by Sapan Jain, DevOps Engineer at Slice, and edited by Sobhan Archakam and Adnan Bilwani, at AWS.

Slice empowers over 18,000 independent pizzerias with the modern tools that have grown the major restaurant chains. By uniting these small businesses with specialized technology, marketing, data insights, and shared services, Slice enables them to serve their digitally-minded customers and move away from third-party apps. Using Amazon DevOps Guru, Slice is able to fine-tune their operations to better support these customers.

Serial tech entrepreneur Ilir Sela started Slice to modernize and support his family’s New York City pizzerias. Today, the company partners with restaurants in 3,000 cities and all 50 states, forming the nation’s largest pizza network. For more information, visit slicelife.com.

Slice’s challenge

At Slice, we manage a wide variety of systems, services, and platforms, all with varying levels of complexity. Observability, monitoring, and log aggregation are things we excel at, and they’re always critical for our platform engineering team. However, deriving insights from this data still requires some manual investigation, particularly when dealing with operational anomalies and/or misconfigurations.

To gain automated insights into our services and resources, Slice conducted a proof-of-concept utilizing Amazon DevOps Guru to analyze a small selection of AWS resources. Amazon DevOps Guru identified potential issues in our environment, resulting in actionable insights (ultimately leading to remediation). As a result of this analysis, we enabled Amazon DevOps Guru account-wide, thereby leading to numerous insights into our production environment.

Insights with Amazon DevOps Guru

After we configured Amazon DevOps Guru to begin its account-wide analysis, we left the tool alone to begin the process of collecting and analyzing data. We immediately began seeing some actionable insights for various production AWS resources, some of which are highlighted in the following section:

Amazon DynamoDB Point-in-time recovery

Amazon DynamoDB offers a point-in-time recovery (PITR) feature that provides continuous backups of your DynamoDB data for 35 days to help you protect against accidental write or deletes. If enabled, this lets you restore your respective table to a previous state. Amazon DevOps Guru identified several tables in our environment that had PITR disabled, along with a corresponding Recommendation.

The graphic shows proactive insights for the last 1 month. The one insight shown is 'Dynamo Table Point in Time Recovery not enabled' with a status of OnGoing and a severity of low.

The graphic shows proactive insights for the last 1 month. The one insight shown is 'Dynamo Table Point in Time Recovery not enabled' with a status of OnGoing and a severity of low.

Figure 1. The graphic shows proactive insights for the last 1 month. The one insight shown is ‘Dynamo Table Point in Time Recovery not enabled’ with a status of OnGoing and a severity of low.

Elasticache anomalous evictions

Amazon Elasticache for Redis is used by a handful of our services to cache any relevant application data. Amazon DevOps Guru identified that one of our instances was exhibiting anomalous behavior regarding its cache eviction rate. Essentially, due to the memory pressure of the instance, the eviction rate of cache entries began to increase. DevOps Guru recommended revisiting the sizing of this instance and scaling it vertically or horizontally, where appropriate.

The graph shows the metric: count of ElastiCache evictions plotted for the time period Jul 3, 20:35 to Jul 3, 21:35 UTC. A highlighted section shows that the evictions increased to a peak of 2500 between 21:00 and 21:08. Outside of this interval the evictions are below 500.

The graph shows the metric: count of ElastiCache evictions plotted for the time period Jul 3, 20:35 to Jul 3, 21:35 UTC. A highlighted section shows that the evictions increased to a peak of 2500 between 21:00 and 21:08. Outside of this interval the evictions are below 500.

Figure 2. The graph shows the metric: count of ElastiCache evictions plotted for the time period Jul 3, 20:35 to Jul 3, 21:35 UTC. A highlighted section shows that the evictions increased to a peak of 2500 between 21:00 and 21:08. Outside of this interval the evictions are below 500

AWS Lambda anomalous errors

We manage a few AWS Lambda functions that all serve different purposes. During the beginning of normal work day, we began to see increased error rates for a particular function resulting in an exception being thrown. DevOps Guru was able to detect the increase in error rates and flag them as anomalous. Although retries in this case wouldn’t have solved the problem, it did increase our visibility into the issue (which was also corroborated by our APM platform).

The graph shows the metric: count of AWS/Lambda errors plotted between 11:00 and 13:30 on Jul 6. The sections between the times 11:23 and 12:15 and at 12:37 and 13:13 UTC are highlighted to show the anomalies.

Figure 3. The graph shows the metric: count of AWS/Lambda errors plotted between 11:00 and 13:30 on Jul 6. The sections between the times 11:23 and 12:15 and at 12:37 and 13:13 UTC are highlighted to show the anomalies

Figure 3. The graph shows the metric: count of AWS/Lambda errors plotted between 11:00 and 13:30 on Jul 6. The sections between the times 11:23 and 12:15 UTC are highlighted to show the anomalies

Conclusion

Amazon DevOps Guru integrated into our environment quickly, with no more additional configuration or setup aside from a few button clicks to enable the service. After reviewing several of the proactive insights that DevOps Guru provided, we could formulate plans of action regarding remediation. One specific case example of this is where DevOps Guru flagged several of our Lambda functions for not containing enough subnets. After triaging the finding, we discovered that we were lacking multi-AZ redundancy for several of those functions. As a result, we could implement a change that maximized our availability of those resources.

With the continuous analysis that DevOps Guru performs, we continue to gain new insights into the resources that we utilize and deploy in our environment. This lets us improve operationally while simultaneously maintaining production stability.

About the author:
Adnan Bilwani

Adnan Bilwani is a Sr. Specialist Builders Experience at AWS and part of the AI for DevOps portfolio of services providing fully managed ML-based solutions to enhance your DevOps workflows.

Sobhan Archakam

Sobhan Archakam is a Senior Technical Account Manager at Amazon Web Services. He provides advocacy and guidance to Enterprise Customers to plan, build, deploy and operate solutions at scale using best practices.

Sapan Jain

Sapan Jain is a DevOps Engineer at Slice. He provides support in all facets of DevOps, and has an interest in performance, observability, automation, and troubleshooting.

How Amazon CodeGuru Profiler helps Coursera create high-quality online learning experiences

Post Syndicated from Adnan Bilwani original https://aws.amazon.com/blogs/devops/coursera-codeguru-profiler/

This guest post was authored by Rana Ahsan and Chris Liu, Software Engineers at Coursera, and edited by Dave Sanderson and Adnan Bilwani, at AWS.

Coursera was launched in 2012 by two Stanford Computer Science professors, Daphne Koller and Andrew Ng, with a vision of providing universal access to world-class learning. It’s now one of the world’s leading online learning platforms with more than 77 million registered learners. Coursera partners with over 200 leading university and industry partners to offer a broad catalog of content and credentials, including Guided Projects, courses, Specializations, certificates, and accredited bachelor’s and master’s degrees. More than 6,000 institutions have used Coursera to transform their talent by upskilling and reskilling their employees, citizens, and students in the high-demand data science, technology, and business skills required to compete in today’s economy.

Coursera’s challenge

About a year and a half ago, we were debugging some performance bottlenecks for our microservices where some requests were too slow and often resulted in server errors due to timeout. Even after digging into the logs and looking through existing performance metrics of the underlying systems, we couldn’t determine the cause or explain the behavior. To compound the matter, we saw the issues across multiple applications, leading to a concern that the issue resided in code shared across applications.

To dig deeper into the problem, we started doing manual reviews of the code for the applications associated with these failures. This process turned out to be too laborious and time-consuming.

We also started building out our debugging solution utilizing shell scripts to capture a snapshot of the system and application state so we could analyze the details of these bottlenecks. Although the scripts provided some valuable insights, we started to run into issues of scale. The process of deploying the tooling and collecting the data became tedious and cumbersome. At the same time, the more data we received back from our scripts, the more demand we saw for this level of detail.

Solution with Amazon CodeGuru

It was at this point we decided to look into CodeGuru Profiler to determine if it could provide the same insights as our tooling while reducing the administrative burden associated with deploying, aggregating, and analyzing the data.

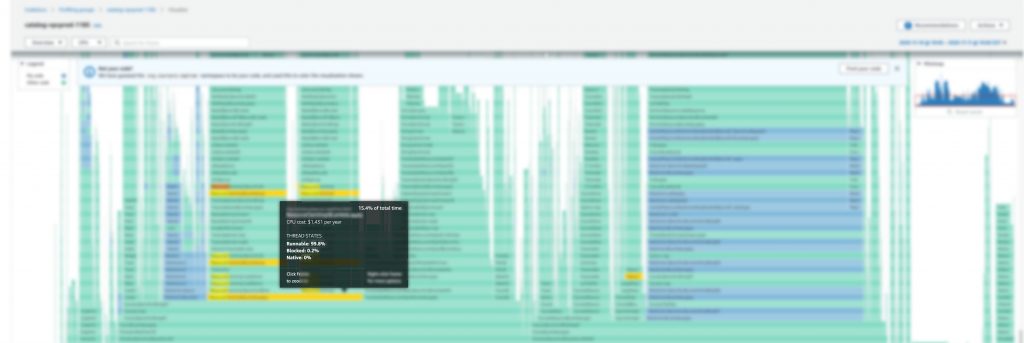
Quickly after deploying CodeGuru Profiler, we started to get valuable and actionable data regarding the issue. The profiler highlighted a high CPU usage during the deserialization process used for application communications (see the following screenshot). This confirmed our suspicions that the issue was indeed in the shared code, but it was also an unexpected find, because JSON deserialization is widespread and it hadn’t hit our radar as a potential candidate for the issue.

Flame graph highlighted high CPU usage

The deserialization performance was causing slow processing time for each request and increasing the overall communication latency. This led to performance degradation by causing the calls to slowly stack up over time until the request would time out. With CodeGuru Profiler, we were also able to establish a relationship between the size of the JSON document and the high CPU usage. As the document size increased, so did CPU usage. In some cases, this resulted in a resource starvation situation on the system, which in turn could cause other processes on the instance to crash, resulting in a sudden failure.

In addition to the performance and application instances failures, the high CPU usage during deserialization was quietly driving up costs. Because the issue was in shared code, the wasteful resource consumption was contributing to the need for additional instances to be added into the application cluster in order to meet throughput requirements.

Results

The details from CodeGuru Profiler enabled us to see and understand the underlying cause and move forward with a solution. Because the code is in the critical communication path for our microservices and shared across many applications, we decided to replace the JSON serialization with an alternative object serialization approach that was much more performant.

To get a deeper understanding of the performance impact of this change, we deployed the original code to a test environment. We used CodeGuru Profiler to evaluate the performance of the JSON and native object serialization. After we ran the same battery of tests against the new code, the deserialization CPU usage dropped between 30–40%.

Flame graph displayed lower CPU usage after changes

This resulted in a corresponding decrease in serialization-deserialization latency of 5–50% depending on response payload size and workload.

As we roll out this optimization across our fleet, we anticipate seeing significant improvements in the performance and stability of our microservices platform as well as a reduction in CPU utilization cost.

Conclusion

CodeGuru Profiler provides additional application insights and helps us troubleshoot other issues in our applications, including resolving a case of flaky I/O errors and improving tail latency by recommending a different thread-pooling strategy.

CodeGuru Profiler was easy to maintain and scale across our fleet. It quickly identified these performance issues in our production environment and helped us verify and understand the impact of possible resolutions prior to releasing the code back into production.


About the authors

Rana Ahsan is a Staff Software Engineer at Coursera
Chris Liu is a Staff Software Engineer at Coursera
Adnan Bilwani is a Sr. Specialist Builders Experience at AWS
Dave Sanderson is a Sr. Technical Account Manager at AWS