Post Syndicated from Suresh Babu original https://aws.amazon.com/blogs/devops/integrating-devops-guru-insights-with-cloudwatch-dashboard/
Many customers use Amazon CloudWatch dashboards to monitor applications and often ask how they can integrate Amazon DevOps Guru Insights in order to have a unified dashboard for monitoring. This blog post showcases integrating DevOps Guru proactive and reactive insights to a CloudWatch dashboard by using Custom Widgets. It can help you to correlate trends over time and spot issues more efficiently by displaying related data from different sources side by side and to have a single pane of glass visualization in the CloudWatch dashboard.
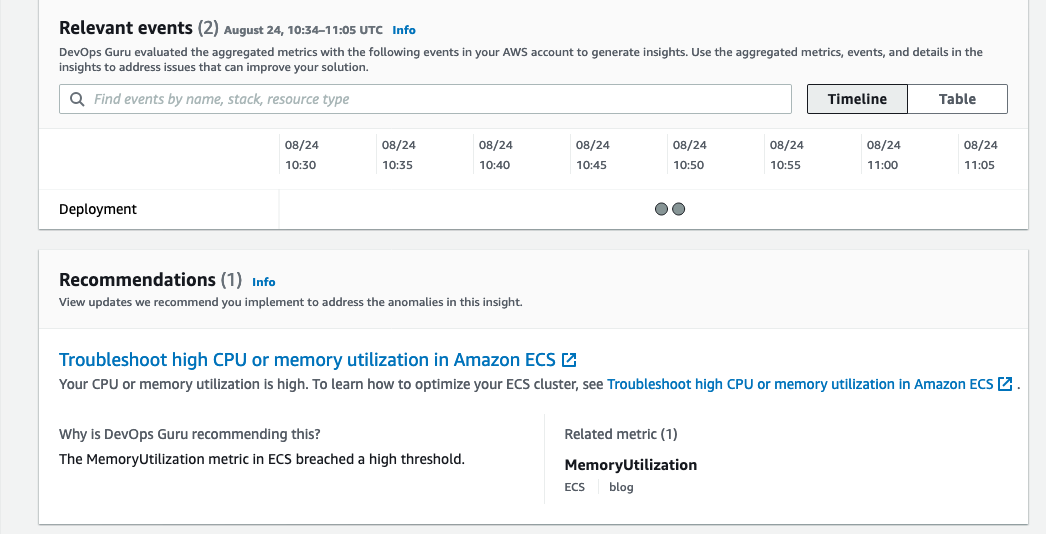
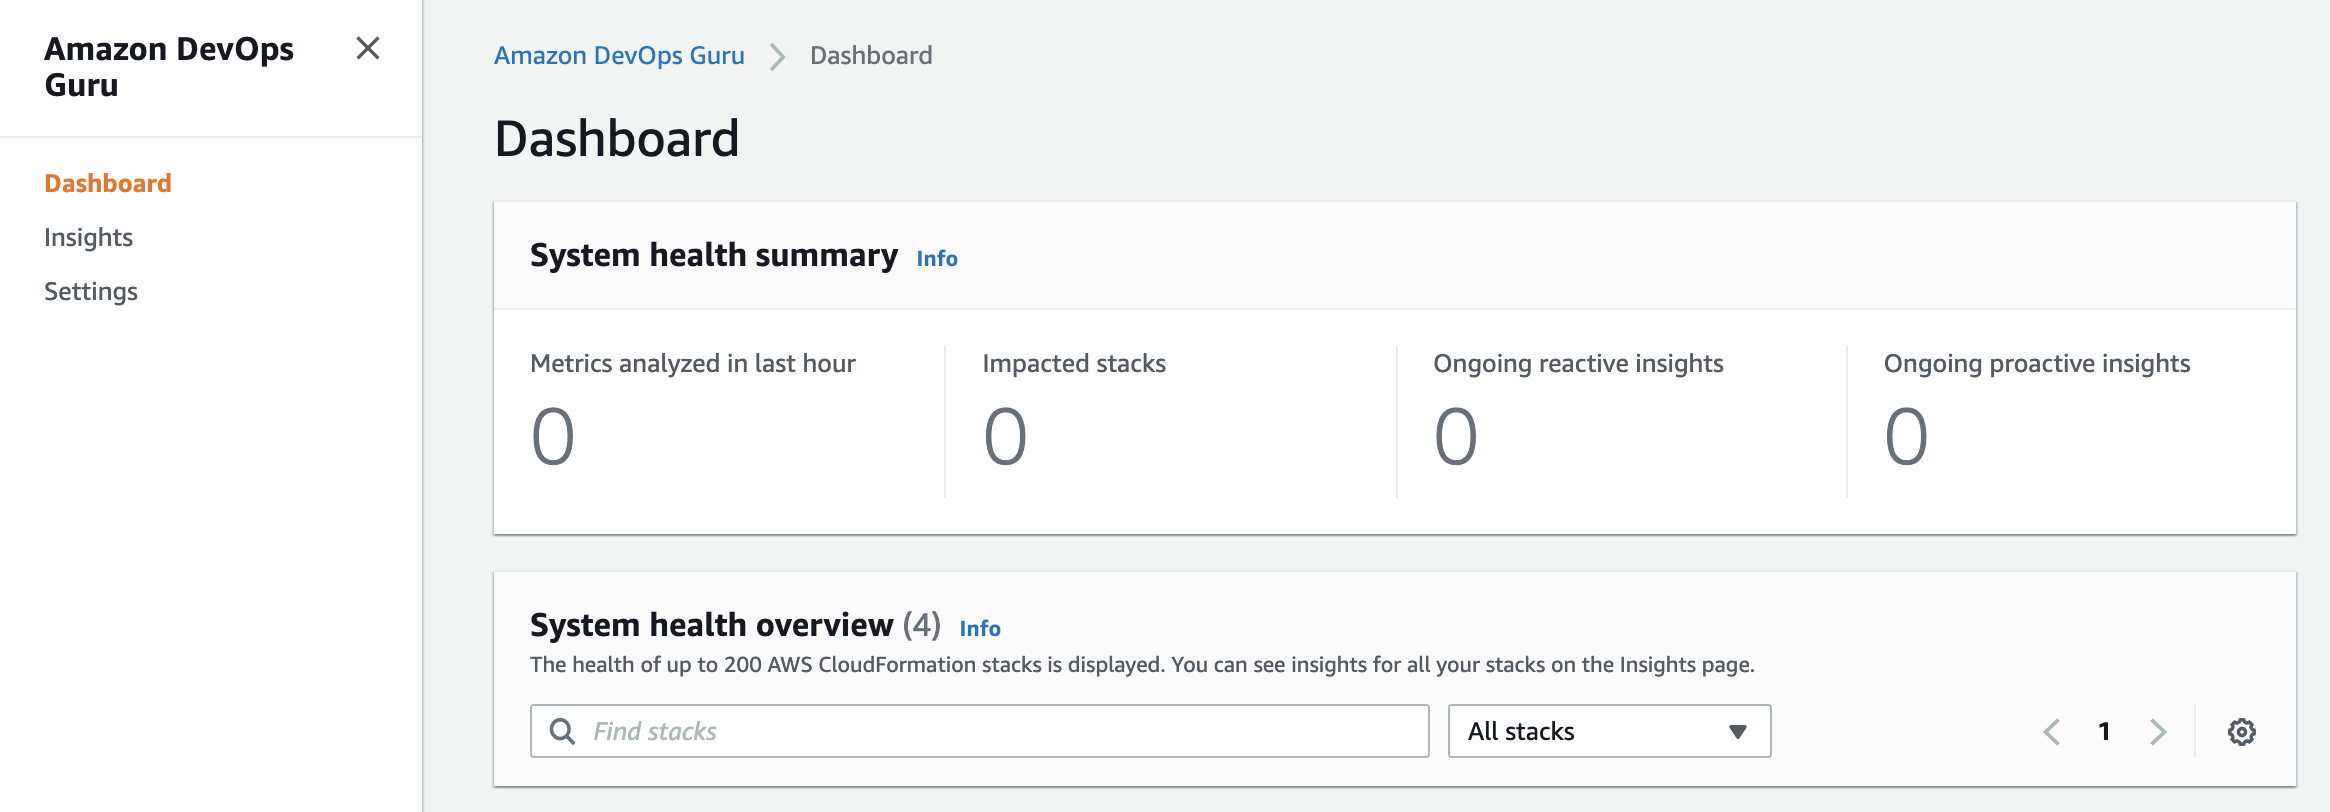
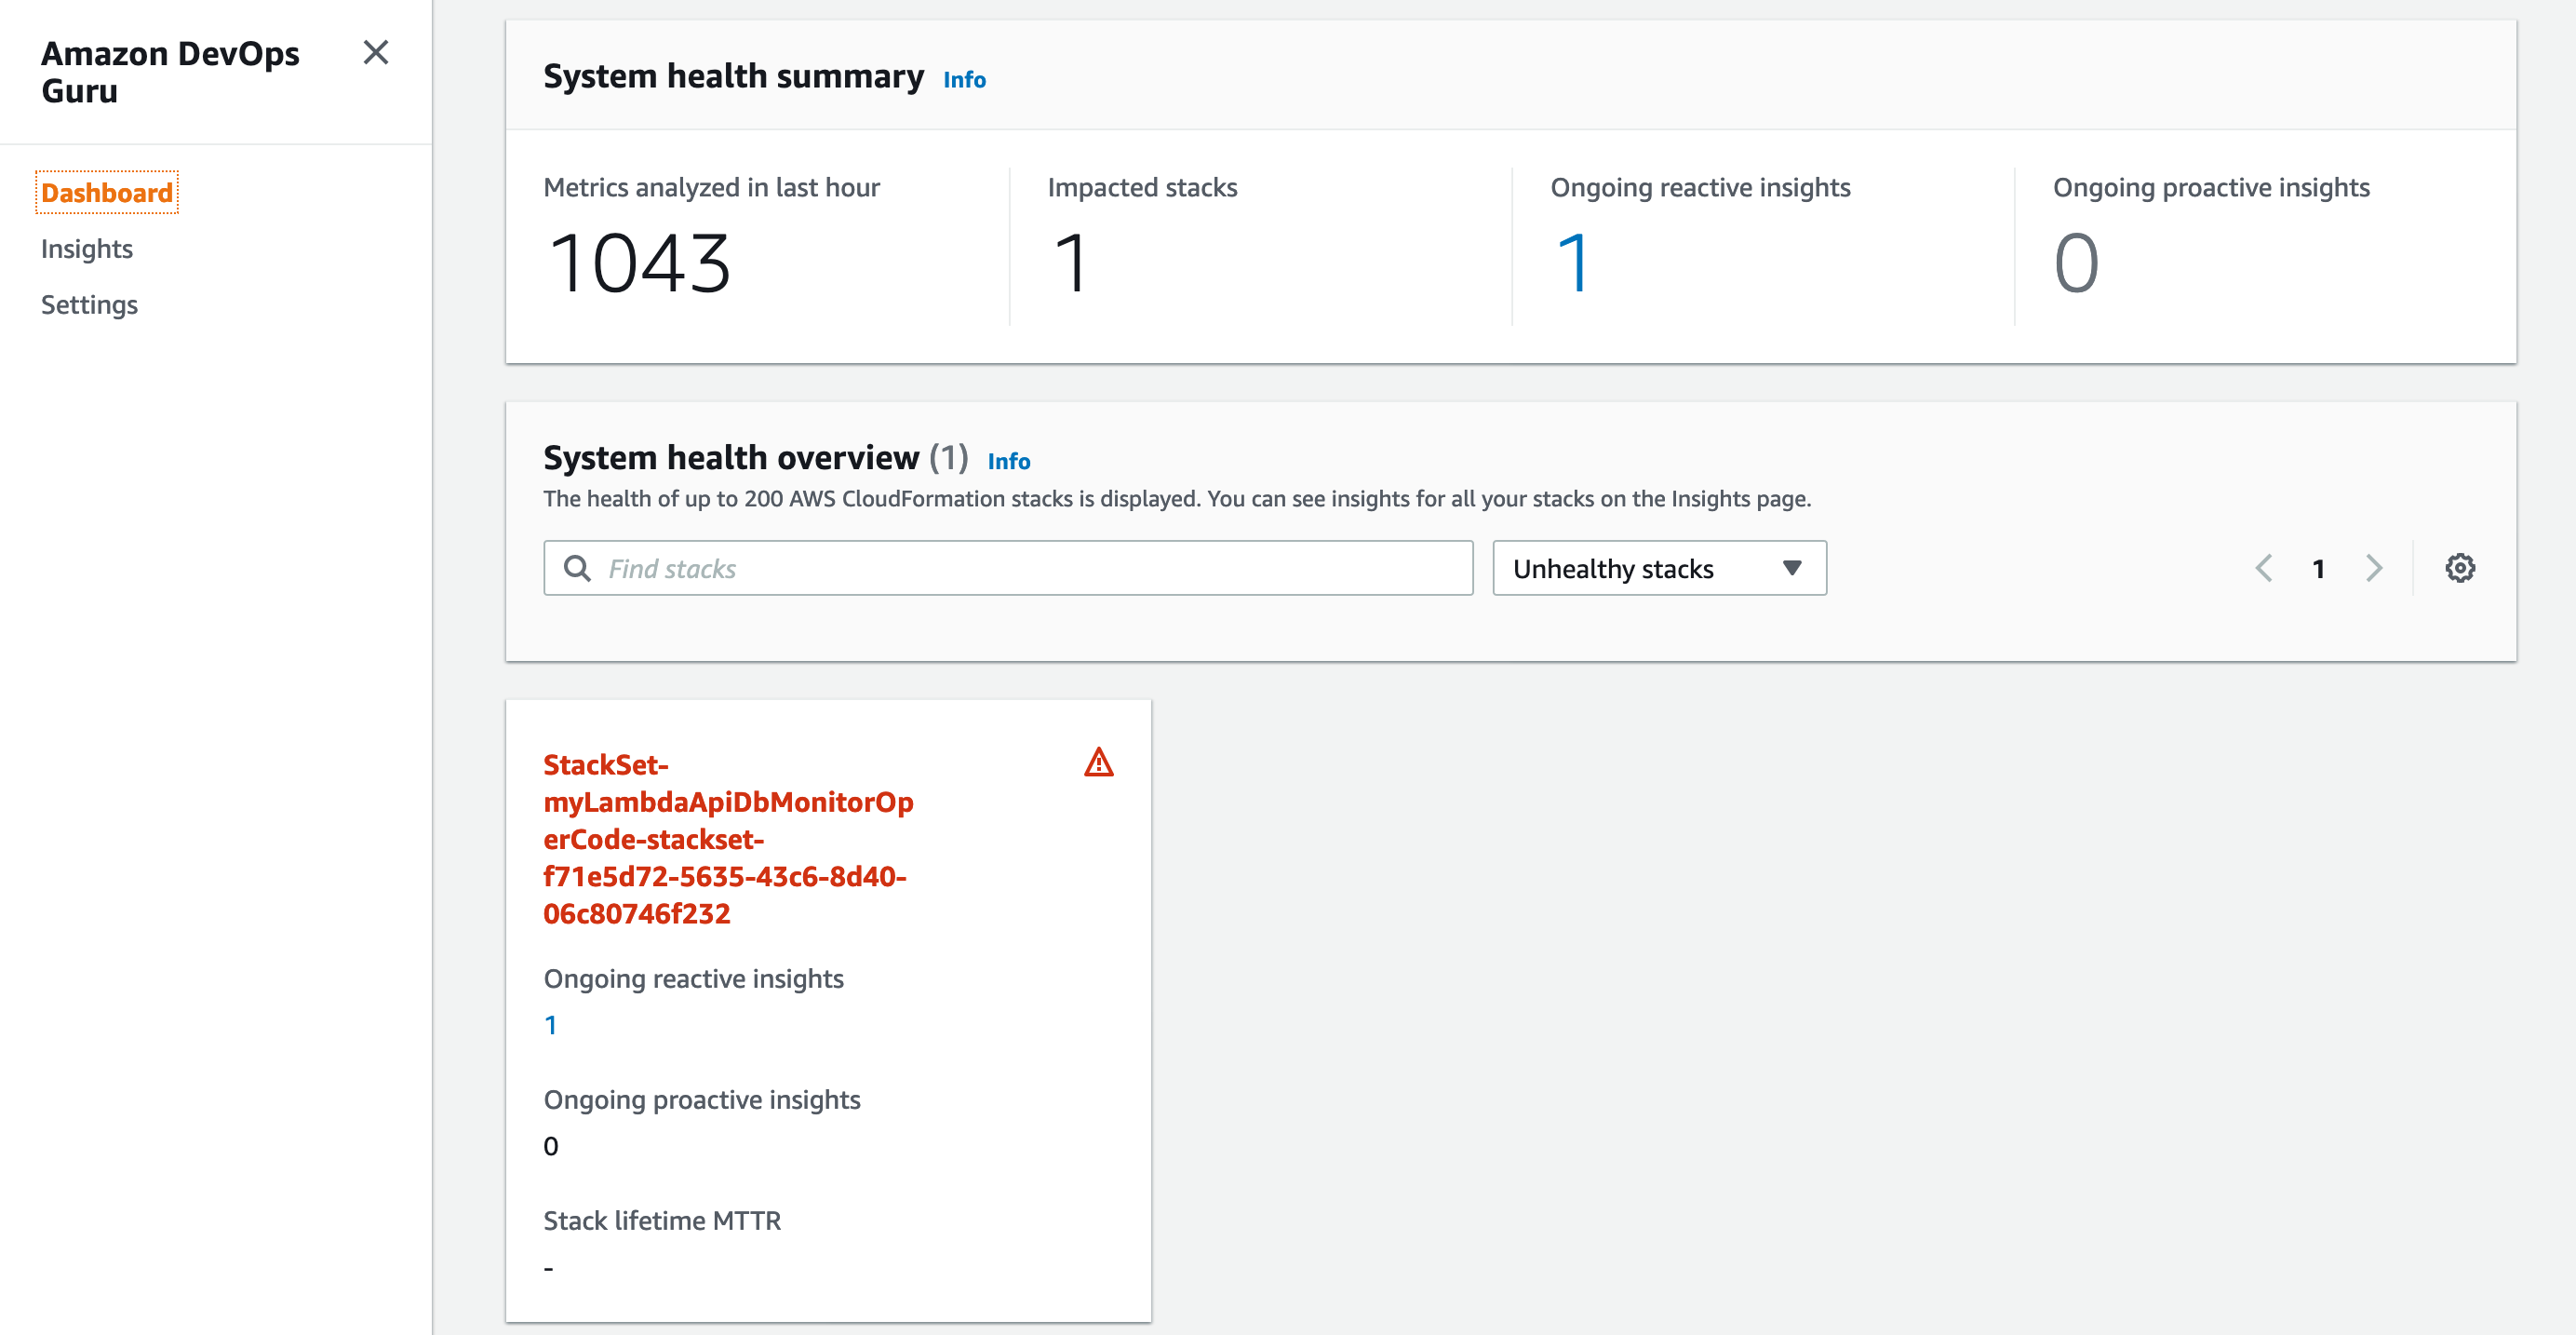
Amazon DevOps Guru is a machine learning (ML) powered service that helps developers and operators automatically detect anomalies and improve application availability. DevOps Guru’s anomaly detectors can proactively detect anomalous behavior even before it occurs, helping you address issues before they happen; detailed insights provide recommendations to mitigate that behavior.
Amazon CloudWatch dashboard is a customizable home page in the CloudWatch console that monitors multiple resources in a single view. You can use CloudWatch dashboards to create customized views of the metrics and alarms for your AWS resources.
Solution overview
This post will help you to create a Custom Widget for Amazon CloudWatch dashboard that displays DevOps Guru Insights. A custom widget is part of your CloudWatch dashboard that calls an AWS Lambda function containing your custom code. The Lambda function accepts custom parameters, generates your dataset or visualization, and then returns HTML to the CloudWatch dashboard. The CloudWatch dashboard will display this HTML as a widget. In this post, we are providing sample code for the Lambda function that will call DevOps Guru APIs to retrieve the insights information and displays as a widget in the CloudWatch dashboard. The architecture diagram of the solution is below.

Figure 1: Reference architecture diagram
Prerequisites and Assumptions
- An AWS account. To sign up:
- Create an AWS account. For instructions, see Sign Up For AWS.
- DevOps Guru should be enabled in the account. For enabling DevOps guru, see DevOps Guru Setup
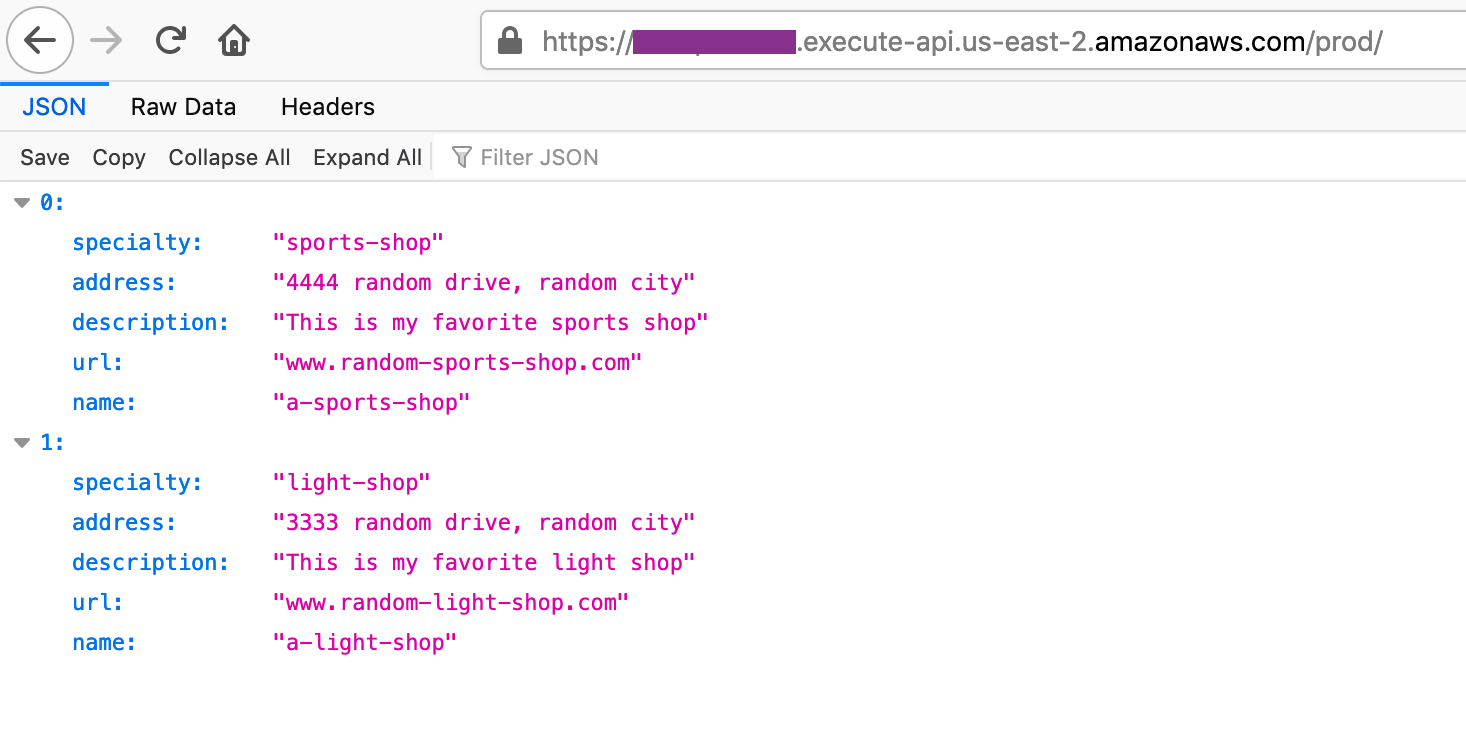
- Follow this Workshop to deploy a sample application in your AWS Account which can help generate some DevOps Guru insights.
Solution Deployment
We are providing two options to deploy the solution – using the AWS console and AWS CloudFormation. The first section has instructions to deploy using the AWS console followed by instructions for using CloudFormation. The key difference is that we will create one Widget while using the Console, but three Widgets are created when we use AWS CloudFormation.
Using the AWS Console:
We will first create a Lambda function that will retrieve the DevOps Guru insights. We will then modify the default IAM role associated with the Lambda function to add DevOps Guru permissions. Finally we will create a CloudWatch dashboard and add a custom widget to display the DevOps Guru insights.
- Navigate to the Lambda Console after logging to your AWS Account and click on Create function.

Figure 2a: Create Lambda Function
- Choose Author from Scratch and use the runtime Node.js 16.x. Leave the rest of the settings at default and create the function.

Figure 2b: Create Lambda Function
- After a few seconds, the Lambda function will be created and you will see a code source box. Copy the code from the text box below and replace the code present in code source as shown in screen print below.
// SPDX-License-Identifier: MIT-0
// CloudWatch Custom Widget sample: displays count of Amazon DevOps Guru Insights
const aws = require('aws-sdk');

const DOCS = `## DevOps Guru Insights Count
Displays the total counts of Proactive and Reactive Insights in DevOps Guru.
`;

async function getProactiveInsightsCount(DevOpsGuru, StartTime, EndTime) {
    let NextToken = null;
    let proactivecount=0;

    do {
        const args = { StatusFilter: { Any : { StartTimeRange: { FromTime: StartTime, ToTime: EndTime }, Type: 'PROACTIVE'  }}}
        const result = await DevOpsGuru.listInsights(args).promise();
        console.log(result)
        NextToken = result.NextToken;
        result.ProactiveInsights.forEach(res => {
        console.log(result.ProactiveInsights[0].Status)
        proactivecount++;
        });
        } while (NextToken);
    return proactivecount;
}

async function getReactiveInsightsCount(DevOpsGuru, StartTime, EndTime) {
    let NextToken = null;
    let reactivecount=0;

    do {
        const args = { StatusFilter: { Any : { StartTimeRange: { FromTime: StartTime, ToTime: EndTime }, Type: 'REACTIVE'  }}}
        const result = await DevOpsGuru.listInsights(args).promise();
        NextToken = result.NextToken;
        result.ReactiveInsights.forEach(res => {
        reactivecount++;
        });
        } while (NextToken);
    return reactivecount;
}

function getHtmlOutput(proactivecount, reactivecount, region, event, context) {

    return `DevOps Guru Proactive Insights<br><font size="+10" color="#FF9900">${proactivecount}</font>
    <p>DevOps Guru Reactive Insights</p><font size="+10" color="#FF9900">${reactivecount}`;
}

exports.handler = async (event, context) => {
    if (event.describe) {
        return DOCS;
    }
    const widgetContext = event.widgetContext;
    const timeRange = widgetContext.timeRange.zoom || widgetContext.timeRange;
    const StartTime = new Date(timeRange.start);
    const EndTime = new Date(timeRange.end);
    const region = event.region || process.env.AWS_REGION;
    const DevOpsGuru = new aws.DevOpsGuru({ region });

    const proactivecount = await getProactiveInsightsCount(DevOpsGuru, StartTime, EndTime);
    const reactivecount = await getReactiveInsightsCount(DevOpsGuru, StartTime, EndTime);

    return getHtmlOutput(proactivecount, reactivecount, region, event, context);

};
Figure 3: Lambda Function Source Code
- Click on Deploy to save the function code
- Since we used the default settings while creating the function, a default Execution role is created and associated with the function. We will need to modify the IAM role to grant DevOps Guru permissions to retrieve Proactive and Reactive insights.
- Click on the Configuration tab and select Permissions from the left side option list. You can see the IAM execution role associated with the function as shown in figure 4.

Figure 4: Lambda function execution role
- Click on the IAM role name to open the role in the IAM console. Click on Add Permissions and select Attach policies.

Figure 5: IAM Role Update
- Search for DevOps and select the AmazonDevOpsGuruReadOnlyAccess. Click on Add permissions to update the IAM role.

Figure 6: IAM Role Policy Update
- Now that we have created the Lambda function for our custom widget and assigned appropriate permissions, we can navigate to CloudWatch to create a Dashboard.
- Navigate to CloudWatch and click on dashboards from the left side list. You can choose to create a new dashboard or add the widget in an existing dashboard.
- We will choose to create a new dashboard

Figure 7: Create New CloudWatch dashboard
- Choose Custom Widget in the Add widget page

Figure 8: Add widget
- Click Next in the custom widge page without choosing a sample

Figure 9: Custom Widget Selection
- Choose the region where devops guru is enabled. Select the Lambda function that we created earlier. In the preview pane, click on preview to view DevOps Guru metrics. Once the preview is successful, create the Widget.

Figure 10: Create Custom Widget
- Congratulations, you have now successfully created a CloudWatch dashboard with a custom widget to get insights from DevOps Guru. The sample code that we provided can be customized to suit your needs.


Using AWS CloudFormation
You may skip this step and move to future scope section if you have already created the resources using AWS Console.
In this step we will show you how to deploy the solution using AWS CloudFormation. AWS CloudFormation lets you model, provision, and manage AWS and third-party resources by treating infrastructure as code. Customers define an initial template and then revise it as their requirements change. For more information on CloudFormation stack creation refer to this blog post.
The following resources are created.
- Three Lambda functions that will support CloudWatch Dashboard custom widgets
- An AWS Identity and Access Management (IAM) role to that allows the Lambda function to access DevOps Guru Insights and to publish logs to CloudWatch
- Three Log Groups under CloudWatch
- A CloudWatch dashboard with widgets to pull data from the Lambda Functions
To deploy the solution by using the CloudFormation template
- You can use this downloadable template to set up the resources. To launch directly through the console, choose Launch Stack button, which creates the stack in the us-east-1 AWS Region.
- Choose Next to go to the Specify stack details page.
- (Optional) On the Configure Stack Options page, enter any tags, and then choose Next.
- On the Review page, select I acknowledge that AWS CloudFormation might create IAM resources.
- Choose Create stack.
It takes approximately 2-3 minutes for the provisioning to complete. After the status is “Complete”, proceed to validate the resources as listed below.
Validate the resources
Now that the stack creation has completed successfully, you should validate the resources that were created.
- On AWS Console, head to CloudWatch, under Dashboards – there will be a dashboard created with name <StackName-Region>.
- On AWS Console, head to CloudWatch, under LogGroups there will be 3 new log-groups created with the name as:
- lambdaProactiveLogGroup
- lambdaReactiveLogGroup
- lambdaSummaryLogGroup
- On AWS Console, head to Lambda, there will be lambda function(s) under the name:
- lambdaFunctionDGProactive
- lambdaFunctionDGReactive
- lambdaFunctionDGSummary
- On AWS Console, head to IAM, under Roles there will be a new role created with name “lambdaIAMRole”
To View Results/Outcome
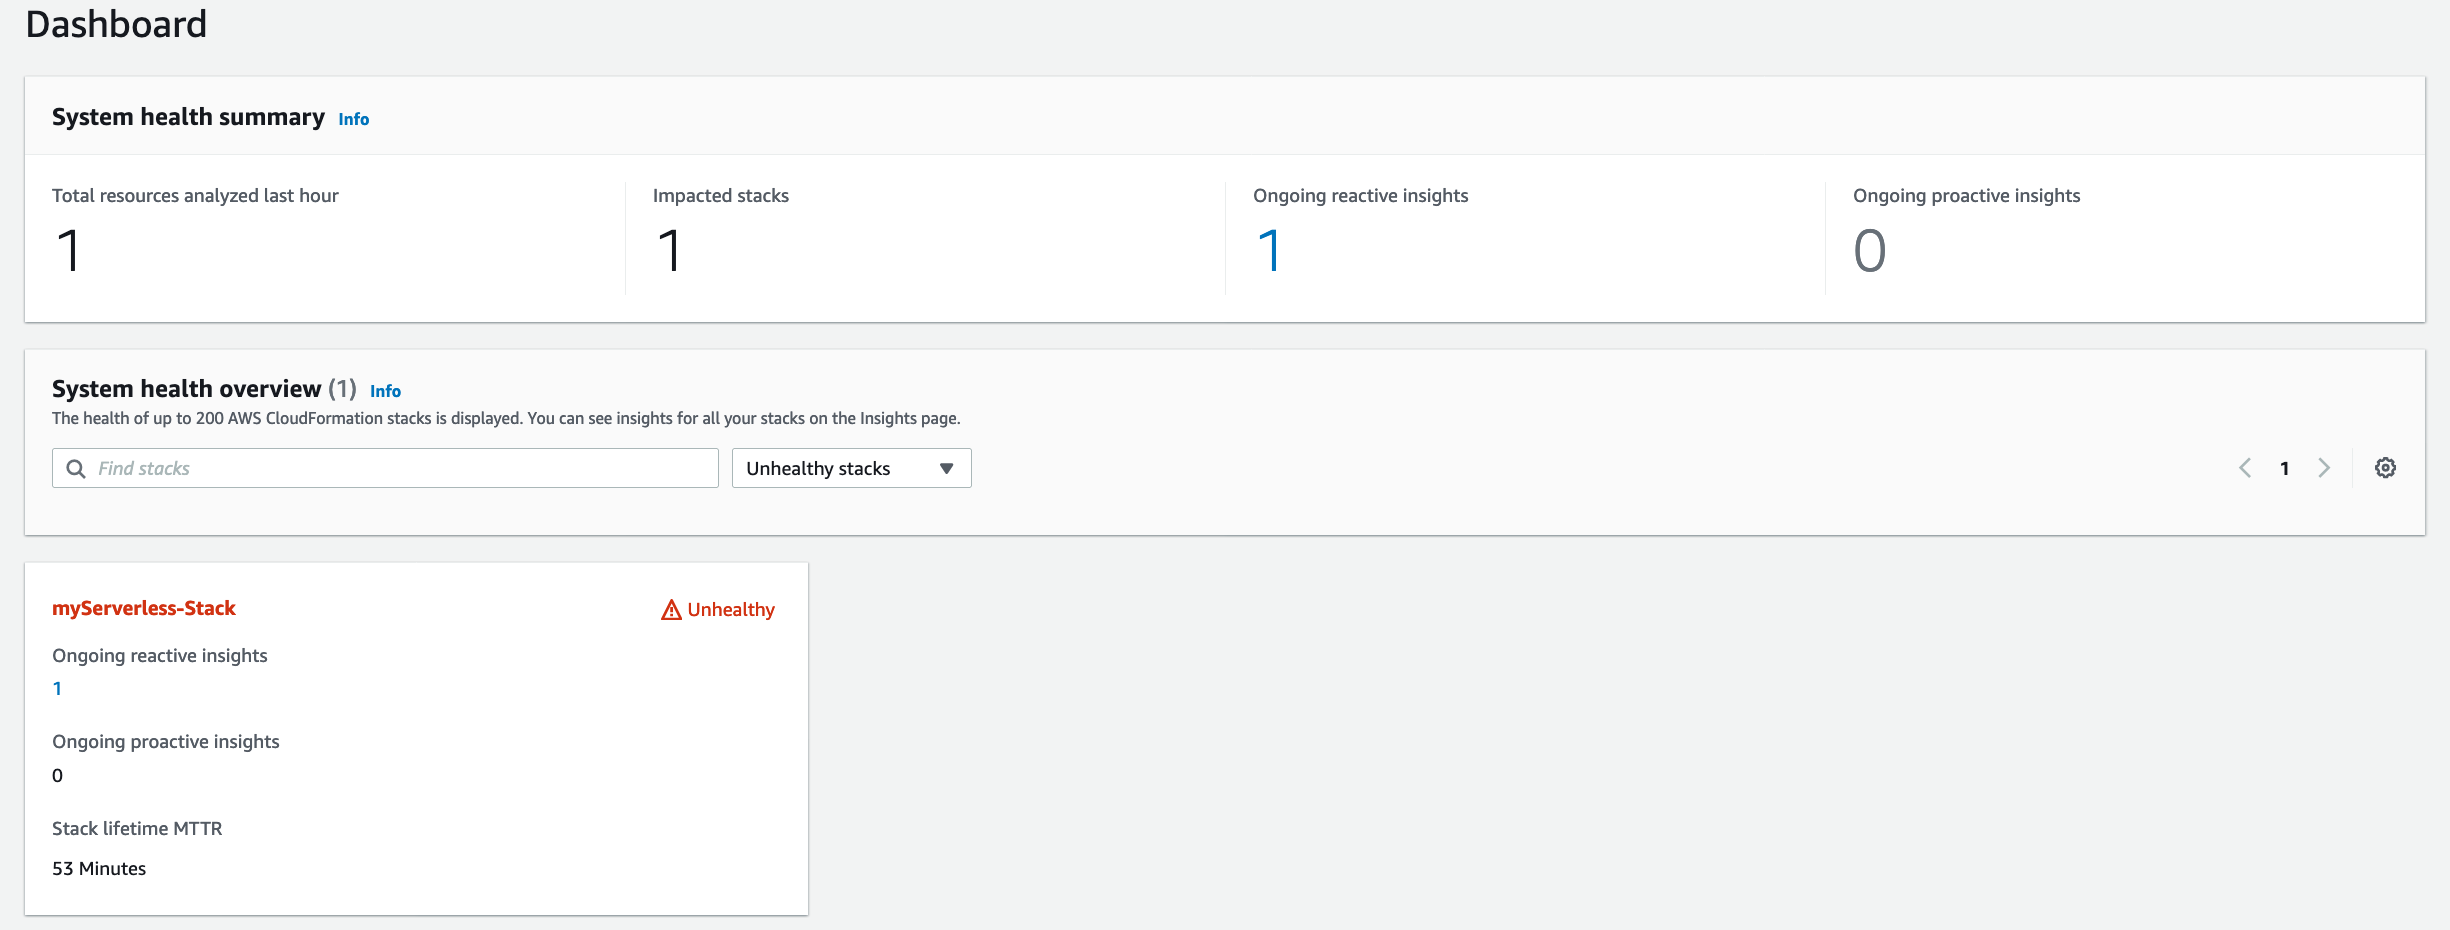
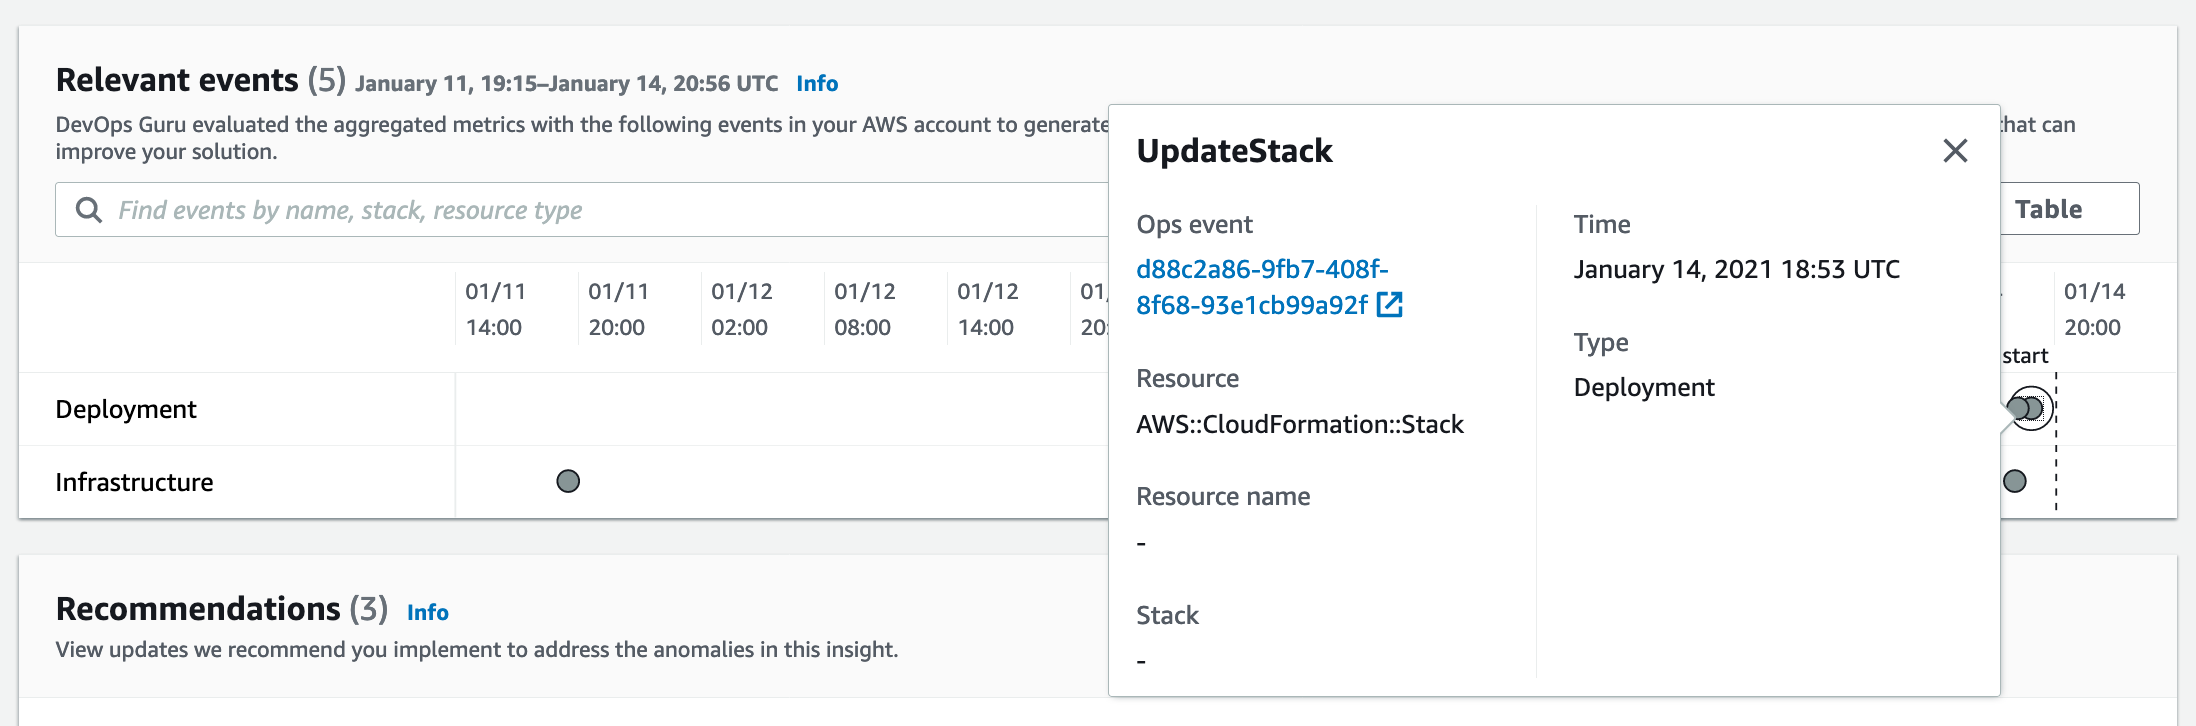
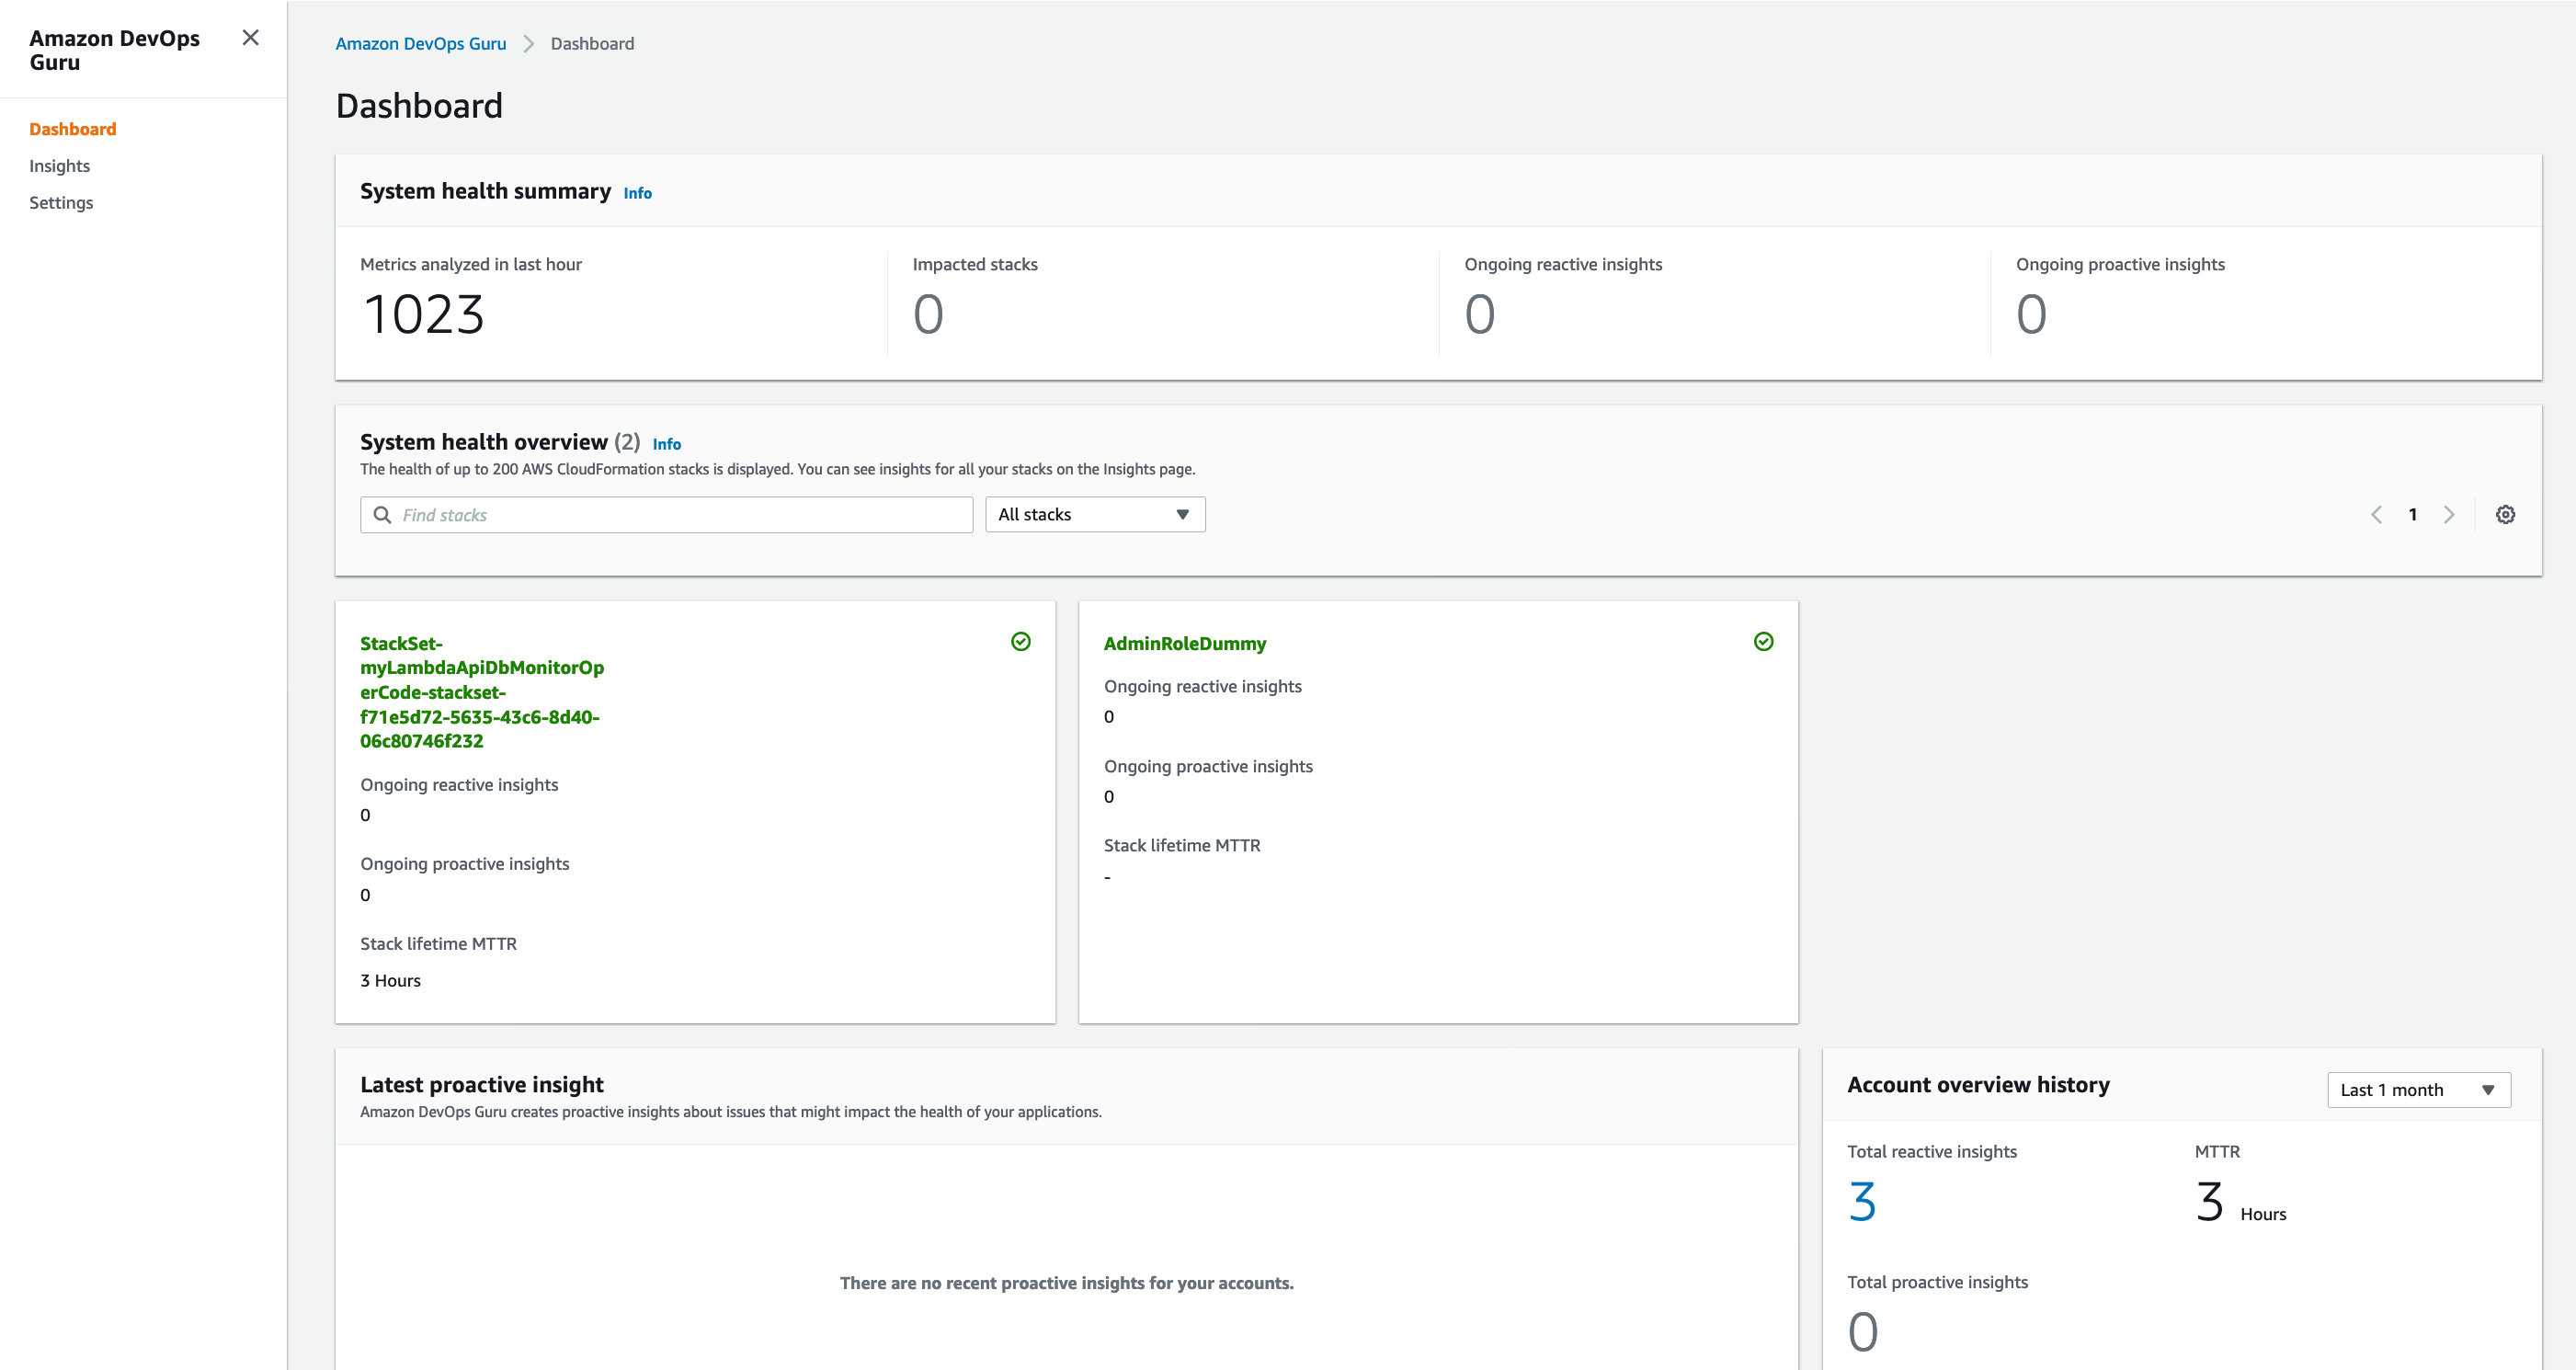
With the appropriate time-range setup on CloudWatch Dashboard, you will be able to navigate through the insights that have been generated from DevOps Guru on the CloudWatch Dashboard.
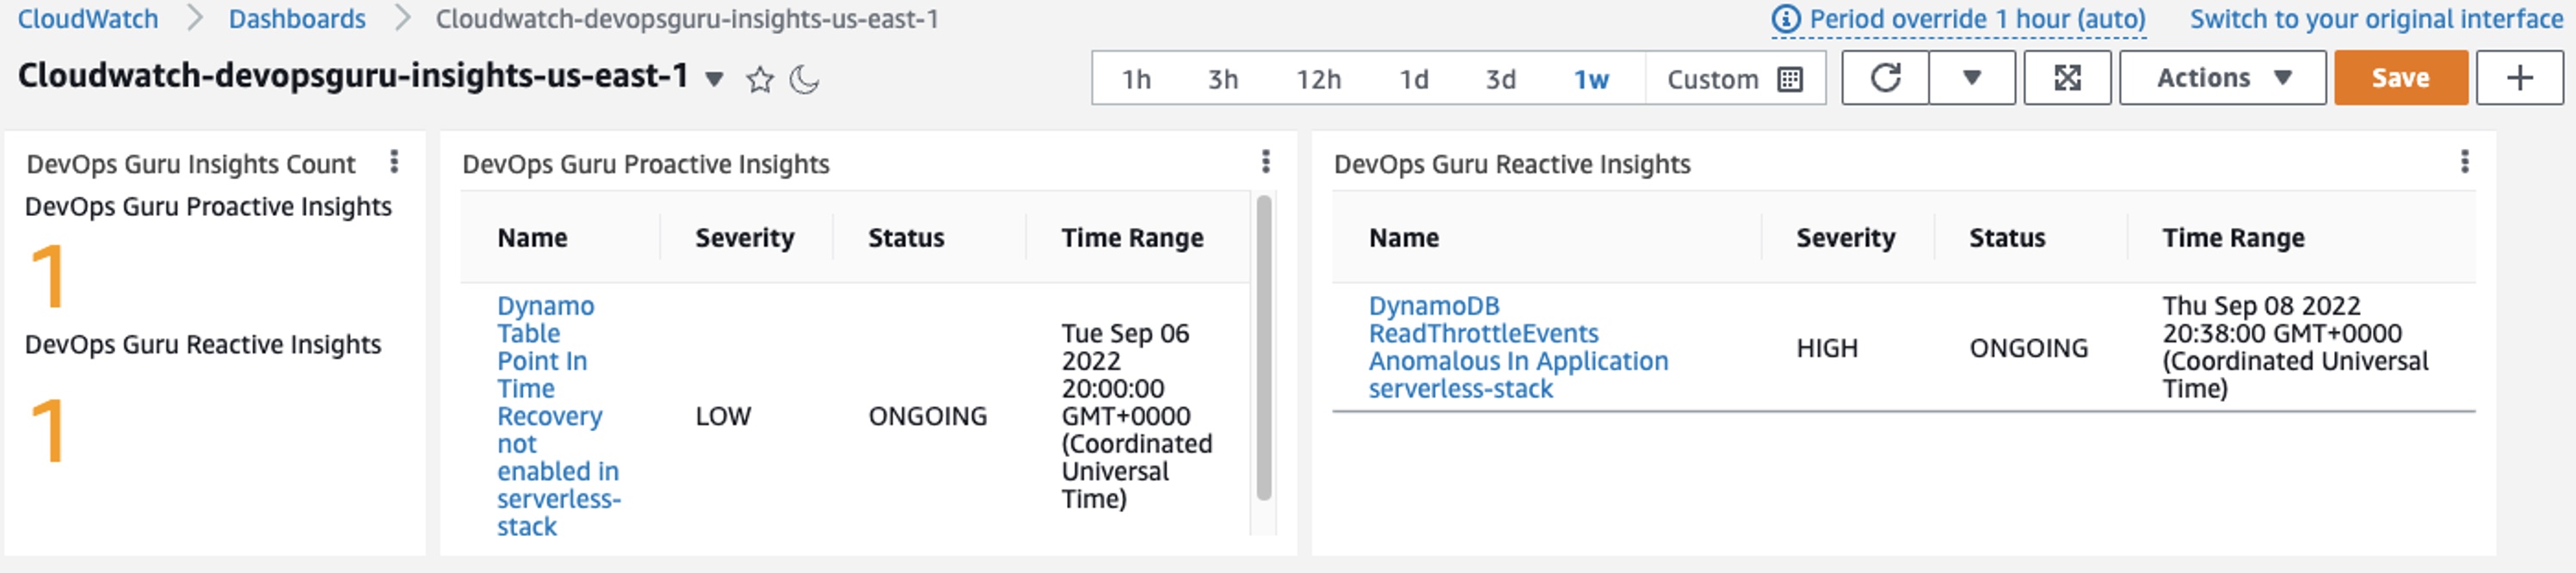
Figure 11: DevOpsGuru Insights in Cloudwatch Dashboard
Cleanup
For cost optimization, after you complete and test this solution, clean up the resources. You can delete them manually if you used the AWS Console or by deleting the AWS CloudFormation stack called devopsguru-cloudwatch-dashboard if you used AWS CloudFormation.
For more information on deleting the stacks, see Deleting a stack on the AWS CloudFormation console.
Conclusion
This blog post outlined how you can integrate DevOps Guru insights into a CloudWatch Dashboard. As a customer, you can start leveraging CloudWatch Custom Widgets to include DevOps Guru Insights in an existing Operational dashboard.
AWS Customers are now using Amazon DevOps Guru to monitor and improve application performance. You can start monitoring your applications by following the instructions in the product documentation. Head over to the Amazon DevOps Guru console to get started today.
To learn more about AIOps for Serverless using Amazon DevOps Guru check out this video.


![As the user configures their EventBridge Rule, for the Creation method they have chosen "Custom pattern (JSON editor) write an event pattern in JSON." For the Event pattern editor just below they have entered {"source":["aws.devops-guru"]}](https://d2908q01vomqb2.cloudfront.net/7719a1c782a1ba91c031a682a0a2f8658209adbf/2023/04/19/eventbridge.png)


![Architecture Diagram showing the service “Test” using the container “brickwall-maker” with a desired count of two. The two ECS Task’s vended metrics are then processed by CloudWatch Container Insights. Both, CloudWatch Container Insights and CloudTrail, are ingested by Amazon DevOps Guru which then makes detected insights available to the user. [Image: DevOpsGuruBlog1.png]V1: DevOpsGuruBlog1.drawio (https://api.quip-amazon.com/2/blob/fbe9AAT37Ge/LdkTqbmlZ8uNj7A44pZbnw?name=DevOpsGuruBlog1.drawio&s=cVbmAWsXnynz) V2: DevOpsGuruBlog1.drawio (https://api.quip-amazon.com/2/blob/fbe9AAT37Ge/SvsNTJLEJOHHBls_kV7EwA?name=DevOpsGuruBlog1.drawio&s=cVbmAWsXnynz) V3: DevOpsGuruBlog1.drawio (https://api.quip-amazon.com/2/blob/fbe9AAT37Ge/DqKTxtQvmOLrzM3KcF_oTg?name=DevOpsGuruBlog1.drawio&s=cVbmAWsXnynz)](https://d2908q01vomqb2.cloudfront.net/7719a1c782a1ba91c031a682a0a2f8658209adbf/2021/10/29/DevOpsGuruBlog1-1-1.png)