All posts by Jet Mariscal

Autonomous hardware diagnostics and recovery at scale

Post Syndicated from Jet Mariscal original https://blog.cloudflare.com/autonomous-hardware-diagnostics-and-recovery-at-scale


Cloudflare’s global network spans more than 310 cities in over 120 countries. That means thousands of servers geographically spread across different data centers, running services that protect and accelerate our customer’s Internet applications. Operating hardware at such a scale means that hardware can break anywhere and at any time. In such cases, our systems are engineered such that these failures cause little to no impact. However, detecting and managing server failure at scale requires automation. This blog aims to provide insights into the difficulties involved in handling broken servers and how we were able to simplify the process through automation.

Challenges dealing with broken servers

When a server is found to have faulty hardware and needs to be removed from production, it is  considered broken and its state is set to Repair in the internal database where server status is tracked. In the past, our Data Center Operations team were essentially left to troubleshoot and diagnose broken servers on their own. They had to go through laborious tasks like performing queries to locate and repair servers, conducting diagnostics, reviewing results, evaluating if a server can be restored to production, and creating the necessary tickets for re-enabling servers and executing operations to put them back in production. Such effort can take hours for a single server alone, and can easily consume an engineer’s entire day.

As you can see, addressing server repairs was a labor-intensive process performed manually, Additionally, a lot of these servers remained powered on within the racks, wasting energy. With our fleet expanding rapidly, the attention of Data Center Operations is primarily devoted to supporting this growth, leaving less time to handle servers in need of repair.

It was clear that our infrastructure was growing too fast for us to be able to handle repairs and recovery, so we had to find a better way to handle these sorts of inefficiencies in our operations. This would allow our engineers to focus on the growth of our footprint while not abandoning repair and recovery – after all, these are still huge CapEx investments and wasted capacity that otherwise would have been fully utilized.

Using automation as an autonomous system

As members of the Infrastructure Software Systems and Automation team at Cloudflare, we primarily work on building tools and automation that help reduce excess work in order to ease the pressure on our operations teams, increase productivity, and enable people to execute operations with the highest efficiency.

Our team continuously strives to challenge our existing processes and systems, finding ways we can evolve them and make significant improvements – one of which is to build not just a typical automated system but an autonomous one. Building autonomous automations means creating systems that can operate independently, without the need for constant human intervention or oversight – a perfect example of this is Phoenix.

Introducing Phoenix

Phoenix is an autonomous diagnostics and recovery automation that runs at regular intervals to discover Cloudflare data centers with servers that are broken, performing diagnostics on detection, recovering those that pass diagnostics by re-provisioning, and ultimately re-enabling  those that have successfully been re-provisioned in the safest and most unobtrusive way possible – all without requiring any human intervention! Should a server fail at any point in the process, Phoenix will take care of updating relevant tickets, even pinpointing the cause of the failure, and reverting the state of the server accordingly when needed – again, all without any human intervention!

The image below illustrates the whole process:

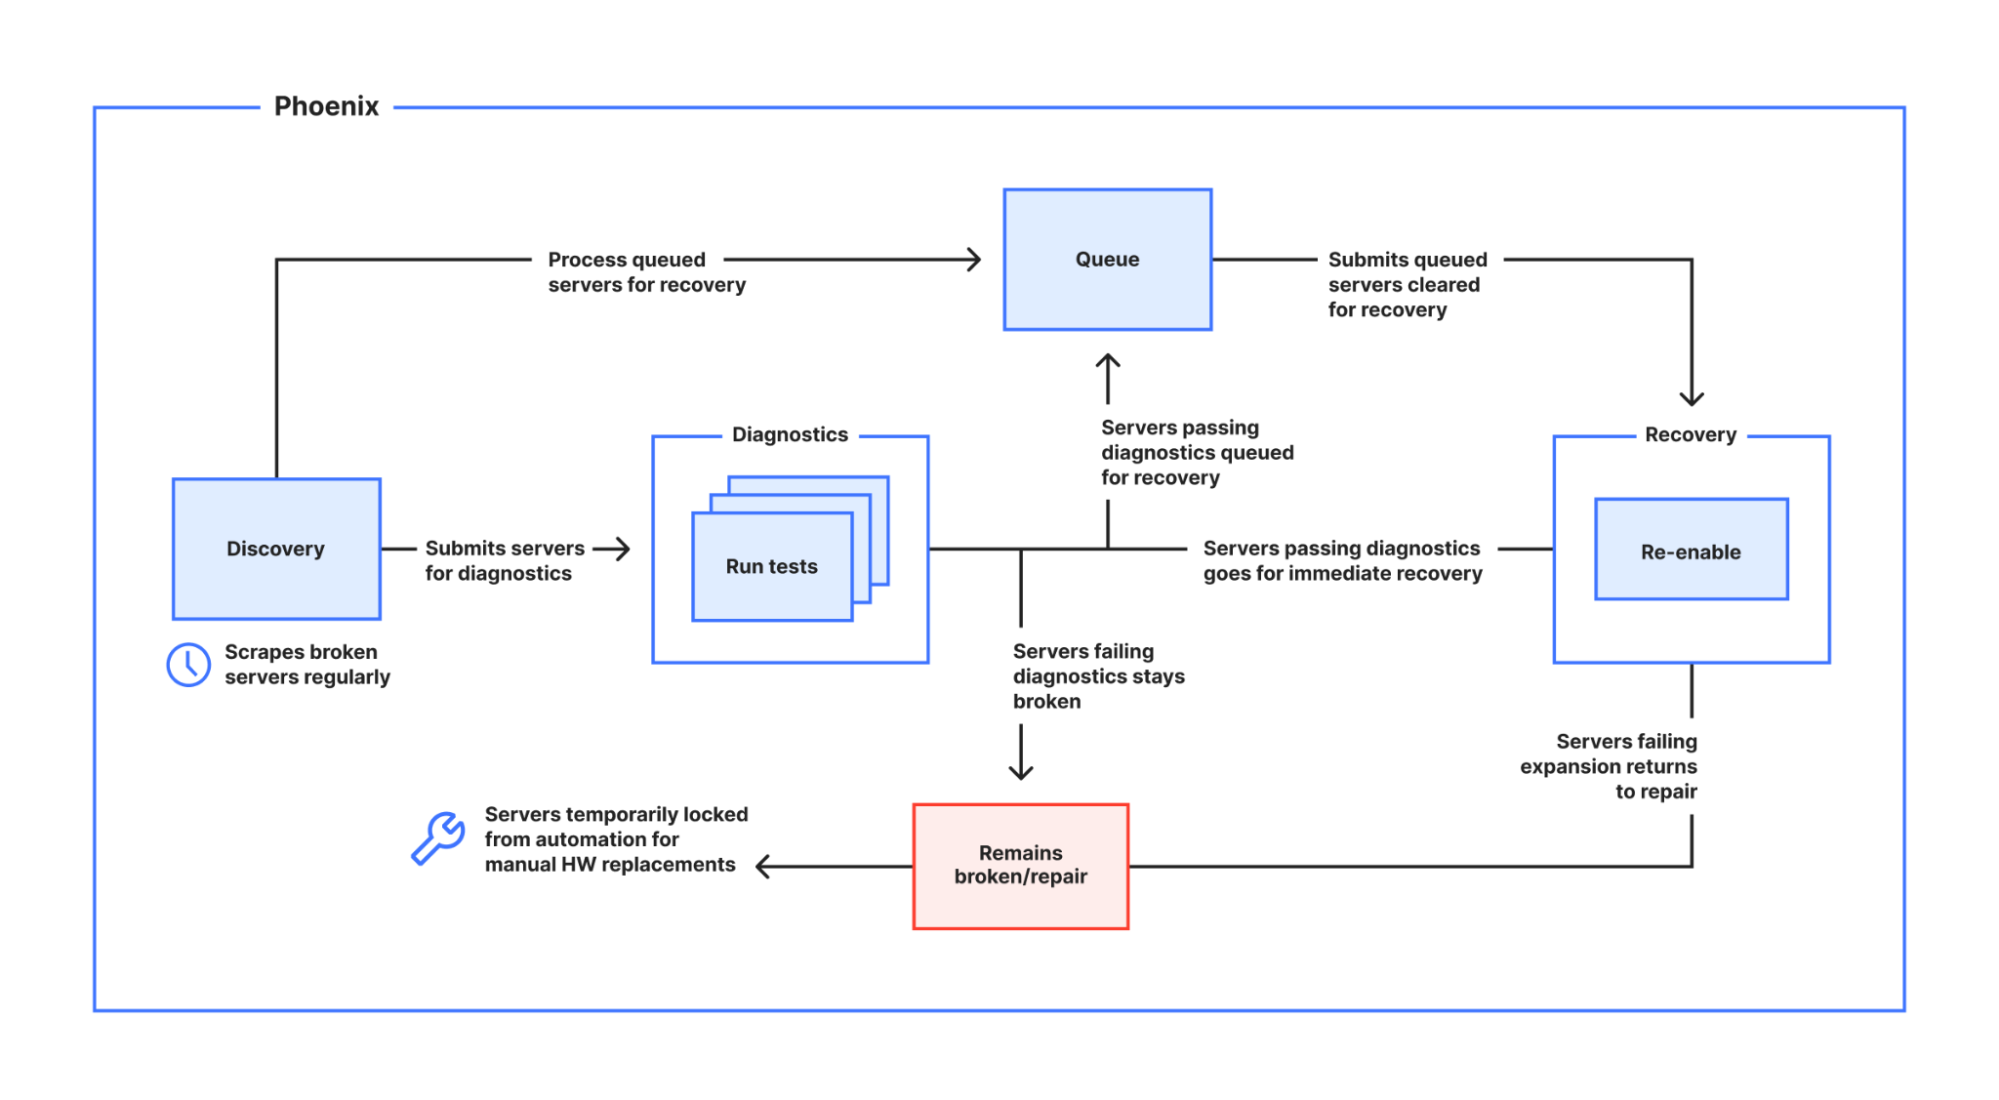
To better understand exactly how Phoenix works, let’s dive into some details about its core functionality.

Discovery

Discovery runs at a regular interval of 30 minutes, selecting a maximum of two Cloudflare data centers that have broken or repair state servers in its fleet, which are all configurable depending on business and operational needs, against which it can immediately execute diagnostics. At this rate, Phoenix is able to discover and operate on all broken servers in the fleet in about 3 days. On each run, it also detects data centers that may have broken servers already queued for recovery, and takes care of ensuring that the Recovery phase is executed immediately.

Diagnostics

Diagnostics takes care of running various tests across the broken servers of a selected data center in a single run, verifying viability of the hardware components, and identifying the candidates for recovery.

A diagnostic operation includes running the following:

  • Out-of-Band connectivity check
    This check determines the reachability of a device via out-of-band network. We employ IPMI (Intelligent Platform Management Interface) to ensure proper physical connectivity and accessibility of devices. This allows for effective monitoring and management of hardware components, enhancing overall system reliability and performance. Only devices that pass this check can progress to the Node Acceptance Testing phase.
  • Node Acceptance Tests
    We leverage an existing internally-built tool called INAT (Integrated Node Acceptance Testing) that runs various tests suites/cases (Hardware Validation, Performance, etc.).

    For every server that needs to be diagnosed, Phoenix will send relevant system instructions to have it boot into a custom Linux boot image, internally called INAT-image. Built into this image are the various tests that need to run when the server boots up, publishing the results to an internal resource in both human-readable (HTML) and machine-readable (JSON) formats, with the latter consumed and interpreted by Phoenix. Upon completion of the boot diagnostics, the server is powered off again to ensure it is not wasting energy.

Our node acceptance tests encompass a range of evaluations, including but not limited to benchmark testing, CPU/Memory/Storage checks, drive wiping, and various other assessments.  Look out for an upcoming in-depth blog post covering INAT.

A summarized diagnostics result is immediately added to the tracking ticket, including pinpointing the exact cause of a failure.

Recovery

Recovery executes what we call an expansion operation, which in its first phase will provision the servers that pass diagnostics. The second phase is to re-enable the successfully provisioned servers back to production, where only those that have been re-enabled successfully will start receiving production traffic again.

Once the diagnostics are passed and the broken servers move on towards the first phase of recovery, we change their statuses from Repair to Pending Provision. If the servers don’t fully recover, for example, because there are server configuration errors or issues enabling services, Phoenix assesses the situation. In such cases, it returns those servers to the Repair state for additional evaluation. Additionally, if the diagnostics indicate that the servers need any faulty components replaced, then Phoenix notifies our Data Center operation team for manual repairs as required, ensuring that the server is not repeatedly selected until the required part replacement is completed. This ensures any necessary human intervention can be applied promptly, making the server ready for Phoenix to rediscover in its next iteration.

An autonomous recovery operation requires infusing intelligence into the automated system so that we can fully trust that it’s able to execute an expansion operation in the safest way possible and handle situations on its own without any human interventions. To do this, we’ve made sure Phoenix is automation-aware – this means that it knows when there are other automations executing certain operations such as expansions, and will only execute an expansion when there are no ongoing provisioning operations in the target data center. This ability to execute only when it’s safe to do so is to ensure that the recovery operation will not interfere with any other ongoing operations in the data center. We’ve also adjusted its tolerance with faulty hardware – this means it’s able to gracefully deal with misbehaving servers by letting these quickly drop out of the recovery candidate list upon misbehavior that prevents blocking the operation.

Visibility

While our autonomous system, Phoenix, seamlessly handles operations without human intervention, it doesn’t mean we sacrifice visibility. Transparency is a key feature of Phoenix. It meticulously logs every operation, from executing tasks to providing progress updates, and shares this information in communication channels like chat rooms and Jira tickets. This ensures a clear understanding of what Phoenix is doing at all times.

Tracking of actions taken by automation as well as the state transitions of a server keeps us in the loop and gives us a better understanding of what these actions were and when they were executed, essentially giving us valuable insights that will help us improve not only the system but our processes as well. Having this operational data allows us to generate dashboards that let various teams monitor automation activities and measure their success. We are able to generate dashboards to guide business decisions and even answer common operational questions related to repair and recovery.

Balancing automation and empathy: Error Budgets

When we launched Phoenix, we were well aware that not every broken server can be re-enabled and successfully returned to production, and more importantly, there’s no 100% guarantee that a recovered server will be as stable as the ones with no repair history – there’s a risk that these servers could fail and end up back in Repair status again.

Although there’s no guarantee that these recovered servers won’t fail again, causing additional work for SRE’s due to the monitoring alerts that get triggered, what we can guarantee is that Phoenix immediately stops recoveries without any human intervention if a certain number of failures for a server are reached in a given time window – this is where we applied the concept of an Error Budget.

The Error Budget is the amount of error that automation can accumulate over a certain period of time before our SRE’s start being unhappy due to the excessive server failures or unreliability of the system. It is empathy embedded in automation.

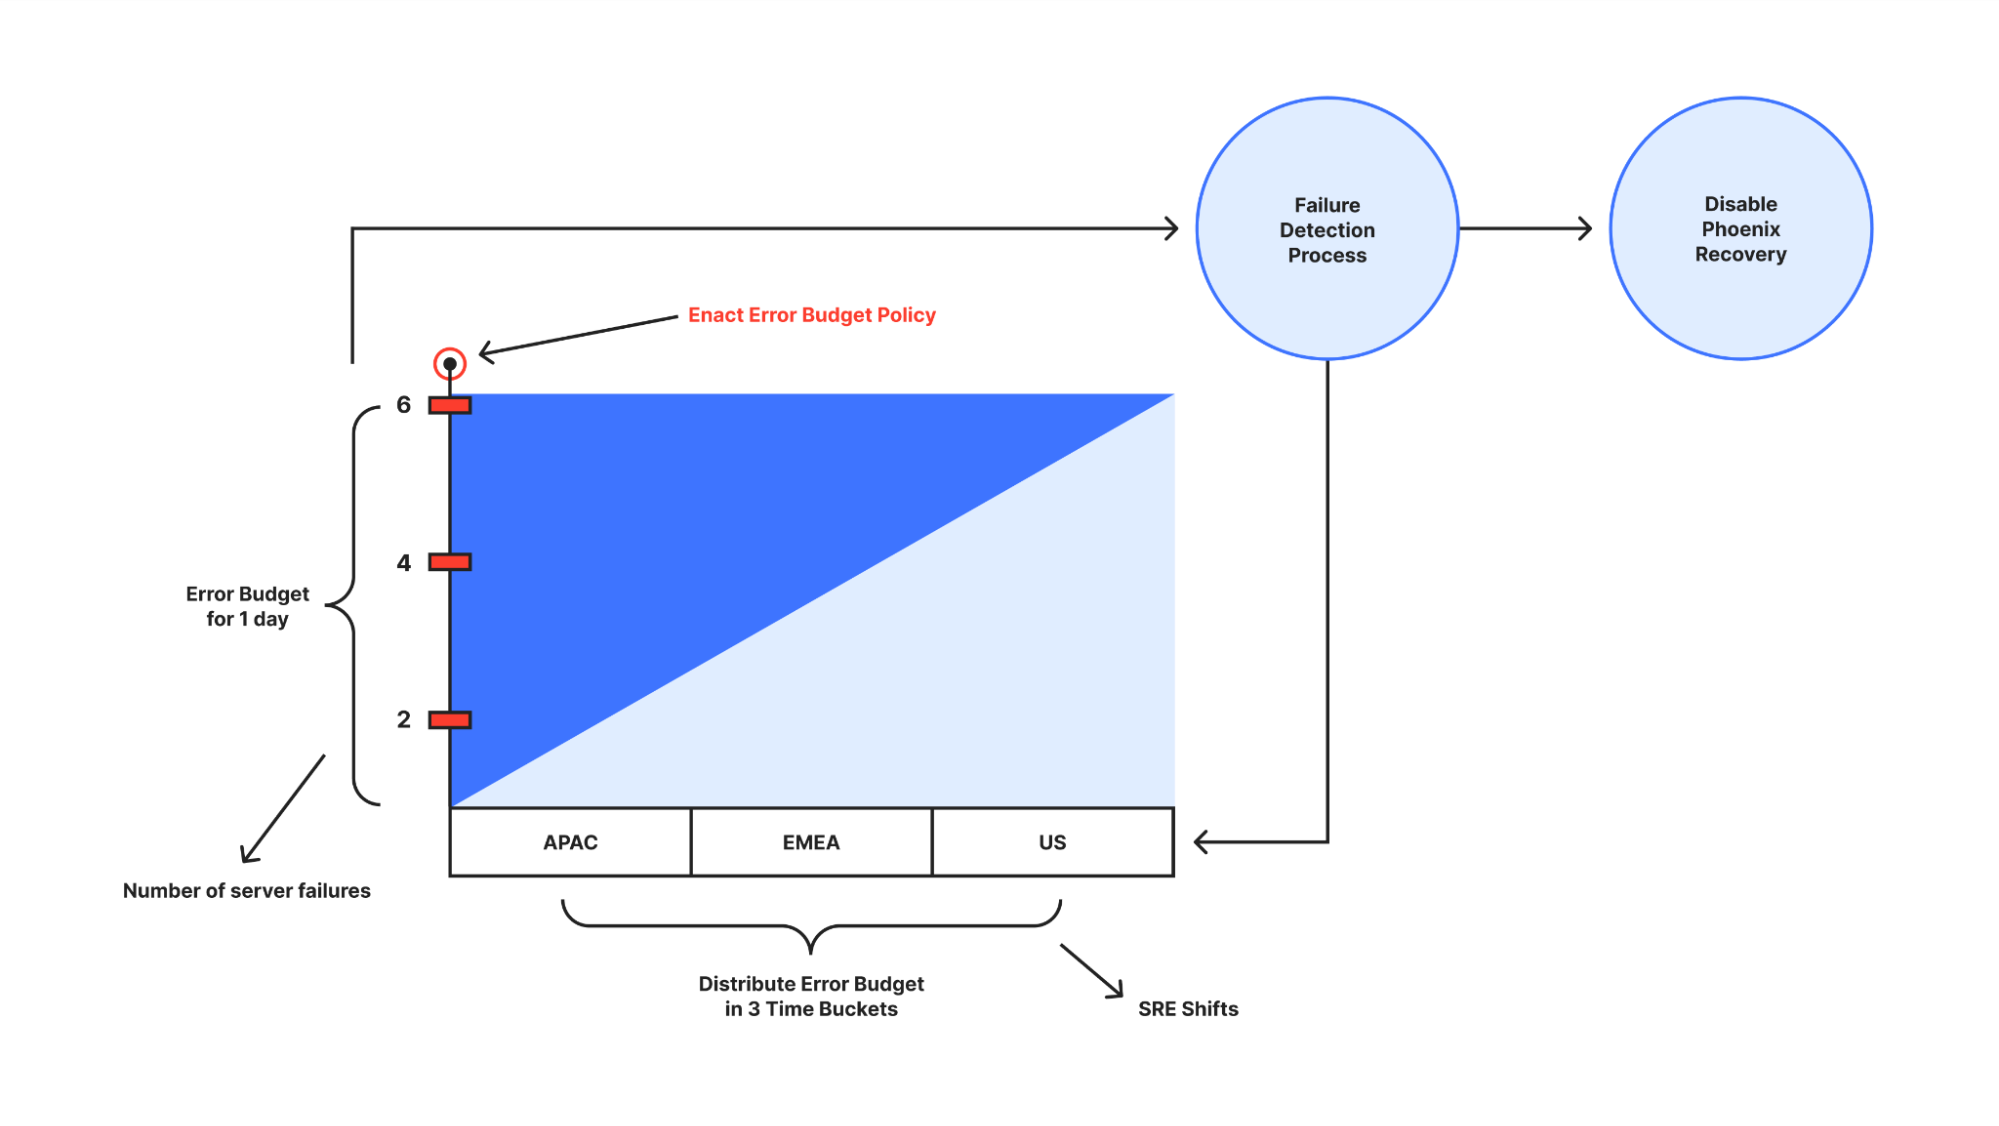
In the figure above, the y-axis represents the error budget. In this context, the error budget applies to the number of recovered servers that failed and were moved back to Repair state again. The x-axis represents the time unit allocated to the error budget – in this case, 24 hours. To ensure that Phoenix is strict enough in mitigating possible issues, we divide the time unit into three consecutive buckets of the same duration – representing the three “follow the sun” SRE shifts in a day. With this, Phoenix can only execute recoveries if the number of server failures is no more than 2. Additionally, Phoenix will also have to compensate succeeding time buckets by deducting the error budget of any excess failures in a given time bucket.

Phoenix will immediately stop recoveries if it exhausts its error budget prematurely. In this context, prematurely means before the end of the time unit for which the error budget was granted. Regardless of the error budget depletion rate within a time unit, the error budget is fully replenished at the beginning of each time unit, meaning the budget resets every day.

The Error Budget has helped us define and manage our tolerance for hardware failures without causing significant harm to the system or too much noise for SREs, and gave us opportunities to improve our diagnostics system. It provides a common incentive that allows both the Infrastructure Engineering and SRE teams to focus on finding the right balance between innovation and reliability.

Where we go from here

With Phoenix, we’ve not only witnessed the significant and far-reaching potential of having an autonomous automated system in our infrastructure, we’re actually reaping its benefits as well. It provides a win-win situation by successfully recovering hardware and ensuring that broken devices are powered off, thus preventing them from consuming unnecessary power while being idle in our racks. This not only reduces energy wastage but also contributes to sustainability efforts and cost savings. Automated processes that operate independently have not only freed our colleagues on various Infrastructure teams from doing mundane and repetitive tasks, allowing them to focus more on areas where they can use their skill sets for more interesting and productive work, but have also led us to evolving our old processes for handling hardware failures and repairs, making us much more efficient than ever.

Autonomous automation is a reality that is now beginning to shape the future of how we are building better and smarter systems here at Cloudflare, and we will continue to invest engineering time for these initiatives.

A huge thank you to Elvin Tan for his awesome work on INAT, and to Graeme, Darrel and David for INAT’s continuous improvements.

Automating data center expansions with Airflow

Post Syndicated from Jet Mariscal original https://blog.cloudflare.com/automating-data-center-expansions-with-airflow/

Automating data center expansions with Airflow

Cloudflare’s network keeps growing, and that growth doesn’t just come from building new data centers in new cities. We’re also upgrading the capacity of existing data centers by adding newer generations of servers — a process that makes our network safer, faster, and more reliable for our users.

Connecting new Cloudflare servers to our network has always been complex, in large part because of the amount of manual effort that used to be required. Members of our Data Center and Infrastructure Operations, Network Operations, and Site Reliability Engineering teams had to carefully follow steps in an extremely detailed standard operating procedure (SOP) document, often copying command-line snippets directly from the document and pasting them into terminal windows.

But such a manual process can only scale so far, and we knew must be a way to automate the installation of new servers.

Here’s how we tackled that challenge by building our own Provisioning-as-a-Service (PraaS) platform and cut by 90% the amount of time our team spent on mundane operational tasks.

Choosing and using an automation framework

When we began our automation efforts, we quickly realized it made sense to replace each of these manual SOP steps with an API-call equivalent and to present them in a self-service web-based portal.

To organize these new automatic steps, we chose Apache Airflow, an open-source workflow management platform. Airflow is built around directed acyclic graphs, or DAGs, which are collections of all the tasks you want to run, organized in a way that reflects their relationships and dependencies.

In this new system, each SOP step is implemented as a task in the DAG. The majority of these tasks are API calls to Salt — software which automates the management and configuration of any infrastructure or application, and which we use to manage our servers, switches, and routers. Other DAG tasks are calls to query Prometheus (systems monitoring and alerting toolkit), Thanos (a highly available Prometheus setup with long-term storage capabilities), Google Chat webhooks, JIRA, and other internal systems.

Here is an example of one of these tasks. In the original SOP, SREs were given the following instructions to enable anycast:

  1. Login to a remote system.
  2. Copy and Paste the command in the terminal.
  3. Replace the router placeholder in the command snippet with the actual value.
  4. Execute the command.

MeanwhileIn our new workflow, this step becomes a single task in the DAG named “enable_anycast”:

enable_anycast = builder.wrap_class(AsyncSaltAPIOperator)(
             task_id='enable_anycast',
             target='{{ params.netops }}',
             function='cmd.run',
             fun_kwargs={'cmd': 'salt {{ get_router(params.colo_name) }} '
                         'anycast.enable --out=json --out-indent=-1'},
             salt_conn_id='salt_api',
             trigger_rule='one_success')

As you can see, automation eliminates the need for a human operator to login to a remote system, and to figure out the router that will be used to replace the placeholder in the command to be executed.

In Airflow, a task is an implementation of an Operator. The Operator in the automated step is the “AsyncSaltAPIOperator”, a custom operator built in-house. This extensibility is one of the many reasons that made us decide to use Apache Airflow. It allowed us to extend its functionality by writing custom operators that suit our needs.

SREs from various teams have written quite a lot of custom Airflow Operators that integrate with Salt, Prometheus, Bitbucket, Google Chat, JIRA, PagerDuty, among others.

Manual SOP steps transformed into a feature-packed automation

The tasks that replaced steps in the SOP are marvelously feature-packed. Here are some highlights of what they are capable of, on top of just executing a command:

Failure Handling
When a task fails for whatever reason, it automatically retries until it exhausts its maximum retry limit that we set for the task. We employ various retry strategies, including instructing tasks to not retry at all, especially when it’s impractical to retry, or when we deliberately do not want it to retry at all regardless of whether there are any retry attempts remaining, such as when an exception is encountered or a condition that is unlikely to change for the better.

Logging
Each task provides a comprehensive log during executions. We’ve written our tasks to ensure that we log as much information as possible that would help us audit and troubleshoot issues.

Notifications
We’ve written our tasks to send a notification with information such as the name of the DAG, the name of the task, its task state, the number of attempts it took to reach a certain state, and a link to view the task logs.

When a task fails, we definitely want to be notified, so we also set tasks to additionally provide information such as the number of retry attempts and links to view relevant wiki pages or Grafana dashboards.

Depending on the criticality of the failure, we can also instruct it to page the relevant on-call person on the provisioning shift, should it require immediate attention.

Jinja Templating
Jinja templating allows providing dynamic content using code to otherwise static objects such as strings. We use this in combination with macros wherein we provide parameters that can change during the execution, since macros are evaluated while the task gets run.

Macros
Macros are used to pass dynamic information into task instances at runtime. Macros are a way to expose objects to templates. In other words, macros are functions that take input, modify that input, and give the modified output.

Adapting tasks for preconditions and human intervention

There are a few steps in the SOP that require certain preconditions to be met. We use sensors to set dependencies between these tasks, and even between different DAGs, so that one does not run until the dependency has been met.

Below is an example of a sensor that waits until all nodes resolve to their assigned DNS records:

verify_node_dns = builder.wrap_class(DNSSensor)(
            task_id='verify_node_dns',
            zone=domain,
            nodes_from='{{ to_json(run_ctx.globals.import_nodes_via_mpl) }}',
            timeout=60 * 30,
            poke_interval=60 * 10,
	mode='reschedule')

In addition, some of our tasks still require input from a  human operator. In these circumstances, we use sensors as blocking tasks that prevent work from starting until certain preconditions are met. We use these to set dependencies between tasks and even DAGs so that one does not run until the dependency has finished successfully.

The code below is a simple example of a task that will send notifications to get the attention of a human operator, and waits until a Change Request ticket has been provided and verified:

verify_jira_input = builder.wrap_class(InputSensor)(
            task_id='verify_jira_input',
            var_key='jira',
            prompt='Please provide the Change Request ticket.',
            notify=True,
            require_human=True)

Another sensor task example is waiting until a zone has been deployed by a Cloudflare engineer as described in https://blog.cloudflare.com/improving-the-resiliency-of-our-infrastructure-dns-zone/.

In order for PraaS to be able to accept human inputs, we’ve written a separate DAG we call our DAG Manager. Whenever we need to submit input back to a running expansion DAG, we simply trigger the DAG Manager and pass in our input as a JSON configuration, which will then be processed accordingly and submit the input back to the expansion DAG.

Automating data center expansions with Airflow

Managing Dependencies Between Tasks

Replacing SOP steps with DAG tasks was only the first part of our journey towards greater automation. We also had to define the dependencies between these tasks and construct the workflow accordingly.

Here’s an example of what this looks like in code:

verify_cr >> parse_cr >> [execute_offline, execute_online]
        execute_online >> silence_highstate_runner >> silence_metals >> \
            disable_highstate_runner

The code simply uses bit shift operators to chain the operations. A list of tasks can also be set as dependencies:

change_metal_status >>  [wait_for_change_metal_status, verify_zone_update] >> \
evaluate_ecmp_management

With the bit shift operator, chaining multiple dependencies becomes concise.

By default, a downstream task will only run if its upstream has succeeded. For a more complex dependency setup, we set a trigger_rule which defines the rule by which the generated task gets triggered.

All operators have a trigger_rule argument. The Airflow scheduler decides whether to run the task or not depending on what rule was specified in the task. An example rule that we use a lot in PraaS is “one_success” — it fires as soon as at least one parent succeeds, and it does not wait for all parents to be done.

Solving Complex Workflows with Branching and Multi-DAGs

Having complex workflows means that we need a workflow to branch, or only go down a certain path, based on an arbitrary condition, which is typically related to something that happened in an upstream task. Branching is used to perform conditional logic, that is, execute a set of tasks based on a condition. We use BranchPythonOperator to achieve this.

At some point in the workflow, our data center expansion DAGs trigger various external DAGs to accomplish complex tasks. This is why we have written our DAGs to be fully reusable. We did not try to incorporate all the logic into a single DAG; instead, we created other separable DAGs that are fully reusable and can be triggered on-demand manually by hand or programmatically — our DAG Manager and the “helper” DAG is an example of this.

The Helper DAG comprises logic that allows us to mimic a “for loop” by having the DAG respawn itself if needed, technically doing cycles. If you recall, a DAG is acyclic, but we have some tasks in our workflow that require us to do complex loops and are solved by using a helper DAG.

Automating data center expansions with Airflow

We designed reusable DAGs early on, which allowed us to build complex automation workflows from separable DAGs, each of which handles distinct and well-defined tasks. Each data center DAG could easily reuse other DAGs by triggering them programmatically.

Having separate DAGs that run independently, that are triggered by other DAGs, and that keep inter-dependencies between them, is a pattern we use a lot. It has allowed us to execute very complex workflows.

Creating DAGs that Scale and Executing Tasks at Scale

Data center expansions are done in two phases:

Phase 1 – this is the phase in which servers are powered on. It boots our custom Linux kernel, and begins the provisioning process.

Phase 2 – this is the phase in which newly provisioned servers are enabled in the cluster to receive production traffic.

To reflect these phases in the automation workflow, we also wrote two separate DAGs, one for each phase. However, we have over 200 data centers, so if we were to write a pair of DAGs for each, we would end up writing and maintaining 400 files!

A viable option could be to parameterize our DAGs. At first glance, this approach sounds reasonable. However, it poses one major challenge: tracking the progress of DAG runs will be too difficult and confusing for the human operator using PraaS.

Following the software design principle called DRY (Don’t Repeat Yourself), and inspired by the Factory Method design pattern in programming, we’ve instead written both phase 1 and phase 2 DAGs in a way that allow them to dynamically create multiple different DAGs with exactly the same tasks, and to fully reuse the exact same code. As a result, we only maintain one code base, and as we add new data centers, we are also able to generate a DAG for each new data center instantly, without writing a single line of code.

Automating data center expansions with Airflow

And Airflow even made it easy to put a simple customized web UI on top of the process, which made it simple to use by more employees who didn’t have to understand all the details.

The death of SOPs?

We would like to think that all of this automation removes the need for our original SOP document. But this is not really the case.  Automation can fail, the components in it can fail, and   a particular task in the DAG may fail. When this happens, our SOPs will be used again to prevent provisioning and expansion activities from stopping completely.

Introducing automation paved the way for what we call an SOP-as-Code practice. We made sure that every task in the DAG had an equivalent manual step in the SOP that SREs can execute by hand, should the need arise, and that every change in the SOP has a corresponding pull request (PR) in the code.

What’s next for PraaS

Onboarding of the other provisioning activities into PraaS, such as decommissioning, is already ongoing.

For expansions, our ultimate goal is a fully autonomous system that monitors whether new servers have been racked in our edge data centers — and automatically triggers expansions — with no human intervention.