Tag Archives: automation

How to automate incident response for Amazon EKS on Amazon EC2

Post Syndicated from Jonathan Nguyen original https://aws.amazon.com/blogs/security/how-to-automate-incident-response-for-amazon-eks-on-amazon-ec2/

Triaging and quickly responding to security events is important to minimize impact within an AWS environment. Acting in a standardized manner is equally important when it comes to capturing forensic evidence and quarantining resources. By implementing automated solutions, you can respond to security events quickly and in a repeatable manner. Before implementing automated security solutions, it’s important for your security team to have a defined process and understanding of which actions to take for specific AWS resources.

In a previous two-part post, we discussed using Amazon GuardDuty and Amazon Detective to detect security issues for an Amazon Elastic Kubernetes Service (Amazon EKS) cluster. In this post, we walk through the differences of Amazon Elastic Cloud Compute (Amazon EC2) and EKS clusters on EC2 when responding to security events. By understanding the differences between the two AWS resource types, you can enhance your existing EC2 incident response (IR) automation to include EKS. Then, we walk you through the deployment and use of a sample solution based on the Automated Forensics Orchestrator for Amazon EC2 solution to automate the end-to-end incident response process for EKS, which includes acquisition, isolation, investigation and reporting.

If you’re familiar with the differences between responding and investigating Amazon EC2 and Amazon EKS resources and want to skip to the solution, skip to the Solution prerequisites.

Note: Amazon EKS on AWS Fargate, which is an AWS managed serverless computing engine, isn’t covered in this post.

Amazon EC2 compared to Amazon EKS resources for incident response

Although Amazon EKS clusters are running on EC2 instances, it’s important to understand the differences between the two and how to handle incident response automation for each resource type. EC2 is a virtual machine where you can install customized applications and packages to complete a task. Amazon EKS is an AWS managed service that you can use to run Kubernetes on EC2 instances without needing to install, operate, and maintain your own Kubernetes control plane or nodes. You can use existing plugins and tooling from the Kubernetes community. EKS clusters can have managed node groups, which create and manage the underlying EC2 instances. Because of Kubernetes cluster architecture, multiple EC2 instances within a node group can be tied to a single EKS cluster. There can also be multiple pods—each running different processes—running on an EC2 instance. GuardDuty can monitor and detect security events for EKS resources and provide information to help identify which resources are impacted, such as EKS cluster name, Kubernetes workload details, tags, and AWS Identity and Access Management (IAM) principals.

For incident response automation purposes, security teams need to understand the relationship between Amazon EKS and Amazon EC2 to determine the appropriate response to a possible security event. For example, if GuardDuty identifies Execution:Kubernetes/AnomalousBehavior.ExecInPod, you might want to investigate the command invoked on the identified pod along with other pods within the EKS cluster. To expand the investigation, you would need to capture and investigate evidence on the entire EKS cluster, which can include multiple EC2 instances.

Accessing Amazon EKS clusters using kubectl

To collect relevant forensic evidence, such as volatile memory, there might be instances where you need to run commands on Amazon EKS clusters. Kubectl is a command line tool that you can use to manage and run commands on EKS clusters using the Kubernetes API. Access with kubectl is limited to the container environment and doesn’t provide full shell access to the host. Although AWS Systems Manager (AWS SSM) can be used to interact with an EKS cluster’s EC2 instances, kubectl allows administrators to manage pods, scale applications, and view cluster logs. We dive into specific actions where kubectl is used in the later sections of this post.

When automating the workflow of response actions to an Amazon EKS cluster, you can incorporate the kubectl commands within Amazon Lambda functions. To invoke commands using kubectl, you need to get credentials for the EKS cluster to:

  1. Authenticate to an IAM principal authorized to work with Amazon EKS
  2. Obtain the EKS cluster endpoint
  3. Verify the certificate authority data for the EKS endpoint
  4. Generate a bearer token from the IAM principal
  5. Create a kubeconfig configuration dictionary

For more detailed information, see A Container-Free Way to Configure Kubernetes Using AWS Lambda and a deep dive into simplified Amazon EKS access management.

Capturing volatile memory on EKS

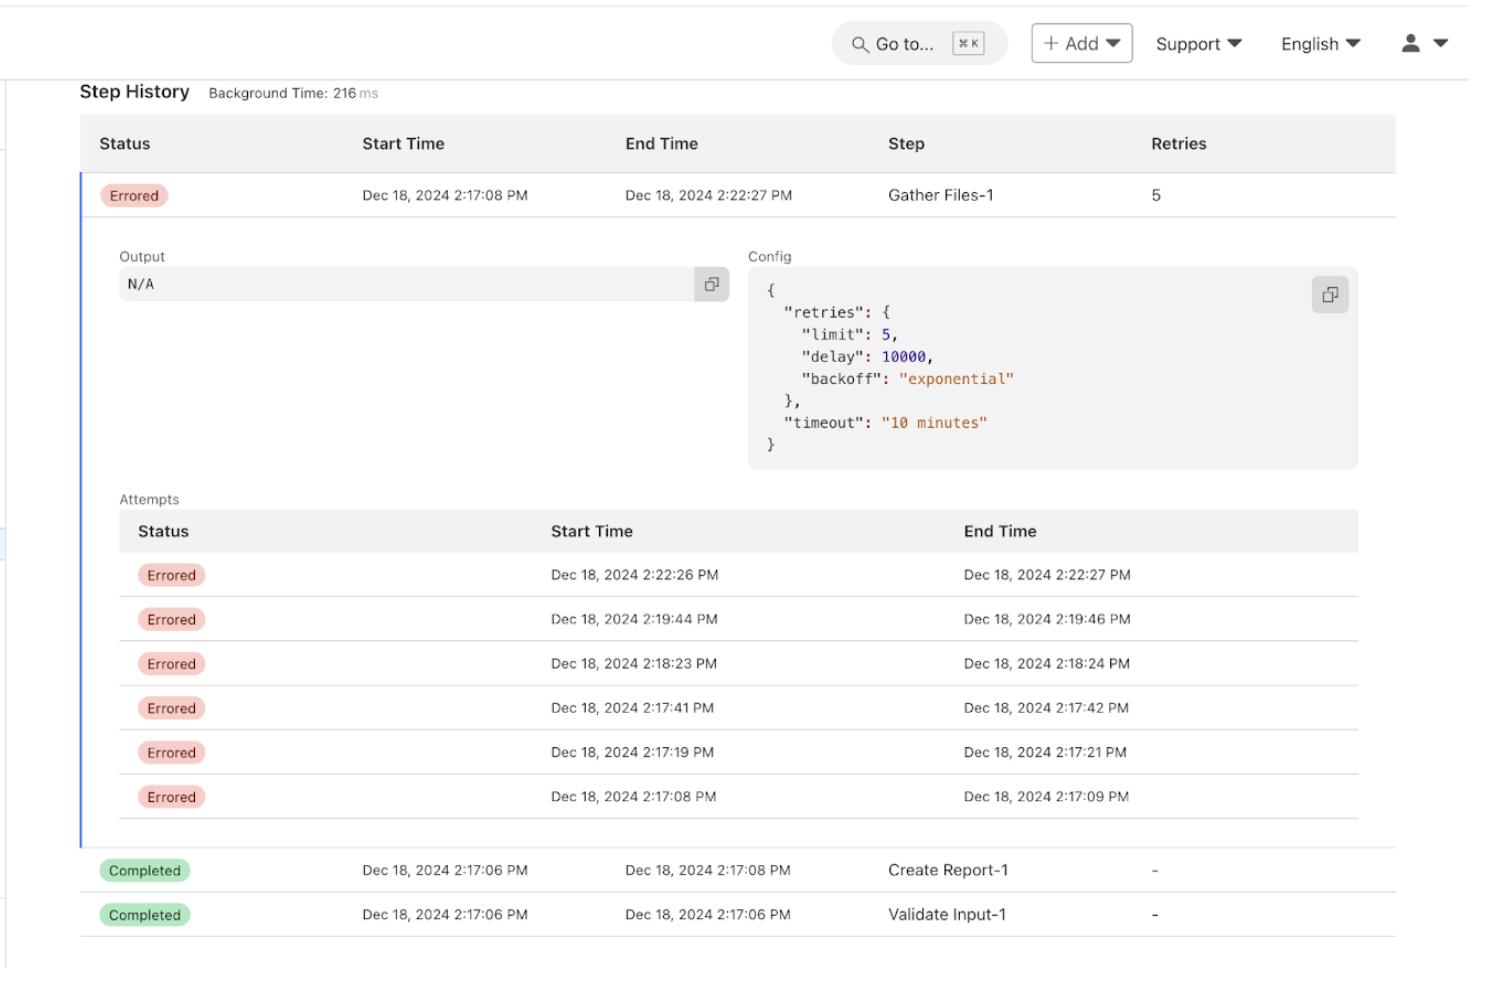
Volatile memory (RAM) in a memory dump is important because it contains the EC2 instance’s in-progress operations. Volatile memory is extremely important in determining the root cause of a security event. Although the commands for capturing volatile memory between EC2 instances and Amazon EKS clusters are similar, there is one important difference to keep in mind. For Linux operating systems, you can use the insmod command with the appropriate LiME kernel module (.ko file) to capture volatile memory:

sudo insmod $lime.ko "path=/path/to/dump.mem format=lime"

For Amazon EKS cluster EC2 instances, there can be multiple pods on a single EC2 instance. Knowing which process ID (PID) is associated to a pod is important to map the actions that could have resulted in a security event or compromise.

Figure 1: EKS cluster node list

Figure 1: EKS cluster node list

To get a list of PIDs on the EC2 instance, as shown in Figure 1, the following crictl command needs to be invoked:

crictl inspect $(crictl ps | grep [pod-name] | awk '{print $1}') | grep -i pid

After the crictl command is invoked, you will see the output of existing PIDs for the EC2 instance to use in the nsenter command, as shown in the following figure.

Figure 2: EKS node process ID list

Figure 2: EKS node process ID list

To create a mapping between a pod and the PID from a memory dump, the following nsenter command needs to be invoked on the target EC2 instance:

nsenter -t $PID -u hostname

After the nsenter command is invoked, you will see the output of pod and PID information for the EC2 instance, as shown in the following figure.

Figure 3: EKS node process ID to pod mapping commands

Figure 3: EKS node process ID to pod mapping commands

After you have the pod-to-PID mapping, you can export that information for later investigation. If you skip this step, the memory dump output will still have the PID information, but you won’t be able to map it back to previously running pods. It’s important to work with your security teams during forensic investigations to determine if this information is used during an investigation and update the automated workflow accordingly.

Network segmentation on EKS

After relevant forensic artifacts, such as volatile memory, disk volumes, and application logs, are collected from an Amazon EKS cluster, you might want to isolate compromised resources from the rest of your application resources. During resource isolation, EC2 instances can be isolated using security groups and network access control lists (NACLs). For EKS clusters, you can cordon the worker node, which makes the node tainted and unschedulable. When a node is cordoned, the Kubernetes scheduler is also blocked from placing new pods on the node. Another mechanism for isolating the EKS cluster is applying a Network Policy to deny ingress or egress traffic to the pod. Network policies, like NACLs, are stateless and control network traffic at the IP address or port level in an EKS cluster.

Depending on the scope of isolation, you can take the following approaches to isolating a pod on an EKS cluster in your automation.

  • Apply a network policy – You can add a network policy rule to limit ingress or egress from your pod. This will not impact other pods in the cluster unless there are additional rules applied. You would use this option if you’re sure that the compromise hasn’t gained access to the underlying EC2 instance.
  • Cordon the node – Removing the node won’t impact other nodes on the cluster but will block the scheduling of pods on the node. It doesn’t affect other nodes within the cluster.
  • Apply a security group – Applying a security group can impact the entire EC2 instance and limit traffic between Amazon EKS cluster nodes, the Kubernetes control plane, the cluster’s worker nodes, and external destinations. This is an option if you believe the underlying EC2 instance has been compromised.
  • Add a NACL rule – Like the security group option, this will impact the entire EC2 instance. Depending on the rule, it can also affect non-EKS workloads within the subnet.

Identity and access management for EKS

In addition to the IAM role associated to an EC2 instance profile, Amazon EKS uses service-linked IAM roles and Kubernetes role-based authorization control (RBAC) configuration. The IAM principal that creates the EKS cluster has system:masters permissions within the RBAC configuration on the EKS cluster. RBAC provides Kubernetes identities access for cluster-specific components and workflows. In addition to default identities created on EKS clusters, application-specific roles can be used within an EKS cluster. For example, IAM roles for service accounts (IRSA) can be used to associate an IAM role with a Kubernetes service account and assigned to containers within an EKS Pod. IRSA can help implement least privilege by restricting the Pod’s container to retrieve credentials for the IAM role associated with the Kubernetes service account. For a deeper dive into EKS IAM and how IAM roles are used within EKS, see Identity and access management for Amazon EKS.

Deciding how to revoke Amazon EKS permissions using automation can be challenging because revoking the AWS Security Token Service (AWS STS) credentials or changing the instance profile on the EC2 instance will impact all pods on the EC2 instance. Updating or changing the RBAC configurations on an EKS cluster requires application-specific knowledge to determine which identities are authorized to have specific permissions. It’s important to discuss with your application and security teams how permissions should be handled in the event of a compromised EKS cluster.

Moving to automated EKS incident response

Now that you understand the nuances of Amazon EKS on Amazon EC2 as it relates to incident response, you can decide how to incorporate functionality to respond to EKS in an existing solution your team might be using. It’s also important to understand where a human-in-the-loop needs to be incorporated to follow internal processes and procedures. Before incorporating automation into IR capabilities, you should walk through each step and verify the action the automation takes to make sure that the security and application teams are aligned. In this post, we incorporated Amazon EKS IR capabilities across acquisition, isolation, and investigation into the Automated Forensics Orchestrator for Amazon EC2 solution.

Solution prerequisites

For this walkthrough, you need to have the following elements in place:

Solution overview

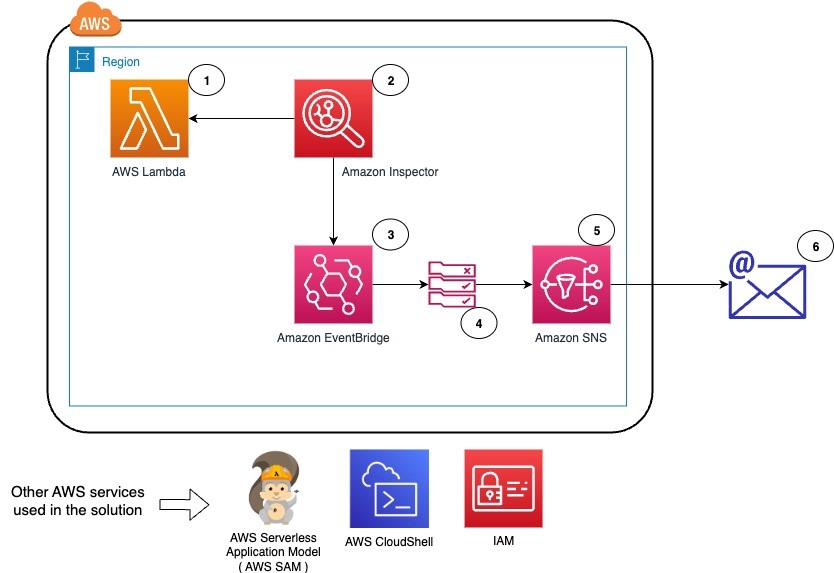
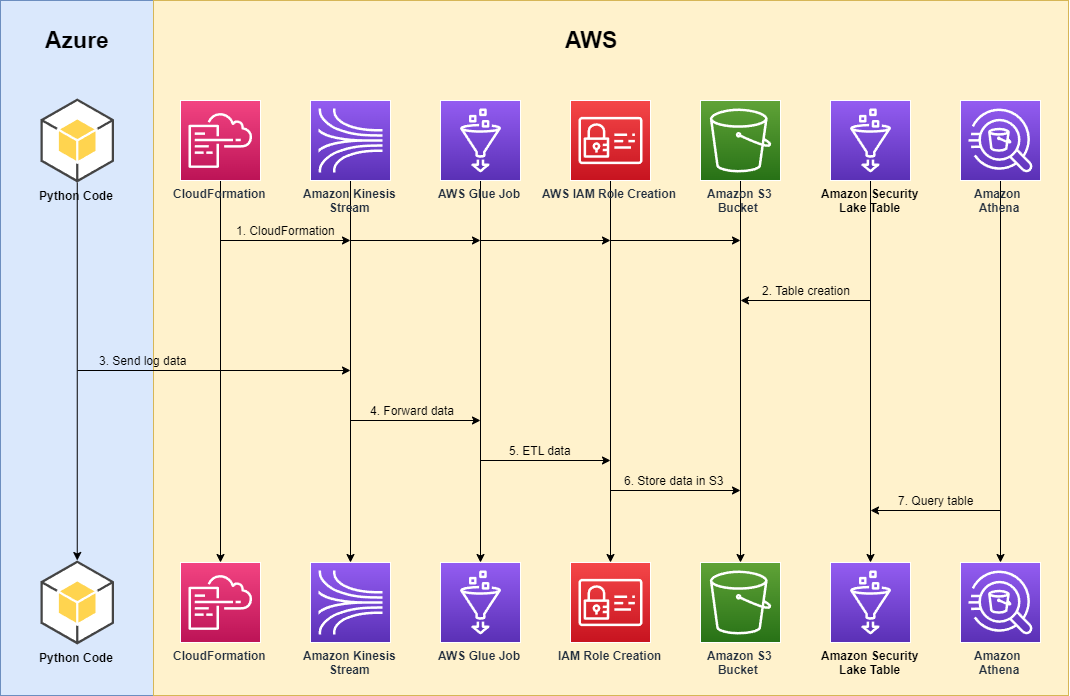
The solution follows a similar pattern and workflow as the Automated Forensics Orchestrator for Amazon EC2 but has been customized for Amazon EKS.

Figure 4: Automated Forensics Orchestrator for Amazon EKS architecture

Figure 4: Automated Forensics Orchestrator for Amazon EKS architecture

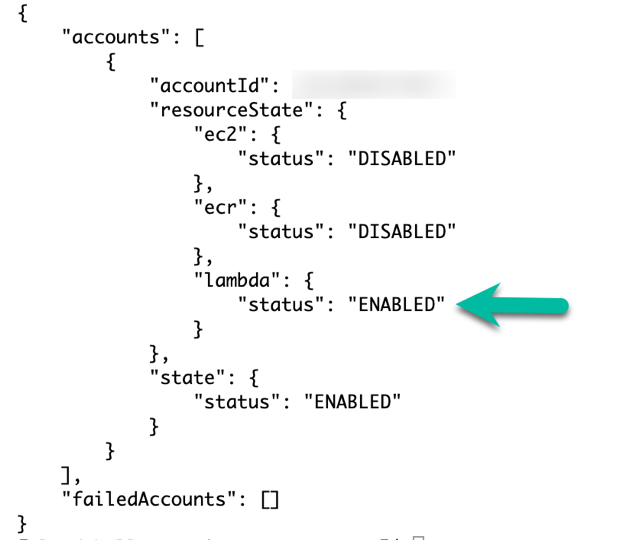
The workflow, as shown in Figure 4, is:

  1. In the AWS application account, GuardDuty monitors for malicious activities that are specific to Amazon EKS resources. For example, a pod within an EKS cluster is invoking API commands using an unauthenticated system:anonymous user. GuardDuty findings are sent to Security Hub in the security account using native integration.
  2. Security Hub custom actions send finding information to Amazon EventBridge to invoke automated downstream workflows.
  3. For a specified event, EventBridge provides the EKS resource information for the forensics process to target and initiates an AWS Step Functions workflow.
  4. Step Functions triages the request as follows:
    1. Gets the EKS information, including which EC2 instances the pod is hosted on.
    2. Determines if isolation is required based on the Security Hub custom action.
    3. Determines if acquisition is required based on tags associated with the EC2 instance. The current tag that is evaluated is the following:
      • Tag name: IsTriageRequired
      • Tag key: true or false
    4. Initiates the acquisition flow based on triaging output
  5. Triaging details are stored in Amazon DynamoDB.
  6. The following two acquisition flows are initiated in parallel:
    1. Memory forensics flow – The Step Functions workflow captures the memory data and stores it in Amazon Simple Storage Service (Amazon S3). Post memory acquisition completion, the node is isolated by cordoning the node, creating a network policy, and applying a restricted security group to the cluster. To help maintain the chain of custody, a new security group is attached to the targeted instance and removes access for users, admins, or developers.
    2. Note: The isolation action is initiated based on the selected Security Hub custom action.

    3. Disk forensics flow – The Step Functions workflow takes a snapshot of the Amazon Elastic Block Storage (Amazon EBS) volume and shares it with the forensic account.
  7. Acquisition details are stored in DynamoDB.
  8. After the disk or memory acquisition process is complete, and the evidence has been captured successfully, a notification is sent to an investigation Step Functions state machine to begin the automated investigation of the captured data.
  9. The investigation Step Functions starts a forensic instance from a forensic AMI loaded with customer forensic tools:
    1. Loads the memory data from Amazon S3 for memory investigation.
    2. Creates an Amazon EBS volume from the snapshot and attaches it for disk analysis.
  10. Systems Manager documents (SSM documents) are used to run a forensic investigation.
  11. DynamoDB stores the state of the forensic tasks and their result when the jobs are complete. Investigation job details are stored in DynamoDB.
  12. Investigation details are shared with customers using Amazon Simple Notification Service (Amazon SNS).
  13. Forensic AMI is used by investigation Step Functions to perform memory and disk investigation.

Solution deployment

You can deploy the Amazon EKS IR automation solution using the AWS CDK or synthesizing a CDK into AWS CloudFormation templates and deploying them using AWS Management Console. Although the solution can be deployed in a single AWS account, the AWS Security Reference Architecture (AWS SRA) recommends that you use separate AWS accounts for forensic evidence and security tooling. The solution deployment follows AWS SRA recommendations.

The latest code for the Amazon EKS IR automation solution can be found at sample-eks-incident-response-automation, where you can also contribute to the sample code. For instructions and more information about using the AWS CDK, see Getting Started with AWS CDK.

Deploy the automation that collects, stores, and investigates forensic artifacts in the forensic AWS account:

  1. To build the app when navigating to the project’s root folder, use the following commands.
    • npm ci
    • npm run-build-lambda
  2. Run the following commands in your terminal while authenticated in your forensic solution AWS account. Be sure to replace <INSERT_AWS_ACCOUNT> with your account number and replace <INSERT_REGION> with the AWS Region that you want the solution deployed to.
  3. cdk bootstrap aws://<INSERT_AWS_ACCOUNT>/<INSERT_REGION>
    
    cdk deploy --all -c account=<INSERT Forensic AWS Account> -c region=<INSERT_FORENSIC_SOLUTION_REGION> --require-approval=never -c secHubAccount=<INSERT SECURITY_HUB_AGGREGATOR_AWS_ACCOUNT> -c STACK_BUILD_TARGET_ACCT=forensicAccount
    

    Example:

    cdk deploy —all -c account=1234567890 -c region=us-east-1 —require-approval=never -c secHubAccount=0987654321 -c STACK_BUILD_TARGET_ACCT=forensicAccount

Deploy the Security Hub custom action and EventBridge in the Security Hub Region of the delegated administrator account where security findings are consolidated:

  1. To build the app when navigating to the project’s root folder, use the following commands.
    • npm ci
    • npm run build-lambda
  2. Run the following commands in your terminal while authenticated in your Security Hub aggregator AWS account. Be sure to replace <INSERT_AWS_ACCOUNT> with your account number and replace <INSERT_REGION> with the AWS Region that you want the solution deployed to.
  3. cdk bootstrap aws://<INSERT_AWS_ACCOUNT>/<INSERT_REGION>
    	
    	cdk deploy --all -c account=<INSERT_SECURITY_HUB_AGGREGATOR_AWS_ACCOUNT> -c region=<INSERT_FORENSIC_SOLUTION_REGION> --require-approval=never -c forensicAccount=<INSERT_FORENSIC_SOLUTION_AWS_ACCOUNT> -c STACK_BUILD_TARGET_ACCT=securityHubAccount -c sechubregion=<INSERT_SECURITY_HUB_AGGREGRATOR_REGION>
    

    Example:

    cdk deploy --all -c account=0987654321 -c region=us-east-1 --require-approval=never -c forensicAccount=1234567890 -c STACK_BUILD_TARGET_ACCT=securityHubAccount -c sechubregion=us-east-1

Deploy the cross-account IAM role the security automation will use in the application AWS account where the EKS workload exists:

  1. Sign in to the AWS CloudFormation console of the application AWS account.
  2. Launch the CloudFormation cross-account-role.yml stack.
  3. Pass the following CloudFormation input parameters:
    1. solutionInstalledAccount=<Forensic Solution AWS Account Number>
    2. solutionAccountRegion=<Region of solution deployment>
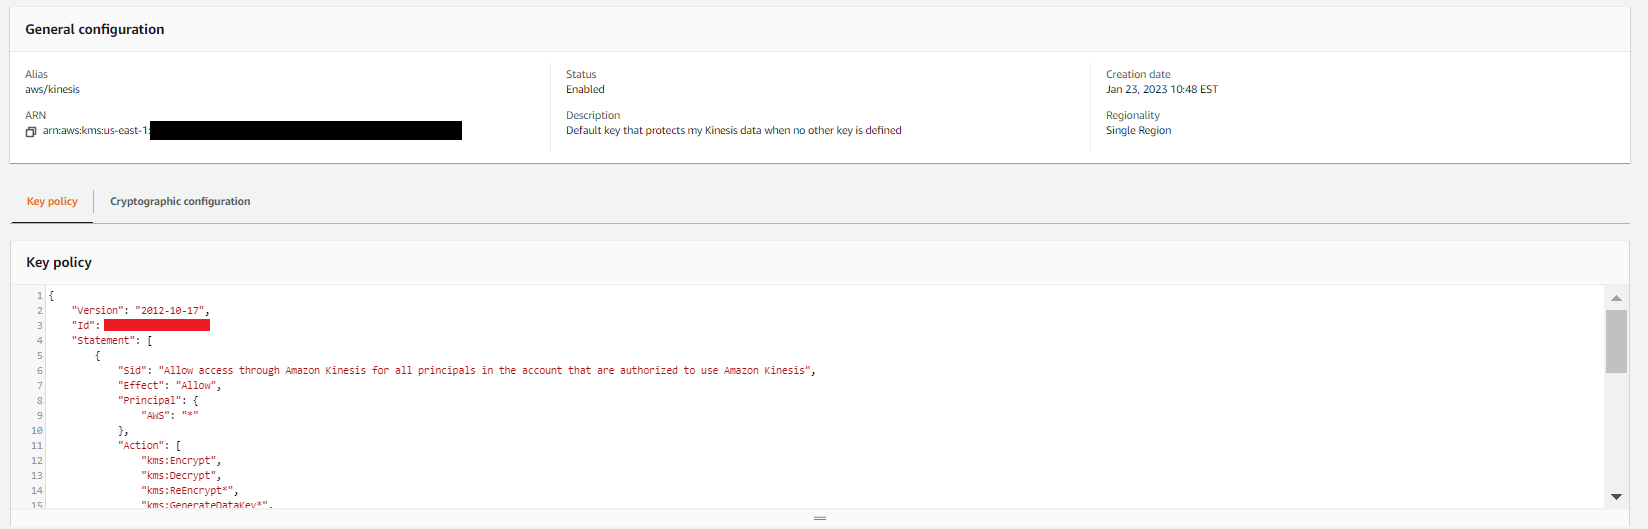
    3. kmsKey=<ARN of the application account EBS volume encryption KMS key>

Use the solution to respond to an EKS GuardDuty alert

You can now use the automated solution on an Amazon EKS cluster with a GuardDuty finding that’s integrated with Security Hub. If you need to create GuardDuty findings, see How to generate security findings to help your security team with incident response simulations.

After you have an EKS security finding, you can go through either one of the IR workflows:

  • Forensic triage – This workflow evaluates in-scope EKS resources, collects volatile and non-volatile memory, conducts an investigation, and exports investigation artifacts to a forensic S3 bucket.
  • Forensic isolation – In addition to components of the previous workflow, the in-scope EKS resources are quarantined at the network and IAM layers.

In this example, you’ll use the forensic isolation workflow because that covers the end-to-end capabilities of the solution.

Run the forensic isolation workflow:

  1. Open the AWS Security Hub console in the Security Hub aggregator account.
  2. Choose Findings in the navigation pane and then select a security finding for Amazon EKS.
  3. Select the custom action for Forensic Isolation. This will start the workflow in the Security Hub aggregator account and invoke the Step Functions in the forensic account.
  4. Open the AWS Step Functions console in the forensic account.
  5. In the navigation pane, choose State Machines and then select the Forensic-Triage-Function to view the workflow graph status. In the following figure, the Step Functions workflow has successfully completed.
    Figure 5: EKS triage Step Functions graph view

    Figure 5: EKS triage Step Functions graph view

    1. In the Get Resource Info Case step, the pod name from the GuardDuty finding is extracted to identify the EKS cluster it’s part of and the related EC2 resources.
    2. Note: Per the solution, a guardrail is added to block action on an EC2 instance that is part of an EKS cluster with the IsTriageRequired tag with a value set to false. If automation is invoked against a protected EC2 instance resource, acquisitionFlow is skipped and a notification will be sent to the SNS topic.

  6. Because the EKS cluster isn’t excluded through the IsTriageRequired tag, a parallel invocation of Step Functions is invoked to capture forensic evidence.
  7. Select the Disk-Forensics-Acquisition-Function. The workflow here is similar to a normal EC2 incident response flow to capture snapshots and EBS volumes with the caveat that the EKS cluster can have multiple EC2 instances. In the following figure, the Step Functions workflow has successfully completed.
    Figure 6: Disk forensics acquisition Step Functions graph view

    Figure 6: Disk forensics acquisition Step Functions graph view

  8. Select the Memory-Forensics-Acquisition-Function; In the following figure, the Step Function workflow has successfully completed.
    Figure 7: Memory forensics acquisition Step Functions graph view

    Figure 7: Memory forensics acquisition Step Functions graph view

    1. As previously mentioned, you will need to determine if you want to map pods to process ID (PID) as part of this workflow. The automation captures the volatile memory where you will be able see the PIDs on the EC2 instance but does not map the PID to node for deeper investigation.
    2. Note: One reason you might not want to automatically map pods to PIDs is to minimize interaction with the possibly compromised cluster and quickly move towards isolation.

    3. After the Is Memory Acquisition Complete step is complete and if the Security Hub custom action for Forensic Isolation was selected, the isolation workflow of the EKS cluster begins. The isolation workflow will go through EKS-specific steps to:
      1. Label the affected pods on the EKS cluster.
      2. Apply a network policy to the affected pods.
      3. Revoke IAM role sessions.
      4. Cordon the node.
  9. Note: Depending on your desired workflow, you can edit these steps or add additional isolation steps to change instance profiles, security groups, or NACL rules.

  10. To expedite the investigation process, the
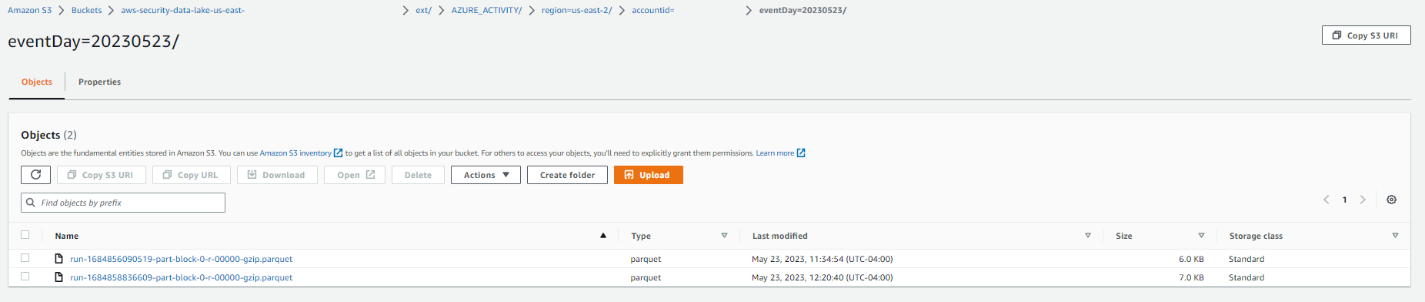
 Forensic-Investigation-Function is invoked when the Memory-Forensics-Acquisition-Function is completed and separately by the Disk-Forensics-Acquisition-Function. This is because of the disk and memory forensic evidence collection completing at different times. A forensic EC2 instance will be launched and begin conducting the investigation on the forensic artifacts. The completed investigation artifacts will be sent to Amazon S3 as they’re completed.
    1. You can use the console to view EKS artifacts within the dedicated S3 bucket in the forensic AWS account.
    2. Figure 8: Completed memory investigation artifacts for EKS

      Figure 8: Completed memory investigation artifacts for EKS

    3. The forensic investigation results from the automated workflow are also saved to the dedicated S3 bucket in the forensic AWS account.
Figure 9: Completed disk investigation artifacts for EKS

Figure 9: Completed disk investigation artifacts for EKS

As part of the automation, the forensic investigation EC2 instance in the forensic account is terminated after investigation is completed. The automation can be updated to retain the EC2 instance to so that your security teams can continue their investigation and review investigation artifacts to expedite root cause analysis.

As previously mentioned, the workflow you just went through encompasses both investigation and isolation of Amazon EKS resources. If your security teams want to conduct a more thorough investigation prior to isolating EKS resources, select the Forensic Triage custom action in Security Hub. Additionally, if you want to update the solution to be invoked from your security incident and event management (SIEM) tool, you can directly invoke the Forensic-Triage-Function Step Functions from your SIEM.

Clean up

For the cross-account IAM role in the application account, you can:

  1. Go to the AWS CloudFormation console for the application account and Region where you deployed the cross-account IAM role, select the cross-account-role stack.
  2. Choose the option to Delete the stack.

To clean up the CDK stacks, run the following command in the source folder in the Security Hub aggregator account and forensic account.

cdk destroy --all

Conclusion

In this post, we showed you the differences between Amazon EKS and Amazon EC2 resources and how to handle EKS automation for incident response. Even though EKS clusters are on EC2 instances, it’s important to understand the differences before implementing an automated solution that will affect EKS resources. We also walked through the deployment of an EKS-customized Automated Forensics Orchestrator for Amazon EC2 solution and showed you the end-to-end IR lifecycle to respond to a possible EKS compromise. The same approach to customize existing EC2 IR automated solutions can be used to expand support for EKS resources within your AWS environment to increase your security posture.

If you have feedback about this post, submit comments in the comments section that follows. If you have questions about this post, start a thread on re:Post.

Jonathan Nguyen
Jonathan Nguyen

Jonathan is a Principal Security Solution Architect at AWS. He helps large financial services customers develop a comprehensive security strategy and solutions to meet their security and compliance requirements in AWS.
Gopinath Jagadesan
Gopinath Jagadesan

Gopi is a Senior Solution Architect at AWS. In his role, he works with Amazon as his customer helping design, build, and deploy well architected solutions on AWS. He holds a master’s degree in electrical and computer engineering from the University of Illinois at Chicago. Outside of work, he enjoys playing soccer and spending time with his family and friends.

How we simplified NCMEC reporting with Cloudflare Workflows

Post Syndicated from Mahmoud Salem original https://blog.cloudflare.com/simplifying-ncmec-reporting-with-cloudflare-workflows/

Cloudflare plays a significant role in supporting the Internet’s infrastructure. As a reverse proxy by approximately 20% of all websites, we sit directly in the request path between users and the origin, helping to improve performance, security, and reliability at scale. Beyond that, our global network powers services like delivery, Workers, and R2 — making Cloudflare not just a passive intermediary, but an active platform for delivering and hosting content across the Internet.

Since Cloudflare’s launch in 2010, we have collaborated with the National Center for Missing and Exploited Children (NCMEC), a US-based clearinghouse for reporting child sexual abuse material (CSAM), and are committed to doing what we can to support identification and removal of CSAM content.

Members of the public, customers, and trusted organizations can submit reports of abuse observed on Cloudflare’s network. A minority of these reports relate to CSAM, which are triaged with the highest priority by Cloudflare’s Trust & Safety team. We will also forward details of the report, along with relevant files (where applicable) and supplemental information to NCMEC.

The process to generate and submit reports to NCMEC involves multiple steps, dependencies, and error handling, which quickly became complex under our original queue-based architecture. In this blog post, we discuss how Cloudflare Workflows helped streamline this process and simplify the code behind it.

Life before Cloudflare Workflows

When we designed our latest NCMEC reporting system in early 2024, Cloudflare Workflows did not exist yet. We used the Workers platform Queues as a solution for managing asynchronous tasks, and structured our system around them.

Our goal was to ensure reliability, fault tolerance, and automatic retries. However, without an orchestrator, we had to manually handle state, retries, and inter-queue messaging. While Queues worked, we needed something more explicit to help debug and observe the more complex asynchronous workflows we were building on top of the messaging system that Queues gave us.

In our queue-based architecture each report would go through multiple steps:

  1. Validate input: Ensure the report has all necessary details.

  2. Initiate report: Call the NCMEC API to create a report.

  3. Fetch impounded files (if applicable): Retrieve files stored in R2.

  4. Upload files: Send files to NCMEC via API.

  5. Finalize report: Mark the report as completed.


A diagram of our queue-based architecture 

Each of these steps was handled by a separate queue, and if an error occurred, the system would retry the message several times before marking the report as failed. But errors weren’t always straightforward — for instance, if an external API call consistently failed due to bad input or returned an unexpected response shape, retries wouldn’t help. In those cases, the report could get stuck in an intermediate state, and we’d often have to manually dig through logs across different queues to figure out what went wrong.

Even more frustrating, when handling failed reports, we relied on a “Reaper” — a cron job that ran every hour to resubmit failed reports. Since a report could fail at any step, the Reaper had to deduce which queue failed and send a message to begin reprocessing. This meant:

  • Debugging was a nightmare: Tracing the journey of a single report meant jumping between logs for multiple queues.

  • Retries were unreliable: Some queues had retry logic, while others relied on the Reaper, leading to inconsistencies.

  • State management was painful: We had no clear way to track whether a report was halfway through the pipeline or completely lost, except by looking through the logs.

  • Operational overhead was high: Developers frequently had to manually inspect failed reports and resubmit them.

Queues gave us a solid foundation for moving messages around, but it wasn’t meant to handle orchestration. What we’d really done was build a bunch of loosely connected steps on top of a message bus and hoped it would all hold together. It worked, for the most part, but it was clunky, hard to reason about, and easy to break. Just understanding how a single report moved through the system meant tracing messages across multiple queues and digging through logs.

We knew we needed something better: a way to define workflows explicitly, with clear visibility into where things were and what had failed. But back then, we didn’t have a good way to do that without bringing in heavyweight tools or writing a bunch of glue code ourselves. When Cloudflare Workflows came along, it felt like the missing piece, finally giving us a simple, reliable way to orchestrate everything without duct tape.

The solution: Cloudflare Workflows

Once Cloudflare Workflows was announced, we saw an immediate opportunity to replace our queue-based architecture with a more structured, observable, and retryable system. Instead of relying on a web of multiple queues passing messages to each other, we now have a single workflow that orchestrates the entire process from start to finish. Critically, if any step failed, the Workflow could pick back up from where it left off, without having to repeat earlier processing steps, re-parsing files, or duplicating uploads.

With Cloudflare Workflows, each report follows a clear sequence of steps:

  1. Creating the report: The system validates the incoming report and initiates it with NCMEC.

  2. Checking for impounded files: If there are impounded files associated with the report, the workflow proceeds to file collection.

  3. Gathering files: The system retrieves impounded files stored in R2 and prepares them for upload.

  4. Uploading files to NCMEC: Each file is uploaded to NCMEC using their API, ensuring all relevant evidence is submitted.

  5. Adding file metadata: Metadata about the uploaded files (hashes, timestamps, etc.) is attached to the report.

  6. Finalizing the report: Once all files are processed, the report is finalized and marked as complete.

Here’s a simplified version of the orchestrator:

import { WorkflowEntrypoint, WorkflowEvent, WorkflowStep } from 'cloudflare:workers';


export class ReportWorkflow extends WorkflowEntrypoint<Env, ReportType> {
  async run(event: WorkflowEvent<ReportType>, step: WorkflowStep) {
    const reportToCreate: ReportType = event.payload;
    let reportId: number | undefined;


    try {
      await step.do('Create Report', async () => {
        const createdReport = await createReportStep(reportToCreate, this.env);
        reportId = createdReport?.id;
      });


      if (reportToCreate.hasImpoundedFiles) {
        await step.do('Gather Files', async () => {
          if (!reportId) throw new Error('Report ID is undefined.');
          await gatherFilesStep(reportId, this.env);
        });


        await step.do('Upload Files', async () => {
          if (!reportId) throw new Error('Report ID is undefined.');
          await uploadFilesStep(reportId, this.env);
        });


        await step.do('Add File Metadata', async () => {
          if (!reportId) throw new Error('Report ID is undefined.');
          await addFilesInfoStep(reportId, this.env);
        });
      }


      await step.do('Finalize Report', async () => {
        if (!reportId) throw new Error('Report ID is undefined.');
        await finalizeReportStep(reportId, this.env);
      });
    } catch (error) {
      console.error(error);
      throw error;
    }
  }
}

Not only can tasks be broken into discrete steps, but the Workflows dashboard gives us real-time visibility into each report processed and the status of each step in the workflow!

This allows us to easily see active and completed workflows, identify which steps failed and where, and retry failed steps or terminate workflows. These features revolutionize how we troubleshoot issues, providing us with a tool to deep dive into any issues that arise and retry steps with a click of a button.

Below are two dashboard screenshots, one of our running workflows and the second of an inspection of the success and failures of each step in the workflow. Some workflows look slower or “stuck” — that’s because failed steps are retried with exponential backoff. This helps smooth over transient issues like flaky APIs without manual intervention.


Cloudflare Workflows Dashboard for our NCMEC Workflow


Cloudflare Workflows Dashboard containing a breakout of the NCMEC Workflow Steps

Cloudflare Workflows transformed how we handle NCMEC incident reports. What was once a complex, queue-based architecture is now a structured, retryable, and observable process. Debugging is easier, error handling is more robust, and monitoring is seamless. 

Deploy your own Workflows

If you’re also building larger, multi-step applications, or have an existing Workers application that has started to approach what we ended up with for our incident reporting process, then you can typically wrap that code within a Workflow with minimal changes. Workflows can read from R2, write to KV, query D1 and call other APIs just like any other Worker, but are designed to help orchestrate asynchronous, long-running tasks.

To get started with Workflows, you can head to the Workflows developer documentation and/or pull down the starter project and dive into the code immediately:

$ npm create cloudflare@latest workflows-starter -- 
--template="cloudflare/workflows-starter"

Learn more about Cloudflare Workflows, and about using the Cloudflare CSAM Scanning Tool.

Accelerate Serverless Streamlit App Deployment with Terraform

Post Syndicated from Kevon Mayers original https://aws.amazon.com/blogs/devops/accelerate-serverless-streamlit-app-deployment-with-terraform/

Image depicting the HashiCorp Terraform and Amazon Web Services (AWS) logos. Underneath the AWS logo are AWS service logos for Amazon Elastic Container Service (ECS), AWS CodePipeline, AWS CodeBuild, and Amazon CloudFront

Graphic created by Kevon Mayers.

Introduction

As customers increasingly seek to harness the power of generative AI (GenAI) and machine learning to deliver cutting-edge applications, the need for a flexible, intuitive, and scalable development platform has never been greater. In this landscape, Streamlit has emerged as a standout tool, making it easy for developers to prototype, build, and deploy GenAI-powered apps with minimal friction. It is an open-source Python framework designed to simplify the development of custom web applications for data science, machine learning, and GenAI projects. With Streamlit, developers can quickly transform Python scripts into interactive dashboards, LLM-powered chatbots, and web apps, using just a few lines of code. Its unique combination of simplicity, interactivity, and speed is the perfect complement to the rapid advancements in AI.

When deploying Streamlit applications, customers often face the challenge of ensuring their applications are highly available and can scale to meet a variable amount of demand. To achieve these goals, customers are looking at serverless approaches to deploying their Streamlit apps. With a serverless application, you only pay for the resources required and do not want have to worry about managing servers or capacity planning.

In this post, we will walk you through deploying containerized, serverless Streamlit applications automatically via HashiCorp Terraform, an Infrastructure as Code (IaC) tool that enables users to define and provision infrastructure across cloud platforms.

Solution Overview

For this solution, we have the Streamlit app running on an Amazon Elastic Container Service (ECS) cluster across multiple availability zones (AZs), using AWS Fargate to manage the compute. Fargate is a serverless, pay-as-you-go compute engine that lets you focus on building apps without managing servers. Using Fargate helps reduce the undifferentiated heavy lifting that can come with building and maintaining web applications. It is also often desirable to use a Content Delivery Network (CDN) to ensure low latency for users globally by caching the content at edge locations closer to where the users are geographically located.

Let’s zoom in on the two architectures – the Streamlit App hosting architecture, and the Streamlit App deployment pipeline.

Streamlit app hosting

Image depicting the AWS data flow architecture for the solution. The architecture shows an Amazon Elastic Container Service (ECS) cluster that spans across two availability zones. Within each availability zone are a public and private subnet. A NAT gateway is within the public subnet, and an ECS Cluster with AWS Fargate deployment type is in the private subnet. An Internet Gateway (IGW) is used to allow traffic to flow through the NAT Gateway out to the internet.An Application Load Balancer (ALB) is used to distribute the load to the ECS cluster. Amazon CloudFront is used as the content delivery network (CDN).

In the above architecture, the following flow applies:

  1. Users access the Streamlit App using the public DNS endpoint for an Amazon CloudFront distribution.
  2. Using an Internet Gateway (IGW), user requests are routed to a public-facing Application Load Balancer (ALB).
  3. This ALB has target groups which map to ECS task nodes that are part of an ECS cluster running in two AZs (us-east-1a and us-east-1b in this example).
  4. Fargate will automatically scale the underlying compute nodes in the ECS cluster based on the demand.

Streamlit app deployment pipeline

Image depicting the Streamlit app deployment pipeline architecture. Within it, a developer uploads a .zip file called streamlit-app-assets.zip to an Amazon S3 Bucket. This upload event is processed by Amazon EventBridge, which in turn invokes an AWS CodePipeline to run. Related artifacts are stored in a connected CodePipeline S3 bucket. CodePipeline orchestrates an AWS CodeBuild project that creates a new Docker image using the .zip file that was uploaded, and stores in an Amazon Elastic Container Registry (ECR) repository. This image upload triggers a new Amazon Elastic Container Service (ECS) deployment. Terraform then creates a Amazon CloudFront invalidation to serve the new version of the application to customers.

In the above architecture, the following flow applies:

  1. User develops a local Streamlit App and defines the path of these assets in the module configuration, then runs terraform apply to generate a local .zip file comprised of the Streamlit App directory, and upload this to an Amazon S3 bucket (Streamlit Assets) with versioning enabled, which is configured to trigger the Streamlit CI/CD pipeline to run.
  2. AWS CodePipeline (Streamlit CI/CD pipeline) begins running. The pipeline copies the .zip file from the Streamlit Assets S3 Bucket, stores the contents in a connected CodePipeline Artifacts S3 bucket, and passes the asset to the AWS CodeBuild project that is also part of the pipeline.
  3. CodeBuild (Streamlit CodeBuild Project) configures a compute/build environment and fetches a Python Docker Image from a public Amazon ECR repository. CodeBuild uses Docker to build a new Streamlit App image based on what is defined in the Dockerfile within the .zip file, and pushes the new image to a private ECR repository. It tags the image with latest, an app_version (user-defined in Terraform), as well as the S3 Version ID of the .zip file and pushes the image to ECR.
  4. ECS has a task definition that references the image in ECR based on the S3 Version ID tag which will always be a unique value, as it is generated whenever a new version of the file is created. This also serves as data lineage so versions of the Streamlit App .zip files in S3 can be linked to versions of the image stored in ECR. Once a new image is pushed to ECR (with a unique image tag), the task definition is updated and the ECS service begins a new deployment using the new version of the Streamlit App.
  5. When a new image is pushed to ECR, the Terraform Module is configured to use the local-exec provisioner to run an AWS CLI command that creates a CloudFront invalidation. This enables users of the Streamlit app to use the new version without waiting for the time-to-live (TTL) of the cached file to expire on the edge locations (default is 24 hours).
    Both of these pipelines are built and packaged into a Terraform module that can be reused efficiently with only a few lines of code.

Both of these pipelines are built and packaged into a Terraform module that can be reused efficiently with only a few lines of code.

Prerequisites

This solution requires the following prerequisites:

  • An AWS account. If you don’t have an account, you can sign up for one.
  • Terraform v1.0.0 or newer installed.
  • python v3.8 or newer installed.
  • A Streamlit app. If you don’t have a Streamlit project already, you can download this app directory as a sample Streamlit app for this post and save it to a local folder.

Your folder structure will look something like this:

terraform_streamlit_folder
├── README.md
└── app                 # Streamlit app directory
    ├── home.py         # Streamlit app entry point
    ├── Dockerfile      # Dockerfile
     └── pages/          # Streamlit pages

Create and initialize a Terraform project

In the same folder where you have the your Streamlit app saved, in the above example in the terraform_streamlit_folder, you will create and initialize a new Terraform project.

  1.  In your preferred terminal, create a new file named main.tf by running the following command on Unix/Linux machines, or an equivalent command on Windows machines:
    touch main.tf
  2. Open up the main.tf file and add the following code to it:
    module "serverless-streamlit-app" {
      source          = "aws-ia/serverless-streamlit-app/aws"
      app_name        = "streamlit-app"
      app_version     = "v1.1.0" 
      path_to_app_dir = "./app" # Replace with path to your app
    }

    This code utilizes a module block with a source pointing to the Terraform module, and the appropriate input variables passed in. When Terraform encounters a module block, it loads and processes that module’s configuration files using the source. The Serverless Streamlit App Terraform module has many optional input variables. If you have existing resources, such as an existing VPC, subnets, and security groups that you’d like to reuse instead of deploying new ones, you can use the module’s input variables to reference your existing resources. However, in this post, we’re deploying all of the resources in the above architecture from scratch. Here, we simply define the source that references the module hosted in the Terraform Registry, provide an app_name that will be used as a prefix for naming your resources, the app_version that is used for tracking changes to your app, and the path_to_app_dir which is the path to the local directory where the assets for your Streamlit app are stored.

  3. Save the file.
  4. To initialize the Terraform working directory, run the following command in your terminal:
    terraform init

    The output will contain a successful message like the following:

    "Terraform has been successfully initialized"

Output the CloudFront URL

To be able to easily access the Cloudfront URL of the deployed Streamlit application, you can add the URL as a Terraform output.

  1. In your terminal, create a new file named outputs.tf by running the following command on Unix/Linux machines, or an equivalent command on Windows machines:
    touch outputs.tf
  2. Open up the outputs.tf file and add the following code to it:
    output "streamlit_cloudfront_distribution_url" {
      value = module.serverless-streamlit-app.streamlit_cloudfront_distribution_url
    }
  3. Save the file.
    Now, your folder structure will look like:

    terraform_streamlit_folder
    ├── README.md
    ├── app                 # Streamlit app directory
    │   ├── home.py         # Streamlit app entry point
    │   ├── Dockerfile      # Dockerfile
    │   └── pages/          # Streamlit pages
    │     
    ├── main.tf             # Terraform Code (where you call the module) 
    └── outputs.tf          # Outputs definition

Deploy the solution

Now you can use Terraform to deploy the resources defined in your main.tf file.

  1. In your terminal, run the following command to apply to deploy the infrastructure. This includes the hosting for your Streamlit application using ECS and CloudFront, as well as the pipeline that is used to push updates.
    terraform apply

    When the apply command finishes running, you’ll see the Terraform outputs displayed in the terminal.

  2. Navigate to the streamlit_cloudfront_distribution_url to see your Streamlit application that is hosted on AWS.
  3. When you make changes to your Streamlit codebase, you can go ahead and re-run terraform apply to push your new changes to your cloud environment.

When updating the Streamlit codebase, the CodePipeline and CodeBuild processes kick off to automatically update your new changes, which get reflected on your Streamlit application. CodePipeline automates the entire software release process, managing stages like source retrieval, building, testing, and deployment. It integrates with AWS services and third-party tools (such as GitHub and Jenkins) to enhance automation, speed, and security. CodeBuild focuses on automating code compilation, testing, and packaging, supporting multiple languages and custom Docker environments, while integrating with CodePipeline for scalable, secure builds. With this CI/CD pipeline, when you make changes to your code, all you need to run is terraform apply to update your cloud environment. For an example buildspec, see the example in the repo.

You can find full examples of deploying the infrastructure with and without existing resources in the GitHub repository.

Clean up

When you no longer need the resources deployed in this post, you can clean up the resources by using the Terraform destroy command. Simply run terraform destroy . This will remove all of the resources you have deployed in this post with Terraform.

Conclusion

Building serverless Streamlit applications with Terraform on AWS offers a powerful combination of scalability, efficiency, and automation. As you continue to build and refine your Streamlit applications, Terraform’s flexibility ensures that your infrastructure can evolve seamlessly, supporting rapid innovation and agile development. With Streamlit and Terraform, you have the tools to create dynamic, serverless applications that scale effortlessly and operate reliably in the cloud.

Authors

Image depicting Kevon Mayers, a Solutions Architect at AWS

Kevon Mayers

Kevon Mayers is a Solutions Architect at AWS. Kevon is a Terraform Contributor and has led multiple Terraform initiatives within AWS. Prior to joining AWS he was working as a DevOps Engineer and Developer, and before that was working with the GRAMMYs/The Recording Academy as a Studio Manager, Music Producer, and Audio Engineer. He also owns a professional production company, MM Productions.

Image depicting Alexa Perlov, a Prototyping Architect at AWS

Alexa Perlov

Alexa Perlov is a Prototyping Architect with the Prototyping Acceleration team at AWS. She helps customers build with emerging technologies by open sourcing repeatable projects. She is currently based out of Pittsburgh, PA.

Image depicting Shravani Malipeddi, a Solutions Architect at AWS

Shravani Malipeddi

Shravani Malipeddi is a Solutions Architect at AWS who came out of the TechU Program. She currently supports strategic accounts and is based out of San Francisco, CA. .

New whitepaper available: Building security from the ground up with Secure by Design

Post Syndicated from Bertram Dorn original https://aws.amazon.com/blogs/security/new-whitepaper-available-building-security-from-the-ground-up-with-secure-by-design/

Developing secure products and services is imperative for organizations that are looking to strengthen operational resilience and build customer trust. However, system design often prioritizes performance, functionality, and user experience over security. This approach can lead to vulnerabilities across the supply chain.

As security threats continue to evolve, the concept of Secure by Design (SbD) is gaining importance in the effort to mitigate vulnerabilities early, minimize risks, and recognize security as a core business requirement. We’re excited to share a whitepaper we recently authored with SANS Institute called Building Security from the Ground up with Secure by Design, which addresses SbD strategy and explores the effects of SbD implementations.

The whitepaper contains context and analysis that can help you take a proactive approach to product development that facilitates foundational security. Key considerations include the following:

  • Integrating SbD into the software development lifecycle (SDLC)
  • Supporting SbD with automation
  • Reinforcing defense-in-depth
  • Applying SbD to artificial intelligence (AI)
  • Identifying threats in the design phase with threat modeling
  • Using SbD to simplify compliance with requirements and standards
  • Planning for the short and long term
  • Establishing a culture of security

While the journey to a Secure by Design approach is an iterative process that is different for every organization, the whitepaper details five key action items that can help set you on the right path. We encourage you to download the whitepaper and gain insight into how you can build secure products with a multi-layered strategy that meaningfully improves your technical and business outcomes. We look forward to your feedback and to continuing the journey together.

Download Building Security from the Ground up with Secure by Design.

 
If you have feedback about this post, submit comments in the Comments section below.

Bertram Dorn
Bertram Dorn

Bertram is a Principal within the Office of the CISO at AWS, based in Munich, Germany. He helps internal and external AWS customers and partners navigate AWS security-related topics. He has over 30 years of experience in the technology industry, with a focus on security, networking, storage, and database technologies. When not helping customers, Bertram spends time working on his solo piano and multimedia performances.
Paul Vixie
Paul Vixie

Paul is a VP and Distinguished Engineer who joined AWS Security after a 29-year career as the founder and CEO of five startup companies covering the fields of DNS, anti-spam, internet exchange, internet carriage and hosting, and internet security. He earned his PhD in Computer Science from Keio University in 2011, and was inducted into the Internet Hall of Fame in 2014. Paul is also known as an author of open source software, including Cron. As a VP, Distinguished Engineer, and Deputy CISO at AWS, Paul and his team in the Office of the CISO use leadership and technical expertise to provide guidance and collaboration on the development and implementation of advanced security strategies and risk management.

Implementing a compliance and reporting strategy for NIST SP 800-53 Rev. 5

Post Syndicated from Josh Moss original https://aws.amazon.com/blogs/security/implementing-a-compliance-and-reporting-strategy-for-nist-sp-800-53-rev-5/

Amazon Web Services (AWS) provides tools that simplify automation and monitoring for compliance with security standards, such as the NIST SP 800-53 Rev. 5 Operational Best Practices. Organizations can set preventative and proactive controls to help ensure that noncompliant resources aren’t deployed. Detective and responsive controls notify stakeholders of misconfigurations immediately and automate fixes, thus minimizing the time to resolution (TTR).

By layering the solutions outlined in this blog post, you can increase the probability that your deployments stay continuously compliant with the National Institute of Standards and Technology (NIST) SP 800-53 security standard, and you can simplify reporting on that compliance. In this post, we walk you through the following tools to get started on your continuous compliance journey:

Detective

Preventative

Proactive

Responsive

Reporting

Note on implementation

This post covers quite a few solutions, and these solutions operate in different parts of the security pillar of the AWS Well-Architected Framework. It might take some iterations to get your desired results, but we encourage you to start small, find your focus areas, and implement layered iterative changes to address them.

For example, if your organization has experienced events involving public Amazon Simple Storage Service (Amazon S3) buckets that can lead to data exposure, focus your efforts across the different control types to address that issue first. Then move on to other areas. Those steps might look similar to the following:

  1. Use Security Hub and Prowler to find your public buckets and monitor patterns over a predetermined time period to discover trends and perhaps an organizational root cause.
  2. Apply IAM policies and SCPs to specific organizational units (OUs) and principals to help prevent the creation of public buckets and the changing of AWS account-level controls.
  3. Set up Automated Security Response (ASR) on AWS and then test and implement the automatic remediation feature for only S3 findings.
  4. Remove direct human access to production accounts and OUs. Require infrastructure as code (IaC) to pass through a pipeline where CloudFormation Guard scans IaC for misconfigurations before deployment into production environments.

Detective controls

Implement your detective controls first. Use them to identify misconfigurations and your priority areas to address. Detective controls are security controls that are designed to detect, log, and alert after an event has occurred. Detective controls are a foundational part of governance frameworks. These guardrails are a second line of defense, notifying you of security issues that bypassed the preventative controls.

Security Hub NIST SP 800-53 security standard

Security Hub consumes, aggregates, and analyzes security findings from various supported AWS and third-party products. It functions as a dashboard for security and compliance in your AWS environment. Security Hub also generates its own findings by running automated and continuous security checks against rules. The rules are represented by security controls. The controls might, in turn, be enabled in one or more security standards. The controls help you determine whether the requirements in a standard are being met. Security Hub provides controls that support specific NIST SP 800-53 requirements. Unlike other frameworks, NIST SP 800-53 isn’t prescriptive about how its requirements should be evaluated. Instead, the framework provides guidelines, and the Security Hub NIST SP 800-53 controls represent the service’s understanding of them.

Using this step-by-step guide, enable Security Hub for your organization in AWS Organizations. Configure the NIST SP 800-53 security standard for all accounts, in all AWS Regions that are required to be monitored for compliance, in your organization by using the new centralized configuration feature; or if your organization uses AWS GovCloud (US), by using this multi-account script. Use the findings from the NIST SP 800-53 security standard in your delegated administrator account to monitor NIST SP 800-53 compliance across your entire organization, or a list of specific accounts.

Figure 1 shows the Security Standard console page, where users of the Security Hub Security Standard feature can see an overview of their security score against a selected security standard.

Figure 1: Security Hub security standard console

Figure 1: Security Hub security standard console

On this console page, you can select each control that is checked by a Security Hub Security Standard, such as the NIST 800-53 Rev. 5 standard, to find detailed information about the check and which NIST controls it maps to, as shown in Figure 2.

Figure 2: Security standard check detail

Figure 2: Security standard check detail

After you enable Security Hub with the NIST SP 800-53 security standard, you can link responsive controls such as the Automated Security Response (ASR), which is covered later in this blog post, to Amazon EventBridge rules to listen for Security Hub findings as they come in.

Prowler

Prowler is an open source security tool that you can use to perform assessments against AWS Cloud security recommendations, along with audits, incident response, continuous monitoring, hardening, and forensics readiness. The tool is a Python script that you can run anywhere that an up-to-date Python installation is located—this could be a workstation, an Amazon Elastic Compute Cloud (Amazon EC2) instance, AWS Fargate or another container, AWS CodeBuild, AWS CloudShell, AWS Cloud9, or another compute option.

Figure 3 shows Prowler being used to perform a scan.

Figure 3: Prowler CLI in action

Figure 3: Prowler CLI in action

Prowler works well as a complement to the Security Hub NIST SP 800-53 Rev. 5 security standard. The tool has a native Security Hub integration and can send its findings to your Security Hub findings dashboard. You can also use Prowler as a standalone compliance scanning tool in partitions where Security Hub or the security standards aren’t yet available.

At the time of writing, Prowler has over 300 checks across 64 AWS services.

In addition to integrations with Security Hub and computer-based outputs, Prowler can produce fully interactive HTML reports that you can use to sort, filter, and dive deeper into findings. You can then share these compliance status reports with compliance personnel. Some organizations run automatically recurring Prowler reports and use Amazon Simple Notification Service (Amazon SNS) to email the results directly to their compliance personnel.

Get started with Prowler by reviewing the Prowler Open Source documentation that contains tutorials for specific providers and commands that you can copy and paste.

Preventative controls

Preventative controls are security controls that are designed to prevent an event from occurring in the first place. These guardrails are a first line of defense to help prevent unauthorized access or unwanted changes to your network. Service control policies (SCPs) and IAM controls are the best way to help prevent principals in your AWS environment (whether they are human or nonhuman) from creating noncompliant or misconfigured resources.

IAM

In the ideal environment, principals (both human and nonhuman) have the least amount of privilege that they need to reach operational objectives. Ideally, humans would at the most only have read-only access to production environments. AWS resources would be created through IaC that runs through a DevSecOps pipeline where policy-as-code checks review resources for compliance against your policies before deployment. DevSecOps pipeline roles should have IAM policies that prevent the deployment of resources that don’t conform to your organization’s compliance strategy. Use IAM conditions wherever possible to help ensure that only requests that match specific, predefined parameters are allowed.

The following policy is a simple example of a Deny policy that uses Amazon Relational Database Service (Amazon RDS) condition keys to help prevent the creation of unencrypted RDS instances and clusters. Most AWS services support condition keys that allow for evaluating the presence of specific service settings. Use these condition keys to help ensure that key security features, such as encryption, are set during a resource creation call.

{
  "Version": "2012-10-17",
  "Statement": [
    {
      "Sid": "DenyUnencryptedRDSResourceCreation",
      "Effect": "Deny",
      "Action": [
      "rds:CreateDBInstance",
      "rds:CreateDBCluster"
      ]
      "Resource": "*",
      "Condition": {
        "BoolIfExists": {
          rds:StorageEncrypted": "false"
        }
      }
    }
  ]
}

Service control policies

You can use an SCP to specify the maximum permissions for member accounts in your organization. You can restrict which AWS services, resources, and individual API actions the users and roles in each member account can access. You can also define conditions for when to restrict access to AWS services, resources, and API actions. If you haven’t used SCPs before and want to learn more, see How to use service control policies to set permission guardrails across accounts in your AWS Organization.

Use SCPs to help prevent common misconfigurations mapped to NIST SP 800-53 controls, such as the following:

  • Prevent governed accounts from leaving the organization or turning off security monitoring services.
  • Build protections and contextual access controls around privileged principals.
  • Mitigate the risk of data mishandling by enforcing data perimeters and requiring encryption on data at rest.

Although SCPs aren’t the optimal choice for preventing every misconfiguration, they can help prevent many of them. As a feature of AWS Organizations, SCPs provide inheritable controls to member accounts of the OUs that they are applied to. For deployments in Regions where AWS Organizations isn’t available, you can use IAM policies and permissions boundaries to achieve preventative functionality that is similar to what SCPs provide.

The following is an example of policy mapping statements to NIST controls or control families. Note the placeholder values, which you will need to replace with your own information before use. Note that the SIDs map to Security Hub NIST 800-53 Security Standard control numbers or NIST control families.

{
  "Version": "2012-10-17",
  "Statement": [
    {
      "Sid": "Account1",
      "Action": [
        "organizations:LeaveOrganization"
      ],
      "Effect": "Deny",
      "Resource": "*"
    },
    {
      "Sid": "NISTAccessControlFederation",
      "Effect": "Deny",
      "Action": [
        "iam:CreateOpenIDConnectProvider",
        "iam:CreateSAMLProvider",
        "iam:DeleteOpenIDConnectProvider",
        "iam:DeleteSAMLProvider",
        "iam:UpdateOpenIDConnectProviderThumbprint",
        "iam:UpdateSAMLProvider"
      ],
      "Resource": "*",
      "Condition": {
        "ArnNotLike": {
          "aws:PrincipalARN": "arn:aws:iam::${Account}:role/[PRIVILEGED_ROLE]"
        }
      }
    },
    {
      "Sid": "CloudTrail1",
      "Effect": "Deny",
      "Action": [
        "cloudtrail:DeleteTrail",
        "cloudtrail:PutEventSelectors",
        "cloudtrail:StopLogging",
        "cloudtrail:UpdateTrail",
        "cloudtrail:CreateTrail"
      ],
      "Resource": "arn:aws:cloudtrail:${Region}:${Account}:trail/[CLOUDTRAIL_NAME]",
      "Condition": {
        "ArnNotLike": {
          "aws:PrincipalARN": "arn:aws:iam::${Account}:role/[PRIVILEGED_ROLE]"
        }
      }
    },
    {
      "Sid": "Config1",
      "Effect": "Deny",
      "Action": [
        "config:DeleteConfigurationAggregator",
        "config:DeleteConfigurationRecorder",
        "config:DeleteDeliveryChannel",
        "config:DeleteConfigRule",
        "config:DeleteOrganizationConfigRule",
        "config:DeleteRetentionConfiguration",
        "config:StopConfigurationRecorder",
        "config:DeleteAggregationAuthorization",
        "config:DeleteEvaluationResults"
      ],
      "Resource": "*",
      "Condition": {
        "ArnNotLike": {
          "aws:PrincipalARN": "arn:aws:iam::${Account}:role/[PRIVILEGED_ROLE]"
        }
      }
    },
    {
      "Sid": "CloudFormationSpecificStackProtectionNISTIncidentResponseandSystemIntegrityControls",
      "Effect": "Deny",
      "Action": [
        "cloudformation:CreateChangeSet",
        "cloudformation:CreateStack",
        "cloudformation:CreateStackInstances",
        "cloudformation:CreateStackSet",
        "cloudformation:DeleteChangeSet",
        "cloudformation:DeleteStack",
        "cloudformation:DeleteStackInstances",
        "cloudformation:DeleteStackSet",
        "cloudformation:DetectStackDrift",
        "cloudformation:DetectStackResourceDrift",
        "cloudformation:DetectStackSetDrift",
        "cloudformation:ExecuteChangeSet",
        "cloudformation:SetStackPolicy",
        "cloudformation:StopStackSetOperation",
        "cloudformation:UpdateStack",
        "cloudformation:UpdateStackInstances",
        "cloudformation:UpdateStackSet",
        "cloudformation:UpdateTerminationProtection"
      ],
      "Resource": [
        "arn:aws:cloudformation:*:*:stackset/[STACKSET_PREFIX]*",
        "arn:aws:cloudformation:*:*:stack/[STACK_PREFIX]*",
        "arn:aws:cloudformation:*:*:stack/[STACK_NAME]"
      ],
      "Condition": {
        "ArnNotLike": {
          "aws:PrincipalARN": "arn:aws:iam::${Account}:role/[PRIVILEGED_ROLE]"
        }
      }
    },
    {
      "Sid": "EC23",
      "Effect": "Deny",
      "Action": [
        "ec2:DisableEbsEncryptionByDefault"
      ],
      "Resource": "*",
      "Condition": {
        "ArnNotLike": {
          "aws:PrincipalARN": "arn:aws:iam::${Account}:role/[PRIVILEGED_ROLE]"
        }
      }
    },
    {
      "Sid": "GuardDuty1",
      "Effect": "Deny",
      "Action": [
        "guardduty:DeclineInvitations",
        "guardduty:DeleteDetector",
        "guardduty:DeleteFilter",
        "guardduty:DeleteInvitations",
        "guardduty:DeleteIPSet",
        "guardduty:DeleteMembers",
        "guardduty:DeletePublishingDestination",
        "guardduty:DeleteThreatIntelSet",
        "guardduty:DisassociateFromMasterAccount",
        "guardduty:DisassociateMembers",
        "guardduty:StopMonitoringMembers"
      ],
      "Resource": "*"
    },
    {
      "Sid": "IAM4",
      "Effect": "Deny",
      "Action": "iam:CreateAccessKey",
      "Resource": [
        "arn::iam::*:root",
        "arn::iam::*:Administrator"
      ]
    },
    {
      "Sid": "KMS3",
      "Effect": "Deny",
      "Action": [
        "kms:ScheduleKeyDeletion",
        "kms:DeleteAlias",
        "kms:DeleteCustomKeyStore",
        "kms:DeleteImportedKeyMaterial"
      ],
      "Resource": "*",
      "Condition": {
        "ArnNotLike": {
          "aws:PrincipalArn": "arn:aws:iam::${Account}:role/[PRIVILEGED_ROLE]"
        }
      }
    },
    {
      "Sid": "Lambda1",
      "Effect": "Deny",
      "Action": [
        "lambda:AddPermission"
      ],
      "Resource": [
        "*"
      ],
      "Condition": {
        "StringEquals": {
          "lambda:Principal": [
            "*"
          ]
        }
      }
    },
    {
      "Sid": "ProtectSecurityLambdaFunctionsNISTIncidentResponseControls",
      "Effect": "Deny",
      "Action": [
        "lambda:AddPermission",
        "lambda:CreateEventSourceMapping",
        "lambda:CreateFunction",
        "lambda:DeleteEventSourceMapping",
        "lambda:DeleteFunction",
        "lambda:DeleteFunctionConcurrency",
        "lambda:PutFunctionConcurrency",
        "lambda:RemovePermission",
        "lambda:UpdateEventSourceMapping",
        "lambda:UpdateFunctionCode",
        "lambda:UpdateFunctionConfiguration"
      ],
      "Resource": "arn:aws:lambda:*:*:function:[INFRASTRUCTURE_AUTOMATION_PREFIX]",
      "Condition": {
        "ArnNotLike": {
          "aws:PrincipalArn": "arn:aws:iam::${Account}:role/[PRIVILEGED_ROLE]"
        }
      }
    },
    {
      "Sid": "SecurityHub",
      "Effect": "Deny",
      "Action": [
        "securityhub:DeleteInvitations",
        "securityhub:BatchDisableStandards",
        "securityhub:DeleteActionTarget",
        "securityhub:DeleteInsight",
        "securityhub:UntagResource",
        "securityhub:DisableSecurityHub",
        "securityhub:DisassociateFromMasterAccount",
        "securityhub:DeleteMembers",
        "securityhub:DisassociateMembers",
        "securityhub:DisableImportFindingsForProduct"
      ],
      "Resource": "*",
      "Condition": {
        "ArnNotLike": {
          "aws:PrincipalARN": "arn:aws:iam::${Account}:role/[PRIVILEGED_ROLE]"
        }
      }
    },
    {
      "Sid": "ProtectAlertingSNSNISTIncidentResponseControls",
      "Effect": "Deny",
      "Action": [
        "sns:AddPermission",
        "sns:CreateTopic",
        "sns:DeleteTopic",
        "sns:RemovePermission",
        "sns:SetTopicAttributes"
      ],
      "Resource": "arn:aws:sns:*:*:[SNS_TOPIC_TO_PROTECT]",
      "Condition": {
        "ArnNotLike": {
          "aws:PrincipalArn": "arn:aws:iam::${Account}:role/[PRIVILEGED_ROLE]"
        }
      }
    },
    {
      "Sid": "S3 2 3 6",
      "Effect": "Deny",
      "Action": [
        "s3:PutAccountPublicAccessBlock"
      ],
      "Resource": "*",
      "Condition": {
        "ArnNotLike": {
          "aws:PrincipalARN": "arn:aws:iam::${Account}:role/[PRIVILEGED_ROLE]"
        }
      }
    },
    {
      "Sid": "ProtectS3bucketsanddatafromdeletionNISTSystemIntegrityControls",
      "Effect": "Deny",
      "Action": [
        "s3:DeleteBucket",
        "s3:DeleteBucketPolicy",
        "s3:DeleteObject",
        "s3:DeleteObjectVersion",
        "s3:DeleteObjectTagging",
        "s3:DeleteObjectVersionTagging"
      ],
      "Resource": [
        "arn:aws:s3:::BUCKET_TO_PROTECT",
        "arn:aws:s3:::BUCKET_TO_PROTECT/path/to/key*",
        "arn:aws:s3:::Another_BUCKET_TO_PROTECT",
        "arn:aws:s3:::CriticalBucketPrefix-*"
      ]
    }
  ]
}

For a collection of SCP examples that are ready for your testing, modification, and adoption, see the service-control-policy-examples GitHub repository, which includes examples of Region and service restrictions.

For a deeper dive on SCP best practices, see Achieving operational excellence with design considerations for AWS Organizations SCPs.

You should thoroughly test SCPs against development OUs and accounts before you deploy them against production OUs and accounts.

Proactive controls

Proactive controls are security controls that are designed to prevent the creation of noncompliant resources. These controls can reduce the number of security events that responsive and detective controls handle. These controls help ensure that deployed resources are compliant before they are deployed; therefore, there is no detection event that requires response or remediation.

CloudFormation Guard

CloudFormation Guard (cfn-guard) is an open source, general-purpose, policy-as-code evaluation tool. Use cfn-guard to scan Information as Code (IaC) against a collection of policies, defined as JSON, before deployment of resources into an environment.

Cfn-guard can scan CloudFormation templates, Terraform plans, Kubernetes configurations, and AWS Cloud Development Kit (AWS CDK) output. Cfn-guard is fully extensible, so your teams can choose the rules that they want to enforce, and even write their own declarative rules in a YAML-based format. Ideally, the resources deployed into a production environment on AWS flow through a DevSecOps pipeline. Use cfn_guard in your pipeline to define what is and is not acceptable for deployment, and help prevent misconfigured resources from deploying. Developers can also use cfn_guard on their local command line, or as a pre-commit hook to move the feedback timeline even further “left” in the development cycle.

Use policy as code to help prevent the deployment of noncompliant resources. When you implement policy as code in the DevOps cycle, you can help shorten the development and feedback cycle and reduce the burden on security teams. The CloudFormation team maintains a GitHub repo of cfn-guard rules and mappings, ready for rapid testing and adoption by your teams.

Figure 4 shows how you can use Guard with the NIST 800-53 cfn_guard Rule Mapping to scan infrastructure as code against NIST 800-53 mapped rules.

Figure 4: CloudFormation Guard scan results

Figure 4: CloudFormation Guard scan results

You should implement policy as code as pre-commit checks so that developers get prompt feedback, and in DevSecOps pipelines to help prevent deployment of noncompliant resources. These checks typically run as Bash scripts in a continuous integration and continuous delivery (CI/CD) pipeline such as AWS CodeBuild or GitLab CI. To learn more, see Integrating AWS CloudFormation Guard into CI/CD pipelines.

To get started, see the CloudFormation Guard User Guide. You can also view the GitHub repos for CloudFormation Guard and the AWS Guard Rules Registry.

Many other third-party policy-as-code tools are available and include NIST SP 800-53 compliance policies. If cfn-guard doesn’t meet your needs, or if you are looking for a more native integration with the AWS CDK, for example, see the NIST-800-53 rev 5 rules pack in cdk-nag.

Responsive controls

Responsive controls are designed to drive remediation of adverse events or deviations from your security baseline. Examples of technical responsive controls include setting more stringent security group rules after a security group is created, setting a public access block on a bucket automatically if it’s removed, patching a system, quarantining a resource exhibiting anomalous behavior, shutting down a process, or rebooting a system.

Automated Security Response on AWS

The Automated Security Response on AWS (ASR) is an add-on that works with Security Hub and provides predefined response and remediation actions based on industry compliance standards and current recommendations for security threats. This AWS solution creates playbooks so you can choose what you want to deploy in your Security Hub administrator account (which is typically your Security Tooling account, in our recommended multi-account architecture). Each playbook contains the necessary actions to start the remediation workflow within the account holding the affected resource. Using ASR, you can resolve common security findings and improve your security posture on AWS. Rather than having to review findings and search for noncompliant resources across many accounts, security teams can view and mitigate findings from the Security Hub console of the delegated administrator.

The architecture diagram in Figure 5 shows the different portions of the solution, deployed into both the Administrator account and member accounts.

Figure 5: ASR architecture diagram

Figure 5: ASR architecture diagram

The high-level process flow for the solution components deployed with the AWS CloudFormation template is as follows:

  1. DetectAWS Security Hub provides customers with a comprehensive view of their AWS security state. This service helps them to measure their environment against security industry standards and best practices. It works by collecting events and data from other AWS services, such as AWS Config, Amazon GuardDuty, and AWS Firewall Manager. These events and data are analyzed against security standards, such as the CIS AWS Foundations Benchmark. Exceptions are asserted as findings in the Security Hub console. New findings are sent as Amazon EventBridge events.
  2. Initiate – You can initiate events against findings by using custom actions, which result in Amazon EventBridge events. Security Hub Custom Actions and EventBridge rules initiate Automated Security Response on AWS playbooks to address findings. One EventBridge rule is deployed to match the custom action event, and one EventBridge event rule is deployed for each supported control (deactivated by default) to match the real-time finding event. Automated remediation can be initiated through the Security Hub Custom Action menu, or, after careful testing in a non-production environment, automated remediations can be activated. This can be activated per remediation—it isn’t necessary to activate automatic initiations on all remediations.
  3. Orchestrate – Using cross-account IAM roles, Step Functions in the admin account invokes the remediation in the member account that contains the resource that produced the security finding.
  4. Remediate – An AWS Systems Manager Automation Document in the member account performs the action required to remediate the finding on the target resource, such as disabling AWS Lambda public access.
  5. Log – The playbook logs the results to an Amazon CloudWatch Logs group, sends a notification to an Amazon SNS topic, and updates the Security Hub finding. An audit trail of actions taken is maintained in the finding notes. On the Security Hub dashboard, the finding workflow status is changed from NEW to either NOTIFIED or RESOLVED. The security finding notes are updated to reflect the remediation that was performed.

The NIST SP 800-53 Playbook contains 52 remediations to help security and compliance teams respond to misconfigured resources. Security teams have a choice between launching these remediations manually, or enabling the associated EventBridge rules to allow the automations to bring resources back into a compliant state until further action can be taken on them. When a resource doesn’t align with the Security Hub NIST SP 800-53 security standard automated checks and the finding appears in Security Hub, you can use ASR to move the resource back into a compliant state. Remediations are available for 17 of the common core services for most AWS workloads.

Figure 6 shows how you can remediate a finding with ASR by selecting the finding in Security Hub and sending it to the created custom action.

Figure 6: ASR Security Hub custom action

Figure 6: ASR Security Hub custom action

Findings generated from the Security Hub NIST SP 800-53 security standard are displayed in the Security Hub findings or security standard dashboards. Security teams can review the findings and choose which ones to send to ASR for remediation. The general architecture of ASR consists of EventBridge rules to listen for the Security Hub custom action, an AWS Step Functions workflow to control the process and implementation, and several AWS Systems Manager documents (SSM documents) and AWS Lambda functions to perform the remediation. This serverless, step-based approach is a non-brittle, low-maintenance way to keep persistent remediation resources in an account, and to pay for their use only as needed. Although you can choose to fork and customize ASR, it’s a fully developed AWS solution that receives regular bug fixes and feature updates.

To get started, see the ASR Implementation Guide, which will walk you through configuration and deployment.

You can also view the code on GitHub at the Automated Security Response on AWS GitHub repo.

Reporting

Several options are available to concisely gather results into digestible reports that compliance professionals can use as artifacts during the Risk Management Framework (RMF) process when seeking an Authorization to Operate (ATO). By automating reporting and delegating least-privilege access to compliance personnel, security teams may be able to reduce time spent reporting compliance status to auditors or oversight personnel.

Let your compliance folks in

Remove some of the burden of reporting from your security engineers, and give compliance teams read-only access to your Security Hub dashboard in your Security Tooling account. Enabling compliance teams with read-only access through AWS IAM Identity Center (or another sign-on solution) simplifies governance while still maintaining the principle of least privilege. By adding compliance personnel to the AWSSecurityAudit managed permission set in IAM Identity Center, or granting this policy to IAM principals, these users gain visibility into operational accounts without the ability to make configuration changes. Compliance teams can self-serve the security posture details and audit trails that they need for reporting purposes.

Meanwhile, administrative teams are freed from regularly gathering and preparing security reports, so they can focus on operating compliant workloads across their organization. The AWSSecurityAudit permission set grants read-only access to security services such as Security Hub, AWS Config, Amazon GuardDuty, and AWS IAM Access Analyzer. This provides compliance teams with wide observability into policies, configuration history, threat detection, and access patterns—without the privilege to impact resources or alter configurations. This ultimately helps to strengthen your overall security posture.

For more information about AWS managed policies, such as the AWSSecurityAudit managed policy, see the AWS managed policies.

To learn more about permission sets in IAM Identity Center, see Permission sets.

AWS Audit Manager

AWS Audit Manager helps you continually audit your AWS usage to simplify how you manage risk and compliance with regulations and industry standards. Audit Manager automates evidence collection so you can more easily assess whether your policies, procedures, and activities—also known as controls—are operating effectively. When it’s time for an audit, Audit Manager helps you manage stakeholder reviews of your controls. This means that you can build audit-ready reports with much less manual effort.

Audit Manager provides prebuilt frameworks that structure and automate assessments for a given compliance standard or regulation, including NIST 800-53 Rev. 5. Frameworks include a prebuilt collection of controls with descriptions and testing procedures. These controls are grouped according to the requirements of the specified compliance standard or regulation. You can also customize frameworks and controls to support internal audits according to your specific requirements.

For more information about using Audit Manager to generate automated compliance reports, see the AWS Audit Manager User Guide.

Security Hub Compliance Analyzer (SHCA)

Security Hub is the premier security information aggregating tool on AWS, offering automated security checks that align with NIST SP 800-53 Rev. 5. This alignment is particularly critical for organizations that use the Security Hub NIST SP 800-53 Rev. 5 framework. Each control within this framework is pivotal for documenting the compliance status of cloud environments, focusing on key aspects such as:

  • Related requirements – For example, NIST.800-53.r5 CM-2 and NIST.800-53.r5 CM-2(2)
  • Severity – Assessment of potential impact
  • Description – Detailed control explanation
  • Remediation – Strategies for addressing and mitigating issues

Such comprehensive information is crucial in the accreditation and continuous monitoring of cloud environments.

Enhance compliance and RMF submission with the Security Hub Compliance Analyzer

To further augment the utility of this data for customers seeking to compile artifacts and articulate compliance status, the AWS ProServe team has introduced the Security Hub Compliance Analyzer (SHCA).

SHCA is engineered to streamline the RMF process. It reduces manual effort, delivers extensive reports for informed decision making, and helps assure continuous adherence to NIST SP 800-53 standards. This is achieved through a four-step methodology:

  1. Active findings collection – Compiles ACTIVE findings from Security Hub that are assessed using NIST SP 800-53 Rev. 5 standards.
  2. Results transformation – Transforms these findings into formats that are both user-friendly and compatible with RMF tools, facilitating understanding and utilization by customers.
  3. Data analysis and compliance documentation – Performs an in-depth analysis of these findings to pinpoint compliance and security shortfalls. Produces comprehensive compliance reports, summaries, and narratives that accurately represent the status of compliance for each NIST SP 800-53 Rev. 5 control.
  4. Findings archival – Assembles and archives the current findings for downloading and review by customers.

The diagram in Figure 7 shows the SHCA steps in action.

Figure 7: SHCA steps

Figure 7: SHCA steps

By integrating these steps, SHCA simplifies compliance management and helps enhance the overall security posture of AWS environments, aligning with the rigorous standards set by NIST SP 800-53 Rev. 5.

The following is a list of the artifacts that SHCA provides:

  • RMF-ready controls – Controls in full compliance (as per AWS Config) with AWS Operational Recommendations for NIST SP 800-53 Rev. 5, ready for direct import into RMF tools.
  • Controls needing attention – Controls not fully compliant with AWS Operational Recommendations for NIST SP 800-53 Rev. 5, indicating areas that require improvement.
  • Control compliance summary (CSV) – A detailed summary, in CSV format, of NIST SP 800-53 controls, including their compliance percentages and comprehensive narratives for each control.
  • Security Hub NIST 800-53 Analysis Summary – This automated report provides an executive summary of the current compliance posture, tailored for leadership reviews. It emphasizes urgent compliance concerns that require immediate action and guides the creation of a targeted remediation strategy for operational teams.
  • Original Security Hub findings – The raw JSON file from Security Hub, captured at the last time that the SHCA state machine ran.
  • User-friendly findings summary –A simplified, flattened version of the original findings, formatted for accessibility in common productivity tools.
  • Original findings from Security Hub in OCSF – The original findings converted to the Open Cybersecurity Schema Framework (OCSF) format for future applications.
  • Original findings from Security Hub in OSCAL – The original findings translated into the Open Security Controls Assessment Language (OSCAL) format for subsequent usage.

As shown in Figure 8, the Security Hub NIST 800-53 Analysis Summary adopts an OpenSCAP-style format akin to Security Technical Implementation Guides (STIGs), which are grounded in the Department of Defense’s (DoD) policy and security protocols.

Figure 8: SHCA Summary Report

Figure 8: SHCA Summary Report

You can also view the code on GitHub at Security Hub Compliance Analyzer.

Conclusion

Organizations can use AWS security and compliance services to help maintain compliance with the NIST SP 800-53 standard. By implementing preventative IAM and SCP policies, organizations can restrict users from creating noncompliant resources. Detective controls such as Security Hub and Prowler can help identify misconfigurations, while proactive tools such as CloudFormation Guard can scan IaC to help prevent deployment of noncompliant resources. Finally, the Automated Security Response on AWS can automatically remediate findings to help resolve issues quickly. With this layered security approach across the organization, companies can verify that AWS deployments align to the NIST framework, simplify compliance reporting, and enable security teams to focus on critical issues. Get started on your continuous compliance journey today. Using AWS solutions, you can align deployments with the NIST 800-53 standard. Implement the tips in this post to help maintain continuous compliance.

If you have feedback about this post, submit comments in the Comments section below. If you have questions about this post, start a new thread on the AWS Security, Identity, & Compliance re:Post or contact AWS Support.

Josh Moss

Josh Moss
Josh is a Senior Security Consultant at AWS who specializes in security automation, as well as threat detection and incident response. Josh brings his over fifteen years of experience as a hacker, security analyst, and security engineer to his Federal customers as an AWS Professional Services Consultant.

Rick Kidder

Rick Kidder
Rick, with over thirty years of expertise in cybersecurity and information technology, serves as a Senior Security Consultant at AWS. His specialization in data analysis is centered around security and compliance within the DoD and industry sectors. At present, Rick is focused on providing guidance to DoD and Federal customers in his role as a Senior Cloud Consultant with AWS Professional Services.

Scott Sizemore

Scott Sizemore
Scott is a Senior Cloud Consultant on the AWS World Wide Public Sector (WWPS) Professional Services Department of Defense (DoD) team. Prior to joining AWS, Scott was a DoD contractor supporting multiple agencies for over 20 years.

No version left behind: Our epic journey of GitLab upgrades

Post Syndicated from Grab Tech original https://engineering.grab.com/no-version-left-behind-our-epic-journey-of-gitlab-upgrades

In a tech-driven field, staying updated isn’t an option—it’s essential. At Grab, we’re committed to providing top-notch technology services. However, keeping pace can be demanding. At one point in time, our GitLab instance was trailing by roughly 14 months of releases. This blog post recounts our experience updating and formulating a consistent upgrade routine.

Recognising the need to upgrade

Our team, while skilled, was still learning GitLab’s complexities. Regular stability issues left us little time for necessary upgrades. Understanding the importance of upgrades for our operations to get latest patches for important security fixes and vulnerabilities, we started preparing for GitLab updates while managing system stability. This meant a quick learning and careful approach to updates.

The following image illustrates the version discrepancy between our self-hosted GitLab instance and the official most recent release of GitLab as of July 2022. GitLab follows a set release schedule, issuing one minor update monthly and rolling out a major upgrade annually.

Fig 1. The difference between our hosted version and the latest available GitLab version by 22 July 2022

Addressing fears and concerns

We were concerned about potential downtime, data integrity, and the threat of encountering unforeseen issues. GitLab is critical for the daily activities of Grab engineers. It serves a critical user base of thousands of engineers actively using it, hosting multiple mono repositories with code bases ranging in size from 1GB to a sizable 15GB. When taking into account all its artefacts, the overall imprint of a monorepo can extend to an impressive 39TB.

Our self-hosted GitLab firmly intertwines with multiple critical components. We’ve aligned our systems with GitLab’s official reference architecture for 5,000 users. We use Terraform to configure complete infrastructure with immutable Amazon Machine Images (AMIs) built using Packer and Ansible. Our efficient GitLab setup is designed for reliable performance to serve our wide user base. However, any fault leading to outages can disrupt our engineers, resulting in a loss of productivity for hundreds of teams.

High-level GitLab Architecture Diagram

The above is the top level architecture diagram of our GitLab infrastructure. Here are the major components of the GitLab architecture and their functions: 

  • Gitaly: Handles low-level Git operations for GitLab, such as interacting directly with the code repository present on disk. It’s important to mention that these code repositories are also stored on the same Gitaly nodes, using the attached Amazon Elastic Block Store (Amazon EBS) disks.
  • Praefect: Praefect in GitLab acts as a manager, coordinating Gitaly nodes to maintain data consistency and high availability.
  • Sidekiq: The background processing framework for GitLab written in Ruby. It handles asynchronous tasks in GitLab, ensuring smooth operation without blocking the main application.
  • App Server: The core web application server that serves the GitLab user interface and interacts with other components.

The importance of preparation

Recognising the complexity of our task, we prioritised careful planning for a successful upgrade. We studied GitLab’s documentation, shared insights within the team, and planned to prevent data losses.

To minimise disruptions from major upgrades or database migrations, we scheduled these during weekends. We also developed a checklist and a systematic approach for each upgrade, which include the following:

  • Diligently go through the release notes for each version of GitLab that falls within the scope of our upgrade.
  • Read through all dependencies like RDS, Redis, and Elasticsearch to ensure version compatibility.
  • Create documentation outlining new features, any deprecated elements, and changes that could potentially impact our operations.
  • Generate immutable AMIs for various components reflecting the new version of GitLab.
  • Revisit and validate all the backup plans.
  • Refresh staging environment with production data for accurate, realistic testing and performance checks, and validation of migration scripts under conditions similar to the actual setup.
  • Upgrade the staging environment.
  • Conduct extensive testing, incorporating both automated and manual functional testing, as well as load testing.
  • Conduct rollback tests on the staging environment to the previous version to confirm the rollback procedure’s reliability.
  • Inform all impacted stakeholders, and provide a defined timeline for upcoming upgrades.

We systematically follow GitLab’s official documentation for each upgrade, ensuring compatibility across software versions and reviewing specific instructions and changes, including any deprecations or removals.

The first upgrade

Equipped with knowledge, backup plans, and a robust support system, we embarked on our first GitLab upgrade two years ago. We carefully followed our checklist, handling each important part systematically. GitLab comprises both stateful (Gitaly) and stateless (Praefect, Sidekiq, and App Server) components, all managed through auto-scaling groups. We use a ‘create before destroy’ strategy for deploying stateless components and an ‘in-place node rotation’ method via Terraform for stateful ones.

We deployed key parts like Gitaly, Praefect, Sidekiq, App Servers, Network File System (NFS) server, and Elasticsearch in a specific sequence. Starting with Gitaly, followed by Praefect, then Sidekiq and App Servers, and finally NFS and Elasticsearch. Our thorough testing showed this order to be the most dependable and safe.

However, the journey was full of challenges. For instance, we encountered issues such as the Gitaly cluster falling out of sync for monorepo and the Praefect server failing to distribute the load effectively. Praefect assigns a primary Gitaly node for each repository to host it. All write operations are sent to the repository’s primary node, while read requests are spread across all synced nodes in the Gitaly cluster. If the Gitaly nodes aren’t synced, Praefect will redirect all write and read operations to the repository’s primary node.

Gitaly is a stateful application, we upgraded each Gitaly node with the latest AMI using an in-place node rotation strategy. In older versions of GitLab (up to v14.0), if a Gitaly node is unhealthy, Praefect would immediately update the primary node for the repository to any healthy Gitaly node. After the rolling upgrade for a 3-node Gitaly cluster, repositories were mainly concentrated on only one Gitaly node.

In our situation, a very busy monorepo was assigned to a Gitaly node that was also the main node for many other repositories. When real traffic began after deployment, the Gitaly node had trouble syncing the monorepo with the other nodes in the cluster.

Because the Gitaly node was out of sync, Praefect started sending all changes and access requests for monorepo to this struggling Gitaly node. This increased the load on the Gitaly server, causing it to fail. We found this to be the main issue and decided to manually move our monorepo to a Gitaly node that was less crowded. We also added a step to validate primary node distribution to our deployment checklist.

This immediate failover behaviour changed in GitLab version 14.1. Now, a primary is only elected lazily when a write request arrives for any repository. However, since we enabled maintenance mode before the Gitaly deployment, we didn’t receive any write requests. As a result, we did not see a shift in the primary node of the monorepo with new GitLab versions.

Regular upgrades: Our new normal

Embracing the practice of consistent upgrades dramatically transformed the way we operate. We initiated frequent upgrades and implemented measures to reduce the actual deployment time.  

  • Perform all major testing in one day before deployment.
  • Prepare a detailed checklist to follow during the deployment activity.
  • Reduce the minimum number of App Server and Sidekiq Servers required just after we start the deployment.
  • Upgrade components like App Server and Sidekiq in parallel.
  • Automate smoke testing to examine all major workflows after deployment.

Leveraging the lessons learned and the experience gained with each upgrade, we successfully cut the time spent on the entire operation by 50%. The image-3 shows how we reduced our deployment time for major upgrades from 6 hours to 3 hours and our deployment time for minor upgrades from 4 to 1.5 hours.

Each upgrade enriched our comprehensive knowledge base, equipping us with insights into the possible behaviours of each component under varying circumstances. Our growing experience and enhanced knowledge helped us achieve successful upgrades with less downtime with each deployment.

Rather than moving up one minor version at a time, we learned about the feasibility of skipping versions. We began using the GitLab Upgrade Path. This method allowed us to skip several versions, closing the distance to the latest version with fewer deployments. This approach enabled us to catch up on 24 months’ worth of upgrades in just 11 months, even though we started 14 months behind. 

Time taken in hrs for each upgrade. The blue line depicts major and the red line is for minor upgrades

Overcoming challenges

Our journey was not without hurdles. We faced challenges in maintaining system stability during upgrades, navigating unexpected changes in functionality post upgrades, and ensuring data integrity.

However, these challenges served as an opportunity for our team to innovate and create robust workarounds. Here are a few highlights:

Unexpected project distribution: During upgrades and Gitaly server restarts, we observed unexpected migration of the monorepo to a crowded Gitaly server, resulting in higher rate limiting. We manually updated primary nodes for the monorepo and made this validation as a part of our deployment checklist.

NFS deprecation: We migrated all required data to S3 buckets and deprecated NFS to become more resilient and independent of Availability Zone (AZ).

Handling unexpected Continuous Integration (CI) operations: A sudden surge in CI operations sometimes resulted in rate limiting and interrupted more essential Git operations for developers. This is because GitLab uses different RPC calls and their concurrency for SSH and HTTP operations. We encouraged using HTTPS links for GitLab CI and automation script and SSH links for regular Git operations.

Right-sizing resources: We countered resource limitations by right-sizing our infrastructure, ensuring each component had optimal resources to function efficiently.

Performance testing: We conducted performance testing of our GitLab using the GitLab Performance Tool (GPT). In addition, we used our custom scripts to load test Grab specific use cases and mono repositories.

Limiting maintenance windows: Each deployment required a maintenance window or downtime. To minimise this, we structured our deployment processes more efficiently, reducing potential downtime and ensuring uninterrupted service for users.

Dependency on GitLab.com image registry: We introduced measures to host necessary images internally, which increased our resilience and allowed us to cut ties with external dependencies.

The results

Through careful planning, we’ve improved our upgrade process, ensuring system stability and timely updates. We’ve also reduced the delay in aligning with official GitLab releases. The image below displays how the time delay between release date and deployment has been reduced with each upgrade. It sharply brought down from 396 days (around 14 months) to 35 days

At the time of this article, we’re just two minor versions behind the latest GitLab release, with a strong focus on security and resilience. We are also seeing a reduced number of reported issues after each upgrade.

Our refined process has allowed us to perform regular updates without any service disruptions. We aim to leverage these learnings to automate our upgrade deployments, painting a positive picture for our future updates, marked by efficiency and stability.

Time delay between official release date and date of deployment

Looking ahead

Our dedication extends beyond staying current with the most recent GitLab versions. With stabilised deployment, we are now focusing on:

  • Automated upgrades: Our efforts extend towards bringing in more automation to enhance efficiency. We’re already employing zero-downtime automated upgrades for patch versions involving no database migrations, utilising GitLab pipelines. Looking forward, we plan to automate minor version deployments as well, ensuring minimal human intervention during the upgrade process.
  • Automated runner onboarding for service teams: We’ve developed a ‘Runner as a Service’ solution for our service teams. Service teams can create their dedicated runners by providing minimal details, while we manage these runners centrally. This setup allows the service team to stay focused on development, ensuring smooth operations.
  • Improved communication and data safety: We’re regularly communicating new features and potential issues to our service teams. We also ensure targeted solutions for any disruptions. Additionally, we’re focusing on developing automated data validation via our data restoration process. 
  • Focus on development: With stabilised updates, we’ve created an environment where our development teams can focus more on crafting new features and supporting ongoing work, rather than handling upgrade issues.

Key takeaways

The upgrade process taught us the importance of adaptability, thorough preparation, effective communication, and continuous learning. Our ‘No Version Left Behind’ motto underscores the critical role of regular tech updates in boosting productivity, refining processes, and strengthening security. These insights will guide us as we navigate ongoing technological advancements.

Below are the key areas in which we improved:

Enhanced testing procedures: We’ve fine-tuned our testing strategies, using both automated and manual testing for GitLab, and regularly conducting performance tests before upgrades.

Approvals: We’ve designed approval workflows that allow us to obtain necessary clearances or approvals before each upgrade efficiently, further ensuring the smooth execution of our processes.

Improved communication: We’ve improved stakeholder communication, regularly sharing updates and detailed documents about new features, deprecated items, and significant changes with each upgrade.

Streamlined planning: We’ve improved our upgrade planning, strictly following our checklist and rotating the role of Upgrade Ownership among team members.

Optimised activity time: We’ve significantly reduced the time for production upgrade activity through advanced planning, automation, and eliminating unnecessary steps.

Efficient issue management: We’ve improved our ability to handle potential GitLab upgrade issues, with minimal to no issues occurring. We’re prepared to handle any incidents that could cause an outage.

Knowledge base creation and automation: We’ve created a GitLab knowledge base and continuously enhanced it with rich content, making it even more invaluable for training new team members and for reference during unexpected situations. We’ve also automated routine tasks to improve efficiency and reduce manual errors.

Join us

Grab is the leading superapp platform in Southeast Asia, providing everyday services that matter to consumers. More than just a ride-hailing and food delivery app, Grab offers a wide range of on-demand services in the region, including mobility, food, package and grocery delivery services, mobile payments, and financial services across 428 cities in eight countries.

Powered by technology and driven by heart, our mission is to drive Southeast Asia forward by creating economic empowerment for everyone. If this mission speaks to you, join our team today!

Terraform CI/CD and testing on AWS with the new Terraform Test Framework

Post Syndicated from Kevon Mayers original https://aws.amazon.com/blogs/devops/terraform-ci-cd-and-testing-on-aws-with-the-new-terraform-test-framework/

Image of HashiCorp Terraform logo and Amazon Web Services (AWS) Logo. Underneath the AWS Logo are the service logos for AWS CodeCommit, AWS CodeBuild, AWS CodePipeline, and Amazon S3. Graphic created by Kevon Mayers

Graphic created by Kevon Mayers

 Introduction

Organizations often use Terraform Modules to orchestrate complex resource provisioning and provide a simple interface for developers to enter the required parameters to deploy the desired infrastructure. Modules enable code reuse and provide a method for organizations to standardize deployment of common workloads such as a three-tier web application, a cloud networking environment, or a data analytics pipeline. When building Terraform modules, it is common for the module author to start with manual testing. Manual testing is performed using commands such as terraform validate for syntax validation, terraform plan to preview the execution plan, and terraform apply followed by manual inspection of resource configuration in the AWS Management Console. Manual testing is prone to human error, not scalable, and can result in unintended issues. Because modules are used by multiple teams in the organization, it is important to ensure that any changes to the modules are extensively tested before the release. In this blog post, we will show you how to validate Terraform modules and how to automate the process using a Continuous Integration/Continuous Deployment (CI/CD) pipeline.

Terraform Test

Terraform test is a new testing framework for module authors to perform unit and integration tests for Terraform modules. Terraform test can create infrastructure as declared in the module, run validation against the infrastructure, and destroy the test resources regardless if the test passes or fails. Terraform test will also provide warnings if there are any resources that cannot be destroyed. Terraform test uses the same HashiCorp Configuration Language (HCL) syntax used to write Terraform modules. This reduces the burden for modules authors to learn other tools or programming languages. Module authors run the tests using the command terraform test which is available on Terraform CLI version 1.6 or higher.

Module authors create test files with the extension *.tftest.hcl. These test files are placed in the root of the Terraform module or in a dedicated tests directory. The following elements are typically present in a Terraform tests file:

  • Provider block: optional, used to override the provider configuration, such as selecting AWS region where the tests run.
  • Variables block: the input variables passed into the module during the test, used to supply non-default values or to override default values for variables.
  • Run block: used to run a specific test scenario. There can be multiple run blocks per test file, Terraform executes run blocks in order. In each run block you specify the command Terraform (plan or apply), and the test assertions. Module authors can specify the conditions such as: length(var.items) != 0. A full list of condition expressions can be found in the HashiCorp documentation.

Terraform tests are performed in sequential order and at the end of the Terraform test execution, any failed assertions are displayed.

Basic test to validate resource creation

Now that we understand the basic anatomy of a Terraform tests file, let’s create basic tests to validate the functionality of the following Terraform configuration. This Terraform configuration will create an AWS CodeCommit repository with prefix name repo-.

# main.tf

variable "repository_name" {
  type = string
}
resource "aws_codecommit_repository" "test" {
  repository_name = format("repo-%s", var.repository_name)
  description     = "Test repository."
}

Now we create a Terraform test file in the tests directory. See the following directory structure as an example:

├── main.tf 
└── tests 
└── basic.tftest.hcl

For this first test, we will not perform any assertion except for validating that Terraform execution plan runs successfully. In the tests file, we create a variable block to set the value for the variable repository_name. We also added the run block with command = plan to instruct Terraform test to run Terraform plan. The completed test should look like the following:

# basic.tftest.hcl

variables {
  repository_name = "MyRepo"
}

run "test_resource_creation" {
  command = plan
}

Now we will run this test locally. First ensure that you are authenticated into an AWS account, and run the terraform init command in the root directory of the Terraform module. After the provider is initialized, start the test using the terraform test command.

❯ terraform test
tests/basic.tftest.hcl... in progress
run "test_resource_creation"... pass
tests/basic.tftest.hcl... tearing down
tests/basic.tftest.hcl... pass

Our first test is complete, we have validated that the Terraform configuration is valid and the resource can be provisioned successfully. Next, let’s learn how to perform inspection of the resource state.

Create resource and validate resource name

Re-using the previous test file, we add the assertion block to checks if the CodeCommit repository name starts with a string repo- and provide error message if the condition fails. For the assertion, we use the startswith function. See the following example:

# basic.tftest.hcl

variables {
  repository_name = "MyRepo"
}

run "test_resource_creation" {
  command = plan

  assert {
    condition = startswith(aws_codecommit_repository.test.repository_name, "repo-")
    error_message = "CodeCommit repository name ${var.repository_name} did not start with the expected value of ‘repo-****’."
  }
}

Now, let’s assume that another module author made changes to the module by modifying the prefix from repo- to my-repo-. Here is the modified Terraform module.

# main.tf

variable "repository_name" {
  type = string
}
resource "aws_codecommit_repository" "test" {
  repository_name = format("my-repo-%s", var.repository_name)
  description = "Test repository."
}

We can catch this mistake by running the the terraform test command again.

❯ terraform test
tests/basic.tftest.hcl... in progress
run "test_resource_creation"... fail
╷
│ Error: Test assertion failed
│
│ on tests/basic.tftest.hcl line 9, in run "test_resource_creation":
│ 9: condition = startswith(aws_codecommit_repository.test.repository_name, "repo-")
│ ├────────────────
│ │ aws_codecommit_repository.test.repository_name is "my-repo-MyRepo"
│
│ CodeCommit repository name MyRepo did not start with the expected value 'repo-***'.
╵
tests/basic.tftest.hcl... tearing down
tests/basic.tftest.hcl... fail

Failure! 0 passed, 1 failed.

We have successfully created a unit test using assertions that validates the resource name matches the expected value. For more examples of using assertions see the Terraform Tests Docs. Before we proceed to the next section, don’t forget to fix the repository name in the module (revert the name back to repo- instead of my-repo-) and re-run your Terraform test.

Testing variable input validation

When developing Terraform modules, it is common to use variable validation as a contract test to validate any dependencies / restrictions. For example, AWS CodeCommit limits the repository name to 100 characters. A module author can use the length function to check the length of the input variable value. We are going to use Terraform test to ensure that the variable validation works effectively. First, we modify the module to use variable validation.

# main.tf

variable "repository_name" {
  type = string
  validation {
    condition = length(var.repository_name) <= 100
    error_message = "The repository name must be less than or equal to 100 characters."
  }
}

resource "aws_codecommit_repository" "test" {
  repository_name = format("repo-%s", var.repository_name)
  description = "Test repository."
}

By default, when variable validation fails during the execution of Terraform test, the Terraform test also fails. To simulate this, create a new test file and insert the repository_name variable with a value longer than 100 characters.

# var_validation.tftest.hcl

variables {
  repository_name = “this_is_a_repository_name_longer_than_100_characters_7rfD86rGwuqhF3TH9d3Y99r7vq6JZBZJkhw5h4eGEawBntZmvy”
}

run “test_invalid_var” {
  command = plan
}

Notice on this new test file, we also set the command to Terraform plan, why is that? Because variable validation runs prior to Terraform apply, thus we can save time and cost by skipping the entire resource provisioning. If we run this Terraform test, it will fail as expected.

❯ terraform test
tests/basic.tftest.hcl… in progress
run “test_resource_creation”… pass
tests/basic.tftest.hcl… tearing down
tests/basic.tftest.hcl… pass
tests/var_validation.tftest.hcl… in progress
run “test_invalid_var”… fail
╷
│ Error: Invalid value for variable
│
│ on main.tf line 1:
│ 1: variable “repository_name” {
│ ├────────────────
│ │ var.repository_name is “this_is_a_repository_name_longer_than_100_characters_7rfD86rGwuqhF3TH9d3Y99r7vq6JZBZJkhw5h4eGEawBntZmvy”
│
│ The repository name must be less than or equal to 100 characters.
│
│ This was checked by the validation rule at main.tf:3,3-13.
╵
tests/var_validation.tftest.hcl… tearing down
tests/var_validation.tftest.hcl… fail

Failure! 1 passed, 1 failed.

For other module authors who might iterate on the module, we need to ensure that the validation condition is correct and will catch any problems with input values. In other words, we expect the validation condition to fail with the wrong input. This is especially important when we want to incorporate the contract test in a CI/CD pipeline. To prevent our test from failing due introducing an intentional error in the test, we can use the expect_failures attribute. Here is the modified test file:

# var_validation.tftest.hcl

variables {
  repository_name = “this_is_a_repository_name_longer_than_100_characters_7rfD86rGwuqhF3TH9d3Y99r7vq6JZBZJkhw5h4eGEawBntZmvy”
}

run “test_invalid_var” {
  command = plan

  expect_failures = [
    var.repository_name
  ]
}

Now if we run the Terraform test, we will get a successful result.

❯ terraform test
tests/basic.tftest.hcl… in progress
run “test_resource_creation”… pass
tests/basic.tftest.hcl… tearing down
tests/basic.tftest.hcl… pass
tests/var_validation.tftest.hcl… in progress
run “test_invalid_var”… pass
tests/var_validation.tftest.hcl… tearing down
tests/var_validation.tftest.hcl… pass

Success! 2 passed, 0 failed.

As you can see, the expect_failures attribute is used to test negative paths (the inputs that would cause failures when passed into a module). Assertions tend to focus on positive paths (the ideal inputs). For an additional example of a test that validates functionality of a completed module with multiple interconnected resources, see this example in the Terraform CI/CD and Testing on AWS Workshop.

Orchestrating supporting resources

In practice, end-users utilize Terraform modules in conjunction with other supporting resources. For example, a CodeCommit repository is usually encrypted using an AWS Key Management Service (KMS) key. The KMS key is provided by end-users to the module using a variable called kms_key_id. To simulate this test, we need to orchestrate the creation of the KMS key outside of the module. In this section we will learn how to do that. First, update the Terraform module to add the optional variable for the KMS key.

# main.tf

variable "repository_name" {
  type = string
  validation {
    condition = length(var.repository_name) <= 100
    error_message = "The repository name must be less than or equal to 100 characters."
  }
}

variable "kms_key_id" {
  type = string
  default = ""
}

resource "aws_codecommit_repository" "test" {
  repository_name = format("repo-%s", var.repository_name)
  description = "Test repository."
  kms_key_id = var.kms_key_id != "" ? var.kms_key_id : null
}

In a Terraform test, you can instruct the run block to execute another helper module. The helper module is used by the test to create the supporting resources. We will create a sub-directory called setup under the tests directory with a single kms.tf file. We also create a new test file for KMS scenario. See the updated directory structure:

├── main.tf
└── tests
├── setup
│ └── kms.tf
├── basic.tftest.hcl
├── var_validation.tftest.hcl
└── with_kms.tftest.hcl

The kms.tf file is a helper module to create a KMS key and provide its ARN as the output value.

# kms.tf

resource "aws_kms_key" "test" {
  description = "test KMS key for CodeCommit repo"
  deletion_window_in_days = 7
}

output "kms_key_id" {
  value = aws_kms_key.test.arn
}

The new test will use two separate run blocks. The first run block (setup) executes the helper module to generate a KMS key. This is done by assigning the command apply which will run terraform apply to generate the KMS key. The second run block (codecommit_with_kms) will then use the KMS key ARN output of the first run as the input variable passed to the main module.

# with_kms.tftest.hcl

run "setup" {
  command = apply
  module {
    source = "./tests/setup"
  }
}

run "codecommit_with_kms" {
  command = apply

  variables {
    repository_name = "MyRepo"
    kms_key_id = run.setup.kms_key_id
  }

  assert {
    condition = aws_codecommit_repository.test.kms_key_id != null
    error_message = "KMS key ID attribute value is null"
  }
}

Go ahead and run the Terraform init, followed by Terraform test. You should get the successful result like below.

❯ terraform test
tests/basic.tftest.hcl... in progress
run "test_resource_creation"... pass
tests/basic.tftest.hcl... tearing down
tests/basic.tftest.hcl... pass
tests/var_validation.tftest.hcl... in progress
run "test_invalid_var"... pass
tests/var_validation.tftest.hcl... tearing down
tests/var_validation.tftest.hcl... pass
tests/with_kms.tftest.hcl... in progress
run "create_kms_key"... pass
run "codecommit_with_kms"... pass
tests/with_kms.tftest.hcl... tearing down
tests/with_kms.tftest.hcl... pass

Success! 4 passed, 0 failed.

We have learned how to run Terraform test and develop various test scenarios. In the next section we will see how to incorporate all the tests into a CI/CD pipeline.

Terraform Tests in CI/CD Pipelines

Now that we have seen how Terraform Test works locally, let’s see how the Terraform test can be leveraged to create a Terraform module validation pipeline on AWS. The following AWS services are used:

  • AWS CodeCommit – a secure, highly scalable, fully managed source control service that hosts private Git repositories.
  • AWS CodeBuild – a fully managed continuous integration service that compiles source code, runs tests, and produces ready-to-deploy software packages.
  • AWS CodePipeline – a fully managed continuous delivery service that helps you automate your release pipelines for fast and reliable application and infrastructure updates.
  • Amazon Simple Storage Service (Amazon S3) – an object storage service offering industry-leading scalability, data availability, security, and performance.
Terraform module validation pipeline Architecture. Multiple interconnected AWS services such as AWS CodeCommit, CodeBuild, CodePipeline, and Amazon S3 used to build a Terraform module validation pipeline.

Terraform module validation pipeline

In the above architecture for a Terraform module validation pipeline, the following takes place:

  • A developer pushes Terraform module configuration files to a git repository (AWS CodeCommit).
  • AWS CodePipeline begins running the pipeline. The pipeline clones the git repo and stores the artifacts to an Amazon S3 bucket.
  • An AWS CodeBuild project configures a compute/build environment with Checkov installed from an image fetched from Docker Hub. CodePipeline passes the artifacts (Terraform module) and CodeBuild executes Checkov to run static analysis of the Terraform configuration files.
  • Another CodeBuild project configured with Terraform from an image fetched from Docker Hub. CodePipeline passes the artifacts (repo contents) and CodeBuild runs Terraform command to execute the tests.

CodeBuild uses a buildspec file to declare the build commands and relevant settings. Here is an example of the buildspec files for both CodeBuild Projects:

# Checkov
version: 0.1
phases:
  pre_build:
    commands:
      - echo pre_build starting

  build:
    commands:
      - echo build starting
      - echo starting checkov
      - ls
      - checkov -d .
      - echo saving checkov output
      - checkov -s -d ./ > checkov.result.txt

In the above buildspec, Checkov is run against the root directory of the cloned CodeCommit repository. This directory contains the configuration files for the Terraform module. Checkov also saves the output to a file named checkov.result.txt for further review or handling if needed. If Checkov fails, the pipeline will fail.

# Terraform Test
version: 0.1
phases:
  pre_build:
    commands:
      - terraform init
      - terraform validate

  build:
    commands:
      - terraform test

In the above buildspec, the terraform init and terraform validate commands are used to initialize Terraform, then check if the configuration is valid. Finally, the terraform test command is used to run the configured tests. If any of the Terraform tests fails, the pipeline will fail.

For a full example of the CI/CD pipeline configuration, please refer to the Terraform CI/CD and Testing on AWS workshop. The module validation pipeline mentioned above is meant as a starting point. In a production environment, you might want to customize it further by adding Checkov allow-list rules, linting, checks for Terraform docs, or pre-requisites such as building the code used in AWS Lambda.

Choosing various testing strategies

At this point you may be wondering when you should use Terraform tests or other tools such as Preconditions and Postconditions, Check blocks or policy as code. The answer depends on your test type and use-cases. Terraform test is suitable for unit tests, such as validating resources are created according to the naming specification. Variable validations and Pre/Post conditions are useful for contract tests of Terraform modules, for example by providing error warning when input variables value do not meet the specification. As shown in the previous section, you can also use Terraform test to ensure your contract tests are running properly. Terraform test is also suitable for integration tests where you need to create supporting resources to properly test the module functionality. Lastly, Check blocks are suitable for end to end tests where you want to validate the infrastructure state after all resources are generated, for example to test if a website is running after an S3 bucket configured for static web hosting is created.

When developing Terraform modules, you can run Terraform test in command = plan mode for unit and contract tests. This allows the unit and contract tests to run quicker and cheaper since there are no resources created. You should also consider the time and cost to execute Terraform test for complex / large Terraform configurations, especially if you have multiple test scenarios. Terraform test maintains one or many state files within the memory for each test file. Consider how to re-use the module’s state when appropriate. Terraform test also provides test mocking, which allows you to test your module without creating the real infrastructure.

Conclusion

In this post, you learned how to use Terraform test and develop various test scenarios. You also learned how to incorporate Terraform test in a CI/CD pipeline. Lastly, we also discussed various testing strategies for Terraform configurations and modules. For more information about Terraform test, we recommend the Terraform test documentation and tutorial. To get hands on practice building a Terraform module validation pipeline and Terraform deployment pipeline, check out the Terraform CI/CD and Testing on AWS Workshop.

Authors

Kevon Mayers

Kevon Mayers is a Solutions Architect at AWS. Kevon is a Terraform Contributor and has led multiple Terraform initiatives within AWS. Prior to joining AWS he was working as a DevOps Engineer and Developer, and before that was working with the GRAMMYs/The Recording Academy as a Studio Manager, Music Producer, and Audio Engineer. He also owns a professional production company, MM Productions.

Welly Siauw

Welly Siauw is a Principal Partner Solution Architect at Amazon Web Services (AWS). He spends his day working with customers and partners, solving architectural challenges. He is passionate about service integration and orchestration, serverless and artificial intelligence (AI) and machine learning (ML). He has authored several AWS blog posts and actively leads AWS Immersion Days and Activation Days. Welly spends his free time tinkering with espresso machines and outdoor hiking.

Autonomous hardware diagnostics and recovery at scale

Post Syndicated from Jet Mariscal original https://blog.cloudflare.com/autonomous-hardware-diagnostics-and-recovery-at-scale


Cloudflare’s global network spans more than 310 cities in over 120 countries. That means thousands of servers geographically spread across different data centers, running services that protect and accelerate our customer’s Internet applications. Operating hardware at such a scale means that hardware can break anywhere and at any time. In such cases, our systems are engineered such that these failures cause little to no impact. However, detecting and managing server failure at scale requires automation. This blog aims to provide insights into the difficulties involved in handling broken servers and how we were able to simplify the process through automation.

Challenges dealing with broken servers

When a server is found to have faulty hardware and needs to be removed from production, it is  considered broken and its state is set to Repair in the internal database where server status is tracked. In the past, our Data Center Operations team were essentially left to troubleshoot and diagnose broken servers on their own. They had to go through laborious tasks like performing queries to locate and repair servers, conducting diagnostics, reviewing results, evaluating if a server can be restored to production, and creating the necessary tickets for re-enabling servers and executing operations to put them back in production. Such effort can take hours for a single server alone, and can easily consume an engineer’s entire day.

As you can see, addressing server repairs was a labor-intensive process performed manually, Additionally, a lot of these servers remained powered on within the racks, wasting energy. With our fleet expanding rapidly, the attention of Data Center Operations is primarily devoted to supporting this growth, leaving less time to handle servers in need of repair.

It was clear that our infrastructure was growing too fast for us to be able to handle repairs and recovery, so we had to find a better way to handle these sorts of inefficiencies in our operations. This would allow our engineers to focus on the growth of our footprint while not abandoning repair and recovery – after all, these are still huge CapEx investments and wasted capacity that otherwise would have been fully utilized.

Using automation as an autonomous system

As members of the Infrastructure Software Systems and Automation team at Cloudflare, we primarily work on building tools and automation that help reduce excess work in order to ease the pressure on our operations teams, increase productivity, and enable people to execute operations with the highest efficiency.

Our team continuously strives to challenge our existing processes and systems, finding ways we can evolve them and make significant improvements – one of which is to build not just a typical automated system but an autonomous one. Building autonomous automations means creating systems that can operate independently, without the need for constant human intervention or oversight – a perfect example of this is Phoenix.

Introducing Phoenix

Phoenix is an autonomous diagnostics and recovery automation that runs at regular intervals to discover Cloudflare data centers with servers that are broken, performing diagnostics on detection, recovering those that pass diagnostics by re-provisioning, and ultimately re-enabling  those that have successfully been re-provisioned in the safest and most unobtrusive way possible – all without requiring any human intervention! Should a server fail at any point in the process, Phoenix will take care of updating relevant tickets, even pinpointing the cause of the failure, and reverting the state of the server accordingly when needed – again, all without any human intervention!

The image below illustrates the whole process:

To better understand exactly how Phoenix works, let’s dive into some details about its core functionality.

Discovery

Discovery runs at a regular interval of 30 minutes, selecting a maximum of two Cloudflare data centers that have broken or repair state servers in its fleet, which are all configurable depending on business and operational needs, against which it can immediately execute diagnostics. At this rate, Phoenix is able to discover and operate on all broken servers in the fleet in about 3 days. On each run, it also detects data centers that may have broken servers already queued for recovery, and takes care of ensuring that the Recovery phase is executed immediately.

Diagnostics

Diagnostics takes care of running various tests across the broken servers of a selected data center in a single run, verifying viability of the hardware components, and identifying the candidates for recovery.

A diagnostic operation includes running the following:

  • Out-of-Band connectivity check
    This check determines the reachability of a device via out-of-band network. We employ IPMI (Intelligent Platform Management Interface) to ensure proper physical connectivity and accessibility of devices. This allows for effective monitoring and management of hardware components, enhancing overall system reliability and performance. Only devices that pass this check can progress to the Node Acceptance Testing phase.
  • Node Acceptance Tests
    We leverage an existing internally-built tool called INAT (Integrated Node Acceptance Testing) that runs various tests suites/cases (Hardware Validation, Performance, etc.).

    For every server that needs to be diagnosed, Phoenix will send relevant system instructions to have it boot into a custom Linux boot image, internally called INAT-image. Built into this image are the various tests that need to run when the server boots up, publishing the results to an internal resource in both human-readable (HTML) and machine-readable (JSON) formats, with the latter consumed and interpreted by Phoenix. Upon completion of the boot diagnostics, the server is powered off again to ensure it is not wasting energy.

Our node acceptance tests encompass a range of evaluations, including but not limited to benchmark testing, CPU/Memory/Storage checks, drive wiping, and various other assessments.  Look out for an upcoming in-depth blog post covering INAT.

A summarized diagnostics result is immediately added to the tracking ticket, including pinpointing the exact cause of a failure.

Recovery

Recovery executes what we call an expansion operation, which in its first phase will provision the servers that pass diagnostics. The second phase is to re-enable the successfully provisioned servers back to production, where only those that have been re-enabled successfully will start receiving production traffic again.

Once the diagnostics are passed and the broken servers move on towards the first phase of recovery, we change their statuses from Repair to Pending Provision. If the servers don’t fully recover, for example, because there are server configuration errors or issues enabling services, Phoenix assesses the situation. In such cases, it returns those servers to the Repair state for additional evaluation. Additionally, if the diagnostics indicate that the servers need any faulty components replaced, then Phoenix notifies our Data Center operation team for manual repairs as required, ensuring that the server is not repeatedly selected until the required part replacement is completed. This ensures any necessary human intervention can be applied promptly, making the server ready for Phoenix to rediscover in its next iteration.

An autonomous recovery operation requires infusing intelligence into the automated system so that we can fully trust that it’s able to execute an expansion operation in the safest way possible and handle situations on its own without any human interventions. To do this, we’ve made sure Phoenix is automation-aware – this means that it knows when there are other automations executing certain operations such as expansions, and will only execute an expansion when there are no ongoing provisioning operations in the target data center. This ability to execute only when it’s safe to do so is to ensure that the recovery operation will not interfere with any other ongoing operations in the data center. We’ve also adjusted its tolerance with faulty hardware – this means it’s able to gracefully deal with misbehaving servers by letting these quickly drop out of the recovery candidate list upon misbehavior that prevents blocking the operation.

Visibility

While our autonomous system, Phoenix, seamlessly handles operations without human intervention, it doesn’t mean we sacrifice visibility. Transparency is a key feature of Phoenix. It meticulously logs every operation, from executing tasks to providing progress updates, and shares this information in communication channels like chat rooms and Jira tickets. This ensures a clear understanding of what Phoenix is doing at all times.

Tracking of actions taken by automation as well as the state transitions of a server keeps us in the loop and gives us a better understanding of what these actions were and when they were executed, essentially giving us valuable insights that will help us improve not only the system but our processes as well. Having this operational data allows us to generate dashboards that let various teams monitor automation activities and measure their success. We are able to generate dashboards to guide business decisions and even answer common operational questions related to repair and recovery.

Balancing automation and empathy: Error Budgets

When we launched Phoenix, we were well aware that not every broken server can be re-enabled and successfully returned to production, and more importantly, there’s no 100% guarantee that a recovered server will be as stable as the ones with no repair history – there’s a risk that these servers could fail and end up back in Repair status again.

Although there’s no guarantee that these recovered servers won’t fail again, causing additional work for SRE’s due to the monitoring alerts that get triggered, what we can guarantee is that Phoenix immediately stops recoveries without any human intervention if a certain number of failures for a server are reached in a given time window – this is where we applied the concept of an Error Budget.

The Error Budget is the amount of error that automation can accumulate over a certain period of time before our SRE’s start being unhappy due to the excessive server failures or unreliability of the system. It is empathy embedded in automation.

In the figure above, the y-axis represents the error budget. In this context, the error budget applies to the number of recovered servers that failed and were moved back to Repair state again. The x-axis represents the time unit allocated to the error budget – in this case, 24 hours. To ensure that Phoenix is strict enough in mitigating possible issues, we divide the time unit into three consecutive buckets of the same duration – representing the three “follow the sun” SRE shifts in a day. With this, Phoenix can only execute recoveries if the number of server failures is no more than 2. Additionally, Phoenix will also have to compensate succeeding time buckets by deducting the error budget of any excess failures in a given time bucket.

Phoenix will immediately stop recoveries if it exhausts its error budget prematurely. In this context, prematurely means before the end of the time unit for which the error budget was granted. Regardless of the error budget depletion rate within a time unit, the error budget is fully replenished at the beginning of each time unit, meaning the budget resets every day.

The Error Budget has helped us define and manage our tolerance for hardware failures without causing significant harm to the system or too much noise for SREs, and gave us opportunities to improve our diagnostics system. It provides a common incentive that allows both the Infrastructure Engineering and SRE teams to focus on finding the right balance between innovation and reliability.

Where we go from here

With Phoenix, we’ve not only witnessed the significant and far-reaching potential of having an autonomous automated system in our infrastructure, we’re actually reaping its benefits as well. It provides a win-win situation by successfully recovering hardware and ensuring that broken devices are powered off, thus preventing them from consuming unnecessary power while being idle in our racks. This not only reduces energy wastage but also contributes to sustainability efforts and cost savings. Automated processes that operate independently have not only freed our colleagues on various Infrastructure teams from doing mundane and repetitive tasks, allowing them to focus more on areas where they can use their skill sets for more interesting and productive work, but have also led us to evolving our old processes for handling hardware failures and repairs, making us much more efficient than ever.

Autonomous automation is a reality that is now beginning to shape the future of how we are building better and smarter systems here at Cloudflare, and we will continue to invest engineering time for these initiatives.

A huge thank you to Elvin Tan for his awesome work on INAT, and to Graeme, Darrel and David for INAT’s continuous improvements.

The Next Step in Personalization: Dynamic Sizzles

Post Syndicated from Netflix Technology Blog original https://netflixtechblog.com/the-next-step-in-personalization-dynamic-sizzles-4dc4ce2011ef

Authors:Bruce Wobbe, Leticia Kwok

Additional Credits:Sanford Holsapple, Eugene Lok, Jeremy Kelly

Introduction

At Netflix, we strive to give our members an excellent personalized experience, helping them make the most successful and satisfying selections from our thousands of titles. We already personalize artwork and trailers, but we hadn’t yet personalized sizzle reels — until now.

A sizzle reel is a montage of video clips from different titles strung together into a seamless A/V asset that gets members excited about upcoming launches (for example, our Emmys nominations or holiday collections). Now Netflix can create a personalized sizzle reel dynamically in real time and on demand. The order of the clips and included titles are personalized per member, giving each a unique and effective experience. These new personalized reels are called Dynamic Sizzles.

In this post, we will dive into the exciting details of how we create Dynamic Sizzles with minimal human intervention, including the challenges we faced and the solutions we developed.

An example of a Dynamic Sizzle created for Chuseok, the Korean mid-autumn harvest festival collection.

Overview

In the past, each sizzle reel was created manually. The time and cost of doing this prevents scaling and misses the invaluable benefit of personalization, which is a bedrock principle at Netflix. We wanted to figure out how to efficiently scale sizzle reel production, while also incorporating personalization — all in an effort to yield greater engagement and enjoyment for our members.

Enter the creation of Dynamic Sizzles. We developed a systems-based approach that uses our interactive and creative technology to programmatically stitch together multiple video clips alongside a synced audio track. The process involves compiling personalized multi-title/multi-talent promotional A/V assets on the fly into a Mega Asset. A Mega Asset is a large A/V asset made up of video clips from various titles, acting as a library from which the Dynamic Sizzle pulls media. These clips are then used to construct a personalized Dynamic Sizzle according to a predefined cadence.

With Dynamic Sizzles, we can utilize more focused creative work from editors and generate a multitude of personalized sizzle reels efficiently and effectively — up to 70% in terms of time and cost savings than a manually created one. This gives us the ability to create thousands, if not millions, of combinations of video clips and assets that result in optimized and personalized sizzle reel experiences for Netflix members.

Creating the Mega Asset

Where To Begin

Our first challenge was figuring out how to create the Mega Asset, as each video clip needs to be precise in its selection and positioning. A Mega Asset can contain any number of clips, and millions of unique Dynamic Sizzles can be produced from a single Mega Asset.

We accomplished this by using human editors to select the clips — ensuring that they are well-defined from both a creative and technical standpoint — then laying them out in a specific known order in a timeline. We also need each clip marked with an index to its location — an extremely tedious and time consuming process for an editor. To solve this, we created an Adobe Premiere plug-in to automate the process. Further verifications can also be done programmatically via ingestion of the timecode data, as we can validate the structure of the Mega Asset by looking at the timecodes.

An example of a title’s video clips layout.

The above layout shows how a single title’s clips are ordered in a Mega Asset and in 3 different lengths: 160, 80 and 40 frame rates. Each clip should be unique per title; however, when using multiple titles, they may share the same frame rate. This gives us more variety to choose from while maintaining a structured order in the layout.

Cadence

The cadence is a predetermined collection of clip lengths that indicates when, where, and for how long a title shows within a Dynamic Sizzle. The cadence ensures that when a Dynamic Sizzle is played, it will show a balanced view of any titles chosen, while still giving more time to a member’s higher ranked titles. Cadence is something we can personalize or randomize, and will continue to evolve as needed.

Sample Cadence

In the above sample cadence, Title A refers to the highest ranked title in a member’s personalized sort, Title B the second highest, and so on. The cadence is made up of 3 distinct segments with 5 chosen titles (A-E) played in sequence using various clip lengths. Each clip in the cadence refers to a different clip in the Mega Asset. For example, the 80 frame clip for title A in the first (red) segment is different from the 80 frame clip for title A in the third (purple) segment.

Composing the Dynamic Sizzle

Personalization

When a request comes in for a sizzle reel, our system determines what titles are in the Mega Asset and based on the request, a personalized list of titles is created and sorted. The top titles for a member are then used to construct the Dynamic Sizzle by leveraging the clips in the Mega Asset. Higher ranked titles get more weight in placement and allotted time.

Finding Timecodes

For the Dynamic Sizzle process, we have to quickly and dynamically determine the timecodes for each clip in the Mega Asset and make sure they are easily accessed at runtime. We accomplish this by utilizing Netflix’s Hollow technology. Hollow allows us to store timecodes for quick searches and use timecodes as a map — a key can be used to find the timecodes needed as defined by the cadence. The key can be as simple as titleId-clip-1.

Building The Reel

The ordering of the clips are set by the predefined cadence, which dictates the final layout and helps easily build the Dynamic Sizzle. For example, if the system knows to use title 17 within the Mega Asset, we can easily calculate the time offset for all the clips because of the known ordering of the titles and clips within the Mega Asset. This all comes together in the following way:

The result is a series of timecodes indicating the start and stop times for each clip. These codes appear in the order they should be played and the player uses them to construct a seamless video experience as seen in the examples below:

The Beautiful Game Sizzle
The Beautiful Game Dynamic Sizzle

With Dynamic Sizzles, each member experiences a personalized sizzle reel.

Example of what 2 different profiles might see for the same sizzle

Playing the Dynamic Sizzle

Delivering To The Player

The player leverages the Mega Asset by using timecodes to know where to start and stop each clip, and then seamlessly plays each one right after the other. This required a change in the API that devices normally use to get trailers. The API change was twofold. First, on the request we need the device to indicate that it can support Dynamic Sizzles. Second, on the response the timecode list needs to be sent. (Changing the API and rolling it out took time, so this all had to be implemented before Dynamic Sizzles could actually be used, tested, and productized.)

Challenges With The Player

There were two main challenges with the player. First, in order to support features like background music across multiple unique video segments, we needed to support asymmetrical segment streaming from discontiguous locations in the Mega Asset. This involved modifying existing schemas and adding corresponding support to the player to allow for the stitching of the video and audio together separately while still keeping the timecodes in sync. Second, we needed to optimize our streaming algorithms to account for these much shorter segments, as some of our previous assumptions were incorrect when dealing with dozens of discontiguous tiny segments in the asset.

Building Great Things Together

We are just getting started on this journey to build truly great experiences. While the challenges may seem endless, the work is incredibly fulfilling. The core to bringing these great engineering solutions to life is the direct collaboration we have with our colleagues and innovating together to solve these challenges.

If you are interested in working on great technology like Dynamic Sizzles, we’d love to talk to you! We are hiring: jobs.netflix.com


The Next Step in Personalization: Dynamic Sizzles was originally published in Netflix TechBlog on Medium, where people are continuing the conversation by highlighting and responding to this story.

How to communicate like a GitHub engineer: our principles, practices, and tools

Post Syndicated from Ben Balter original https://github.blog/engineering/engineering-principles/how-to-communicate-like-a-github-engineer-our-principles-practices-and-tools/

As a company that’s been remote-first since day one, GitHub Engineering has learned a lot about how to communicate effectively across time zones, teams, and tools. We’ve distilled our experience into a set of guidelines that we call “How we communicate,” and we’re sharing them with you today. We hope that by sharing our communication practices publicly, we can help other organizations that are embracing remote work or want to improve their collaboration culture.

Read on to learn more about how we use GitHub to build GitHub, how we turned our guiding communications principles into prescriptive practices to manage our internal communications signal-to-noise ratio, and how you can contribute to the ongoing conversation.

Using GitHub to build GitHub

Unlike many companies that made the transition to remote work during the pandemic, GitHub has been majority remote since its founding 15 years ago. GitHub’s remote-first communication style originally drew inspiration from the open source community. Open source development rarely requires the global community of collaborators and contributors to be in a certain place, at a certain time, in order to participate in the ongoing conversation. This is the same approach GitHub Engineering takes to our own internal communication. We believe that asynchronous communication is the best way to work globally and at scale, and as a result, we’ve built our culture around it.

We’ve always used GitHub to build GitHub. GitHub is not only the place where we host and review code, but also where we plan, discuss, and document our work. We use issues, pull requests, projects, and discussions to track work, collaborate on features, and share information across teams. Many of these communications patterns grew organically, as developers adopted practices from the open source community for our own internal collaboration needs. We believe open practices are the best way to work with a global and diverse team, and to make decisions that are informed, inclusive, and scalable.

While asynchronous collaboration is deeply embedded in GitHub’s DNA, we have also long had a culture of each team enjoying a great deal of autonomy in deciding how they communicate day to day. This freedom has allowed teams to experiment and uncover novel practices, but it has also meant that working across teams previously required first negotiating a meta-conversation around how to communicate before any substantive work could occur–much like a new open source project negotiating with its newfound community. Having an open set of shared expectations within the engineering organization allows us to be more effective, mindful, and inclusive about how and where we communicate, leading us to make more well-informed decisions in a way that takes into account different needs, preferences, and time zones.

“How we communicate”

To define this set of shared expectations, the GitHub Engineering Operations and Culture team collaborated with more than 100 people across the engineering organization in the first half of 2023 to create guidance on “How we communicate.” This document was intended to encourage consistency over preference by outlining a common core of shared internal communication practices for all of GitHub Engineering in the form of opinionated guidance. Teams are still encouraged to adapt the practices for their unique circumstances, while maintaining a common “API” to interface with other teams.

Today, we are publishing our “How we communicate” guidance under a CC-BY-4.0 license, in the hopes that you’ll find it useful, especially if you’re evolving your own remote-first or remote-friendly culture; we welcome you to fork, modify, and use the documentation with attribution. We expect our guidance (lightly edited for the community, primarily to remove internal URLs and references) will evolve over time along with our organization, and, of course, pull requests are always welcome.

From guiding principles to prescriptive practices

To begin with our “How we communicate” guidance, we established eight guiding principles:

  • Be asynchronous first.
  • Write things down.
  • Make work visible and overcommunicate.
  • Prefer GitHub tools and workflows.
  • Embrace collaboration.
  • Foster a culture that values documentation maintenance.
  • Communicate openly, honestly, and authentically.
  • Remember, practicality beats purity.

From there, we began to define the specific practices that would help us live up to these principles. We started with the most common forms of communication, such as chat, discussions, issues, project boards, and pull requests, and went on to collaboratively author suggestions on how to manage notifications, run effective meetings, and schedule more inclusively.

Managing the signal-to-noise ratio

With well over 1,500 engineers across a number of functions, we faced a challenge not unique to any organization: how to keep everyone informed and engaged without overwhelming them with notifications. We wanted to create a system that allowed everyone to opt-in, rather than opt-out, and to get the information they needed in a digestible and skimmable way. As it was, either you got everything (which we jokingly referred to as the “fire hose” of notifications), or you opted out entirely (and ignored everything). Either way, Hubbers were likely to miss important information. We set out to create a system that minimized notification fatigue, while allowing people to subscribe to the topics they cared about.

We rely on GitHub Discussions heavily to share information within and across teams. It’s a natural choice, since engineers are already working on GitHub.com, and with things like comments, upvotes, and emoji reactions, discussions are a great way to start an asynchronous conversation on just about any topic.

Opt-in

To start, we encouraged teams to begin posting their discussions to the most logical repository, instead of directly to the main github/engineering repository. (For example, if a post was about GitHub Copilot, it should go in the github/copilot repository; if it was about GitHub Actions, it should go in the github/actions repository.) That way, those interested could subscribe to the repositories they cared about, and get email or web notifications when new discussions were posted. And the volume of notifications coming through github/engineering to the whole organization would be reduced.

Amplify widely

But some posts are rightfully intended for all of GitHub Engineering. Things like staff ships (early access to new features for staff), required actions, promotions, and updates to Engineering priorities are written with a broad audience in mind. To ensure we were still surfacing the most important information to the organization, we established a small set of “magic labels” that if applied to a post, would add it to a daily content roundup, automatically amplify the message in various places for all of GitHub Engineering to see.

For a peek at our taxonomy, here’s an excerpt from our GitHub Actions workflow that makes it easy for everyone to add the set of “magic labels” to their repositories:

label:
          - name: eng-action-required
            description: Upcoming process/workflow changes/activities requiring Engineering Hubbers to take action
          - name: eng-availability
            description: Discussions about availability, incident response, et al
          - name: eng-celebrations
            description: Celebrating Hubber promotions and other amazingness
          - name: eng-feedback-request
            description: Posts requesting feedback from the Engineering organization
          - name: eng-org-change
            description: Announcements related to organizational changes
          - name: eng-priorities
            description: Discussions related to Engineering priorities
          - name: eng-roundup
            description: Newsletters, weekly digests, and other content and team roundups
          - name: eng-show-and-tell
            description: Share what you've learned or show off something you've made
          - name: eng-staff-ship
            description: Announcements for features made available to Hubbers for feedback and early access
          - name: eng-strategy
            description: Discussions related to strategy and vision

Automate all the things!

We used GitHub Actions to schedule a workflow to automatically create daily and weekly roundups of activity across the organization based on those “magic labels,” posting the digests as discussion posts in the github/engineering repository.

Screenshot of the GitHub Actions workflow in the eng-ops-automations repository that creates roundups of activity based on labels and posts them as discussions in the github/engineering repository.

Like any other discussion post, these content roundups trigger web and email notifications from GitHub.com, and they’re also amplified in Slack channels. However, rather than receiving multiple notifications a day, these roundups reduce the daily notification to one (and also make it much easier to catch up on everything that happens while you’re out of the office!). To support the needs of those who prefer receiving notifications for every discussion post individually, rather than waiting for a daily roundup (aka to instead “drink from the fire hose”), we created an #engineering-discussions-firehose Slack channel, which streams every labeled post as it is posted.

Experiment with AI

With notifications reduced in our main github/engineering repository and discussions being posted in more logical repositories, enabling people to subscribe to more frequent notifications for specific topics, the last remaining step was to increase quick skimmability to allow for greater situational awareness without anyone having to spend all day reading teams’ discussion posts.

As part of our writing style, most of us include TL;DRs at the top of posts (internet slang for “too long, didn’t read,” a short summary of longer writing), but not every post author includes one. For posts that don’t have a human-authored TL;DR, we use Azure’s OpenAI service to draft a brief summary for us. That way, readers can quickly skim the daily digest (or fire hose) and decide if they want to click through to read more.

Here’s an excerpt of the prompt we use to summarize discussion posts:

// OpenAI
export const encodingModel = "gpt-3.5-turbo";
export const openaiModel = "gpt-35-turbo";
export const openaiPrompt = `
  The following is an internal discussion post from the engineering department at GitHub formatted in GitHub flavored Markdown. Please write a short summary appropriate for inclusion in a digest of internal discussion posts with the following requirements:

  - The summary should be no more than 3 sentences
  - The summary should focus on the most important and impactful information from the post, including key points and any calls to action
  - The summary should be detailed, thorough, to-the-point, and written for a technical audience, while maintaining clarity and conciseness
  - The communications style should be professional, but informal
  - The summary should use emoji where appropriate, but use emoji sparingly
  - The summary should be formatted in GitHub Flavored Markdown with no line breaks
  - DO NOT use the phrases "the engineering department" or "at GitHub"; instead, whenever possible, name the specific team in reference, or else use "we" to refer to the team or engineering department. For example, use, "We recently shipped a feature", and NOT, "The engineering department at GitHub recently shipped a feature".
  - Employees at GitHub are referred to as "Hubbers"
  - GitHub is ALWAYS capitalized as "GitHub", never "Github"
  - Teams are referred to as "the Actions team" or "the Copilot team", never just "actions team" or "copilot team"
`;

export const estimatedPromptTokens = 300;
export const completionTokens = 300;

Ironically, we relied heavily on GitHub Copilot to build the GitHub Actions workflow (it’s been a while since these Hubbers have written “production-worthy” code), meaning robots helped humans to teach robots how to summarize the work of humans, which other robots then published out to other humans. 🤖 Summarization is a core workflow for AI, and so far, while it’s not always perfect, it’s been working well. If you’re interested in the prompt we’re using (or want to help us improve it!), you can find it here.

Let’s build from here

We’re excited to share our “How we communicate” guidance with you, and we hope that it will inspire you to adopt or improve some of the practices we’ve found useful. Here are some suggestions to get you started:

  • Principles: Establish a set of guiding principles for your organization’s internal communications (fork and clone our guidelines for a head start!). What core values do you want to promote, and how can you ensure everyone is aligned around those values so there’s a common “API” across teams?
  • Practices: Use those principles to develop practices. What specific practices can you adopt to help you live up to your principles, and how can you ensure those practices are adopted across the organization?
  • Experimentations: Experiment with automation and emerging technologies to improve your practices. How can you use AI and other tools (like GitHub Actions) to automate your workflows and improve the signal-to-noise ratio?

We recognize communication is an ongoing and evolving process, and different teams and cultures may have different needs and preferences. We welcome your feedback, suggestions, and contributions to our public repository: https://github.com/github/how-engineering-communicates

Happy communicating! 🎉

The post How to communicate like a GitHub engineer: our principles, practices, and tools appeared first on The GitHub Blog.

Perform continuous vulnerability scanning of AWS Lambda functions with Amazon Inspector

Post Syndicated from Manjunath Arakere original https://aws.amazon.com/blogs/security/perform-continuous-vulnerability-scanning-of-aws-lambda-functions-with-amazon-inspector/

This blog post demonstrates how you can activate Amazon Inspector within one or more AWS accounts and be notified when a vulnerability is detected in an AWS Lambda function.

Amazon Inspector is an automated vulnerability management service that continually scans workloads for software vulnerabilities and unintended network exposure. Amazon Inspector scans mixed workloads like Amazon Elastic Compute Cloud (Amazon EC2) instances and container images located in Amazon Elastic Container Registry (Amazon ECR). At re:Invent 2022, we announced Amazon Inspector support for Lambda functions and Lambda layers to provide a consolidated solution for compute types.

Only scanning your functions for vulnerabilities before deployment might not be enough since vulnerabilities can appear at any time, like the widespread Apache Log4j vulnerability. So it’s essential that workloads are continuously monitored and rescanned in near real time as new vulnerabilities are published or workloads are changed.

Amazon Inspector scans are intelligently initiated based on the updates to Lambda functions or when new Common Vulnerabilities and Exposures (CVEs) are published that are relevant to your function. No agents are needed for Amazon Inspector to work, which means you don’t need to install a library or agent in your Lambda functions or layers. When Amazon Inspector discovers a software vulnerability or network configuration issue, it creates a finding which describes the vulnerability, identifies the affected resource, rates the severity of the vulnerability, and provides remediation guidance.

In addition, Amazon Inspector integrates with several AWS services, such as Amazon EventBridge and AWS Security Hub. You can use EventBridge to build automation workflows like getting notified for a specific vulnerability finding or performing an automatic remediation with the help of Lambda or AWS Systems Manager.

In this blog post, you will learn how to do the following:

  1. Activate Amazon Inspector in a single AWS account and AWS Region.
  2. See how Amazon Inspector automated discovery and continuous vulnerability scanning works by deploying a new Lambda function with a vulnerable package dependency.
  3. Receive a near real-time notification when a vulnerability with a specific severity is detected in a Lambda function with the help of EventBridge and Amazon Simple Notification Service (Amazon SNS).
  4. Remediate the vulnerability by using the recommendation provided in the Amazon Inspector dashboard.
  5. Activate Amazon Inspector in multiple accounts or Regions through AWS Organizations.

Solution architecture

Figure 1 shows the AWS services used in the solution and how they are integrated.

Figure 1: Solution architecture overview

Figure 1: Solution architecture overview

The workflow for the solution is as follows:

  1. Deploy a new Lambda function by using the AWS Serverless Application Model (AWS SAM).
  2. Amazon Inspector scans when a new vulnerability is published or when an update to an existing Lambda function or a new Lambda function is deployed. Vulnerabilities are identified in the deployed Lambda function.
  3. Amazon EventBridge receives the events from Amazon Inspector and checks against the rules for specific events or filter conditions.
  4. In this case, an EventBridge rule exists for the Amazon Inspector findings, and the target is defined as an SNS topic to send an email to the system operations team.
  5. The EventBridge rule invokes the target SNS topic with the event data, and an email is sent to the confirmed subscribers in the SNS topic.
  6. The system operations team receives an email with detailed information on the vulnerability, the fixed package versions, the Amazon Inspector score to prioritize, and the impacted Lambda functions. By using the remediation information from Amazon Inspector, the team can now prioritize actions and remediate.

Prerequisites

To follow along with this demo, we recommend that you have the following in place:

  • An AWS account.
  • A command line interface: AWS CloudShell or AWS CLI. In this post, we recommend the use of CloudShell because it already has Python and AWS SAM. However, you can also use your CLI with AWS CLI, SAM, and Python.
  • An AWS Region where Amazon Inspector Lambda code scanning is available.
  • An IAM role in that account with administrator privileges.

The solution in this post includes the following AWS services: Amazon Inspector, AWS Lambda, Amazon EventBridge, AWS Identity and Access Management (IAM), Amazon SNS, AWS CloudShell and AWS Organizations for activating Amazon Inspector at scale (multi-accounts).

Step 1: Activate Amazon Inspector in a single account in the Region

The first step is to activate Amazon Inspector in your account in the Region you are using.

To activate Amazon Inspector

  1. Sign in to the AWS Management Console.
  2. Open AWS CloudShell. CloudShell inherits the credentials and permissions of the IAM principal who is signed in to the AWS Management Console. CloudShell comes with the CLIs and runtimes that are needed for this demo (AWS CLI, AWS SAM, and Python).
  3. Use the following command in CloudShell to get the status of the Amazon Inspector activation.
    aws inspector2 batch-get-account-status

  4. Use the following command to activate Inspector in the default Region for resource type LAMBDA. Other allowed values for resource types are EC2, ECR and LAMDA_CODE.
    aws inspector2 enable --resource-types '["LAMBDA"]'

  5. Use the following command to verify the status of the Amazon Inspector activation.
    aws inspector2 batch-get-account-status

You should see a response that shows that Amazon Inspector is enabled for Lambda resources, as shown in Figure 2.

Figure 2: Amazon Inspector status after you enable Lambda scanning

Figure 2: Amazon Inspector status after you enable Lambda scanning

Step 2: Create an SNS topic and subscription for notification

Next, create the SNS topic and the subscription so that you will be notified of each new Amazon Inspector finding.

To create the SNS topic and subscription

  1. Use the following command in CloudShell to create the SNS topic and its subscription and replace <REGION_NAME>, <AWS_ACCOUNTID> and <[email protected]> by the relevant values.
    aws sns create-topic --name amazon-inspector-findings-notifier; 
    
    aws sns subscribe \
    --topic-arn arn:aws:sns:<REGION_NAME>:<AWS_ACCOUNTID>:amazon-inspector-findings-notifier \
    --protocol email --notification-endpoint <[email protected]>

  2. Check the email inbox you entered for <[email protected]>, and in the email from Amazon SNS, choose Confirm subscription.
  3. In the CloudShell console, use the following command to list the subscriptions, to verify the topic and email subscription.
    aws sns list-subscriptions

    You should see a response that shows subscription details like the email address and ARN, as shown in Figure 3.

    Figure 3: Subscribed email address and SNS topic

    Figure 3: Subscribed email address and SNS topic

  4. Use the following command to send a test message to your subscribed email and verify that you receive the message by replacing <REGION_NAME> and <AWS_ACCOUNTID>.
    aws sns publish \
        --topic-arn "arn:aws:sns:<REGION_NAME>:<AWS_ACCOUNTID>:amazon-inspector-findings-notifier" \
        --message "Hello from Amazon Inspector2"

Step 3: Set up Amazon EventBridge with a custom rule and the SNS topic as target

Create an EventBridge rule that will invoke your previously created SNS topic whenever Amazon Inspector finds a new vulnerability with a critical severity.

To set up the EventBridge custom rule

  1. In the CloudShell console, use the following command to create an EventBridge rule named amazon-inspector-findings with filters InspectorScore greater than 8 and severity state set to CRITICAL.
    aws events put-rule \
        --name "amazon-inspector-findings" \
        --event-pattern "{\"source\": [\"aws.inspector2\"],\"detail-type\": [\"Inspector2 Finding\"],\"detail\": {\"inspectorScore\": [ { \"numeric\": [ \">\", 8] } ],\"severity\": [\"CRITICAL\"]}}"

    Refer to the topic Amazon EventBridge event schema for Amazon Inspector events to customize the event pattern for your application needs.

  2. To verify the rule creation, go to the EventBridge console and in the left navigation bar, choose Rules.
  3. Choose the rule with the name amazon-inspector-findings. You should see the event pattern as shown in Figure 4.
    Figure 4: Event pattern for the EventBridge rule to filter on CRITICAL vulnerabilities.

    Figure 4: Event pattern for the EventBridge rule to filter on CRITICAL vulnerabilities.

  4. Add the SNS topic you previously created as the target to the EventBridge rule. Replace <REGION_NAME>, <AWS_ACCOUNTID>, and <RANDOM-UNIQUE-IDENTIFIER-VALUE> with the relevant values. For RANDOM-UNIQUE-IDENTIFIER-VALUE, create a memorable and unique string.
    aws events put-targets \
        --rule amazon-inspector-findings \
        --targets "Id"="<RANDOM-UNIQUE-IDENTIFIER-VALUE>","Arn"="arn:aws:sns:<REGION_NAME>:<AWS_ACCOUNTID>:amazon-inspector-findings-notifier"

    Important: Save the target ID. You will need this in order to delete the target in the last step.

  5. Provide permission to enable Amazon EventBridge to publish to SNS topic amazon-inspector-findings-notifier
    aws sns set-topic-attributes --topic-arn "arn:aws:sns:<REGION_NAME>:<AWS_ACCOUNTID>:amazon-inspector-findings-notifier" \
    --attribute-name Policy \
    --attribute-value "{\"Version\":\"2012-10-17\",\"Id\":\"__default_policy_ID\",\"Statement\":[{\"Sid\":\"PublishEventsToMyTopic\",\"Effect\":\"Allow\",\"Principal\":{\"Service\":\"events.amazonaws.com\"},\"Action\":\"sns:Publish\",\"Resource\":\"arn:aws:sns:<REGION_NAME>:<AWS_ACCOUNTID>:amazon-inspector-findings-notifier\"}]}"

Step 4: Deploy the Lambda function to the AWS account by using AWS SAM

In this step, you will use Serverless Application Manager (SAM) quick state templates to build and deploy a Lambda function with a vulnerable library, in order to generate findings. Learn more about AWS SAM.

To deploy the Lambda function with a vulnerable library

  1. In the CloudShell console, use a prebuilt “hello-world” AWS SAM template to deploy the Lambda function.
    sam init --runtime python3.7 --dependency-manager pip --app-template hello-world --name sam-app

  2. Use the following command to add the vulnerable package python-jwt==3.3.3 to the Lambda function.
    cd sam-app;
    echo -e 'requests\npython-jwt==3.3.3' > hello_world/requirements.txt

  3. Use the following command to build the application.
    sam build

  4. Use the following command to deploy the application with the guided option.
    sam deploy --guided

    This command packages and deploys the application to your AWS account. It provides a series of prompts. You may respond to the prompts with the:

    1. Stack name you want
    2. Set the default options, except for the
      1. HelloWorldFunction may not have authorization defined, Is this okay? [y/N]: prompt. Here, input y and press Enter and
      2. Deploy this changeset? [y/N]: prompt. Here, input y and press Enter.

Step 5: View Amazon Inspector findings

Amazon Inspector will automatically generate findings when scanning the Lambda function previously deployed. To view those findings, follow the steps below.

To view Amazon Inspector findings for the vulnerability

  1. Navigate to the Amazon Inspector console.
  2. In the left navigation menu, choose All findings to see all of the Active findings, as shown in Figure 5.

    Due to the custom event pattern rule in Amazon EventBridge, even though there are multiple findings for the vulnerable package python-jwt==3.3.3, you will be notified only for the finding that has InspectorScore greater than 8 and severity CRITICAL.

  3. Choose the title of each finding to see detailed information about the vulnerability.
    Figure 5: Example of findings from the Amazon Inspector console

    Figure 5: Example of findings from the Amazon Inspector console

Step 6: Remediate the vulnerability by applying the fixed package version

Now you can remediate the vulnerability by updating the package version as suggested by Amazon Inspector.

To remediate the vulnerability

  1. In the Amazon Inspector console, in the left navigation menu, choose All Findings.
  2. Choose the title of the vulnerability to see the finding details and the remediation recommendations.
    Figure 6: Amazon Inspector finding for python-jwt, with the associated remediation

    Figure 6: Amazon Inspector finding for python-jwt, with the associated remediation

  3. To remediate, use the following command to update the package version to the fixed version as suggested by Amazon Inspector.
    cd /home/cloudshell-user/sam-app;
    echo -e "requests\npython-jwt==3.3.4" > hello_world/requirements.txt

  4. Use the following command to build the application.
    sam build

  5. Use the following command to deploy the application with the guided option.
    sam deploy --guided

    This command packages and deploys the application to your AWS account. It provides a series of prompts. You may respond to the prompts with the

    1. Stack name you want
    2. Set the default options, except for the
      1. HelloWorldFunction may not have authorization defined, Is this okay? [y/N]: prompt. Here, input y and press Enter and
      2. Deploy this changeset? [y/N]: prompt. Here, input y and press Enter.
  6. Amazon Inspector automatically rescans the function after its deployment and reevaluates the findings. At this point, you can navigate back to the Amazon Inspector console, and in the left navigation menu, choose All findings. In the Findings area, you can see that the vulnerabilities are moved from Active to Closed status.

    Due to the custom event pattern rule in Amazon EventBridge, you will be notified by email with finding status as CLOSED.

    Figure 7: Inspector rescan results, showing no open findings after remediation

    Figure 7: Inspector rescan results, showing no open findings after remediation

(Optional) Step 7: Activate Amazon Inspector in multiple accounts and Regions

To benefit from Amazon Inspector scanning capabilities across the accounts that you have in AWS Organizations and in your selected Regions, use the following steps:

To activate Amazon Inspector in multiple accounts and Regions

  1. In the CloudShell console, use the following command to clone the code from the aws-samples inspector2-enablement-with-cli GitHub repo.
    cd /home/cloudshell-user;
    git clone https://github.com/aws-samples/inspector2-enablement-with-cli.git;
    cd inspector2-enablement-with-cli

  2. Follow the instructions from the README.md file.
  3. Configure the file param_inspector2.json with the relevant values, as follows:
    • inspector2_da: The delegated administrator account ID for Amazon Inspector to manage member accounts.
    • scanning_type: The resource types (EC2, ECR, LAMBDA) to be enabled by Amazon Inspector.
    • auto_enable: The resource types to be enabled on every account that is newly attached to the delegated administrator.
    • regions: Because Amazon Inspector is a regional service, provide the list of AWS Regions to enable.
  4. Select the AWS account that would be used as the delegated administrator account (<DA_ACCOUNT_ID>).
  5. Delegate an account as the admin for Amazon Inspector by using the following command.
    ./inspector2_enablement_with_awscli.sh -a delegate_admin -da <DA_ACCOUNT_ID>

  6. Activate the delegated admin by using the following command:
    ./inspector2_enablement_with_awscli.sh -a activate -t <DA_ACCOUNT_ID> -s all

  7. Associate the member accounts by using the following command:
    ./inspector2_enablement_with_awscli.sh -a associate -t members

  8. Wait five minutes.
  9. Enable the resource types (EC2, ECR, LAMBDA) on your member accounts by using the following command:
    ./inspector2_enablement_with_awscli.sh -a activate -t members

  10. Enable Amazon Inspector on the new member accounts that are associated with the organization by using the following command:
    ./inspector2_enablement_with_awscli.sh -auto_enable

  11. Check the Amazon Inspector status in your accounts and in multiple selected Regions by using the following command:
    ./inspector2_enablement_with_awscli.sh -a get_status

There are other options you can use to enable Amazon Inspector in multiple accounts, like AWS Control Tower and Terraform. For the reference architecture for Control Tower, see the AWS Security Reference Architecture Examples on GitHub. For more information on the Terraform option, see the Terraform aws_inspector2_enabler resource page.

Step 8: Delete the resources created in the previous steps

AWS offers a 15-day free trial for Amazon Inspector so that you can evaluate the service and estimate its cost.

To avoid potential charges, delete the AWS resources that you created in the previous steps of this solution (Lambda function, EventBridge target, EventBridge rule, and SNS topic), and deactivate Amazon Inspector.

To delete resources

  1. In the CloudShell console, enter the sam-app folder.
    cd /home/cloudshell-user/sam-app

  2. Delete the Lambda function and confirm by typing “y” when prompted for confirmation.
    sam delete

  3. Remove the SNS target from the Amazon EventBridge rule.
    aws events remove-targets --rule "amazon-inspector-findings" --ids <RANDOM-UNIQUE-IDENTIFIER-VALUE>

    Note: If you don’t remember the target ID, navigate to the Amazon EventBridge console, and in the left navigation menu, choose Rules. Select the rule that you want to delete. Choose CloudFormation, and copy the ID.

  4. Delete the EventBridge rule.
    aws events delete-rule --name amazon-inspector-findings

  5. Delete the SNS topic.
    aws sns delete-topic --topic-arn arn:aws:sns:<REGION_NAME>:<AWS_ACCOUNTID>:amazon-inspector-findings-notifier

  6. Disable Amazon Inspector.
    aws inspector2 disable --resource-types '["LAMBDA"]'

    Follow the new few steps to roll back changes only if you have performed the activities listed in Step 7: Activate Amazon Inspector in multiple accounts and Regions.

  7. In the CloudShell console, enter the folder inspector2-enablement-with-cli.
    cd /home/cloudshell-user/inspector2-enablement-with-cli

  8. Deactivate the resource types (EC2, ECR, LAMBDA) on your member accounts.
    ./inspector2_enablement_with_awscli.sh -a deactivate -t members -s all

  9. Disassociate the member accounts.
    ./inspector2_enablement_with_awscli.sh -a disassociate -t members

  10. Deactivate the delegated admin account.
    ./inspector2_enablement_with_awscli.sh -a deactivate -t <DA_ACCOUNT_ID> -s all

  11. Remove the delegated account as the admin for Amazon Inspector.
    ./inspector2_enablement_with_awscli.sh -a remove_admin -da <DA_ACCOUNT_ID>

Conclusion

In this blog post, we discussed how you can use Amazon Inspector to continuously scan your Lambda functions, and how to configure an Amazon EventBridge rule and SNS to send out notification of Lambda function vulnerabilities in near real time. You can then perform remediation activities by using AWS Lambda or AWS Systems Manager. We also showed how to enable Amazon Inspector at scale, activating in both single and multiple accounts, in default and multiple Regions.

As of the writing this post, a new feature to perform code scans for Lambda functions is available. Amazon Inspector can now also scan the custom application code within a Lambda function for code security vulnerabilities such as injection flaws, data leaks, weak cryptography, or missing encryption, based on AWS security best practices. You can use this additional scanning functionality to further protect your workloads.

If you have feedback about this blog post, submit comments in the Comments section below. If you have question about this blog post, start a new thread on the Amazon Inspector forum or contact AWS Support.

 
Want more AWS Security news? Follow us on Twitter.

Manjunath Arakere

Manjunath Arakere

Manjunath is a Senior Solutions Architect in the Worldwide Public Sector team at AWS. He works with Public Sector partners to design and scale well-architected solutions, and he supports their cloud migrations and application modernization initiatives. Manjunath specializes in migration, modernization and serverless technology.

Stéphanie Mbappe

Stéphanie Mbappe

Stéphanie is a Security Consultant with Amazon Web Services. She delights in assisting her customers at every step of their security journey. Stéphanie enjoys learning, designing new solutions, and sharing her knowledge with others.

Forward Zabbix Events to Event-Driven Ansible and Automate your Workflows

Post Syndicated from Aleksandr Kotsegubov original https://blog.zabbix.com/forward-zabbix-events-to-event-driven-ansible-and-automate-your-workflows/25893/

Zabbix is highly regarded for its ability to integrate with a variety of systems right out of the box. That list of systems has recently been expanded with the addition of Event-Driven Ansible. Bringing Zabbix and Event-Driven Ansible together lets you completely automate your IT processes, with Zabbix being the source of events and Ansible serving as the executor. This article will explore in detail how to send events from Zabbix to Event-Driven Ansible.

What is Event-Driven Ansible?

Currently available in developer preview, Event-Driven Ansible is an event-based automation solution that automatically matches each new event to the conditions you specified. This eliminates routine tasks and lets you spend your time on more important issues. And because it’s a fully automated system, it doesn’t get sick, take lunch breaks, or go on vacation – by working around the clock, it can speed up important IT processes.

Sending an event from Zabbix to Event-Driven Ansible

From the Zabbix side, the implementation is a media type that uses a webhook – a tool that’s already familiar to most users. This solution allows you to take advantage of the flexibility of setting up alerts from Zabbix using actions. This media type is delivered to Zabbix out of the box, and if your installation doesn’t have it, you can import it yourself from our integrations page.

On the Event-Driven Ansible side, the webhook plugin from the ansible.eda standard collection is used. If your system doesn’t have this collection, you can get it by running the following command:

ansible-galaxy collection install ansible.eda

Let’s look at the process of sending events in more detail with the diagram below.

From the Zabbix side:
  1. An event is created in Zabbix.

  2. The Zabbix server checks the created event according to the conditions in the actions. If all the conditions in an action configured to send an event to Event-Driven Ansible are met, the next step (running the operations configured in the action) is executed. 

  3. Sending through the “Event-Driven Ansible” media type is configured as an operation. The address specified by the service user for the “Event-Driven Ansible” media is taken as the destination.

  4. The media type script processes all the information about the event, generates a JSON, and sends it to Event-Driven Ansible.

From the Ansible side:
  1. An event sent from Zabbix arrives at the specified address and port. The webhook plugin listens on this port.

  2. After receiving an event, ansible-rulebook starts checking the conditions in order to find a match between the received event and the set of rules in ansible-rulebook.

  3. If the conditions for any of the rules match the incoming event, then the ansible-rulebook performs the specified action. It can be either a single command or a playbook launch.

Let’s look at the setup process from each side.

Sending events from Zabbix

Setting up sending alerts is described in detail on the Zabbix – Ansible integration page. Here are the basic steps:

  1. Import the media type of the required version if it is not present in your system.

  2. Create a service user. Select “Event-Driven Ansible” as the media and specify the address of your server and the port which the webhook plugin will listen in on as the destination in the format xxx.xxx.xxx.xxx:port. This article will use the value 5001 as the port. This value will still be needed to configure ansible-rulebook.

  3. Configure an action to send notifications. As an operation, specify sending via “Event-Drive Ansible.” Specify the service user created in the previous step as the recipient.

Receiving events in Event-Driven Ansible

First things first – you need to have an eda-server installed. You can find detailed installation and configuration instructions here.

After installing an eda-server, you can make your first ansible-rulebook. To do this, you need to create a file with the “yml” extension. Call it zabbix-test.yml and put the following code in it:

---
- name: Zabbix test rulebook
  hosts: all
  sources:
    - ansible.eda.webhook:
        host: 0.0.0.0
        port: 5001
  rules:
    - name: debug
      condition: event.payload is defined
      action:
        debug:

Ansible-rulebook, as you may have noticed, uses the yaml format. In this case, it has 4 parameters – name, hosts, source, and rules.

Name and Host parameters

The first 2 parameters are typical for Ansible users. The name parameter contains the name of the ansible-rulebook. The hosts parameter specifies which hosts the ansible-rulebook applies to. Hosts are usually listed in the inventory file. You can learn more about the inventory file in the ansible documentation. The most interesting options are source and rules, so let’s take a closer look at them.

Source parameter

The source parameter specifies the origin of events for the ansible-rulebook. In this case, the ansible.eda.webhook plugin is specified as the event source. This means that after the start of the ansible-rulebook, the webhook plugin starts listening in on the port to receive the event. This also means that it needs 2 parameters to work:

  1. Parameter “host” – a value of 0.0.0.0 used to receive events from all addresses.
  2. Parameter “port” – with 5001 as the value. This plugin will accept all incoming messages received on this particular port. The value of the port parameter must match the port you specified when creating the service user in Zabbix.
Rules parameter

The rules parameter contains a set of rules with conditions for matching with an incoming event. If the condition matches the received event, then the action specified in the actions section will be performed. Since this ansible-rulebook is only for reference, it is enough to specify only one rule. For simplicity, you can use event.payload is defined as a condition. This simple condition means that the rule will check for the presence of the “event.payload” field in the incoming event. When you specify debug in the action, ansible-rulebook will show you the full text of the received event. With debug you can also understand which fields will be passed in the event and set the conditions you need.

The name, host, source parameters only affect the event source. In our case, the webhook plugin will always be the event source. Accordingly, these parameters will not change and in all the following examples they will be skipped. As an example, only the value of the rules parameter will be specified.

To start your ansible-rulebook you can use the command:

ansible-rulebook --rulebook /path/to/your/rulebook/zabbix-test.yml –verbose

The line Waiting for events in the output indicates that the ansible-rulebook has successfully loaded and is ready to receive events.

Examples 

Ansible-rulebook provides a wide variety of opportunities for handling incoming events. We will look into some of the possible conditions and scenarios for using ansible-rulebook, but please remember that a more detailed list of all supported conditions and examples can be found on the official documentation page. For a general understanding of the principles of working with ansible-rulebook, please read the documentation.

Let’s see how to build conditions for precise event filtering in more detail with a few examples.

Example #1

You need to run a playbook to change the NGINX configuration at the Berlin office when you receive an event from Zabbix. The host is in three groups:

  1. Linux servers
  2. Web servers
  3. Berlin.

And it has 3 tags:

  1. target: nginx
  2. class: software
  3. component: configuration.

You can see all these parameters in the diagram below:

On the left side you can see a host with configured monitoring. To determine whether an event belongs to a given rule, you will work with two fields – host groups and tags. These parameters will be used to determine whether the event belongs to the required server and configuration. According to the diagram, all event data is sent to the media type script to generate and send JSON. On the Ansible side, the webhook receives an event with JSON from Zabbix and passes it to the ansible-rulebook to check the conditions. If the event matches all the conditions, the ansible-rulebook starts the specified action. In this case, it’s the start of the playbook.

In accordance with the specified settings for host groups and tags, the event will contain information as in the block below. However, only two fields from the output are needed – “host_groups” and “event_tags.”

{
    ...,
    "host_groups": [
        "Berlin",
        "Linux servers",
        "Web servers"],
    "event_tags": {
        "class": ["os"],
        "component": ["configuration"],
        "target": ["nginx"]},
    ...
}
Search by host groups

First, you need to determine that the host is a web server. You can understand this by the presence of the “Web servers” group in the host in the diagram above. The second point that you can determine according to the scheme is that the host also has the group “Berlin” and therefore refers to the office in Berlin. To filter the event on the Event-Driven Ansible side, you need to build a condition by checking for the presence of two host groups in the received event – “Web servers” and “Berlin.” The “host_groups” field in the resulting JSON is a list, which means that you can use the is select construct to find an element in the list.

Search by tag value

The third condition for the search applies if this event belongs to a configuration. You can understand this by the fact that the event has a “component” tag with a value of “configuration.” However, the event_tags field in the resulting JSON is worth looking at in more detail. It is a dictionary containing tag names as keys, and because of that, you can refer to each tag separately on the Ansible side. What’s more, each tag will always contain a list of tag values, as tag names can be duplicated with different values. To search by the value of a tag, you can refer to a specific tag and use the is select construction for locating an element in the list.

To solve this example, specify the following rules block in ansible-rulebook:

  rules:
    - name: Run playbook for office in Berlin
      condition: >-
        event.payload.host_groups is select("==","Web servers") and
        event.payload.host_groups is select("==","Berlin") and
        event.payload.event_tags.component is select("==","configuration")
      action:
        run_playbook:
          name: deploy-nginx-berlin.yaml
Solution

The condition field contains 3 elements, and you can see all conditions on the right side of the diagram. In all three cases, you can use the is select construct and check if the required element is in the list.

The first two conditions check for the presence of the required host groups in the list of groups in “event.payload.host_groups.” In the diagram, you can see with a green dotted line how the first two conditions correspond to groups on the host in Zabbix. According to the condition of the example, this host must belong to both required groups, meaning that you need to set the logical operation and between the two conditions.

In the last condition, the event_tags field is a dictionary. Therefore, you can refer to the tag by specifying its name in the “event.payload.event_tags.component“ path and check for the presence of “configuration” among the tag values. In the diagram, you can see the relationship between the last condition and the tags on the host with a dotted line.

Since all three conditions must match according to the condition of the example, you once again need to put the logical operation and between them.

Action block

Let’s analyze the action block. If both conditions match, the ansible-rulebook will perform the specified action. In this case, that means the launch of the playbook using the run_playbook construct. Next, the name block contains the name of the playbook to run: deploy-nginx-berlin.yaml.

Example #2

Here is an example using the standard template Docker by Zabbix agent 2. For events triggered by “Container {#NAME}: Container has been stopped with error code”, the administrator additionally configured an action to send it to Event-Driven Ansible as well. Let’s assume that in the case of stopping the container “internal_portal” with the status “137”, its restart requires preparation, with the logic of that preparation specified in the playbook.

There are more details in the diagram above. On the left side, you can see a host with configured monitoring. The event from the example will have many parameters, but you will work with two – operational data and all tags of this event. According to the general concept, all this data will go into the media type script, which will generate JSON for sending to Event-Driven Ansible. On the Ansible side, the ansible-rulebook checks the received event for compliance with the specified conditions. If the event matches all the conditions, the ansible-rulebook starts the specified action, in this case, the start of the playbook.

In the block below you can see part of the JSON to send to Event-Driven Ansible. To solve the task, you need to be concerned only with two fields from the entire output: “event_tags” and “operation_data”:

{
    ...,
    "event_tags": {
        "class": ["software"],
        "component": ["system"],
        "container": ["/internal_portal"],
        "scope": ["availability"],
        "target": ["docker"]},
    "operation_data": "Exit code: 137",
    ...
}
Search by tag value

The first step is to determine that the event belongs to the required container. Its name is displayed in the “container” tag, so you need to add a condition to search for the name of the container “/internal_portal” in the tag. However, as discussed in the previous example, the event_tags field in the resulting JSON is a dictionary containing tag names as keys. By referring to the key to a specific tag, you can get a list of its values. Since tags can be repeated with different values, you can get all the values of this tag by key in the received JSON, and this field will always be a list. Therefore, to search by value, you can always refer to a specific tag and use the is select construction.

Search by operational data field

The second step is to check the exit code. According to the trigger settings, this information is displayed in the operational data and passed to Event-Driven Ansible in the “operation_data” field. This field is a string, and you need to check with a regular expression if this field contains the value “Exit code: 137.” On the ansible-rulebook side, the is regex construct will be used to search for a regular expression.

To solve this example, specify the following rules block in ansible-rulebook:

  rules:
    - name: Run playbook for container "internal_portal"
      condition: >-
        event.payload.event_tags.container is select("==","/internal_portal") and
        event.payload.operation_data is regex("Exit code.*137")
      action:
        run_playbook:
          name: restart_internal_portal.yaml
Solution

In the first condition, the event_tags field is a dictionary and you are referring to a specific tag, so the final path will contain the tag name, including “event.payload.event_tags.container.” Next, using the is select construct, the list of tag values is checked. This allows you to check that the required “internal_portal” container is present as the value of the tag. If you refer to the diagram, you can see the green dotted line relationship between the condition in the ansible-rulebook and the tags in the event from the Zabbix side.

In the second condition, access the event.payload.operation_data field using the is regex construct and the regular expression “Exit code.*137.” This way you check for the presence of the status “137” as a value. You can also see he link between the green dotted line of the condition on the ansible-rulebook side and the operational data of the event in Zabbix in the diagram.

Since both conditions must match, you can specify the and logical operation between the conditions.

Action block

Taking a look at the action block, if both conditions match, the ansible-rulebook will perform the specified action. In this case, it’s the launch of the playbook using the run_playbook construct. Next, the name block contains the name of the playbook to run:restart_internal_portal.yaml.

Conclusion

It’s clear that both tools (and especially their interconnected work) are great for implementing automation. Zabbix is a powerful monitoring solution, and Ansible is a great orchestration software. Both of these tools complement each other, creating an excellent tandem that takes on all routine tasks. This article has shown how to send events from Zabbix to Event-Driven Ansible and how to configure it on each side, and it has also proven that it’s not as difficult as it might initially seem. But remember – we’ve only looked at the simplest examples. The rest depends only on your imagination.

Questions

Q: How can I get the full list of fields in an event?

A: The best way is to make an ansible-rulebook with action “debug” and condition “event.payload is defined.” In this case, all events from Zabbix will be displayed. This example is described in the section “Receiving Events in Event-Driven Ansible.”

Q: Does the list of sent fields depend on the situation?

A: No. The list of fields in the sent event is always the same. If there are no objects in the event, the field will be empty. The case with tags is a good example – the tags may not be present in the event, but the “tags” field will still be sent.

Q: What events can be sent from Zabbix to Event-Drive Ansible?

A: In the current version (Zabbix 6.4)n, only trigger-based events and problems can be sent.

Q: Is it possible to use the values of received events in the ansible-playbook?

A: Yes. On the ansible-playbook side, you can get values using the ansible_eda namespace. To access the values in an event, you need to specify ansible_eda.event.

For example, to display all the details of an event, you can use:

  tasks:
    - debug:
        msg: "{{ ansible_eda.event }}"

To get the name of the container from example #2 of this article, you can use the following code:

  tasks:
    - debug:
        msg: "{{ ansible_eda.event.payload.event_tags.container }}"

The post Forward Zabbix Events to Event-Driven Ansible and Automate your Workflows appeared first on Zabbix Blog.

AWS Security Hub launches a new capability for automating actions to update findings

Post Syndicated from Stuart Gregg original https://aws.amazon.com/blogs/security/aws-security-hub-launches-a-new-capability-for-automating-actions-to-update-findings/

If you’ve had discussions with a security organization recently, there’s a high probability that the word automation has come up. As organizations scale and consume the benefits the cloud has to offer, it’s important to factor in and understand how the additional cloud footprint will affect operations. Automation is a key enabler for efficient operations and can help drive down the number of repetitive tasks that the operational teams have to perform.

Alert fatigue is caused when humans work on the same repetitive tasks day in and day out and also have a large volume of alerts that need to be addressed. The repetitive nature of these tasks can cause analysts to become numb to the importance of the task or make errors due to manual processing. This can lead to misclassification of security alerts or higher-severity alerts being overlooked due to investigation times. Automation is key here to reduce the number of repetitive tasks and give analysts time to focus on other areas of importance.

In this blog post, we’ll walk you through new capabilities within AWS Security Hub that you can use to take automated actions to update findings. We’ll show you some example scenarios that use this capability and set you up with the knowledge you need to get started with creating automation rules.

Automation rules in Security Hub

AWS Security Hub is available globally and is designed to give you a comprehensive view of your security posture across your AWS accounts. With Security Hub, you have a single place that aggregates, organizes, and prioritizes your security alerts, or findings, from multiple AWS services, including Amazon GuardDuty, Amazon Inspector, Amazon Macie, AWS Firewall Manager, AWS Systems Manager Patch Manager, AWS Config, AWS Health, and AWS Identity and Access Management (IAM) Access Analyzer, as well as from over 65 AWS Partner Network (APN) solutions.

Previously, Security Hub could take automated actions on findings, but this involved going to the Amazon EventBridge console or API, creating an EventBridge rule, and then building an AWS Lambda function, an AWS Systems Manager Automation runbook, or an AWS Step Functions step as the target of that rule. If you wanted to set up these automated actions in the administrator account and home AWS Region and run them in member accounts and in linked Regions, you would also need to deploy the correct IAM permissions to enable the actions to run across accounts and Regions. After setting up the automation flow, you would need to maintain the EventBridge rule, Lambda function, and IAM roles. Such maintenance could include upgrading the Lambda versions, verifying operational efficiency, and checking that everything is running as expected.

With Security Hub, you can now use rules to automatically update various fields in findings that match defined criteria. This allows you to automatically suppress findings, update findings’ severities according to organizational policies, change findings’ workflow status, and add notes. As findings are ingested, automation rules look for findings that meet defined criteria and update the specified fields in findings that meet the criteria. For example, a user can create a rule that automatically sets the finding’s severity to “Critical” if the finding account ID is of a known business-critical account. A user could also automatically suppress findings for a specific control in an account where the finding represents an accepted risk.

With automation rules, Security Hub provides you a simplified way to build automations directly from the Security Hub console and API. This reduces repetitive work for cloud security and DevOps engineers and can reduce the mean time to response.

Use cases

In this section, we’ve put together some examples of how Security Hub automation rules can help you. There’s a lot of flexibility in how you can use the rules, and we expect there will be many variations that your organization will use when contextual information about security risk has been added.

Scenario 1: Elevate finding severity for specific controls based on account IDs

Security Hub offers protection by using hundreds of security controls that create findings that have a severity associated with them. Sometimes, you might want to elevate that severity according to your organizational policies or according to the context of the finding, such as the account it relates to. With automation rules, you can now automatically elevate the severity for specific controls when they are in a specific account.

For example, the AWS Foundational Security Best Practices control GuardDuty.1 has a “High” severity by default. But you might consider such a finding to have “Critical” severity if it occurs in one of your top production accounts. To change the severity automatically, you can choose GeneratorId as a criteria and check that it’s equal to aws-foundational-security-best-practices/v/1.0.0/GuardDuty.1, and also add AwsAccountId as a criteria and check that it’s equal to YOUR_ACCOUNT_IDs. Then, add an action to update the severity to “Critical,” and add a note to the person who will look at the finding that reads “Urgent — look into these production accounts.”

You can set up this automation rule through the AWS CLI, the console, the Security Hub API, or the AWS SDK for Python (Boto3), as follows.

To set up the automation rule for Scenario 1 (AWS CLI)

  • In the AWS CLI, run the following command to create a new automation rule with a specific Amazon Resource Name (ARN). Note the different modifiable parameters:
    • Rule-name — The name of the rule that will be created.
    • Rule-status — An optional parameter. Specify whether you want Security Hub to activate and start applying the rule to findings after creation. If no value is specified, the default value is ENABLED. A value of DISABLED means that the rule will be paused after creation.
    • Rule-order — Provide the processing order for the rule. Security Hub applies rules with a lower numerical value for this parameter first.
    • Criteria — Provide the criteria that you want Security Hub to use to filter your findings. The rule action will be applied to findings that match the criteria. For a list of supported criteria, see Criteria and actions for automation rules. In this example, the criteria are placeholders and should be replaced.
    • Actions — Provide the actions that you want Security Hub to take when there’s a match between a finding and your defined criteria. For a list of supported actions, see Criteria and actions for automation rules. In this example, the actions are placeholders and should be replaced.
    aws securityhub create-automation-rule \—rule-name "Elevate severity for findings in production accounts - GuardDuty.1" \—rule-status "ENABLED"" \—rule-order 1 \—description "Elevate severity for findings in production accounts - GuardDuty.1" \—criteria '{"GeneratorId": [{"Value": "aws-foundational-security-best-practices/v/1.0.0/GuardDuty.1","Comparison": "EQUALS"}, "AwsAccountId": [{"Value": "<111122223333>","Comparison": "EQUALS"},]}' \—actions '[{"Type": "FINDING_FIELDS_UPDATE","FindingFieldsUpdate": {"Severity": {"Label": "CRITICAL"},"Note": {"Text": "Urgent – look into these production accounts","UpdatedBy": "sechub-automation"}}}]' \—region us-east-1

To set up the automation rule for Scenario 1 (console)

  1. Open the Security Hub console, and in the left navigation pane, choose Automations.
    Figure 1: Automation rules in the Security Hub console

    Figure 1: Automation rules in the Security Hub console

  2. Choose Create rule, and then choose Create a custom rule to get started with creating a rule of your choice. Add a rule name and description.
    Figure 2: Create a new custom rule

    Figure 2: Create a new custom rule

  3. Under Criteria, add the following information.
    • Key 1
      • Key = GeneratorID
      • Operator = EQUALS
      • Value = aws-foundational-security-best-practices/v/1.0.0/GuardDuty.1
    • Key 2
      • Key = AwsAccountId
      • Operator = EQUALS
      • Value = Your AWS account ID
    Figure 3: Information added for the rule criteria

    Figure 3: Information added for the rule criteria

  4. You can preview which findings will match the criteria by looking in the preview section.
    Figure 4: Preview section

    Figure 4: Preview section

  5. Next, under Automated action, specify which finding value to update automatically when findings match your criteria.
    Figure 5: Automated action to be taken against the findings that match the criteria

    Figure 5: Automated action to be taken against the findings that match the criteria

  6. For Rule status, choose Enabled, and then choose Create rule.
    Figure 6: Set the rule status to Enabled

    Figure 6: Set the rule status to Enabled

  7. After you choose Create rule, you will see the newly created rule within the Automations portal.
    Figure 7: Newly created rule within the Security Hub Automations page

    Figure 7: Newly created rule within the Security Hub Automations page

    Note: In figure 7, you can see multiple automation rules. When you create automation rules, you assign each rule an order number. This determines the order in which Security Hub applies your automation rules. This becomes important when multiple rules apply to the same finding or finding field. When multiple rule actions apply to the same finding field, the rule with the highest numerical value for rule order is applied last and has the ultimate effect on that field.

Additionally, if your preferred deployment method is to use the API or AWS SDK for Python (Boto3), we have information on how you can use these means of deployment in our public documentation.

Scenario 2: Change the finding severity to high if a resource is important, based on resource tags

Imagine a situation where you have findings associated to a wide range of resources. Typically, organizations will attempt to prioritize which findings to remediate first. You can achieve this prioritization through Security Hub and the contextual fields that are available for you to use — for example, by using the severity of the finding or the account ID the resource is sitting in. You might also have your own prioritization based on other factors. You could add this additional context to findings by using a tagging strategy. With automation rules, you can now automatically elevate the severity for specific findings based on the tag value associated to the resource.

For example, if a finding comes into Security Hub with the severity rating “Medium,” but the resource in question is critical to the business and has the tag production associated to it, you could automatically raise the severity rating to “High.”

Note: This will work only for findings where there is a resource tag associated with the finding.

Scenario 3: Suppress GuardDuty findings with a severity of “Informational”

GuardDuty provides an overarching view of the state of threats to deployed resources in your organization’s cloud environment. After evaluation, GuardDuty produces findings related to these threats. The findings produced by GuardDuty have different severities, to help organizations with prioritization. Some of these findings will be given an “Informational” severity. “Informational” indicates that no issue was found and the content of the finding is purely to give information. After you have evaluated the context of the finding, you might want to suppress any additional findings that match the same criteria.

For example, you might want to set up a rule so that new findings with the generator ID that produced “Informational” findings are suppressed, keeping only the findings that need action.

Templates

When you create a new rule, you can also choose to create a rule from a template. These templates are regularly updated with use cases that are applicable for many customers.

To set up an automation rule by using a template from the console

  1. In the Security Hub console, choose Automations, and then choose Create rule.
  2. Choose Create a rule from a template to get started with creating a rule of your choice.
  3. Select a rule template from the drop-down menu.
    Figure 8: Select an automation rule template

    Figure 8: Select an automation rule template

  4. (Optional) If necessary, modify the Rule, Criteria, and Automated action sections.
  5. For Rule status, choose whether you want the rule to be enabled or disabled after it’s created.
  6. (Optional) Expand the Additional settings section. Choose Ignore subsequent rules for findings that match these criteria if you want this rule to be the last rule applied to findings that match the rule criteria.
  7. (Optional) For Tags, add tags as key-value pairs to help you identify the rule.
  8. Choose Create rule.

Multi-Region deployment

For organizations that operate in multiple AWS Regions, we’ve provided a solution that you can use to replicate rules created in your central Security Hub admin account into these additional Regions. You can find the sample code for this solution in our GitHub repo.

Conclusion

In this blog post, we’ve discussed the importance of automation and its ability to help organizations scale operations within the cloud. We’ve introduced a new capability in AWS Security Hub, automation rules, that can help reduce the repetitive tasks your operational teams may be facing, and we’ve showcased some example use cases to get you started. Start using automation rules in your environment today. We’re excited to see what use cases you will solve with this feature and as always, are happy to receive any feedback.

If you have feedback about this post, submit comments in the Comments section below. If you have questions about this post, start a new thread on the AWS Security, Identity, & Compliance re:Post or contact AWS Support.

Stuart Gregg

Stuart Gregg

Stuart enjoys providing thought leadership and being a trusted advisor to customers. In his spare time Stuart can be seen either training for an Ironman or snacking.

Shachar Hirshberg

Shachar Hirshberg

Shachar is a Senior Product Manager at AWS Security Hub with over a decade of experience in building, designing, launching, and scaling enterprise software. He is passionate about further improving how customers harness AWS services to enable innovation and enhance the security of their cloud environments. Outside of work, Shachar is an avid traveler and a skiing enthusiast.

Get custom data into Amazon Security Lake through ingesting Azure activity logs

Post Syndicated from Adam Plotzker original https://aws.amazon.com/blogs/security/get-custom-data-into-amazon-security-lake-through-ingesting-azure-activity-logs/

Amazon Security Lake automatically centralizes security data from both cloud and on-premises sources into a purpose-built data lake stored on a particular AWS delegated administrator account for Amazon Security Lake.

In this blog post, I will show you how to configure your Amazon Security Lake solution with cloud activity data from Microsoft Azure Monitor activity log, which you can query alongside your existing AWS CloudTrail data. I will walk you through the required steps — from configuring the required AWS Identity and Access Management (IAM) permissions, AWS Glue jobs, and Amazon Kinesis Data Streams required on the AWS side to forwarding that data from within Azure.

When you turn on Amazon Security Lake, it begins to collect actionable security data from various AWS sources. However, many enterprises today have complex environments that include a mix of different cloud resources in addition to on-premises data centers.

Although the AWS data sources in Amazon Security Lake encompass a large amount of the necessary security data needed for analysis, you may miss the full picture if your infrastructure operates across multiple cloud venders (for example, AWS, Azure, and Google Cloud Platform) and on-premises at the same time. By querying data from across your entire infrastructure, you can increase the number of indicators of compromise (IOC) that you identify, and thus increase the likelihood that those indicators will lead to actionable outputs.

Solution architecture

Figure 1 shows how to configure data to travel from an Azure event hub to Amazon Security Lake.

Figure 1: Solution architecture

Figure 1: Solution architecture

As shown in Figure 1, the solution involves the following steps:

  1. An AWS user instantiates the required AWS services and features that enable the process to function, including AWS Identity and Access Management (IAM) permissions, Kinesis data streams, AWS Glue jobs, and Amazon Simple Storage Service (Amazon S3) buckets, either manually or through an AWS CloudFormation template, such as the one we will use in this post.
  2. In response to the custom source created from the CloudFormation template, a Security Lake table is generated in AWS Glue.
  3. From this point on, Azure activity logs in their native format are stored within an Azure cloud event hub within an Azure account. An Azure function is deployed to respond to new events within the Azure event hub and forward these logs over the internet to the Kinesis data stream that was created in the preceding step.
  4. The Kinesis data stream forwards the data to an AWS Glue streaming job fronted by the Kinesis data.
  5. The AWS Glue job then performs the extract, transfer, and load (ETL) mapping to the appropriate Open Cybersecurity Schema Framework (OCSF) (specified for API Activity events at OCSF API Activity Mappings).
  6. The Azure events are partitioned with respect to the required partitioning requirements in Amazon Security Lake tables and stored in S3.
  7. The user can query these tables by using Amazon Athena alongside the rest of their data inside Amazon Security Lake.

Prerequisites

Before you implement the solution, complete the following prerequisites:

  • Verify that you have enabled Amazon Security Lake in the AWS Regions that correspond to the Azure Activity logs that you will forward. For more information, see What is Amazon Security Lake?
  • Preconfigure the custom source logging for the source AZURE_ACTIVITY in your Region. To configure this custom source in Amazon Security Lake, open the Amazon Security Lake console, navigate to Create custom data source, and do the following, as shown in Figure 2:
    • For Data source name, enter AZURE_ACTIVITY.
    • For Event class, select API_ACTIVITY.
    • For Account Id, enter the ID of the account which is authorized to write data to your data lake.
    • For External Id, enter “AZURE_ACTIVITY-<YYYYMMDD>
    Figure 2:  Configure custom data source

    Figure 2: Configure custom data source

For more information on how to configure custom sources for Amazon Security Lake, see Collecting data from custom sources.

Step 1: Configure AWS services for Azure activity logging

The first step is to configure the AWS services for Azure activity logging.

  1. To configure Azure activity logging in Amazon Security Lake, first prepare the assets required in the target AWS account. You can automate this process by using the provided CloudFormation template — Security Lake CloudFormation — which will do the heavy lifting for this portion of the setup.

    Note: I have predefined these scripts to create the AWS assets required to ingest Azure activity logs, but you can generalize this process for other external log sources, as well.

    The CloudFormation template has the following components:

    • securitylakeGlueStreamingRole — includes the following managed policies:
      • AWSLambdaKinesisExecutionRole
      • AWSGlueServiceRole
    • securitylakeGlueStreamingPolicy — includes the following attributes:
      • “s3:GetObject”
      • “s3:PutObject”
    • securitylakeAzureActivityStream — This Kinesis data stream is the endpoint that acts as the connection point between Azure and AWS and the frontend of the AWS Glue stream that feeds Azure activity logs to Amazon Security Lake.
    • securitylakeAzureActivityJob — This is an AWS Glue streaming job that is used to take in feeds from the Kinesis data stream and map the Azure activity logs within that stream to OCSF.
    • securitylake-glue-assets S3 bucket — This is the S3 bucket that is used to store the ETL scripts used in the AWS Glue job to map Azure activity logs.

    Running the CloudFormation template will instantiate the aforementioned assets in your AWS delegated administrator account for Amazon Security Lake.

  2. The CloudFormation template creates a new S3 bucket with the following syntax: securityLake-glue-assets-<ACCOUNT-ID><REGION>. After the CloudFormation run is complete, navigate to this bucket within the S3 console.
  3. Within the S3 bucket, create a scripts and temporary folder in the S3 bucket, as shown in Figure 4.
    Figure 4: Glue assets bucket

    Figure 4: Glue assets bucket

  4. Update the Azure AWS Glue Pyspark script by replacing the following values in the file. You will attach this script to your AWS Glue job and use it to generate the AWS assets required for the implementation.
    • Replace <AWS_REGION_NAME> with the Region that you are operating in — for example, us-east-2.
    • Replace <AWS_ACCOUNT_ID> with the account ID of your delegated administrator account for Amazon Security Lake — for example, 111122223333.
    • Replace <SECURITYLAKE-AZURE-STREAM-ARN> with the Kinesis stream name created through the CloudFormation template. To find the stream name, open the Kinesis console, navigate to the Kinesis stream with the name securityLakeAzureActivityStream<STREAM-UID>, and copy the Amazon Resource Name (ARN), as shown in the following figure.

      Figure 5: Kinesis stream ARN

      Figure 5: Kinesis stream ARN

    • Replace <SECURITYLAKE-BUCKET-NAME> with the name of your data lake S3 bucket root name — for example, s3://aws-security-data-lake-DOC-EXAMPLE-BUCKET.

    After you replace these values, navigate within the scripts folder and upload the AWS Glue PySpark Python script named azure-activity-pyspark.py, as shown in Figure 6.

    Figure 6: AWS Glue script

    Figure 6: AWS Glue script

  5. Within your AWS Glue job, choose Job details and configure the job as follows:
    • For Type, select Spark Streaming.
    • For Language, select Python 3.
    • For Script path, select the S3 path that you created in the preceding step.
    • For Temporary path, select the S3 path that you created in the preceding step.
  6. Save the changes, and run the AWS Glue job by selecting Save and then Run.
  7. Choose the Runs tab, and make sure that the Run status of the job is Running.
    igure 7: AWS Glue job status

    Figure 7: AWS Glue job status

At this point, you have finished the configurations from AWS.

Step 2: Configure Azure services for Azure activity log forwarding

You will complete the next steps in the Azure Cloud console. You need to configure Azure to export activity logs to an Azure cloud event hub within your desired Azure account or organization. Additionally, you need to create an Azure function to respond to new events within the Azure event hub and forward those logs over the internet to the Kinesis data stream that the CloudFormation template created in the initial steps of this post.

For information about how to set up and configure Azure Functions to respond to event hubs, see Azure Event Hubs Trigger for Azure Functions in the Azure documentation.

Configure the following Python script — Azure Event Hub Function — in an Azure function app. This function is designed to respond to event hub events, create a connection to AWS, and forward those events to Kinesis as deserialized JSON blobs.

In the script, replace the following variables with your own information:

  • For <SECURITYLAKE-AZURE-STREAM-ARN>, enter the Kinesis data stream ARN.
  • For <SECURITYLAKE-AZURE-STREAM-NAME>, enter the Kinesis data stream name.
  • For <SECURITYLAKE-AZURE-STREAM-KEYID>, enter the AWS Key Management Service (AWS KMS) key ID created through the CloudFormation template.

The <SECURITYLAKE-AZURE-STREAM-ARN> and securityLakeAzureActivityStream<STREAM-UID> are the same variables that you obtained earlier in this post (see Figure 5).

You can find the AWS KMS key ID within the AWS KMS managed key policy associated with securityLakeAzureActivityStream. For example, in the key policy shown in Figure 8, the <SECURITYLAKE-AZURE-STREAM-KEYID> is shown in line 3.

Figure 8: Kinesis data stream inputs

Figure 8: Kinesis data stream inputs

Important: When you are working with KMS keys retrieved from the AWS console or AWS API keys within Azure, you should be extremely mindful of how you approach key management. Improper or poor handling of keys could result in the interception of data from the Kinesis stream or Azure function.

It’s a best security practice to use a trusted key management architecture that uses sufficient encryption and security protocols when working with keys that safeguard sensitive security information. Within Azure, consider using services such as the AWS Azure AD integration for seamless and ephemeral credential usage inside of the azure function. See – Azure AD Integration – for more information on how the Azure AD Integration works to safeguard and manage stored security keys and help make sure that no keys are accessible to unauthorized parties or stored as unencrypted text outside the AWS console.

Step 3: Validate the workflow and query Athena

After you complete the preceding steps, your logs should be flowing. To make sure that the process is working correctly, complete the following steps.

  1. In the Kinesis Data Streams console, verify that the logs are flowing to your data stream. Open the Kinesis stream that you created previously, choose the Data viewer tab, and then choose Get records, as shown in Figure 9.
    Figure 9: Kinesis data stream inputs

    Figure 9: Kinesis data stream inputs

  2. Verify that the logs are partitioned and stored within the correct Security Lake bucket associated with the configured Region. The log partitions within the Security Lake bucket should have the following syntax — “region=<region>/account_id=<account_id>/eventDay=<YYYYMMDD>/”, and they should be stored with the expected parquet compression.
     Figure 10: S3 bucket with object

    Figure 10: S3 bucket with object

  3. Assuming that CloudTrail logs exist within your Amazon Security Lake instance as well, you can now create a query in Athena that pulls data from the newly created Azure activity table and examine it alongside your existing CloudTrail logs by running queries such as the following:
    SELECT 
        api.operation,
        actor.user.uid,
        actor.user.name,
        src_endpoint.ip,
        time,
        severity,
        metadata.version,
        metadata.product.name,
        metadata.product.vendor_name,
        category_name,
        activity_name,
        type_uid,
    FROM {SECURITY-LAKE-DB}.{SECURITY-LAKE-AZURE-TABLE}
    UNION ALL
    SELECT 
        api.operation,
        actor.user.uid,
        actor.user.name,
        src_endpoint.ip,
        time,
        severity,
        metadata.version,
        metadata.product.name,
        metadata.product.vendor_name,
        category_name,
        activity_name,
        type_uid,
    FROM {SECURITY-LAKE-DB}.{SECURITY-LAKE-CLOUDTRAIL-TABLE}

    Figure 11:  Query Azure activity and CloudTrail together in Athena

    Figure 11: Query Azure activity and CloudTrail together in Athena

For additional guidance on how to configure access and query Amazon Security Lake in Athena, see the following resources:

Conclusion

In this blog post, you learned how to create and deploy the AWS and Microsoft Azure assets needed to bring your own data to Amazon Security Lake. By creating an AWS Glue streaming job that can transform Azure activity data streams and by fronting that AWS Glue job with a Kinesis stream, you can open Amazon Security Lake to intake from external Azure activity data streams.

You also learned how to configure Azure assets so that your Azure activity logs can stream to your Kinesis endpoint. The combination of these two creates a working, custom source solution for Azure activity logging.

To get started with Amazon Security Lake, see the Getting Started page, or if you already use Amazon Security Lake and want to read additional blog posts and articles about this service, see Blog posts and articles.

If you have feedback about this blog post, submit comments in the Comments section below. If you have questions about this blog post, start a new thread on Amazon Security Lake re:Post or contact AWS Support.

Want more AWS Security news? Follow us on Twitter.

Adam Plotzker

Adam Plotzker

Adam is currently a Security Engineer at AWS, working primarily on the Amazon Security Lake solution. One of the things he enjoys most about his work at AWS is his ability to be creative when exploring customer needs and coming up with unique solutions that meet those needs.

DevSecOps with Amazon CodeGuru Reviewer CLI and Bitbucket Pipelines

Post Syndicated from Bineesh Ravindran original https://aws.amazon.com/blogs/devops/devsecops-with-amazon-codeguru-reviewer-cli-and-bitbucket-pipelines/

DevSecOps refers to a set of best practices that integrate security controls into the continuous integration and delivery (CI/CD) workflow. One of the first controls is Static Application Security Testing (SAST). SAST tools run on every code change and search for potential security vulnerabilities before the code is executed for the first time. Catching security issues early in the development process significantly reduces the cost of fixing them and the risk of exposure.

This blog post, shows how we can set up a CI/CD using Bitbucket Pipelines and Amazon CodeGuru Reviewer . Bitbucket Pipelines is a cloud-based continuous delivery system that allows developers to automate builds, tests, and security checks with just a few lines of code. CodeGuru Reviewer is a cloud-based static analysis tool that uses machine learning and automated reasoning to generate code quality and security recommendations for Java and Python code.

We demonstrate step-by-step how to set up a pipeline with Bitbucket Pipelines, and how to call CodeGuru Reviewer from there. We then show how to view the recommendations produced by CodeGuru Reviewer in Bitbucket Code Insights, and how to triage and manage recommendations during the development process.

Bitbucket Overview

Bitbucket is a Git-based code hosting and collaboration tool built for teams. Bitbucket’s best-in-class Jira and Trello integrations are designed to bring the entire software team together to execute a project. Bitbucket provides one place for a team to collaborate on code from concept to cloud, build quality code through automated testing, and deploy code with confidence. Bitbucket makes it easy for teams to collaborate and reduce issues found during integration by providing a way to combine easily and test code frequently. Bitbucket gives teams easy access to tools needed in other parts of the feedback loop, from creating an issue to deploying on your hardware of choice. It also provides more advanced features for those customers that need them, like SAML authentication and secrets storage.

Solution Overview

Bitbucket Pipelines uses a Docker container to perform the build steps. You can specify any Docker image accessible by Bitbucket, including private images, if you specify credentials to access them. The container starts and then runs the build steps in the order specified in your configuration file. The build steps specified in the configuration file are nothing more than shell commands executed on the Docker image. Therefore, you can run scripts, in any language supported by the Docker image you choose, as part of the build steps. These scripts can be stored either directly in your repository or an Internet-accessible location. This solution demonstrates an easy way to integrate Bitbucket pipelines with AWS CodeReviewer using bitbucket-pipelines.yml file.

You can interact with your Amazon Web Services (AWS)  account from your Bitbucket Pipeline using the  OpenID Connect (OIDC)  feature. OpenID Connect is an identity layer above the OAuth 2.0 protocol.

Now that you understand how Bitbucket and your AWS Account securely communicate with each other, let’s look into the overall summary of steps to configure this solution.

  1. Fork the repository
  2. Configure Bitbucket Pipelines as an IdP on AWS.
  3. Create an IAM role.
  4. Add repository variables needed for pipeline
  5. Adding the CodeGuru Reviewer CLI to your pipeline
  6. Review CodeGuru recommendations

Now let’s look into each step in detail. To configure the solution, follow  steps mentioned below.

Step 1: Fork this repo

Log in to Bitbucket and choose **Fork** to fork this example app to your Bitbucket account.

https://bitbucket.org/aws-samples/amazon-codeguru-samples

Fork amazon-codeguru-samples bitbucket repository.

Figure 1 : Fork amazon-codeguru-samples bitbucket repository.

Step 2: Configure Bitbucket Pipelines as an Identity Provider on AWS

Configuring Bitbucket Pipelines as an IdP in IAM enables Bitbucket Pipelines to issue authentication tokens to users to connect to AWS.
In your Bitbucket repo, go to Repository Settings > OpenID Connect. Note the provider URL and the Audience variable on that screen.

The Identity Provider URL will look like this:

https://api.bitbucket.org/2.0/workspaces/YOUR_WORKSPACE/pipelines-config/identity/oidc  – This is the issuer URL for authentication requests. This URL issues a  token to a requester automatically as part of the workflow. See more detail about issuer URL in RFC . Here “YOUR_WORKSPACE” need to be replaced with name of your bitbucket workspace.

And the Audience will look like:

ari:cloud:bitbucket::workspace/ari:cloud:bitbucket::workspace/84c08677-e352-4a1c-a107-6df387cfeef7  – This is the recipient the token is intended for. See more detail about audience in Request For Comments (RFC) which is memorandum published by the Internet Engineering Task Force(IETF) describing methods and behavior for  securely transmitting information between two parties usinf JSON Web Token ( JWT).

Configure Bitbucket Pipelines as an Identity Provider on AWS

Figure 2 : Configure Bitbucket Pipelines as an Identity Provider on AWS

Next, navigate to the IAM dashboard > Identity Providers > Add provider, and paste in the above info. This tells AWS that Bitbucket Pipelines is a token issuer.

Step 3: Create a custom policy

You can always use the CLI with Admin credentials but if you want to have a specific role to use the CLI, your credentials must have at least the following permissions:

{
    "Version": "2012-10-17",
    "Statement": [
        {
            "Action": [
                "codeguru-reviewer:ListRepositoryAssociations",
                "codeguru-reviewer:AssociateRepository",
                "codeguru-reviewer:DescribeRepositoryAssociation",
                "codeguru-reviewer:CreateCodeReview",
                "codeguru-reviewer:DescribeCodeReview",
                "codeguru-reviewer:ListRecommendations",
                "iam:CreateServiceLinkedRole"
            ],
            "Resource": "*",
            "Effect": "Allow"
        },
        {
            "Action": [
                "s3:CreateBucket",
                "s3:GetBucket*",
                "s3:List*",
                "s3:GetObject",
                "s3:PutObject",
                "s3:DeleteObject"
            ],
            "Resource": [
                "arn:aws:s3:::codeguru-reviewer-cli-<AWS ACCOUNT ID>*",
                "arn:aws:s3:::codeguru-reviewer-cli-<AWS ACCOUNT ID>*/*"
            ],
            "Effect": "Allow"
        }
    ]
}

To create an IAM policy, navigate to the IAM dashboard > Policies > Create Policy

Now then paste the above mentioned json document into the json tab as shown in screenshot below and replace <AWS ACCOUNT ID>   with your own AWS Account ID

Create a Policy.

Figure 3 : Create a Policy.

Name your policy; in our example, we name it CodeGuruReviewerOIDC.

Review and Create a IAM policy.

Figure 4 : Review and Create a IAM policy.

Step 4: Create an IAM Role

Once you’ve enabled Bitbucket Pipelines as a token issuer, you need to configure permissions for those tokens so they can execute actions on AWS.
To create an IAM web identity role, navigate to the IAM dashboard > Roles > Create Role, and choose the IdP and audience you just created.

Create an IAM role

Figure 5 : Create an IAM role

Next, select the “CodeGuruReviewerOIDC “ policy to attach to the role.

Assign policy to role

Figure 6 : Assign policy to role

 Review and Create role

Figure 7 : Review and Create role

Name your role; in our example, we name it CodeGuruReviewerOIDCRole.

After adding a role, copy the Amazon Resource Name (ARN) of the role created:

The Amazon Resource Name (ARN) will look like this:

arn:aws:iam::000000000000:role/CodeGuruReviewerOIDCRole

we will need this in a later step when we create AWS_OIDC_ROLE_ARN as a repository variable.

Step 5: Add repository variables needed for pipeline

Variables are configured as environment variables in the build container. You can access the variables from the bitbucket-pipelines.yml file or any script that you invoke by referring to them. Pipelines provides a set of default variables that are available for builds, and can be used in scripts .Along with default variables we need to configure few additional variables called Repository Variables which are used to pass special parameter to the pipeline.

Create repository variables

Figure 8 : Create repository variables

Figure 8 Create repository variables

Below mentioned are the few repository variables that need to be configured for this solution.

1.AWS_DEFAULT_REGION       Create a repository variableAWS_DEFAULT_REGION with value “us-east-1”

2.BB_API_TOKEN          Create a new repository variable BB_API_TOKEN and paste the below created App password as the value

App passwords are user-based access tokens for scripting tasks and integrating tools (such as CI/CD tools) with Bitbucket Cloud.These access tokens have reduced user access (specified at the time of creation) and can be useful for scripting, CI/CD tools, and testing Bitbucket connected applications while they are in development.
To create an App password:

    • Select your avatar (Your profile and settings) from the navigation bar at the top of the screen.
    • Under Settings, select Personal settings.
    • On the sidebar, select App passwords.
    • Select Create app password.
    • Give the App password a name, usually related to the application that will use the password.
    • Select the permissions the App password needs. For detailed descriptions of each permission, see: App password permissions.
    • Select the Create button. The page will display the New app password dialog.
    • Copy the generated password and either record or paste it into the application you want to give access. The password is only displayed once and can’t be retrieved later.

3.BB_USERNAME  Create a repository variable BB_USERNAME and add your bitbucket username as the value of this variable

4.AWS_OIDC_ROLE_ARN

After adding a role in Step 4, copy the Amazon Resource Name (ARN) of the role created:

The Amazon Resource Name (ARN) will look something like this:

    arn:aws:iam::000000000000:role/CodeGuruReviewerOIDCRole

and create AWS_OIDC_ROLE_ARN as a repository variable in the target Bitbucket repository.

Step 6: Adding the CodeGuru Reviewer CLI to your pipeline

In order to add CodeGuruRevewer CLi to your pipeline update the bitbucket-pipelines.yml file as shown below

#  Template maven-build

 #  This template allows you to test and build your Java project with Maven.
 #  The workflow allows running tests, code checkstyle and security scans on the default branch.

 # Prerequisites: pom.xml and appropriate project structure should exist in the repository.

 image: docker-public.packages.atlassian.com/atlassian/bitbucket-pipelines-mvn-python3-awscli

 pipelines:
  default:
    - step:
        name: Build Source Code
        caches:
          - maven
        script:
          - cd $BITBUCKET_CLONE_DIR
          - chmod 777 ./gradlew
          - ./gradlew build
        artifacts:
          - build/**
    - step: 
        name: Download and Install CodeReviewer CLI   
        script:
          - curl -OL https://github.com/aws/aws-codeguru-cli/releases/download/0.2.3/aws-codeguru-cli.zip
          - unzip aws-codeguru-cli.zip
        artifacts:
          - aws-codeguru-cli/**
    - step:
        name: Run CodeGuruReviewer 
        oidc: true
        script:
          - export AWS_DEFAULT_REGION=$AWS_DEFAULT_REGION
          - export AWS_ROLE_ARN=$AWS_OIDC_ROLE_ARN
          - export S3_BUCKET=$S3_BUCKET

          # Setup aws cli
          - export AWS_WEB_IDENTITY_TOKEN_FILE=$(pwd)/web-identity-token
          - echo $BITBUCKET_STEP_OIDC_TOKEN > $(pwd)/web-identity-token
          - aws configure set web_identity_token_file "${AWS_WEB_IDENTITY_TOKEN_FILE}"
          - aws configure set role_arn "${AWS_ROLE_ARN}"
          - aws sts get-caller-identity

          # setup codegurureviewercli
          - export PATH=$PATH:./aws-codeguru-cli/bin
          - chmod 777 ./aws-codeguru-cli/bin/aws-codeguru-cli

          - export SRC=$BITBUCKET_CLONE_DIR/src
          - export OUTPUT=$BITBUCKET_CLONE_DIR/test-reports
          - export CODE_INSIGHTS=$BITBUCKET_CLONE_DIR/bb-report

          # Calling Code Reviewer CLI
          - ./aws-codeguru-cli/bin/aws-codeguru-cli --region $AWS_DEFAULT_REGION  --root-dir $BITBUCKET_CLONE_DIR --build $BITBUCKET_CLONE_DIR/build/classes/java --src $SRC --output $OUTPUT --no-prompt --bitbucket-code-insights $CODE_INSIGHTS        
        artifacts:
          - test-reports/*.* 
          - target/**
          - bb-report/**
    - step: 
        name: Upload Code Insights Artifacts to Bitbucket Reports 
        script:
          - chmod 777 upload.sh
          - ./upload.sh bb-report/report.json bb-report/annotations.json
    - step:
        name: Upload Artifacts to Bitbucket Downloads       # Optional Step
        script:
          - pipe: atlassian/bitbucket-upload-file:0.3.3
            variables:
              BITBUCKET_USERNAME: $BB_USERNAME
              BITBUCKET_APP_PASSWORD: $BB_API_TOKEN
              FILENAME: '**/*.json'
    - step:
          name: Validate Findings     #Optional Step
          script:
            # Looking into CodeReviewer results and failing if there are Critical recommendations
            - grep -o "Critical" test-reports/recommendations.json | wc -l
            - count="$(grep -o "Critical" test-reports/recommendations.json | wc -l)"
            - echo $count
            - if (( $count > 0 )); then
            - echo "Critical findings discovered. Failing."
            - exit 1
            - fi
          artifacts:
            - '**/*.json'

Let’s look into the pipeline file to understand various steps defined in this pipeline

Bitbucket pipeline execution steps

Figure 9 : Bitbucket pipeline execution steps

Step 1) Build Source Code

In this step source code is downloaded into a working directory and build using Gradle.All the build artifacts are then passed on to next step

Step 2) Download and Install Amazon CodeGuru Reviewer CLI
In this step Amazon CodeGuru Reviewer is CLI is downloaded from a public github repo and extracted into working directory. All artifacts downloaded and extracted are then passed on to next step

Step 3) Run CodeGuruReviewer

This step uses flag oidc: true which declares you are using  the OIDC authentication method, while AWS_OIDC_ROLE_ARN declares the role created in the previous step that contains all of the necessary permissions to deal with AWS resources.
Further repository variables are exported, which is then used to set AWS CLI .Amazon CodeGuruReviewer CLI which was downloaded and extracted in previous step is then used to invoke CodeGuruReviewer along with some parameters .

Following are the parameters that are passed on to the CodeGuruReviewer CLI
--region $AWS_DEFAULT_REGION   The AWS region in which CodeGuru Reviewer will run (in this blog we used us-east-1).

--root-dir $BITBUCKET_CLONE_DIR The root directory of the repository that CodeGuru Reviewer should analyze.

--build $BITBUCKET_CLONE_DIR/build/classes/java Points to the build artifacts. Passing the Java build artifacts allows CodeGuru Reviewer to perform more in-depth bytecode analysis, but passing the build artifacts is not required.

--src $SRC Points the source code that should be analyzed. This can be used to focus the analysis on certain source files, e.g., to exclude test files. This parameter is optional, but focusing on relevant code can shorten analysis time and cost.

--output $OUTPUT The directory where CodeGuru Reviewer will store its recommendations.

--no-prompt This ensures that CodeGuru Reviewer does run in interactive mode where it pauses for user input.

-bitbucket-code-insights $CODE_INSIGHTS The location where recommendations in Bitbucket CodeInsights format should be written to.

Once Amazon CodeGuruReviewer scans the code based on the above parameters, it generates two json files (reports.json and annotations.json) Code Insight Reports which is then passed on as artifacts to the next step.

Step 4) Upload Code Insights Artifacts to Bitbucket Reports
In this step code Insight Report generated by Amazon CodeGuru Reviewer is then uploaded to Bitbucket Reports. This makes the report available in the reports section in the pipeline as displayed in the screenshot

CodeGuru Reviewer Report

Figure 10 : CodeGuru Reviewer Report

Step 5) [Optional] Upload the copy of these reports to Bitbucket Downloads
This is an Optional step where you can upload the artifacts to Bitbucket Downloads. This is especially useful because the artifacts inside a build pipeline gets deleted after 14 days of the pipeline run. Using Bitbucket Downloads, you can store these artifacts for a much longer duration.

Bitbucket downloads

Figure 11 : Bitbucket downloads

Step 6) [Optional] Validate Findings by looking into results and failing is there are any Critical Recommendations
This is an optional step showcasing how the results for CodeGururReviewer can be used to trigger the success and failure of a Bitbucket pipeline. In this step the pipeline fails, if a critical recommendation exists in report.

Step 7: Review CodeGuru recommendations

CodeGuru Reviewer supports different recommendation formats, including CodeGuru recommendation summaries, SARIF, and Bitbucket CodeInsights.

Keeping your Pipeline Green

Now that CodeGuru Reviewer is running in our pipeline, we need to learn how to unblock ourselves if there are recommendations. The easiest way to unblock a pipeline after is to address the CodeGuru recommendation. If we want to validate on our local machine that a change addresses a recommendation using the same CLI that we use as part of our pipeline.
Sometimes, it is not convenient to address a recommendation. E.g., because there are mitigations outside of the code that make the recommendation less relevant, or simply because the team agrees that they don’t want to block deployments on recommendations unless they are critical. For these cases, developers can add a .codeguru-ignore.yml file to their repository where they can use a variety of criteria under which a recommendation should not be reported. Below we explain all available criteria to filter recommendations. Developers can use any subset of those criteria in their .codeguru-ignore.yml file. We will give a specific example in the following sections.

version: 1.0 # The version number is mandatory. All other entries are optional.

# The CodeGuru Reviewer CLI produces a recommendations.json file which contains deterministic IDs for each
# recommendation. This ID can be excluded so that this recommendation will not be reported in future runs of the
# CLI.
 ExcludeById:
 - '4d2c43618a2dac129818bef77093730e84a4e139eef3f0166334657503ecd88d'
# We can tell the CLI to exclude all recommendations below a certain severity. This can be useful in CI/CD integration.
 ExcludeBelowSeverity: 'HIGH'
# We can exclude all recommendations that have a certain tag. Available Tags can be found here:
# https://docs.aws.amazon.com/codeguru/detector-library/java/tags/
# https://docs.aws.amazon.com/codeguru/detector-library/python/tags/
 ExcludeTags:
  - 'maintainability'
# We can also exclude recommendations by Detector ID. Detector IDs can be found here:
# https://docs.aws.amazon.com/codeguru/detector-library
 ExcludeRecommendations:
# Ignore all recommendations for a given Detector ID 
  - detectorId: 'java/[email protected]'
# Ignore all recommendations for a given Detector ID in a provided set of locations.
# Locations can be written as Unix GLOB expressions using wildcard symbols.
  - detectorId: 'java/[email protected]'
    Locations:
      - 'src/main/java/com/folder01/*.java'
# Excludes all recommendations in the provided files. Files can be provided as Unix GLOB expressions.
 ExcludeFiles:
  - tst/**

The recommendations will still be reported in the CodeGuru Reviewer console, but not by the CodeGuru Reviewer CLI and thus they will not block the pipeline anymore.

Conclusion

In this post, we outlined how you can set up a CI/CD pipeline using Bitbucket Pipelines, and Amazon CodeGuru Reviewer and  we outlined how you can integrate Amazon CodeGuru Reviewer CLI with the Bitbucket cloud-based continuous delivery system that allows developers to automate builds, tests, and security checks with just a few lines of code. We showed you how to create a Bitbucket pipeline job and integrate the CodeGuru Reviewer CLI to detect issues in your Java and Python code, and access the recommendations for remediating these issues.

We presented an example where you can stop the build upon finding critical violations. Furthermore, we discussed how you could upload these artifacts to BitBucket downloads and store these artifacts for a much longer duration. The CodeGuru Reviewer CLI offers you a one-line command to scan any code on your machine and retrieve recommendations .You can use the CLI to integrate CodeGuru Reviewer into your favorite CI tool, as a pre-commit hook,   in your workflow. In turn, you can combine CodeGuru Reviewer with Dynamic Application Security Testing (DAST) and Software Composition Analysis (SCA) tools to achieve a hybrid application security testing method that helps you combine the inside-out and outside-in testing approaches, cross-reference results, and detect vulnerabilities that both exist and are exploitable.

If you need hands-on keyboard support, then AWS Professional Services can help implement this solution in your enterprise, and introduce you to our AWS DevOps services and offerings.

About the authors:

Bineesh Ravindran

Bineesh Ravindran

Bineesh is Solutions Architect at Amazon Webservices (AWS) who is passionate about technology and love to help customers solve problems. Bineesh has over 20 years of experience in designing and implementing enterprise applications. He works with AWS partners and customers to provide them with architectural guidance for building scalable architecture and execute strategies to drive adoption of AWS services. When he’s not working, he enjoys biking, aquascaping and playing badminton..

Martin Schaef

Martin Schaef

Martin Schaef is an Applied Scientist in the AWS CodeGuru team since 2017. Prior to that, he worked at SRI International in Menlo Park, CA, and at the United Nations University in Macau. He received his PhD from University of Freiburg in 2011.

Building GitHub with Ruby and Rails

Post Syndicated from Adam Hess original https://github.blog/2023-04-06-building-github-with-ruby-and-rails/

Since the beginning, GitHub.com has been a Ruby on Rails monolith. Today, the application is nearly two million lines of code and more than 1,000 engineers collaborate on it daily. We deploy as often as 20 times a day, and nearly every week one of those deploys is a Rails upgrade.

Upgrading Rails weekly

Every Monday a scheduled GitHub Action workflow triggers an automated pull request, which bumps our Rails version to the latest commit on the Rails main branch for that day. All our builds run on this new version of Rails. Once all the builds pass, we review the changes and ship it the next day. Starting an upgrade on Monday you will already have an open pull request linking the changes this Rails upgrade proposes and a completed build.

This process is a far stretch from how we did Rails upgrades only a few years ago. In the past, we spent months migrating from our custom fork of Rails to a newer stable release, and then we maintained two Gemfiles to ensure we’d remain compatible with the upcoming release. Now, upgrades take under a week. You can read more about this process in this 2018 blog post. We work closely with the community to ensure that each Rails release is running in production before the release is officially cut.

There are real tangible benefits to running the latest version of Rails:

  • We give developers at GitHub the very best version of our tools by providing the latest version of Rails. This ensures users can take advantage of all the latest improvements including better database connection handling, faster view rendering, and all the amazing work happening in Rails every day.
  • We have removed nearly all of our Rails patches. Since we are running on the latest version of Rails, instead of patching Rails and waiting for a change, developers can suggest the patch to Rails itself.
  • Working on Rails is now easier than ever to share with your team! Instead of telling your team you found something in Rails that will be fixed in the next release, you can work on something in Rails and see it the following week!
  • Maintaining more up-to-date dependencies gives us a better security posture. Since we already do weekly upgrades, adding an upgrade when there is a security advisory is standard practice and doesn’t require any extra work.
  • There are no “big bang” migrations. Since each Rails upgrade incorporates only a small number of changes, it’s easier to understand and dig into if there are incompatibilities. The worst issues from a tough upgrade are unexpected changes from an unknown location. These issues can be mitigated by this upgrade strategy.
  • Catching bugs in the main branch and contributing back strengthens our engineering team and helps our developers deepen their expertise and understanding of our application and its dependencies.

Testing Ruby continuously

Naturally, we have a similar process for Ruby upgrades. In February 2022, shortly after upgrading to Ruby 3.1, we started building and testing Ruby shas from 3.2-alpha in a parallel build. When CI runs for the GitHub Rails application, two versions of the builds run: one build uses the Ruby version we are running in production and one uses the latest Ruby commit including the latest changes in Ruby, which we update weekly.

While we build Ruby with every change, GitHub only ships numbered Ruby versions to production. The builds help us maintain compatibility with the upcoming Ruby version and give us insight into what Ruby changes are coming.

In early December 2022, with CI giving us confidence we were compatible before the usual Christmas release of Ruby 3.2, we were able to test Ruby release candidates with a portion of production traffic and give the Ruby team insights into any changes we noticed. For example, we could reproduce an increase in allocations due to keyword argument handling that was fixed before the release of Ruby 3.2 due to this process. We also identified a subtle change when to_str and #to_i is applied. Because we upgrade all the time, identifying and resolving these issues was standard practice.

This weekly upgrade process for Ruby allowed us to upgrade our monolith from Ruby 3.1 to Ruby 3.2 within a month of release. After all, we had already tested and run it in production! At this point, this was the fastest Ruby upgrade we had ever done. We broke this record with the release of Ruby 3.2.1, which we adopted on release day.

This upgrade process has proved to be invaluable for our collaboration with the Ruby core team. A nice side effect of having these builds is that we are able to easily test and profile our own Ruby changes before we suggest them upstream. This can make it easier for us to identify regressions in our own application and better understand the impact of changes on a production environment.

Should I do it, too?

Our ability to do frequent Ruby and Rails upgrades is due to some engineering maturity at GitHub. Doing weekly Rails upgrades requires a thorough test suite with many great engineers working to maintain and improve it. We also gain confidence from having great test environments along with progressive rollout deploys. Our test suite is likely to catch problems, and if it doesn’t, we are confident we will catch it during deploy before it reaches customers.

If you have these tools, you should also upgrade Rails weekly and test using the latest Ruby. GitHub is a better Rails app because of it and it has enabled work from my team that I am really proud of.

Ruby champion Eileen Uchitelle explains why investing in Rails is important in her Rails Conf 2022 Keynote:

Ultimately, if more companies treated the framework as an extension of the application, it would result in higher resilience and stability. Investment in Rails ensures your foundation will not crumble under the weight of your application. Treating it as an unimportant part of your application is a mistake and many, many leaders make this mistake.

Thanks to contributions from people around the world, using Ruby is better than ever. GitHub, along with hundreds of other companies, benefits from Ruby and Rails continuing to improve. Upgrading regularly and investing in our frameworks is a staple of the work we do on the Ruby Architecture team at GitHub. We are always grateful for the Ruby community and glad that we can give back in a way that improves our application and tools as much as it improves them for everyone else.

Publish Amazon DevOps Guru Insights to ServiceNow for Incident Management

Post Syndicated from Abdullahi Olaoye original https://aws.amazon.com/blogs/devops/publish-amazon-devops-guru-insights-to-servicenow-for-incident-management/

Amazon DevOps Guru is a fully managed AIOps service that uses machine learning (ML) to quickly identify when applications are behaving outside of their normal operating patterns and generates insights from its findings. These insights generated by Amazon DevOps Guru can be used to alert on-call teams to react to anomalies for mission critical workloads. Various customers already utilize Incident management systems like ServiceNow to identify, analyze and resolve critical incidents which could impact business operations. ServiceNow is an IT Service Management (ITSM) platform that enables enterprise organizations to improve operational efficiencies. Among its products is Incident Management which provides a single pane view to customers and allows customers restore services and resolve issues quickly.

This blog post will show you how to integrate Amazon DevOps Guru insights with ServiceNow to automatically create and manage Incidents. We will demonstrate how an insight generated by Amazon DevOps Guru for an anomaly can automatically create a ServiceNow Incident, update the incident when there are new anomalies or recommendations from Amazon DevOps Guru, and close the ServiceNow Incident once the insight is resolved by Amazon DevOps Guru.

Overview of solution

This solution uses a combination of event driven architecture and Serverless technologies, to integrate DevOps Guru insights with ServiceNow. When an Amazon DevOps Guru insight is created, an Amazon EventBridge rule is used to capture the insight as an event and routed to an AWS Lambda Function target. The lambda function interacts with ServiceNow using a REST API to create, update and close an incident for corresponding DevOps Guru events captured by EventBridge.

The EventBridge rule can be customized to capture all DevOps Guru insights or narrowed down to specific insights. In this blog, we will be capturing all DevOps Guru insights and will be performing actions on ServiceNow for the below DevOps Guru events:

  • DevOps Guru New Insight Open
  • DevOps Guru New Anomaly Association
  • DevOps Guru Insight Severity Upgraded
  • DevOps Guru New Recommendation Created
  • DevOps Guru Insight Closed

    Serverless architecture where Amazon EventBridge receives Amazon DevOps Guru insights and using Lambda function transforms and posts to ServiceNow REST API to create, update, and resolve incidents

    Figure 1: Amazon DevOps Guru Integration with ServiceNow using Amazon EventBridge and AWS Lambda

Solution Implementation Steps

Prerequisites

Before you deploy the solution and proceed with this walkthrough, you should have the following prerequisites:

  • Gather the hostname for your ServiceNow cloud instance. If you do not have a ServiceNow instance, you can request a developer instance through the ServiceNow Developer page.
  • Gather the credentials of a ServiceNow user who has permissions to make REST API calls to ServiceNow, specifically to the Table API. If you don’t have a user provisioned, you can create one by following the steps in Getting started with the REST API in the ServiceNow documentation.
  • Create a secret in Secrets Manager to store the ServiceNow credentials created in previous step. You can choose any name for the secret but it should have two key/value pairs, one for username and other for password.
  • Enable DevOps Guru for your applications by following these steps or you can follow this blog to deploy a sample serverless application that can be used to generate DevOps Guru insights for anomalies detected in the application.
  • Install and set up SAM CLI – Install the SAM CLI
  • Download and set up Java. The version should be matching to the runtime that you defined in the SAM template.yaml Serverless function configuration – Install the Java SE Development Kit 11
  • Maven – Install Maven
  • Docker – Install Docker community edition

You have two options to deploy this solution, one options is to deploy from the AWS Serverless Repository and other from the Command Line Interface (CLI).

Option 1: Deploy sample ServiceNow Connector App from AWS Serverless Repository

The DevOps Guru ServiceNow Connector application is available in the AWS Serverless Application Repository which is a managed repository for serverless applications. The application is packaged with an AWS Serverless Application Model (SAM) template, definition of the AWS resources used and the link to the source code. Follow the steps below to quickly deploy this serverless application in your AWS account.

Follow the steps below to quickly deploy this serverless application in your AWS account:

  • Login to the AWS management console of the account to which you plan to deploy this solution.
  • Go to the DevOps Guru ServiceNow Connector application in the AWS Serverless Repository and click on “Deploy”.

    DevOps Guru ServiceNow Connector application page on the AWS Serverless Application Repository with the Deploy button to quickly deploy this solution to your AWS account.

    Figure 2: Deploy solution through AWS Serverless Repository

  • The Lambda application deployment screen will be displayed where you can enter the ServiceNow hostname (do not include the https prefix) and the Secret Name you created in the prerequisite steps. Click on the ‘Deploy’ button.

    Lambda Application Deployment page to enter the ServiceNow hostname and Secret name needed for interacting with your ServiceNow instance before deploying the solution.

    Figure 3: AWS Lambda Application Settings

  • After successful deployment the AWS Lambda Application page will display the “Create complete” status for the serverlessrepo-DevOps-Guru-ServiceNow-Connector application. The CloudFormation template creates four resources:
    1. Lambda function which has the logic to integrate to the ServiceNow
    2. Event Bridge rule for the DevOps Guru Insights
    3. Lambda permission
    4. IAM role
  • 5.     Now you can skip Option 2 and follow the steps in the “Test the Solution” section to trigger some DevOps Guru insights and validate that the incidents are created and updated in ServiceNow.

Option 2: Build and Deploy sample ServiceNow Connector App using AWS SAM Command Line Interface

As you have seen above, you can directly deploy the sample serverless application from the Serverless Repository with one click deployment. Alternatively, you can choose to clone the github source repository and deploy using the SAM CLI from your terminal.

The Serverless Application Model Command Line Interface (SAM CLI) is an extension of the AWS CLI that adds functionality for building and testing serverless applications. The CLI provides commands that enable you to verify that AWS SAM template files are written according to the specification, invoke Lambda functions locally, step-through debug Lambda functions, package and deploy serverless applications to the AWS Cloud, and so on. For details about how to use the AWS SAM CLI, including the full AWS SAM CLI Command Reference, see AWS SAM reference – AWS Serverless Application Model.

Before you proceed, make sure you have completed the Prerequisites section in the beginning which should set up the AWS SAM CLI, Maven and Java on your local terminal. You also need to install and set up Docker to run your functions in an Amazon Linux environment that matches Lambda.

Follow the steps below to build and deploy this serverless application using AWS SAM CLI in your AWS account:

  • Clone the source code from the github repo
$ git clone https://github.com/aws-samples/amazon-devops-guru-connector-servicenow.git
  • Before you build the resources defined in the SAM template, you can use the below validate command which will run cfn-lint validations on your SAM JSON/YAML template
$ sam validate –-lint --template template.yaml

3.     Build the application with SAM CLI

$ cd amazon-devops-guru-connector-servicenow
$ sam build

If everything is set up correctly, you should have a success message like shown below:

Build Succeeded

Built Artifacts : .aws-sam/build
Built Template : .aws-sam/build/template.yaml

Commands you can use next
=========================
[*] Validate SAM template: sam validate
[*] Invoke Function: sam local invoke
[*] Test Function in the Cloud: sam sync --stack-name {{stack-name}} --watch
[*] Deploy: sam deploy –guided

4.  Deploy the application with SAM CLI

$ sam deploy –-guided

This command will package and deploy your application to AWS, with a series of prompts that you should respond to as shown below:

  • Stack Name: The name of the stack to deploy to CloudFormation. This should be unique to your account and region, and a good starting point would be something matching your project name – amazon-devops-guru-connector-servicenow
  • AWS Region: The AWS region you want to deploy your application to.
  • Parameter ServiceNowHost []: The ServiceNow host name/instance URL you set up. Example: dev92031.service-now.com
  • Parameter SecretName []: The secret name that you set up for ServiceNow credentials in the Prerequisites.
  • Confirm changes before deploy: If set to yes, any change sets will be shown to you before execution for manual review. If set to no, the AWS SAM CLI will automatically deploy application changes.
  • Allow SAM CLI IAM role creation: Many AWS SAM templates, including this example, create AWS IAM roles required for the AWS Lambda function(s) included to access AWS services. By default, these are scoped down to minimum required permissions. To deploy an AWS CloudFormation stack which creates or modifies IAM roles, the CAPABILITY_IAM value for capabilities must be provided. If permission isn’t provided through this prompt, to deploy this example you must explicitly pass --capabilities CAPABILITY_IAM to the sam deploy command.
  • Disable rollback [y/N]: If set to Y, preserves the state of previously provisioned resources when an operation fails.
  • Save arguments to configuration file (samconfig.toml): If set to yes, your choices will be saved to a configuration file inside the project, so that in the future you can just re-run sam deploy without parameters to deploy changes to your application.

After you enter your parameters, you should see something like this if you have provided Y to view and confirm ChangeSets. Proceed here by providing ‘Y’ for deploying the resources.

Initiating deployment
=====================
Uploading to amazon-devops-guru-connector-servicenow/46bb4841f8f37fd41d3f40f86f31c4d7.template 1918 / 1918 (100.00%)

Waiting for changeset to be created..
CloudFormation stack changeset
-----------------------------------------------------------------------------------------------------------------------------------------------------
Operation LogicalResourceId ResourceType Replacement
-----------------------------------------------------------------------------------------------------------------------------------------------------
+ Add FunctionsDevOpsGuruPermission AWS::Lambda::Permission N/A
+ Add FunctionsDevOpsGuru AWS::Events::Rule N/A
+ Add FunctionsRole AWS::IAM::Role N/A
+ Add Functions AWS::Lambda::Function N/A
-----------------------------------------------------------------------------------------------------------------------------------------------------

Changeset created successfully. arn:aws:cloudformation:us-east-1:123456789012:changeSet/samcli-deploy1669232233/7c97b7f5-369d-400d-89cd-ebabefaa0b57

Previewing CloudFormation changeset before deployment
======================================================
Deploy this changeset? [y/N]:

Once the deployment succeeds, you should be able to see the successful creation of your resources

CloudFormation events from stack operations (refresh every 0.5 seconds)
-----------------------------------------------------------------------------------------------------------------------------------------------------
ResourceStatus ResourceType LogicalResourceId ResourceStatusReason
-----------------------------------------------------------------------------------------------------------------------------------------------------
CREATE_IN_PROGRESS AWS::CloudFormation::Stack amazon-devops-guru-connector- User Initiated
servicenow
CREATE_IN_PROGRESS AWS::IAM::Role FunctionsRole -
CREATE_IN_PROGRESS AWS::IAM::Role FunctionsRole Resource creation Initiated
CREATE_COMPLETE AWS::IAM::Role FunctionsRole -
CREATE_IN_PROGRESS AWS::Lambda::Function Functions -
CREATE_IN_PROGRESS AWS::Lambda::Function Functions Resource creation Initiated
CREATE_COMPLETE AWS::Lambda::Function Functions -
CREATE_IN_PROGRESS AWS::Events::Rule FunctionsDevOpsGuru -
CREATE_IN_PROGRESS AWS::Events::Rule FunctionsDevOpsGuru Resource creation Initiated
CREATE_COMPLETE AWS::Events::Rule FunctionsDevOpsGuru -
CREATE_IN_PROGRESS AWS::Lambda::Permission FunctionsDevOpsGuruPermission -
CREATE_IN_PROGRESS AWS::Lambda::Permission FunctionsDevOpsGuruPermission Resource creation Initiated
CREATE_COMPLETE AWS::Lambda::Permission FunctionsDevOpsGuruPermission -
CREATE_COMPLETE AWS::CloudFormation::Stack amazon-devops-guru-connector- -
servicenow
-----------------------------------------------------------------------------------------------------------------------------------------------------

Successfully created/updated stack - amazon-devops-guru-connector-servicenow in us-east-1

You can also use the below command to list the resources deployed by passing in the stack name.

$ sam list resources --stack-name amazon-devops-guru-connector-servicenow

You can also choose to test and debug your function locally with sample events using the SAM CLI local functionality. Test a single function by invoking it directly with a test event. An event is a JSON document that represents the input that the function receives from the event source. Refer the Invoking Lambda functions locally – AWS Serverless Application Model link here for more details.

Follow the below steps for testing the lambda with the SAM CLI local. You have to create an env.json file with the correct values for your ServiceNow Host and SecretManager secret name that was created in the previous step.

  • Make sure you have created the AWS Secrets Manager secret with the desired name as mentioned in the prerequisites, which should be used here for SECRET_NAME.
  • Create env.json as below, by replacing the values for SERVICE_NOW_HOST and SECRET_NAME with your real value. These will be set as the local Lambda execution environment variables.
{"Parameters": {"SERVICE_NOW_HOST": "SNOW_HOST","SECRET_NAME": "SNOW_CREDS"}}
  • Run the command below to validate locally that with a sample DevOps Guru payload, to trigger Lambda locally and invoke. Remember for this to work, you should have Docker instance running and also the Secret Name created in your AWS account.
$ sam local invoke Functions --event Functions/src/test/Events/CreateIncident.json --env-vars Functions/src/test/Events/env.json

Once you are done with the above steps, move on to “Test the Solution” section below to trigger sample DevOps Guru insights and validate that the incidents are created and updated in ServiceNow.

Test the Solution

To test the solution, we will simulate a DevOps Guru insight. You can also simulate an insight by following the steps in this blog. After an anomaly is detected in the application, DevOps Guru creates an insight as seen below.

Sample DevOps Guru insights page with anomalous behavior of DynamoDB ThrottledRequests from the application deployed with the workshop link.

Figure 4: DevOps Guru Insight created for anomalous behavior

For the DevOps Guru insight shown above, a corresponding incident is automatically created on ServiceNow as shown below. In addition to the incident creation, any new anomalies and recommendations from DevOps Guru is also associated with the incident.

ServiceNow incident detail page with the DevOps Guru insight information.

Figure 5: Corresponding ServiceNow Incident is created for the DevOps Guru Insight

When the anomalous behavior that generated the DevOps Guru insight is resolved, DevOps Guru automatically closes the insight. The corresponding ServiceNow incident that was created for the insight is also closed as seen below

ServiceNow incident Notes section showing Incident as resolved due to the insight being closed in Amazon DevOps Guru.

Figure 6: ServiceNow Incident created for DevOps Guru Insight is resolved due to insight closure

Cleaning up

To avoid incurring future charges, delete the resources.

To delete the sample application that you created, use the AWS CLI command below and pass the stack name you provided in the sam deploy step.

$ aws cloudformation delete-stack --stack-name amazon-devops-guru-connector-servicenow

You could also use the AWS CloudFormation Console to delete the stack:

AWS CloudFormation console with Delete option to clean up the deployed stack.

Figure 7: AWS Stack Console with Delete action

Conclusion

This blog post showcased how DevOps Guru continuously monitor resources in a particular region in your AWS account and automatically detects operational issues, predicts impending resource exhaustion, details likely cause, and recommends remediation actions. This post described a custom solution using serverless integration pattern with AWS Lambda and Amazon EventBridge which enabled integration of the DevOps Guru insights with customer’s most popular ITSM and Change management tool ServiceNow thus streamlining the Service Management governance and oversight over AWS services. Using this solution helps Customer’s with ServiceNow to improve their operational efficiencies, and get customized insights and real time incident alerts and management directly from DevOps Guru which provides a single pane of glass to restore services and systems quickly.

This solution was created to help customers who already use ServiceNow Incident Management, if you are already using Incident Manager from AWS Systems Manager, check out how that works with Amazon DevOps Guru here.

To learn more about Amazon DevOps Guru, join us for a free hands-on Immersion Day. Events are virtual and hosted at three global time zones. Register here: April 12th.

About the authors:

Abdullahi Olaoye

Abdullahi is a Senior Cloud Infrastructure Architect at AWS Professional Services where he works with enterprise customers to design and build cloud solutions that solve business challenges. When he’s not working, he enjoys travelling, watching documentaries and listening to history podcasts.

Sreenivas Ganesan

Sreenivas Ganesan is a Sr. DevOps Consultant at AWS experienced in architecting and delivering modernized DevOps solutions for enterprise customers in their journey to AWS Cloud, primarily focused on Infrastructure automation, Security and Compliance, Management and Governance, Provisioning and Orchestration. Outside of work, he enjoys watching new TV series, soccer and spending time with his family outdoors.

Mohan Udyavar

Mohan Udyavar is a Principal Technical Account Manager in the Enterprise Support organization of AWS advising customers in successfully migrating and operating their workloads on AWS. He is primarily focused on the Automotive industry providing prescriptive guidance to customers helping them improve the resilience and operational excellence posture of mission-critical applications. Outside of work, he loves cooking and working on tech projects with his son.

Enabling branch deployments through IssueOps with GitHub Actions

Post Syndicated from Grant Birkinbine original https://github.blog/2023-02-02-enabling-branch-deployments-through-issueops-with-github-actions/

At GitHub, the branch deploy model is ubiquitous and it is the standard way we ship code to production, and it has been for years. We released details about how we perform branch deployments with ChatOps all the way back in 2015.

We are able to use ChatOps to perform branch deployments for most of our repositories, but there are a few situations where ChatOps simply won’t work for us. What if developers want to leverage branch deployments but don’t have a full ChatOps stack integrated with their repositories? We wanted to set out to find a way for all developers to be able to take advantage of branch deployments with ease, right from their GitHub repository, and so the branch-deploy Action was born!

Gif demonstrating how to us the branch-deploy Action.

How Does GitHub use this Action?

GitHub primarily uses ChatOps with Hubot to facilitate branch deployments where we can. If ChatOps isn’t an option, we use this branch-deploy Action instead. The majority of our use cases include Infrastructure as Code (IaC) repositories where we use Terraform to deploy infrastructure changes. GitHub uses this Action in many internal repositories and so does npm. There are also many other public, open source, and corporate organizations adopting this Action, as well, to help ship their code to production!

Understanding the branch deploy model

Before we dive into the branch-deploy Action, let’s first understand what the branch deploy model is and why it is so useful.

To really understand the branch deploy model, let’s first take a look at a traditional deploy → merge model. It goes like this:

  1. Create a branch.
  2. Add commits to your branch.
  3. Open a pull request.
  4. Gather feedback plus peer reviews.
  5. Merge your branch.
  6. A deployment starts from the main branch.
Diagram outlining the steps of the traditional deploy model, enumerated in the numbered list above.

Now, let’s take a look at the branch deploy model:

  1. Create a branch.
  2. Add commits to your branch.
  3. Open a pull request.
  4. Gather feedback plus peer reviews.
  5. Deploy your change.
  6. Validate.
  7. Merge your branch to the main / master branch.
Diagram outlining the steps of the branch deploy model, enumerated in the list above.

The merge deploy model is inherently riskier because the main branch is never truly a stable branch. If a deployment fails, or we need to roll back, we follow the entire process again to roll back our changes. However, in the branch deploy model, the main branch is always in a “good” state and we can deploy it at any time to revert the deployment from a branch deploy. In the branch deploy model, we only merge our changes into main once the branch has been successfully deployed and validated.

Note: this is sometimes referred to as the GitHub flow.

Key concepts

Key concepts of the branch deploy model:

  • The main branch is always considered to be a stable and deployable branch.
  • All changes are deployed to production before they are merged to the main branch.
  • To roll back a branch deployment, you deploy the main branch.

By now you may be sold on the branch deploy methodology. How do we implement it? Introducing IssueOps with GitHub Actions!

IssueOps

The best way to define IssueOps is to compare it to something similar, ChatOps. You may be familiar with the concept, ChatOps, already; if not, here is a quick definition:

ChatOps is the process of interacting with a chat bot to execute commands directly in a chat platform. For example, with ChatOps you might do something like .ping example.org to check the status of a website.

IssueOps adopts the same mindset but through a different medium. Rather than using a chat service (Discord, Slack, etc.) to invoke the commands we use comments on a GitHub Issue or pull request. GitHub Actions is the runtime that executes our desired logic when an IssueOps command is invoked.

GitHub Actions

How does it work? This section will go into detail about how this Action works and hopefully inspire you to leverage it in your own projects. The full source code and further documentation can be found on GitHub.

Let’s walk through the process using the demo configuration of a branch-deploy Action below.

1. Create this file under .github/workflows/branch-deploy.yml in your GitHub repository:

name: "branch deploy demo"

# The workflow will execute on new comments on pull requests - example: ".deploy" as a comment
on:
  issue_comment:
    types: [created]

jobs:
  demo:
    if: ${{ github.event.issue.pull_request }} # only run on pull request comments (no need to run on issue comments)
    runs-on: ubuntu-latest
    steps:
      # Execute IssueOps branch deployment logic, hooray!
      # This will be used to "gate" all future steps below and conditionally trigger steps/deployments
      - uses: github/[email protected] # replace X.X.X with the version you want to use
        id: branch-deploy # it is critical you have an id here so you can reference the outputs of this step
        with:
          trigger: ".deploy" # the trigger phrase to look for in the comment on the pull request

      # Run your deployment logic for your project here - examples seen below

      # Checkout your project repository based on the ref provided by the branch-deploy step
      - uses: actions/[email protected]
        if: ${{ steps.branch-deploy.outputs.continue == 'true' }} # skips if the trigger phrase is not found
        with:
          ref: ${{ steps.branch-deploy.outputs.ref }} # uses the detected branch from the branch-deploy step

      # Do some fake "noop" deployment logic here
      # conditionally run a noop deployment
      - name: fake noop deploy
        if: ${{ steps.branch-deploy.outputs.continue == 'true' && steps.branch-deploy.outputs.noop == 'true' }} # only run if the trigger phrase is found and the branch-deploy step detected a noop deployment
        run: echo "I am doing a fake noop deploy"

      # Do some fake "regular" deployment logic here
      # conditionally run a regular deployment
      - name: fake regular deploy
        if: ${{ steps.branch-deploy.outputs.continue == 'true' && steps.branch-deploy.outputs.noop != 'true' }} # only run if the trigger phrase is found and the branch-deploy step detected a regular deployment
        run: echo "I am doing a fake regular deploy"

2. Trigger a noop deploy by commenting .deploy noop on a pull request.

A noop deployment is detected so this action outputs the noop variable to true. If you have the correct permissions to execute the IssueOps command, the action outputs the continue variable to true as well. The step named fake noop deploy runs, while the fake regular deploy step is skipped.

3. After your noop deploy completes, you would typically run .deploy to execute the actual deployment, fake regular deploy.

Features

The best part about the branch-deploy Action is that it is highly customizable for any deployment targets and use cases. Here are just a few of the features that this Action comes bundled with:

  • 🔍 Detects when IssueOps commands are used on a pull request.
  • 📝 Configurable: choose your command syntax, environment, noop trigger, base branch, reaction, and more.
  • ✅ Respects your branch protection settings configured for the repository.
  • 💬 Comments and reacts to your IssueOps commands.
  • 🚀 Triggers GitHub deployments for you with simple configuration.
  • 🔓 Deploy locks to prevent multiple deployments from clashing.
  • 🌎 Configurable environment targets.

The repository also comes with a usage guide, which can be referenced by you and your team to quickly get familiar with available IssueOps commands and how they work.

Examples

The branch-deploy Action is customizable and suited for a wide range of projects. Here are a few examples of how you can use the branch-deploy Action to deploy to different services:

Conclusion

If you are looking to enhance your DevOps experience, have better reliability in your deployments, or ship changes faster, then branch deployments are for you!

Hopefully, you now have a better understanding of why the branch deploy model is a great option for shipping your code to production.

By using GitHub plus Actions plus IssueOps you can leverage the branch deploy model in any repository!

Source code: GitHub

AWS Local Zones and AWS Outposts, choosing the right technology for your edge workload

Post Syndicated from Sheila Busser original https://aws.amazon.com/blogs/compute/aws-local-zones-and-aws-outposts-choosing-the-right-technology-for-your-edge-workload/

This blog post is written by Joe Sacco, Senior Technical Account Manager.

The AWS Global Cloud Infrastructure includes 30 Launched Regions, 96 Availability Zones (AZs), 410+ Points of Presence with 400+ Edge Locations, and 13 Regional Edge Caches.  With over 200 AWS services, most customer workloads can run in the AWS Regions. However, for some location-sensitive workloads with low-latency or data residency requirements, and when an AWS Region isn’t close enough, AWS offers two additional infrastructure options: AWS Local Zones and AWS Outposts. Although Local Zones and Outposts solve for similar problems, we’ll review use cases as well as the services and features available that can help you decide which offering best suits your needs.

Let’s start with an overview of Local Zones and Outposts.

What are Local Zones?

Local Zones are a new type of infrastructure deployment that places AWS compute, storage, database, and other select AWS services in large metropolitan areas closer to end users. This gives you access to single-digit millisecond latency with the use of AWS Direct Connect and the ability to meet data residency requirements. Local Zones are also connected to their parent Region via AWS’s redundant and high bandwidth private network. This gives applications running in Local Zones fast, secure, and seamless access to a complete list of services in the parent Region.

Unlike Outposts, which you deploy within your datacenter or a co-location of your choice, Local Zones are owned, managed, and operated by AWS. Local Zones eliminate the need for you to manage power, connectivity, and capacity. Furthermore, you can provision workloads on a Local Zone from your AWS Management Console just as you would for AZs and Regions today.

AWS Local Zones how it worksWhat is Outposts?

Outposts is a family of fully managed solutions delivering AWS infrastructure and services to virtually any on-premises or edge location for a truly consistent hybrid experience. Outposts lets you run some AWS services locally and connect to a broad range of services available in the local AWS Region. Outposts comes in two types of offerings: Outposts rack and Outposts servers, with which you can run applications and workloads on-premises using the same AWS infrastructure, services, tools, and APIs as in AWS Regions.

The Outposts rack is available as an industry standard 42U form factor. It provides the same AWS infrastructure, services, tools, and APIs to your data center or co-location space  that you would find in an AWS Region.

Outposts Rack

The Outposts servers come in a 1U or 2U form factor and are designed for locations that have limited space or smaller capacity requirements. Both support different compute instances, as detailed in the Outposts servers feature page.

Outposts ServersCustomer use cases

Now that we have an overview of both Local Zones and Outposts service offerings, let’s dive into use cases, the differences between them, and how your business can leverage each to accomplish your workloads requirements.

Low latency

Customers today require low latency computing for workloads, such as medical imaging, transaction processing for Enterprise Resource Planning (ERP) applications, enterprise migration with hybrid architecture, real-time multiplayer gaming, telco network function virtualization, and regulated gaming workloads.

Outposts can meet ultra-low latency requirements. This is accomplished by bringing AWS services on premises and to the edge at Outpost Sites. An Outpost site is the physical location where your Outpost operates, and it can be local within one of your data centers or at a co-location facility of your choice.

When accessing from within the same metro, Local Zones will provide you with a low, single millisecond latency experience when communicating with your applications. Latency between Local Zones and AWS Regions or Local Zones and on-premises environments varies, and these will depend on how close the nearest Local Zone is as well as the type of modality used for the connection (Public Internet, VPN, and AWS Direct Connect). You should always choose the closest Local Zone location to achieve the lowest possible latency. For use cases such as mobile gaming, you can utilize Local Zones by deploying your applications to a Local Zone location nearest to your end users. Local Zones are generally available in 17 metros across the US, 4 outside the US, and we are continuing to launch Local Zones in 30 cities across 25 countries. Check out updates for more general availability of Local Zones.

Data residency

On occasion, data must remain in a specific geographic region for regulatory or information security reasons. Healthcare and other regulated industries, such as financial services or Oil & Gas, have specific data residency requirements.

Outposts helps meet a customer’s data residency requirements because it’s installed on premises and essentially brings AWS to where the data currently resides. This allows you to pick and control where your workloads run, and where your data will stay. Check out the full list of countries and territories where Outposts is available on the FAQs page of Outposts rack and the FAQs page of Outposts servers.

Local Zones bring AWS closer or within a customer’s geographic boundary in a fully AWS owned and operated mode. Although Local Zones can help meet data residency use cases in some scenarios, data residency requirements vary depending on the jurisdictions. Therefore, you should work closely with your compliance and information security teams when choosing the Local Zone location in which to deploy your regulated workloads.

Migration and modernization

When trying to migrate to the cloud and modernize your stack, some workloads can be challenging. Often there are on-premises applications which are difficult to move into Regions due to latency-sensitive system intermittencies between their various components. As dependencies arise, you may choose to segment these migrations into smaller pieces. Then this will require latency-sensitive connectivity between the various parts of the application.

Outposts and Local Zones both allow for a gradual migration and modernization of your stack. You can choose to migrate parts of their workloads while still maintaining latency-sensitive connectivity between components until the entirety is ready to move.

Factors in selecting Local Zones or Outposts

Choosing between Local Zones and Outposts will depend on the following factors, and you should examine all of them together when selecting a service for your use case.

  1. Latency requirements

Local Zones can achieve low single millisecond latency when accessing within the same metro. On the other hand, Outposts can achieve ultra-low latency requirements when deployed within your datacenter or at a co-location facility of your choice. When selecting one over the other, you must work backward from your goal and workload requirements.

If you’re conducting a migration and modernization strategy which requires ultra-low latency between a workloads application and database tiers that are difficult to migrate to the AWS Regions, then Outposts would be the right solution for you.

Alternatively, if your workload involves streaming live broadcasts to end users which requires low single millisecond latency, but your end users are located where an AWS Region isn’t available, then Local Zones distributed across various metros would work best to serve your content.

  1. Availability of services needed to support your workload

Local Zones and Outposts differ with their list of supported AWS services, and you must review your workload’s service requirements when determining the best fit for you. For example, if a customer has a computer vision workload that requires storing and retrieving large volumes of images locally using Amazon Simple Storage Service (Amazon S3), then Outposts and certain Local Zones meet this requirement while other Local Zones don’t. Learn how you can use Amazon S3 on Outposts for computer vision workloads.

Outposts rack and servers support different sets of AWS services locally. You can view comparisons between them, or visit the Outposts servers and Outposts rack feature sites for more details.

Local Zones’ features vary depending on the location in which you choose to deploy. You can view more details and a full list of supported features and services per location on our Local Zones features page.

  1. Investment and management of infrastructure on-premises

Management of the infrastructure and prerequisites are another factor when considering which AWS service best suits your needs.

Outposts is ordered through AWS, and it requires installation in a customer’s on-premises datacenter or co-location provider of their choice. Outposts rack installation is handled by AWS, while Outposts servers installation is done by the customer or a third-party of their choosing. There are power and redundant networking requirements for the Outpost Site, as well as a required subscription to AWS Enterprise Support or On-Ramp Support.

Local Zones infrastructure is fully-managed by AWS, including the power, networking, and capacity. This reduces operational management as well as the overhead cost for customers. An Enterprise support agreement isn’t required to utilize Local Zones.

You should always choose Regions or Local Zones if your use case allows, and use Outposts when a Region or Local Zone isn’t a good fit. If both Outposts and Local Zones fit a customer’s use case and requirements, then Local Zones will be the preferred choice.

  1. Regulations, compliance, and information security

If a Local Zone is either unavailable or unable to meet your residency requirements within your geographic boundary consider Outposts, which can be deployed to a data center or co-location facility of your choice. Data residency requirements can be a factor based on your industry and the regulations to which your workload must adhere. Furthermore, you should work closely with your compliance and information security teams when choosing between Local Zones or Outposts.

Conclusion

Whether you’re dealing with latency-sensitive applications, data residency requirements, or a migration and modernization strategy, AWS provides options and flexibility for you to leverage the same AWS infrastructure, services, APIs, and tools to metro areas and on-premises locations with Local Zones and Outposts.

The decision of which technology to use will depend on several factors that we discussed above. You must work across teams within your organization to make sure that the latency requirements (low single millisecond latency within a metro for Local Zones vs the ultra low latency of Outposts when deployed close to or within your datacenter), data reseidency needs, installation prerequisites, and availability of services to support your workload are met.

Once these factors are taken into account, and you have made a choice, visit our product pages for Outposts and Local Zones with information on how you can get started.

Analyze Amazon Cognito advanced security intelligence to improve visibility and protection

Post Syndicated from Diana Alvarado original https://aws.amazon.com/blogs/security/analyze-amazon-cognito-advanced-security-intelligence-to-improve-visibility-and-protection/

As your organization looks to improve your security posture and practices, early detection and prevention of unauthorized activity quickly becomes one of your main priorities. The behaviors associated with unauthorized activity commonly follow patterns that you can analyze in order to create specific mitigations or feed data into your security monitoring systems.

This post shows you how you can analyze security intelligence from Amazon Cognito advanced security features logs by using AWS native services. You can use the intelligence data provided by the logs to increase your visibility into sign-in and sign-up activities from users, this can help you with monitoring, decision making, and to feed other security services in your organization, such as a web application firewall or security information and event management (SIEM) tool. The data can also enrich available security feeds like fraud detection systems, increasing protection for the workloads that you run on AWS.

Amazon Cognito advanced security features overview

Amazon Cognito provides authentication, authorization, and user management for your web and mobile apps. Your users can sign in to apps directly with a user name and password, or through a third party such as social providers or standard enterprise providers through SAML 2.0/OpenID Connect (OIDC). Amazon Cognito includes additional protections for users that you manage in Amazon Cognito user pools. In particular, Amazon Cognito can add risk-based adaptive authentication and also flag the use of compromised credentials. For more information, see Checking for compromised credentials in the Amazon Cognito Developer Guide.

With adaptive authentication, Amazon Cognito examines each user pool sign-in attempt and generates a risk score for how likely the sign-in request is from an unauthorized user. Amazon Cognito examines a number of factors, including whether the user has used the same device before or has signed in from the same location or IP address. A detected risk is rated as low, medium, or high, and you can determine what actions should be taken at each risk level. You can choose to allow or block the request, require a second authentication factor, or notify the user of the risk by email. Security teams and administrators can also submit feedback on the risk through the API, and users can submit feedback by using a link that is sent to the user’s email. This feedback can improve the risk calculation for future attempts.

To add advanced security features to your existing Amazon Cognito configuration, you can get started by using the steps for Adding advanced security to a user pool in the Amazon Cognito Developer Guide. Note that there is an additional charge for advanced security features, as described on our pricing page. These features are applicable only to native Amazon Cognito users; they aren’t applicable to federated users who sign in with an external provider.

Solution architecture

Figure 1: Solution architecture

Figure 1: Solution architecture

Figure 1 shows the high-level architecture for the advanced security solution. When an Amazon Cognito sign-in event is recorded by AWS CloudTrail, the solution uses an Amazon EventBridge rule to send the event to an Amazon Simple Queue Service (Amazon SQS) queue and batch it, to then be processed by an AWS Lambda function. The Lambda function uses the event information to pull the sign-in security information and send it as logs to an Amazon Simple Storage Service (Amazon S3) bucket and Amazon CloudWatch Logs.

Prerequisites and considerations for this solution

This solution assumes that you are using Amazon Cognito with advanced security features already enabled, the solution does not create a user pool and does not activate the advanced security features on an existing one.

The following list describes some limitations that you should be aware of for this solution:

  1. This solution does not apply to events in the hosted UI, but the same architecture can be adapted for that environment, with some changes to the events processor.
  2. The Amazon Cognito advanced security features support only native users. This solution is not applicable to federated users.
  3. The admin API used in this solution has a default rate limit of 30 requests per second (RPS). If you have a higher rate of authentication attempts, this API call might be throttled and you will need to implement a re-try pattern to confirm that your requests are processed.

Implement the solution

You can deploy the solution automatically by using the following AWS CloudFormation template.

Choose the following Launch Stack button to launch a CloudFormation stack in your account and deploy the solution.

Select this image to open a link that starts building the CloudFormation stack

You’ll be redirected to the CloudFormation service in the US East (N. Virginia) Region, which is the default AWS Region, to deploy this solution. You can change the Region to align it to where your Cognito User Pool is running.

This template will create multiple cloud resources including, but not limited to, the following:

  • An EventBridge rule for sending the Amazon Cognito events
  • An Amazon SQS queue for sending the events to Lambda
  • A Lambda function for getting the advanced security information based on the authentication events from CloudTrail
  • An S3 bucket to store the logs

In the wizard, you’ll be asked to modify or provide one parameter, the existing Cognito user pool ID. You can get this value from the Amazon Cognito console or the Cognito API.

Now, let’s break down each component of the solution in detail.

Sending the authentication events from CloudTrail to Lambda

Cognito advanced security features supports the CloudTrail events: SignUp, ConfirmSignUp, ForgotPassword, ResendConfirmationCode, InitiateAuth and RespondToAuthChallenge. This solution will focus on the sign-in event InitiateAuth as an example.

The solution creates an EventBridge rule that will run when an event is identified in CloudTrail and send the event to an SQS queue. This is useful so that events can be batched up and decoupled for Lambda to process.

The EventBridge rule uses Amazon SQS as a target. The queue is created by the solution and uses the default settings, with the exception that Receive message wait time is set to 20 seconds for long polling. For more information about long polling and how to manually set up an SQS queue, see Consuming messages using long polling in the Amazon SQS Developer Guide.

When the SQS queue receives the messages from EventBridge, these are sent to Lambda for processing. Let’s now focus on understanding how this information is processed by the Lambda function.

Using Lambda to process Amazon Cognito advanced security features information

In order to get the advanced security features evaluation information, you need authentication details that can only be obtained by using the Amazon Cognito identity provider (IdP) API call admin_list_user_auth_events. This API call requires a username to fetch all the authentication event details for a specific user. For security reasons, the username is not logged in CloudTrail and must be obtained by using other event information.

You can use the Lambda function in the sample solution to get this information. It’s composed of three main sequential actions:

  1. The Lambda function gets the sub identifiers from the authentication events recorded by CloudTrail.
  2. Each sub identifier is used to get the user name through an API call to list_users.
  3. 3. The sample function retrieves the last five authentication event details from advanced security features for each of these users by using the admin_list_user_auth_events API call. You can modify the function to retrieve a different number of events, or use other criteria such as a timestamp or a specific time period.

Getting the user name information from a CloudTrail event

The following sample authentication event shows a sub identifier in the CloudTrail event information, shown as sub under additionalEventData. With this sub identifier, you can use the ListUsers API call from the Cognito IdP SDK to get the user name details.

{
"eventVersion": "1.XX",
"userIdentity": {
"type": "Unknown",
"principalId": "Anonymous"
},
"eventTime": "2022-01-01T11:11:11Z",
"eventSource": "cognito-idp.amazonaws.com",
"eventName": "InitiateAuth",
"awsRegion": "us-east-1",
"sourceIPAddress": "xx.xx.xx.xx",
"userAgent": "Mozilla/5.0 (xxxx)",
"requestParameters": {
"authFlow": "USER_SRP_AUTH",
"authParameters": "HIDDEN_DUE_TO_SECURITY_REASONS",
"clientMetadata": {},
"clientId": "iiiiiiiii"
},
"responseElements": {
"challengeName": "PASSWORD_VERIFIER",
"challengeParameters": {
"SALT": "HIDDEN_DUE_TO_SECURITY_REASONS",
"SECRET_BLOCK": "HIDDEN_DUE_TO_SECURITY_REASONS",
"USER_ID_FOR_SRP": "HIDDEN_DUE_TO_SECURITY_REASONS",
"USERNAME": "HIDDEN_DUE_TO_SECURITY_REASONS",
"SRP_B": "HIDDEN_DUE_TO_SECURITY_REASONS"
}
},
"additionalEventData": {
"sub": "11110b4c-1f4264cd111"
},
"requestID": "xxxxxxxx",
"eventID": "xxxxxxxxxx",
"readOnly": false,
"eventType": "AwsApiCall",
"managementEvent": true,
"recipientAccountId": "xxxxxxxxxxxxx",
"eventCategory": "Management"
}

Listing authentication events information

After the Lambda function obtains the username, it can then use the Cognito IdP API call admin_list_user_auth_events to get the advanced security feature risk evaluation information for each of the authentication events for that user. Let’s look into the details of that evaluation.

The authentication event information from Amazon Cognito advanced security provides information for each of the categories evaluated and logs the results. Those results can then be used to decide whether the authentication attempt information is useful for the security team to be notified or take action. It’s recommended that you limit the number of events returned, in order to keep performance optimized.

The following sample event shows some of the risk information provided by advanced security features; the options for the response syntax can be found in the CognitoIdentityProvider API documentation.

}
]
at the bottom, so
"AuthEvents": [
{
"EventId": "1111111”,
"EventType": "SignIn",
"CreationDate": 111111.111,
"EventResponse": "Pass",
"EventRisk": {
"RiskDecision": "NoRisk",
"CompromisedCredentialsDetected": false
},
"ChallengeResponses": [
{
"ChallengeName": "Password",
"ChallengeResponse": "Success"
}
],
"EventContextData": {
"IpAddress": "72.xx.xx.xx",
"DeviceName": "Firefox xx
"City": "Axxx",
"Country": "United States"
}
}
]

The event information that is returned includes the details that are highlighted in this sample event, such as CompromisedCredentialsDetected, RiskDecision, and RiskLevel, which you can evaluate to decide whether the information can be used to enrich other security monitoring services.

Logging the authentication events information

You can use a Lambda extensions layer to send logs to an S3 bucket. Lambda still sends logs to Amazon CloudWatch Logs, but you can disable this activity by removing the required permissions to CloudWatch on the Lambda execution role. For more details on how to set this up, see Using AWS Lambda extensions to send logs to custom destinations.

Figure 2 shows an example of a log sent by Lambda. It includes execution information that is logged by the extension, as well as the information returned from the authentication evaluation by advanced security features.

Figure 2: Sample log information sent to S3

Figure 2: Sample log information sent to S3

Note that the detailed authentication information in the Lambda execution log is the same as the preceding sample event. You can further enhance the information provided by the Lambda function by modifying the function code and logging more information during the execution, or by filtering the logs and focusing only on high-risk or compromised login attempts.

After the logs are in the S3 bucket, different applications and tools can use this information to perform automated security actions and configuration updates or provide further visibility. You can query the data from Amazon S3 by using Amazon Athena, feed the data to other services such as Amazon Fraud Detector as described in this post, mine the data by using artificial intelligence/machine learning (AI/ML) managed tools like AWS Lookout for Metrics, or enhance visibility with AWS WAF.

Sample scenarios

You can start to gain insights into the security information provided by this solution in an existing environment by querying and visualizing the log data directly by using CloudWatch Logs Insights. For detailed information about how you can use CloudWatch Logs Insights with Lambda logs, see the blog post Operating Lambda: Using CloudWatch Logs Insights.

The CloudFormation template deploys the CloudWatch Logs Insights queries. You can view the queries for the sample solution in the Amazon CloudWatch console, under Queries.

To access the queries in the CloudWatch console

  1. In the CloudWatch console, under Logs, choose Insights.
  2. Choose Select log group(s). In the drop-drown list, select the Lambda log group.
  3. The query box should show the pre-created query. Choose Run query. You should then see the query results in the bottom-right panel.
  4. (Optional) Choose Add to dashboard to add the widget to a dashboard.

CloudWatch Logs Insights discovers the fields in the auth event log automatically. As shown in Figure 3, you can see the available fields in the right-hand side Discovered fields pane, which includes the Amazon Cognito information in the event.

Figure 3: The fields available in CloudWatch Logs Insights

Figure 3: The fields available in CloudWatch Logs Insights

The first query, shown in the following code snippet, will help you get a view of the number of requests per IP, where the advanced security features have determined the risk decision as Account Takeover and the CompromisedCredentialsDetected as true.

fields @message
| filter @message like /INFO/
| filter AuthEvents.0.EventType like 'SignIn'
| filter AuthEvents.0.EventRisk.RiskDecision like "AccountTakeover" and 
AuthEvents.0.EventRisk.CompromisedCredentialsDetected =! "false"
| stats count(*) as RequestsperIP by AuthEvents.2.EventContextData.IpAddress as IP
| sort desc

You can view the results of the query as a table or graph, as shown in Figure 4.

Figure 4: Sample query results for CompromisedCredentialsDetected

Figure 4: Sample query results for CompromisedCredentialsDetected

Using the same approach and the convenient access to the fields for query, you can explore another use case, using the following query, to view the number of requests per IP for each type of event (SignIn, SignUp, and forgot password) where the risk level was high.

fields @message
| filter @message like /INFO/
| filter AuthEvents.0.EventRisk.RiskLevel like "High"
| stats count(*) as RequestsperIP by AuthEvents.0.EventContextData.IpAddress as IP, 
AuthEvents.0.EventType as EventType
| sort desc

Figure 5 shows the results for this EventType query.

Figure 5: The sample results for the EventType query

Figure 5: The sample results for the EventType query

In the final sample scenario, you can look at event context data and query for the source of the events for which the risk level was high.

fields @message
| filter @message like /INFO/
| filter AuthEvents.0.EventRisk.RiskLevel like 'High'
| stats count(*) as RequestsperCountry by AuthEvents.0.EventContextData.Country as Country
| sort desc

Figure 6 shows the results for this RiskLevel query.

Figure 6: Sample results for the RiskLevel query

Figure 6: Sample results for the RiskLevel query

As you can see, there are many ways to mix and match the filters to extract deep insights, depending on your specific needs. You can use these examples as a base to build your own queries.

Conclusion

In this post, you learned how to use security intelligence information provided by Amazon Cognito through its advanced security features to improve your security posture and practices. You used an advanced security solution to retrieve valuable authentication information using CloudTrail logs as a source and a Lambda function to process the events, send this evaluation information in the form of a log to CloudWatch Logs and S3 for use as an additional security feed for wider organizational monitoring and visibility. In a set of sample use cases, you explored how to use CloudWatch Logs Insights to quickly and conveniently access this information, aggregate it, gain deep insights and use it to take action.

To learn more, see the blog post How to Use New Advanced Security Features for Amazon Cognito User Pools.

 
If you have feedback about this post, submit comments in the Comments section below.

Want more AWS Security news? Follow us on Twitter.

Diana Alvarado

Diana Alvarado

Diana is Sr security solutions architect at AWS. She is passionate about helping customers solve difficult cloud challenges, she has a soft spot for all things logs.