Post Syndicated from Pablo Redondo Sanchez original https://aws.amazon.com/blogs/big-data/build-an-optimized-self-service-interactive-analytics-platform-with-amazon-emr-studio/
Data engineers and data scientists are dependent on distributed data processing infrastructure like Amazon EMR to perform data processing and advanced analytics jobs on large volumes of data. In most mid-size and enterprise organizations, cloud operations teams own procuring, provisioning, and maintaining the IT infrastructures, and their objectives and best practices differ from the data engineering and data science teams. Enforcing infrastructure best practices and governance controls present interesting challenges for analytics teams:
- Limited agility – Designing and deploying a cluster with the required networking, security, and monitoring configuration requires significant expertise in cloud infrastructure. This results in high dependency on operations teams to perform simple experimentation and development tasks. This typically results in weeks or months to deploy an environment.
- Security and performance risks – Experimentation and development activities typically require sharing existing environments with other teams, which presents security and performance risks due to lack of workload isolation.
- Limited collaboration – The security complexity of running shared environments and the lack of a shared web UI limits the analytics team’s ability to share and collaborate during development tasks.
To promote experimentation and solve the agility challenge, organizations need to reduce deployment complexity and remove dependencies to cloud operations teams while maintaining guardrails to optimize cost, security, and resource utilization. In this post, we walk you through how to implement a self-service analytics platform with Amazon EMR and Amazon EMR Studio to improve the agility of your data science and data engineering teams without compromising on the security, scalability, resiliency, and cost efficiency of your big data workloads.
Solution overview
A self-service data analytics platform with Amazon EMR and Amazon EMR Studio provides the following advantages:
- It’s simple to launch and access for data engineers and data scientists.
- The robust integrated development environment (IDE) is interactive, makes data easy to explore, and provides all the tooling necessary to debug, build, and schedule data pipelines.
- It enables collaboration for analytics teams with the right level of workload isolation for added security.
- It removes dependency from cloud operations teams by allowing administrators within each analytics organization to self-provision, scale, and de-provision resources from within the same UI, without exposing the complexities of the EMR cluster infrastructure and without compromising on security, governance, and costs.
- It simplifies moving from prototyping into a production environment.
- Cloud operations teams can independently manage EMR cluster configurations as products and continuously optimize for cost and improve the security, reliability, and performance of their EMR clusters.
Amazon EMR Studio is a web-based IDE that provides fully managed Jupyter notebooks where teams can develop, visualize, and debug applications written in R, Python, Scala, and PySpark, and tools such as Spark UI to provide an interactive development experience and simplify debugging of jobs. Data scientists and data engineers can directly access Amazon EMR Studio through a single sign-on enabled URL and collaborate with peers using these notebooks within the concept of an Amazon EMR Studio Workspace, version code with repositories such as GitHub and Bitbucket, or run parameterized notebooks as part of scheduled workflows using orchestration services. Amazon EMR Studio notebook applications run on EMR clusters, so you get the benefit of a highly scalable data processing engine using the performance optimized Amazon EMR runtime for Apache Spark.
The following diagram illustrates the architecture of the self-service analytics platform with Amazon EMR and Amazon EMR Studio.
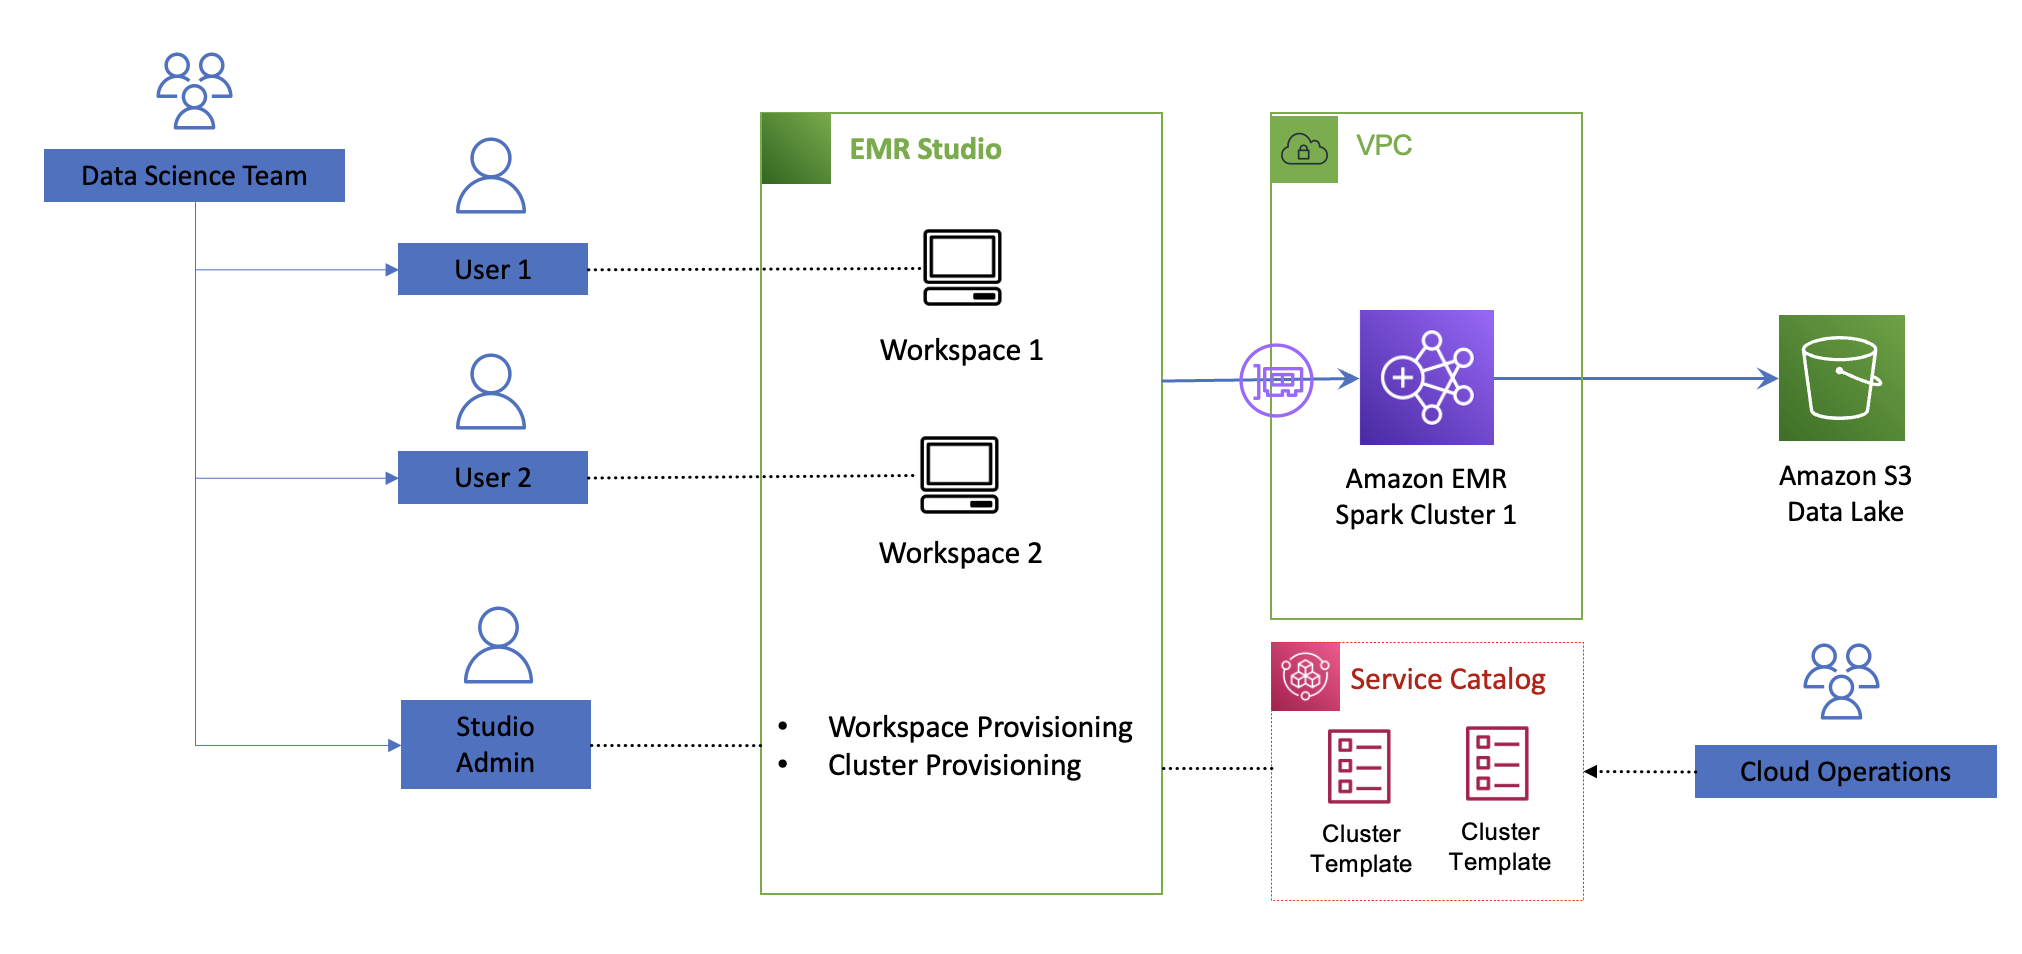
Cloud operations teams can assign one Amazon EMR Studio environment to each team for isolation and provision Amazon EMR Studio developer and administrator users within each team. Cloud operations teams have full control on the permissions each Amazon EMR Studio user has via Amazon EMR Studio permissions policies and control the EMR cluster configurations that Amazon EMR Studio administrators can deploy via cluster templates. Amazon EMR Studio administrators within each team can assign workspaces to each developer and attached to existing EMR clusters or, if allowed, self-provision EMR clusters from predefined templates. Each workspace is a serverless Jupyter instance with notebook files backed up continuously into an Amazon Simple Storage Service (Amazon S3) bucket. Users can attach or detach to provisioned EMR clusters and you only pay for the EMR cluster compute capacity used.
Cloud operations teams organize EMR cluster configurations as products within the AWS Service Catalog. In AWS Service Catalog, EMR cluster templates are organized as products in a portfolio that you share with Amazon EMR Studio users. Templates hide the complexities of the infrastructure configuration and can have custom parameters to allow for further optimization based on the workload requirement. After you publish a cluster template, Amazon EMR Studio administrators can launch new clusters and attach to new or existing workspaces within an Amazon EMR Studio without dependency to cloud operations teams. This makes it easier for teams to test upgrades, share predefined templates across teams, and allow analytics users to focus on achieving business outcomes.
The following diagram illustrates the decoupling architecture.

You can decouple the definition of the EMR clusters configurations as products and enable independent teams to deploy serverless workspaces and attach self-provisioned EMR clusters within Amazon EMR Studio in minutes. This enables organizations to create an agile and self-service environment for data processing and data science at scale while maintaining the proper level of security and governance.
As a cloud operations engineer, the main task is making sure your templates follow proper cluster configurations that are secure, run at optimal cost, and are easy to use. The following sections discuss key recommendations for security, cost optimization, and ease of use when defining EMR cluster templates for use within Amazon EMR Studio. For additional Amazon EMR best practices, refer to the EMR Best Practices Guide.
Security
Security is mission critical for any data science and data prep workload. Ensure you follow these recommendations:
- Team-based isolation – Maintain workload isolation by provisioning an Amazon EMR Studio environment per team and a workspace per user.
- Authentication – Use AWS IAM Identity Center (successor for AWS Single Sign-On) or federated access with AWS Identity and Access Management (IAM) to centralize user management.
- Authorization – Set fine-grained permissions within your Amazon EMR Studio environment. Set limited (1–2) users with the Amazon EMR Studio admin role to allow workspace and cluster provisioning. Most data engineers and data scientists will have a developer role. For more information on how to define permissions, refer to Configure EMR Studio user permissions.
- Encryption – When defining your cluster configuration templates, ensure encryption is enforced both in transit and at rest. For example, traffic between data lakes should use the latest version of TLS, data is encrypted with AWS Key Management Service (AWS KMS) at rest for Amazon S3, Amazon Elastic Block Store (Amazon EBS), and Amazon Relational Database Service (Amazon RDS).
Cost
To optimize cost of your running EMR cluster, consider the following cost-optimization options in your cluster templates:
- Use EC2 Spot Instances – Spot Instances let you take advantage of unused Amazon Elastic Compute Cloud (Amazon EC2) capacity in the AWS Cloud and offer up to a 90% discount compared to On-Demand prices. Spot is best suited for workloads that can be interrupted or have flexible SLAs, like testing and development workloads.
- Use instance fleets – Use instance fleets when using EC2 Spot to increase the likelihood of Spot availability. An instance fleet is a group of EC2 instances that host a particular node type (primary, core, or task) in an EMR cluster. Because instance fleets can consist of a mix of instance types, both On-Demand and Spot, this will increase the likelihood of Spot Instance availability when reaching your target capacity. Consider at least 10 instance types across all Availability Zones.
- Use Spark cluster mode and ensure that application masters run on On-Demand nodes – The application master (AM) is the main container launching and monitoring the application executors. Therefore, it’s important to ensure the AM is as resilient as possible. In an Amazon EMR Studio environment, you can expect users running multiple applications concurrently. In cluster mode, your Spark applications can run as independent sets of processes spread across your worker nodes within the AMs. By default, an AM can run on any of the worker nodes. Modify the behavior to ensure AMs run only in On-Demand nodes. For details on this setup, see Spot Usage.
- Use Amazon EMR managed scaling – This avoids overprovisioning clusters and automatically scales your clusters up or down based on resource utilization. With Amazon EMR managed scaling, AWS manages the automatic scaling activity by continuously evaluating cluster metrics and making optimized scaling decisions.
- Implement an auto-termination policy – This avoids idle clusters or the need to manually monitor and stop unused EMR clusters. When you set an auto-termination policy, you specify the amount of idle time after which the cluster should automatically shut down.
- Provide visibility and monitor usage costs – You can provide visibility of EMR clusters to Amazon EMR Studio administrators and cloud operations teams by configuring user-defined cost allocation tags. These tags help create detailed cost and usage reports in AWS Cost Explorer for EMR clusters across multiple dimensions.
Ease of use
With Amazon EMR Studio, administrators within data science and data engineering teams can self-provision EMR clusters from templates pre-built with AWS CloudFormation. Templates can be parameterized to optimize cluster configuration according to each team’s workload requirements. For ease of use and to avoid dependencies to cloud operations teams, the parameters should avoid requesting unnecessary details or expose infrastructure complexities. Here are some tips to abstract the input values:
- Maintain the number of questions to a minimum (less than 5).
- Hide network and security configurations. Be opinionated when defining your cluster according to your security and network requirements following Amazon EMR best practices.
- Avoid input values that require knowledge of AWS Cloud-specific terminology, such as EC2 instance types, Spot vs. On-Demand Instances, and so on.
- Abstract input parameters considering information available to data engineering and data science teams. Focus on parameters that will help further optimize the size and costs of your EMR clusters.
The following screenshot is an example of input values you can request from a data science team and how to resolve them via CloudFormation template features.
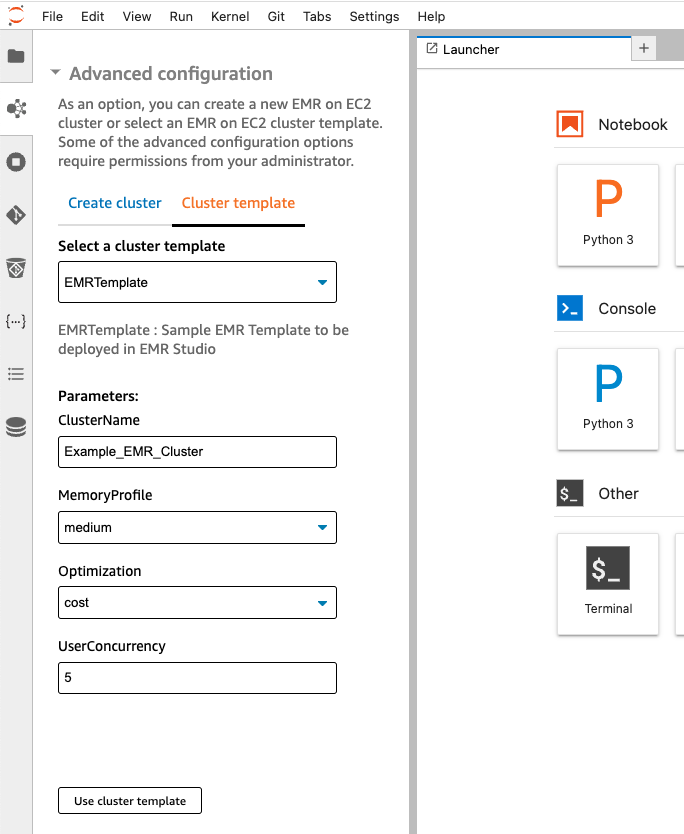
The input parameters are as follows:
- User concurrency – Knowing how many users are expected to run jobs simultaneously will help determine the number of executors to provision
- Optimized for cost or reliability – Use Spot Instances to optimize for cost; for SLA sensitive workloads, use only On-Demand nodes
- Workload memory requirements (small, medium, large) – Determine the ratio of memory per Spark executor in your EMR cluster
The following sections describe how to resolve the EMR cluster configurations from these input parameters and what features to use in your CloudFormation templates.
User concurrency: How many concurrent users do you need?
Knowing the expected user concurrency will help determine the target node capacity of your cluster or the min/max capacity when using the Amazon EMR auto scaling feature. Consider how much capacity (CPU cores and memory) each data scientist needs to run their average workload.
For example, let’s say you want to provision 10 executors to each data scientist in the team. If the expected concurrency is set to 7, then you need to provision 70 executors. An r5.2xlarge instance type has 8 cores and 64 Gib of RAM. With the default configuration, the core count (spark.executor.cores) is set to 1 and memory (spark.executor.memory) is set to 6 Gib. One core will be reserved for running the Spark application, therefore leaving seven executors per node. You will need a total of 10 r5.2xlarge nodes to meet the demand. The target capacity can dynamically resolve to 10 from the user concurrency input, and the capacity weights in your fleet make sure the same capacity is met if different instance sizes are provisioned to meet the expected capacity.
Using an CloudFormation transform allows you to resolve the target capacity based on a numeric input value. A transform passes your template script to a custom AWS Lambda function so you can replace any placeholder in your CloudFormation template with values resolved from your input parameters.
The following CloudFormation script calls the emr-size-macro transform that replaces the custom::Target placeholder in the TargetSpotCapacity object based on the UserConcurrency input value:
Optimized for cost or reliability: How do you optimize your EMR cluster?
This parameter determines if the cluster should use Spot Instances for task nodes to optimize cost or provision only On-Demand nodes for SLA sensitive workloads that need to be optimized for reliability.
You can use the CloudFormation Conditions feature in your template to resolve your desired instance fleet configurations. The following code shows how the Conditions feature looks in a sample EMR template:
Workload memory requirements: How big a cluster do you need?
This parameter helps determine the amount of memory and CPUs to allocate to each Spark executor. The specific memory to CPU ratio allocated to each executor should be set appropriately to avoid out of memory errors. You can map the input parameter (small, medium, large) to specific instance types to select the CPU/memory ratio. Amazon EMR has default configurations (spark.executor.cores, spark.executor.memory) based on each instance type. For example, a small size cluster request could resolve to general purpose instances like m5 (default: 2 cores and 4 gb per executor), whereas a medium workflow can resolve to an R type (default: 1 core and 6 gb per executor). You can further tune the default Amazon EMR memory and CPU core allocation to each instance type by following the best practices outlined in the Spark section of the EMR Best Practices Guides.
Use the CloudFormation Mappings section to resolve the cluster configuration in your template:
Conclusion
In this post, we showed how to create a self-service analytics platform with Amazon EMR and Amazon EMR Studio to take full advantage of the agility the AWS Cloud provides by considerably reducing deployment times without compromising governance. We also walked you through best practices in security, cost, and ease of use when defining your Amazon EMR Studio environment so data engineering and data science teams can speed up their development cycles by removing dependencies from Cloud Operations teams when provisioning their data processing platforms.
If this is your first time exploring Amazon EMR Studio, we recommend checking out the Amazon EMR workshops and referring to Create an EMR Studio. Continue referencing the Amazon EMR Best Practices Guide when defining your templates and check out the Amazon EMR Studio sample repo for EMR cluster template references.
About the Authors
 Pablo Redondo is a Principal Solutions Architect at Amazon Web Services. He is a data enthusiast with over 16 years of fintech and healthcare industry experience and is a member of the AWS Analytics Technical Field Community (TFC). Pablo has been leading the AWS Gain Insights Program to help AWS customers achieve better insights and tangible business value from their data analytics initiatives.
 Malini Chatterjee is a Senior Solutions Architect at AWS. She provides guidance to AWS customers on their workloads across a variety of AWS technologies with a breadth of expertise in data and analytics. She is very passionate about semi-classical dancing and performs in community events. She loves traveling and spending time with her family.
 Avijit Goswami is a Principal Solutions Architect at AWS, specialized in data and analytics. He supports AWS strategic customers in building high-performing, secure, and scalable data lake solutions on AWS using AWS-managed services and open-source solutions. Outside of his work, Avijit likes to travel, hike San Francisco Bay Area trails, watch sports, and listen to music.


 Pablo Redondo Sanchez is a Senior Solutions Architect at Amazon Web Services. He is a data enthusiast and works with customers to help them achieve better insights and faster outcomes from their data analytics workflows. In his spare time, Pablo enjoys woodworking and spending time outdoor with his family in Northern California.