Post Syndicated from Home Assistant original https://www.youtube.com/watch?v=UTltO1-d56s
Artemis Quote
Post Syndicated from original https://xkcd.com/2668/

Kernel prepatch 6.0-rc4
Post Syndicated from original https://lwn.net/Articles/906672/
The 6.0-rc4 kernel prepatch is out for
testing. “We’re up to rc4, and things mostly still look fairly
“.
normal
Beyond the usual fixes, 6.0-rc4 includes one feature change: a hook to allow
security modules to control access to the io_uring command pass-through
mechanism. See this article for the
background behind this late-arriving change.
Peter Eckersley RIP
Post Syndicated from original https://lwn.net/Articles/907114/
Peter Eckersley, one of the original founders of the Let’s Encrypt non-profit TLS certificate authority, has died suddenly, as reported by Seth Schoen:
Peter was the leader of EFF’s contributions to Let’s Encrypt and ACME over the course of several years during which these technologies turned from a wild idea into an important part of Internet infrastructure. He also took a lot of initiative in coalescing the EFF, Mozilla, and University of Michigan teams into a single team and a single project. He later served on the initial board of directors of the Internet Security Research Group.
[…]
Toward the end of his life, Peter focused his career on ethics and safety of artificial intelligence, and he founded the AI Objectives Institute to examine the concrete parallels he saw between surprising and undesirable outcomes that can emerge within economies and those that can emerge in machine learning systems.
More about Eckersley can be found at his web site, on his Wikipedia page, and in a Hacker News discussion.
Bridge Club
Post Syndicated from Oglaf! -- Comics. Often dirty. original https://www.oglaf.com/bridgeclub/


Blocking Kiwifarms
Post Syndicated from Matthew Prince original https://blog.cloudflare.com/kiwifarms-blocked/
We have blocked Kiwifarms. Visitors to any of the Kiwifarms sites that use any of Cloudflare’s services will see a Cloudflare block page and a link to this post. Kiwifarms may move their sites to other providers and, in doing so, come back online, but we have taken steps to block their content from being accessed through our infrastructure.
This is an extraordinary decision for us to make and, given Cloudflare’s role as an Internet infrastructure provider, a dangerous one that we are not comfortable with. However, the rhetoric on the Kiwifarms site and specific, targeted threats have escalated over the last 48 hours to the point that we believe there is an unprecedented emergency and immediate threat to human life unlike we have previously seen from Kiwifarms or any other customer before.
Escalating threats
Kiwifarms has frequently been host to revolting content. Revolting content alone does not create an emergency situation that necessitates the action we are taking today. Beginning approximately two weeks ago, a pressure campaign started with the goal to deplatform Kiwifarms. That pressure campaign targeted Cloudflare as well as other providers utilized by the site.
Cloudflare provides security services to Kiwifarms, protecting them from DDoS and other cyberattacks. We have never been their hosting provider. As we outlined last Wednesday, we do not believe that terminating security services is appropriate, even to revolting content. In a law-respecting world, the answer to even illegal content is not to use other illegal means like DDoS attacks to silence it.
We are also not taking this action directly because of the pressure campaign. While we have empathy for its organizers, we are committed as a security provider to protecting our customers even when they run deeply afoul of popular opinion or even our own morals. The policy we articulated last Wednesday remains our policy. We continue to believe that the best way to relegate cyberattacks to the dustbin of history is to give everyone the tools to prevent them.
However, as the pressure campaign escalated, so did the rhetoric on the Kiwifarms site. Feeling attacked, users of the site became even more aggressive. Over the last two weeks, we have proactively reached out to law enforcement in multiple jurisdictions highlighting what we believe are potential criminal acts and imminent threats to human life that were posted to the site.
Legal process
While law enforcement in these areas are working to investigate what we and others reported, unfortunately the process is moving more slowly than the escalating risk. While we believe that in every other situation we have faced — including the Daily Stormer and 8chan — it would have been appropriate as an infrastructure provider for us to wait for legal process, in this case the imminent and emergency threat to human life which continues to escalate causes us to take this action.
Hard cases make bad law. This is a hard case and we would caution anyone from seeing it as setting precedent. The policies we articulated last Wednesday remain our policies. For an infrastructure provider like Cloudflare, legal process is still the correct way to deal with revolting and potentially illegal content online.
But we need a mechanism when there is an emergency threat to human life for infrastructure providers to work expediently with legal authorities in order to ensure the decisions we make are grounded in due process. Unfortunately, that mechanism does not exist and so we are making this uncomfortable emergency decision alone.
Not the end
Finally, we are aware and concerned that our action may only fan the flames of this emergency. Kiwifarms itself will most likely find other infrastructure that allows them to come back online, as the Daily Stormer and 8chan did themselves after we terminated them. And, even if they don’t, the individuals that used the site to increasingly terrorize will feel even more isolated and attacked and may lash out further. There is real risk that by taking this action today we may have further heightened the emergency.
We will continue to work proactively with law enforcement to help with their investigations into the site and the individuals who have posted what may be illegal content to it. And we recognize that while our blocking Kiwifarms temporarily addresses the situation, it by no means solves the underlying problem. That solution will require much more work across society. We are hopeful that our action today will help provoke conversations toward addressing the larger problem. And we stand ready to participate in that conversation.
(Untitled)
Post Syndicated from Jaime Tang original https://blog.cloudflare.com/kiwifarms-blocked-es-es-4/
Should you buy a cheap security camera? I tested 6 budget friendly wired cameras.
Post Syndicated from The Hook Up original https://www.youtube.com/watch?v=WnZg990Viz8
Shaving Compact Discs to improve the sound (?!)
Post Syndicated from Techmoan original https://www.youtube.com/watch?v=f-QxLAxwxkM
Arti 1.0.0 released
Post Syndicated from original https://lwn.net/Articles/907023/
Arti is a reimplementation of the Tor server in Rust; version 1.0.0 has
just been released and proclaimed ready for production use.
When we defined our set of milestones, we defined Arti 1.0.0 as
“ready for production use”: You should be able to use it in the
real world, to get a similar degree of privacy, usability, and
stability to what you would with a C client Tor. The APIs should be
(more or less) stable for embedders.We believe we have achieved this. You can now use arti
proxy to
connect to the Tor network to anonymize your network connections.
Friday Squid Blogging: Squid Images
Post Syndicated from Bruce Schneier original https://www.schneier.com/blog/archives/2022/09/friday-squid-blogging-squid-images.html
iStock has over 13,000 royalty-free images of squid.
As usual, you can also use this squid post to talk about the security stories in the news that I haven’t covered.
Read my blog posting guidelines here.
Metasploit Weekly Wrap-Up
Post Syndicated from Christopher Granleese original https://blog.rapid7.com/2022/09/02/metasploit-weekly-wrap-up-174/
ICPR Certificate Management
This week Metasploit has a new ICPR Certificate Management module from Oliver Lyak and our very own Spencer McIntyre, which can be utilized for issuing certificates via Active Directory Certificate Services. It has the capability to issue certificates which is useful in a few contexts including persistence, ESC1 and as a primitive necessary for exploiting CVE-2022-26923. Resulting in the PFX certificate file being stored to loot and is encrypted using a blank password.
ManageEngine ADAudit Plus and DataSecurity Plus Xnode enum
Another addition thanks to Erik Wynter and Sahil Dhar, that brings two new auxiliary/gather modules and docs that take advantage of default Xnode credentials (CVE-2020–11532) in order to enumerate active directory information and other sensitive data via the DataEngine Xnode server (Xnode). Because both modules rely on the same code to interact with Xnode, this change also adds a mixin at lib/msf/core/auxiliary/manageengine_xnode that is leveraged by both modules (plus by a third module that will be part of a separate PR). Both modules also come with configuration files to determine what data will be enumerated from Xnode. The PR contains even more information on the vulnerable systems and extensive notes!
New module content (5)
-
ICPR Certificate Management by Oliver Lyak and Spencer McIntyre – This adds a module for issuing certificates via Active Directory Certificate Services, which is useful in a few contexts including persistence and for some specific exploits. The resulting PFX certificate file is stored to the loot and is encrypted using a blank password.
-
ManageEngine ADAudit Plus Xnode Enumeration by Erik Wynter and Sahil Dhar, which exploits CVE-2020-11532 – Two new auxiliary/gather modules have been added that take advantage of default Xnode credentials, aka CVE-2020–11532, in order to enumerate Active Directory information and other sensitive data via the DataEngine Xnode server. Additionally, a new library has been added to provide reusable functionality for interacting with Xnode servers.
-
ManageEngine DataSecurity Plus Xnode Enumeration by Erik Wynter and Sahil Dhar, which exploits CVE-2020-11532 – Two new auxiliary/gather modules have been added that take advantage of default Xnode credentials, a.k.a CVE-2020–11532, in order to enumerate Active Directory information and other sensitive data via the DataEngine Xnode server. Additionally, a new library has been added to provide reusable functionality for interacting with Xnode servers.
-
Zyxel Firewall SUID Binary Privilege Escalation by jbaines-r7, which exploits CVE-2022-30526 – This adds an LPE exploit for Zyxel Firewalls that can allow a user to escalate themselves to root. The vulnerability is identified as CVE-2022-30526 and is due to a suid binary that allows any user to copy files with root permissions.
-
CVE-2022-30190 AKA Follina by bwatters-r7 – This updates the exploit for CVE-2022-30190 (A.K.A Follina) to support generating RTF exploit documents. RTF documents are helpful for not only being another exploit vector, but they will trigger the payload execution when viewed by Explorer’s preview tab without needing user interaction to enable editing functionality.
Enhancements and features (4)
-
#16746 from adfoster-r7 – This updates the MSSQL login scanner to catch exceptions and continue running.
-
#16900 from bcoles – This adds a new
#kill_processmethod that supports shell, PowerShell, and Meterpreter sessions on different platforms. -
#16903 from bcoles – This cleans up the enum_shares post modules and adds support for shell sessions.
-
#16959 from adfoster-r7 – The
timecommand has been updated with the--cpuand--memoryprofiler options to allow users to get memory and CPU usage profiles when running a command insidemsfconsole.
Bugs fixed (5)
-
#16750 from bojanisc – This updates the
exploit/multi/http/jenkins_script_consolemodule to use the decoder from thejava.util.Base64class in place of the now-deprecated decoder from thesun.misc.BASE64Decoderclass, enabling exploitation of newer Jenkins versions. -
#16869 from bcoles – This fixes an issue in the
file_remote_digestmd5()andfile_remote_digestsha1()methods whereread_file()would return an error message instead of the remote file contents. Additionally, thefile_remote_digest*methods now support more session types, and they have a newutiloption that allows the user to perform the hashing on the remote host instead of downloading the remote file and performing the hashing locally. -
#16918 from rbowes-r7 – A bug has been fixed in the module for CVE-2022-30333 whereby if the server responded with a 200 OK response, the module would keep trying to trigger the payload. This would lead to multiple sessions being returned when only one was desired.
-
#16920 from zeroSteiner – A typo has been fixed in _msfvenom that prevented ZSH autocompletion from working when using the
--archargument withmsfvenom. -
#16955 from gwillcox-r7 – This fixes an issue in the LDAP query module that would cause issues if the user queried for a field that was populated with binary data.
Get it
As always, you can update to the latest Metasploit Framework with msfupdate
and you can get more details on the changes since the last blog post from
GitHub:
- [Pull Requests 6.2.14…6.2.15][prs-landed]
- [Full diff 6.2.14…6.2.15][diff]
If you are a git user, you can clone the [Metasploit Framework repo][repo] (master branch) for the latest.
To install fresh without using git, you can use the open-source-only [Nightly Installers][nightly] or the
[binary installers][binary] (which also include the commercial edition).
[binary]: https://www.rapid7.com/products/metasploit/download.jsp
[diff]: https://github.com/rapid7/metasploit-framework/compare/6.2.14…6.2.15
[prs-landed]: https://github.com/rapid7/metasploit-framework/pulls?q=is:pr+merged:"2022-08-25T17%3A06%3A18%2B01%3A00..2022-09-01T12%3A53%3A23-04%3A00"
[nightly]: https://github.com/rapid7/metasploit-framework/wiki/Nightly-Installers
[repo]: https://github.com/rapid7/metasploit-framework
Home Assistant Bluetooth Proxies – Special guest Paulus!
Post Syndicated from digiblurDIY original https://www.youtube.com/watch?v=9WoWiWkOyS0
Five Misconceptions About Moving From Tape to Cloud
Post Syndicated from Jeremy Milk original https://www.backblaze.com/blog/five-misconceptions-about-moving-from-tape-to-cloud/
There are a lot of pros and cons that go along with using the old, reliable LTO system for your backups. And while the medium still has many adherents, there is a growing movement of folks looking to move beyond magnetic tape, a form of storage technology that has been around since 1928. Technically, it’s the same age as sliced bread.
Those working in IT already know the benefits of migrating from LTO to cloud storage, which include everything from nearly universal ease of access to reduced maintenance, but those who hold the company’s pursestrings might still need convincing. Some organizations delay making a move because of misconceptions about the cost, inconvenience, risk, and security, but they may not have all the details. Let’s explore five top misconceptions about migrating from tape so you can help your team make an informed decision.
Misconception #1 – Total Cost of Ownership is Higher in the Cloud
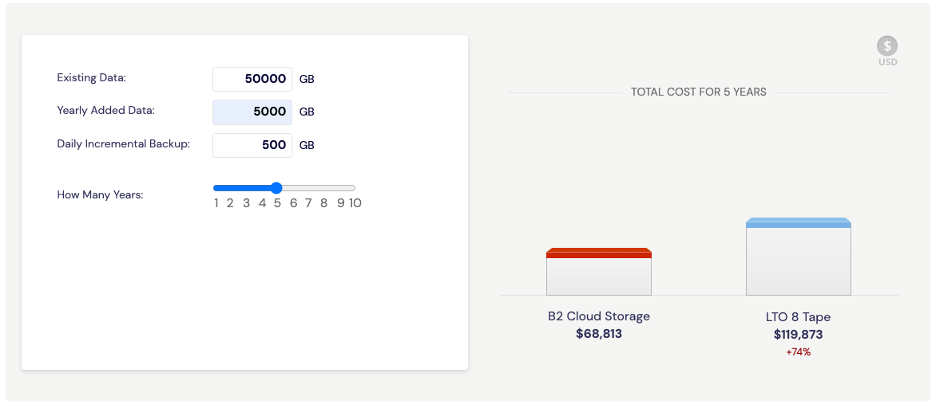
The first misconception is that moving from a tape-based backup solution to cloud storage is expensive. Using our LTO vs. B2 Cloud Storage calculator, you can enter the amount of existing data you have, the amount of data you add yearly, and your daily incremental data to determine the actual cost savings.
For example, say you have 50TB of existing data, you add 5TB more every year, and your daily incremental backup data is 500GB. If that were the case, you could expect to pay almost 75% less backing up with cloud storage versus tape. The calculator also includes details about the assumptions we used in the computations so you can adjust accordingly. These assumptions include the LTO Backup Model, Data Compression Ratio and Data Retention Policy, as well as a handful of others you can dig into on your own if you’d like to fine tune the math.
Misconception #2 – Migration Costs are Impossible to Manage
We have shown how much more affordable it is to store on the cloud vs. on tape, but what about the costs of moving all of your data? Everyone with a frequently accessed data archive and especially those serving data to end users live in fear of large egress fees. Understandably the idea of paying egress fees for ALL of their data at once can be paralyzing. There is one service available today that pays for your data migration—egress fees, transfer costs, administration, all of it.
The new Universal Data Migration (UDM) service covers data migration fees for customers in US, Canada, Europe storing more than 10TB—including any legacy provider egress fees. The service offers a suite of tools and resources to make moving your data over to cloud storage a breeze, including high speed processes for reading tape media (reel cassettes and cartridges) and transferring directly to Backblaze B2 via a high-speed data connection. This all comes with full solution engineer support throughout the process and beyond. Data is transferred quickly and securely within days, not weeks.
Short story: Even if it might feel like it some days, your data does not have to be held hostage by egress expenses. Migration can be the opposite of a “killer”–it can open your budget for other investments and free your teams to access the data they need whenever they need it.
Misconception #3 – Cloud Storage Is a Security Risk
A topic on everyone’s minds these days is security. It’s reasonable to worry about risks when transitioning from tapes stored on-premises or off-site to the cloud. You can see the tapes on site; they’re disconnected from the internet and locked in a storage space on your property. When it comes to cybercriminals accessing data, you’re breathing easy. Statistics on data breaches and ransomware show that businesses of every size are at risk when it comes to cyberattacks, so this is an understandable stance. But when you look at the big picture, the cloud can offer greater peace of mind across a wide range of risks:
- Cut Risk by Tiering Data Off Site: Cybercrime is certainly a huge threat, so it’s wise to keep it front of mind in your planning. There are a number of other risk factors that deserve equal consideration, however. Whether you live in an area prone to natural disasters, are headquartered in an older building, or just have bad luck, getting a copy of your data offsite is essential to ensuring you can recover from most disasters.
- Apply Object Lock for Virtual Air Gapping: Air gaps used to be the big divider between cloud and tape on the security front. But setting immutability through Object Lock means you can set a virtual air gap on all of your cloud data. This functionality is available through Veeam, MSP 360, and a number of other leading backup management software providers. You don’t have to rely on tape to attain object lock.
- Boost Security without Burdening IT: Cloud storage providers’ full time job is maintaining the durability of the data they hold—they focus 24/7 on maintenance and upkeep so you don’t have to worry about whether your hardware and software are up to date and properly maintained. No need to sweat security updates, patches, or dealing with alerts. That’s your provider’s problem.
Misconception #4 – It’s All or Nothing with Data Migration
For certain industries, regulations require that certain data sets stay on-site. In the past, managing some data on-site and some in the cloud was just too much of a hassle. But hybrid services have come a long way toward making the process smoother and more efficient.
For all of your data that doesn’t have to stay on-site, you could start using cloud storage for daily incremental backups today, while keeping your tape system in place for older archived data. Not only would this save you time not worrying about as many tapes, but you can also restore the cloud-based files instantly if you need to.
Using software from StarWind VTL or Archiware P5, you can start backing up to the cloud instantly and make the job of migrating more manageable.
The Hybrid Approach
If you’re not able to go in on the all-in cloud approach right away, you may want to continue to keep some archived data on tape and move over any current data that is more critical. A hybrid system gives you options and allows you to make the transition on your schedule.
Some of the ways companies execute the hybrid model are:
- Date Hybrid: Pick a cut-off date; everything after that date is stored in cloud storage and everything before stays on tape.
- Classic Hybrid: Full backups remain on tape and incremental data is stored in the cloud.
- Type Hybrid: You might store different data types on tape and other types in the cloud. For example, perhaps you store employee files on tape and customer data in cloud storage.
Regardless of how you choose to break it up, the hybrid model makes it faster and easier to migrate.
Misconception #5 – The Costs Outweigh the Benefits
If you’re going to go through the process of migrating your data from LTO to the cloud—even though we’ve shown it to be fairly painless—you want to make sure there’s an upside, right?
Let’s start with the simple ease of access. With tape storage, the nature of physical media means that access is limited by its nature. You have to be on premises to locate the data you need (no small feat if you have a catalog of tapes to sort through).
By putting all that data in the cloud, you enable instant access to anyone in your organization with the right provisions. This shifts hours of burden from your IT department, helping the organization get more out of the resources and infrastructure they already have.
Bonus Pro-Tip: Use a “Cheat Sheet” or Checklist to Convince Your CFO or COO
When you pitch the idea of migrating from tape to cloud storage to your CFO or COO, you can allay their fears by presenting them with a cheat sheet or checklist that proactively addresses any concerns they might have.
Some things to include in your cheat sheet are basically what we’ve outlined above: First, that cloud storage is not more expensive than tape; it actually saves you money. Second, using a hybrid model, you can move your data over conveniently on your own time. There is no cost to you to migrate your data using our UDM service, and your data is fully protected against loss and secured by Object Lock to keep it safe and sound in the cloud.
Migration Success Stories
Check out these tape migration success stories to help you decide if this solution is right for you.
Kings County, CA
Kings County, California, experienced a natural disaster destroying their tapes and tape drive, prompting an $80,000 price tag to continue backing up critical county data like HIPAA records and legal information. John Devlin, CIO of Kings County, decided it was time for a change. His plan was to move away from capital expenditures (tapes and tape drives) to operating expenses like cloud storage and backup software. After much debate, Kings County decided on Veeam Software paired with Backblaze B2 Cloud Storage for its backup solution, and it’s been smooth sailing ever since!
Austin City Limits
Austin City Limits is a public TV program that has stored more than 4,000 hours of priceless live music performances on tape. As those tapes were rapidly beginning to deteriorate, the company opted to transfer recordings to Backblaze B2 Cloud Storage for immediate and ongoing archiving with real-time, hot access. Utilizing a Backblaze Fireball rapid data ingest tool, they were able to securely back up hours of footage without tying up bandwidth. Thanks to their quick actions, irreplaceable performances from Johnny Cash, Stevie Ray Vaughan and The Foo Fighters are now preserved for posterity.
In Summary
So, we’ve covered that moving your backups to a storage cloud can save your organization time and money, is a fairly painless process to undertake, doesn’t present a higher security risk, and creates important geo-redundancies that represent best practices. Hopefully, we’ve helped clear up those misconceptions and we’ve helped you decide whether migrating from tape to cloud storage makes sense for your business.
The post Five Misconceptions About Moving From Tape to Cloud appeared first on Backblaze Blog | Cloud Storage & Cloud Backup.
What’s Up, Home? – Syslog, Hold the Line
Post Syndicated from Janne Pikkarainen original https://blog.zabbix.com/whats-up-home-syslog-hold-the-line/23071/
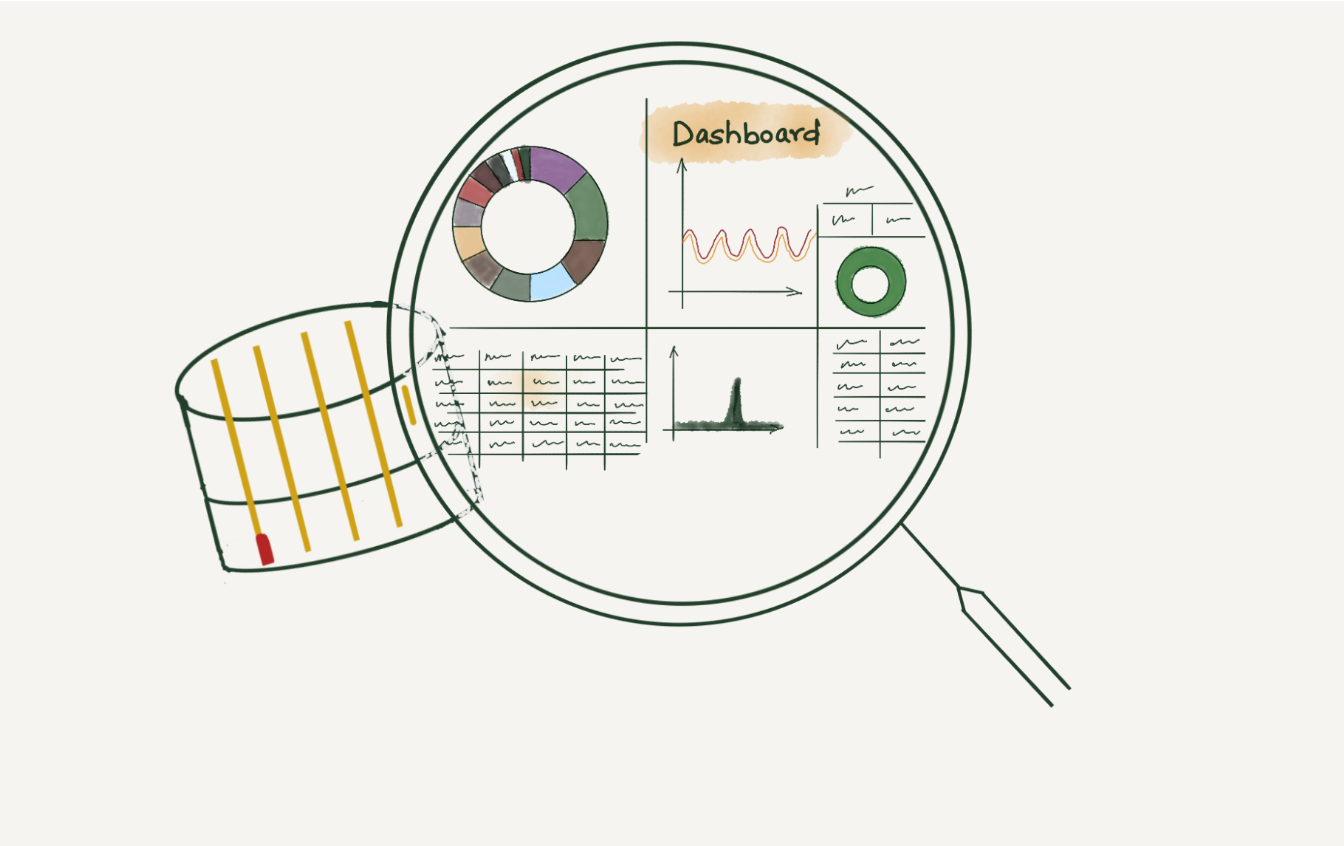
Can you find out what your laptop is doing during its boot with Zabbix? Of course, you can!
By day, I am a monitoring technical lead in a global cyber security company. By night, I monitor my home with Zabbix & Grafana and do some weird experiments with them. Welcome to my weekly blog about this project.
This time I was originally planning to write about how to monitor yet another device with Zabbix, but as in today’s world deliveries seem to take a long time, I’ll blog about something else — Zabbix and syslog collection.
Zabbix as syslog platform?
You might not think of Zabbix as of a syslog platform, as there are specialized tools for that, providing much more functionality for log management than Zabbix ever could. However, sending syslog information to Zabbix can be very useful. In bigger environments, sending everything to it might be overkill and too taxing, so please, filter with care and consider the log retention period, but at home with a very low logging rate, this can be handy.
Logs? How and why?
At my home network, a Raspberry Pi 4 is running a Zabbix server, among other software. One of the roles of my cool little Raspberry is that it acts as a centralized syslog server. I have configured my home router, MacBook, and one more laptop to send their syslog to rsyslogd running on my Raspberry.
Then, on Zabbix, I have an item configured to keep an eye on the centralized log file the events are flowing into.

This way, I can see all kinds of events happening on those devices via Zabbix, and create appropriate triggers if something worth mentioning gets logged. Inspecting the syslog with the Zabbix Plain text widget, it’s shown absolutely everything, and well, that view probably contains just noise.

Adding details
However, if you start searching for whatever you would need to know about, then you of course can search for content. Let’s see what my MacBook has automatically updated lately:

I can then add a trigger that would log the time when something got installed or updated. It’s in no way a replacement for a proper log management solution, but for Super Important Targets something like this could be very useful, as you could catch any looming issues via Zabbix immediately, too.

Likewise, I can see what my Linux laptop has been doing:

In my configuration, absolutely everything gets sent to Zabbix, so the syslog entries from the devices are coming in starting from the moment the devices have their network & syslog services up, and they will stop coming when the syslog service stops during a shutdown.
Here’s the Linux laptop starting up:

MacBook also sends its events to syslog during OS updates/startup/shutdown, but it’s been so long since I last restarted my Mac that my Zabbix does not have the logs for that period of time anymore, and I don’t want to restart my MacBook (which I’m using to type this blog entry) just to get a screenshot from its boot sequence.
Hopefully, my new gadget will arrive soon, so I can then finally blog about that. 
I have been working at Forcepoint since 2014 and in addition to monitoring addict, I am a log addict, too. — Janne Pikkarainen
This post was originally published on the author’s LinkedIn account.
The post What’s Up, Home? – Syslog, Hold the Line appeared first on Zabbix Blog.
Log analytics using ClickHouse
Post Syndicated from Monika Singh original https://blog.cloudflare.com/log-analytics-using-clickhouse/
This is an adapted transcript of a talk we gave at Monitorama 2022. You can find the slides with presenter’s notes here and video here.

When a request at Cloudflare throws an error, information gets logged in our requests_error pipeline. The error logs are used to help troubleshoot customer-specific or network-wide issues.
We, Site Reliability Engineers (SREs), manage the logging platform. We have been running Elasticsearch clusters for many years and during these years, the log volume has increased drastically. With the log volume increase, we started facing a few issues. Slow query performance and high resource consumption to list a few. We aimed to improve the log consumer’s experience by improving query performance and providing cost-effective solutions for storing logs. This blog post discusses challenges with logging pipelines and how we designed the new architecture to make it faster and cost-efficient.
Before we dive into challenges in maintaining the logging pipelines, let us look at the characteristics of logs.
Characteristics of logs

Unpredictable – In today’s world, where there are tons of microservices, the amount of logs a centralized logging system will receive is very unpredictable. There are various reasons why capacity estimation of log volume is so difficult. Primarily because new applications get deployed to production continuously, existing applications are automatically scaled up or down to handle business demands or sometimes application owners enable debug log levels and forget to turn it off.
Semi-structured – Every application adopts a different logging format. Some are represented in plain-text and others use JSON. The timestamp field within these log lines also varies. Multi-line exceptions and stack traces make them even more unstructured. Such logs add extra resource overhead, requiring additional data parsing and mangling.
Contextual – For debugging issues, often contextual information is required, that is, logs before and after an event happened. A single logline hardly helps, generally, it’s the group of loglines that helps in building the context. Also, we often need to correlate the logs from multiple applications to draw the full picture. Hence it’s essential to preserve the order in which logs get populated at the source.
Write-heavy – Any centralized logging system is write-intensive. More than 99% of logs that are written, are never read. They occupy space for some time and eventually get purged by the retention policies. The remaining less than 1% of the logs that are read are very important and we can’t afford to miss them.
Logging pipeline
Like most other companies, our logging pipeline consists of a producer, shipper, a queue, a consumer and a datastore.

Applications (Producers) running on the Cloudflare global network generate the logs. These logs are written locally in Cap’n Proto serialized format. The Shipper (in-house solution) pushes the Cap’n Proto serialized logs through streams for processing to Kafka (queue). We run Logstash (consumer), which consumes from Kafka and writes the logs into ElasticSearch (datastore).The data is then visualized by using Kibana or Grafana. We have multiple dashboards built in both Kibana and Grafana to visualize the data.
Elasticsearch bottlenecks at Cloudflare
At Cloudflare, we have been running Elasticsearch clusters for many years. Over the years, log volume increased dramatically and while optimizing our Elasticsearch clusters to handle such volume, we found a few limitations.
Mapping Explosion

Mapping Explosion is one of the very well-known limitations of Elasticsearch. Elasticsearch maintains a mapping that decides how a new document and its fields are stored and indexed. When there are too many keys in this mapping, it can take a significant amount of memory resulting in frequent garbage collection. One way to prevent this is to make the schema strict, which means any log line not following this strict schema will end up getting dropped. Another way is to make it semi-strict, which means any field not part of this mapping will not be searchable.
Multi-tenancy support

Elasticsearch doesn’t have very good multi-tenancy support. One bad user can easily impact cluster performance. There is no way to limit the maximum number of documents or indexes a query can read or the amount of memory an Elasticsearch query can take. A bad query can easily degrade cluster performance and even after the query finishes, it can still leave its impact.
Cluster operational tasks
It is not easy to manage Elasticsearch clusters, especially multi-tenant ones. Once a cluster degrades, it takes significant time to get the cluster back to a fully healthy state. In Elasticsearch, updating the index template means reindexing the data, which is quite an overhead. We use hot and cold tiered storage, i.e., recent data in SSD and older data in magnetic drives. While Elasticsearch moves the data from hot to cold storage every day, it affects the read and write performance of the cluster.
Garbage collection

Elasticsearch is developed in Java and runs on a Java Virtual Machine (JVM). It performs garbage collection to reclaim memory that was allocated by the program but is no longer referenced. Elasticsearch requires garbage collection tuning. The default garbage collection in the latest JVM is G1GC. We tried other GC like ZGC, which helped in lowering the GC pause but didn’t give us much performance benefit in terms of read and write throughput.

Elasticsearch is a good tool for full-text search and these limitations are not significant with small clusters, but in Cloudflare, we handle over 35 to 45 million HTTP requests per second, out of which over 500K-800K requests fail per second. These failures can be due to an improper request, origin server errors, misconfigurations by users, network issues and various other reasons.
Our customer support team uses these error logs as the starting point to triage customer issues. The error logs have a number of fields metadata about various Cloudflare products that HTTP requests have been through. We were storing these error logs in Elasticsearch. We were heavily sampling them since storing everything was taking a few hundreds of terabytes crossing our resource allocation budget. Also, dashboards built over it were quite slow since they required heavy aggregation over various fields. We need to retain these logs for a few weeks per the debugging requirements.
Proposed solution
We wanted to remove sampling completely, that is, store every log line for the retention period, to provide fast query support over this huge amount of data and to achieve all this without increasing the cost.
To solve all these problems, we decided to do a proof of concept and see if we could accomplish our requirements using ClickHouse.
Cloudflare was an early adopter of ClickHouse and we have been managing ClickHouse clusters for years. We already had a lot of in-house tooling and libraries for inserting data into ClickHouse, which made it easy for us to do the proof of concept. Let us look at some of the ClickHouse features that make it the perfect fit for storing logs and which enabled us to build our new logging pipeline.

ClickHouse is a column-oriented database which means all data related to a particular column is physically stored next to each other. Such data layout helps in fast sequential scan even on commodity hardware. This enabled us to extract maximum performance out of older generation hardware.

ClickHouse is designed for analytical workloads where the data has a large number of fields that get represented as ClickHouse columns. We were able to design our new ClickHouse tables with a large number of columns without sacrificing performance.

ClickHouse indexes work differently than those in relational databases. In relational databases, the primary indexes are dense and contain one entry per table row. So if you have 1 million rows in the table, the primary index will also have 1 million entries. While In ClickHouse, indexes are sparse, which means there will be only one index entry per a few thousand table rows. ClickHouse indexes enabled us to add new indexes on the fly.
ClickHouse compresses everything with LZ4 by default. An efficient compression not only helps in minimizing the storage needs but also lets ClickHouse use page cache efficiently.
One of the cool features of ClickHouse is that the compression codecs can be configured on a per-column basis. We decided to keep default LZ4 compression for all columns. We used special encodings like Double-Delta for the DateTime columns, Gorilla for Float columns and LowCardinality for fixed-size String columns.
ClickHouse is linearly scalable; that is, the writes can be scaled by adding new shards and the reads can be scaled by adding new replicas. Every node in a ClickHouse cluster is identical. Not having any special nodes helps in scaling the cluster easily.
Let’s look at some optimizations we leveraged to provide faster read/write throughput and better compression on log data.
Inserter
Having an efficient inserter is as important as having an efficient data store. At Cloudflare, we have been operating quite a few analytics pipelines from where we borrowed most of the concepts while writing our new inserter. We use Cap’n Proto messages as the transport data format since it provides fast data encoding and decoding. Scaling inserters is easy and can be done by adding more Kafka partitions and spawning new inserter pods.

Batch Size
One of the key performance factors while inserting data into ClickHouse is the batch size. When batches are small, ClickHouse creates many small partitions, which it then merges into bigger ones. Thus smaller batch size creates extra work for ClickHouse to do in the background, thereby reducing ClickHouse’s performance. Hence it is crucial to set it big enough that ClickHouse can accept the data batch happily without hitting memory limits.

Data modeling in ClickHouse.
ClickHouse provides in-built sharding and replication without any external dependency. Earlier versions of ClickHouse depended on ZooKeeper for storing replication information, but the recent version removed the ZooKeeper dependency by adding clickhouse-keeper.
To read data across multiple shards, we use distributed tables, a special kind of table. These tables don’t store any data themselves but act as a proxy over multiple underlying tables storing the actual data.

Like any other database, choosing the right table schema is very important since it will directly impact the performance and storage utilization. We would like to discuss three ways you can store log data into ClickHouse.

The first is the simplest and the most strict table schema where you specify every column name and data type. Any logline having a field outside this predefined schema will get dropped. From our experience, this schema will give you the fastest query capabilities. If you already know the list of all possible fields ahead, we would recommend using it. You can always add or remove columns by running ALTER TABLE queries.
The second schema uses a very new feature of ClickHouse, where it does most of the heavy lifting. You can insert logs as JSON objects and behind the scenes, ClickHouse will understand your log schema and dynamically add new columns with appropriate data type and compression. This schema should only be used if you have good control over the log schema and the number of total fields is less than 1,000. On the one hand it provides flexibility to add new columns as new log fields automatically, but at the same time, one lousy application can easily bring down the ClickHouse cluster.
The third schema stores all fields of the same data type in one array and then uses ClickHouse inbuilt array functions to query those fields. This schema scales pretty well even when there are more than 1,000 fields, as the number of columns depends on the data types used in the logs. If an array element is accessed frequently, it can be taken out as a dedicated column using the materialized column feature of ClickHouse. We recommend adopting this schema since it provides safeguards against applications logging too many fields.
Data partitioning

A partition is a unit of ClickHouse data. One common mistake ClickHouse users make is overly granular partitioning keys, resulting in too many partitions. Since our logging pipeline generates TBs of data daily, we created the table partitioned with `toStartOfHour(dateTime).` With this partitioning logic, when a query comes with the timestamp in the WHERE clause, ClickHouse knows the partition and retrieves it quickly. It also helps design efficient data purging rules according to the data retention policies.
Primary key selection

ClickHouse stores the data on disk sorted by primary key. Thus, selecting the primary key impacts the query performance and helps in better data compression. Unlike relational databases, ClickHouse doesn’t require a unique primary key per row and we can insert multiple rows with identical primary keys. Having multiple primary keys will negatively impact the insertion performance. One of the significant ClickHouse limitations is that once a table is created the primary key can not be updated.
Data skipping indexes

ClickHouse query performance is directly proportional to whether it can use the primary key when evaluating the WHERE clause. We have many columns and all these columns can not be part of the primary key. Thus queries on these columns will have to do a full scan resulting in slower queries. In traditional databases, secondary indexes can be added to handle such situations. In ClickHouse, we can add another class of indexes called data skipping indexes, which uses bloom filters and skip reading significant chunks of data that are guaranteed to have no match.
ABR
We have multiple dashboards built over the requests_error logs. Loading these dashboards were often hitting the memory limits set for the individual query/user in ClickHouse.
The dashboards built over these logs were mainly used to identify anomalies. To visually identify an anomaly in a metric, the exact numbers are not required, but an approximate number would do. For instance, to understand that errors have increased in a data center, we don’t need the exact number of errors. So we decided to use an in-house library and tool built around a concept called ABR.

ABR stands for “Adaptive Bit Rate” – the term ABR is mainly used in video streaming services where servers select the best resolution for a video stream to match the client and network connection. It is described in great detail in the blog post – Explaining Cloudflare’s ABR Analytics
In other words, the data is stored at multiple resolutions or sample intervals and the best solution is picked for each query.
The way ABR works is at the time of writing requests to ClickHouse, it writes the data in a number of tables with different sample intervals. For instance table_1 stores 100% of data, table_10 stores 10% of data, table_100 stores 1% of data and table_1000 stores 0.1% data so on and so forth. The data is duplicated between the tables. Table_10 would be a subset of table_1.
Demo
In Cloudflare, we use in-house libraries and tools to insert data into ClickHouse, but this can be achieved by using an open source tool – vector.dev
If you would like to test how log ingestion into ClickHouse works, you can refer or use the demo here.
Make sure you have docker installed and run `docker compose up` to get started.
This would bring up three containers, Vector.dev for generating vector demo logs, writing it into ClickHouse, ClickHouse container to store the logs and Grafana instance to visualize the logs.
When the containers are up, visit http://localhost:3000/dashboards to play with the prebuilt demo dashboard.
Conclusion

Logs are supposed to be immutable by nature and ClickHouse works best with immutable data. We were able to migrate one of the critical and significant log-producing applications from Elasticsearch to a much smaller ClickHouse cluster.
CPU and memory consumption on the inserter side were reduced by eight times. Each Elasticsearch document which used 600 bytes, came down to 60 bytes per row in ClickHouse. This storage gain allowed us to store 100% of the events in a newer setup. On the query side, the 99th percentile of the query latency also improved drastically.
Elasticsearch is great for full-text search and ClickHouse is great for analytics.
Use Amazon Redshift Spectrum with row-level and cell-level security policies defined in AWS Lake Formation
Post Syndicated from Anusha Challa original https://aws.amazon.com/blogs/big-data/use-amazon-redshift-spectrum-with-row-level-and-cell-level-security-policies-defined-in-aws-lake-formation/
Data warehouses and data lakes are key to an enterprise data management strategy. A data lake is a centralized repository that consolidates your data in any format at any scale and makes it available for different kinds of analytics. A data warehouse, on the other hand, has cleansed, enriched, and transformed data that is optimized for faster queries. Amazon Redshift is a cloud-based data warehouse that powers a lake house architecture, which enables you to query the data in a data warehouse and an Amazon Simple Storage Service (Amazon S3) data lake using familiar SQL statements and gain deeper insights.
Data lakes often contain data for multiple business units, users, locations, vendors, and tenants. Enterprises want to share their data while balancing compliance and security needs. To satisfy compliance requirements and to achieve data isolation, enterprises often need to control access at the row level and cell level. For example:
- If you have a multi-tenant data lake, you may want each tenant to be able to view only those rows that are associated to their tenant ID
- You may have data for multiple portfolios in the data lake and you need to control access for various portfolio managers
- You may have sensitive information or personally identifiable information (PII) that can be viewed by users with elevated privileges only
AWS Lake Formation makes it easy to set up a secure data lake and access controls for these kinds of use cases. You can use Lake Formation to centrally define security, governance, and auditing policies, thereby achieving unified governance for your data lake. Lake Formation supports row-level security and cell-level security:
- Row-level security allows you to specify filter expressions that limit access to specific rows of a table to a user
- Cell-level security builds on row-level security by allowing you to apply filter expressions on each row to hide or show specific columns
Amazon Redshift is the fastest and most widely used cloud data warehouse. Amazon Redshift Spectrum is a feature of Amazon Redshift that enables you to query data from and write data back to Amazon S3 in open formats. You can query open file formats such as Parquet, ORC, JSON, Avro, CSV, and more directly in Amazon S3 using familiar ANSI SQL. This gives you the flexibility to store highly structured, frequently accessed data in an Amazon Redshift data warehouse, while also keeping up to exabytes of structured, semi-structured, and unstructured data in Amazon S3. Redshift Spectrum integrates with Lake Formation natively. This integration enables you to define data filters in Lake Formation that specify row-level and cell-level access control for users on your data and then query it using Redshift Spectrum.
In this post, we present a sample multi-tenant scenario and describe how to define row-level and cell-level security policies in Lake Formation. We also show how these policies are applied when querying the data using Redshift Spectrum.
Solution overview
In our use case, Example Corp has built an enterprise data lake on Amazon S3. They store data for multiple tenants in the data lake and query it using Redshift Spectrum. Example Corp maintains separate AWS Identity and Access Management (IAM) roles for each of their tenants and wants to control access to the multi-tenant dataset based on their IAM role.
Example Corp needs to ensure that the tenants can view only those rows that are associated to them. For example, Tenant1 should see only those rows where tenantid = 'Tenant1' and Tenant2 should see only those rows where tenantid = 'Tenant2'. Also, tenants can only view sensitive columns such as phone, email, and date of birth associated to specific countries.
The following is a screenshot of the multi-tenant dataset we use to demonstrate our solution. It has data for two tenants: Tenant1 and Tenant2. tenantid is the column that distinguishes data associated to each tenant.

To solve this use case, we implement row-level and cell-level security in Lake Formation by defining data filters. When Example Corp’s tenants query the data using Redshift Spectrum, the service checks filters defined in Lake Formation and returns only the data that the tenant has access to.
Lake Formation metadata tables contain information about data in the data lake, including schema information, partition information, and data location. You can use them to access underlying data in the data lake and manage that data with Lake Formation permissions. You can apply row-level and cell-level security to Lake Formation tables. In this post, we provide a walkthrough using a standard Lake Formation table.
The following diagram illustrates our solution architecture.

The solution workflow consists of the following steps:
- Create IAM roles for the tenants.
- Register an Amazon S3 location in Lake Formation.
- Create a database and use AWS Glue crawlers to create a table in Lake Formation.
- Create data filters in Lake Formation.
- Grant access to the IAM roles in Lake Formation.
- Attach the IAM roles to the Amazon Redshift cluster.
- Create an external schema in Amazon Redshift.
- Create Amazon Redshift users for each tenant and grant access to the external schema.
- Users
Tenant1andTenant2assume their respective IAM roles and query data using the SQL query editor or any SQL client to their external schemas inside Amazon Redshift.
Prerequisites
This walkthrough assumes that you have the following prerequisites:
- An Amazon Redshift cluster
- An S3 bucket
- A Lake Formation administrator role
Create IAM roles for the tenants
Create IAM roles Tenant1ReadRole and Tenant2ReadRole for users with elevated privileges for the two tenants, with Amazon Redshift as the trusted entity, and attach the following policy to both roles:
Register an Amazon S3 location in Lake Formation
We use the sample multi-tenant dataset SpectrumRowLevelFiltering.csv. Complete the following steps to register the location of this dataset in Lake Formation:
- Download the dataset and upload it to the Amazon S3 path
s3://<your_bucket>/order_details/SpectrumRowLevelFiltering.csv. - On the Lake Formation console, choose Data lake locations in the navigation pane.
- Choose Register location.
- For Amazon S3 path, enter the S3 path of your dataset.
- For IAM role, choose either the
AWSServiceRoleForLakeFormationDataAccessservice-linked role (the default) or the Lake Formation administrator role mentioned in the prerequisites. - Choose Register location.

Create a database and a table in Lake Formation
To create your database and table, complete the following steps:
- Sign in to the AWS Management Console as the data lake administrator.
- On the Lake Formation console, choose Databases in the navigation pane.
- Choose Create database.
- For Name, enter
rs_spectrum_rls_blog. - If Use only IAM access control for new tables in this database is selected, uncheck it.
- Choose Create database.Next, you create a new data lake table.
- On the AWS Glue console, choose Crawlers in navigation pane.
- Choose Add crawler.
- For Crawler name, enter
order_details. - For Specify crawler source type, keep the default selections.
- For Add data store, choose Include path, and choose the S3 path to the dataset (
s3://<your_bucket>/order_details/). - For Choose IAM Role, choose Create an IAM role, with the suffix
rs_spectrum_rls_blog. - For Frequency, choose Run on demand.
- For Database, choose database you just created (
rs_spectrum_rls_blog). - Choose Finish to create the crawler.
- Grant CREATE TABLE permissions and DESCRIBE/ALTER/DELETE database permissions to the IAM role you created in Step 12.
- To run the crawler, in the navigation pane, choose Crawlers.
- Select the crawler
order_detailsand choose Run crawler.When the crawler is complete, you can find the tableorder_detailscreated under the databasers_spectrum_rls_blogin the AWS Glue Data Catalog. - On the AWS Glue console, in the navigation pane, choose Databases.
- Select the database
rs_spectrum_rls_blogand choose View tables. - Choose the table
order_details.
The following screenshot is the schema of the order_details table.

Create data filters in Lake Formation
To implement row-level and cell-level security, first you create data filters. Then you choose that data filter while granting SELECT permission on the tables. For this use case, you create two data filters: one for Tenant1 and one for Tenant2.
- On the Lake Formation console, choose Data catalog in the navigation pane, then choose Data filters.
- Choose Create new filter.
 Let’s create the first data filter filter-tenant1-order-details restricting the rows Tenant1 is able to see in table
 order_details. - For Data filter name, enter
filter-tenant1-order-details. - For Target database, choose
rs_spectrum_rls_blog. - For Target table, choose
order_details. - For Column-level access, select Include columns and then choose the following columns:
c_emailaddress,c_phone,c_dob,c_firstname,c_address,c_country,c_lastname, andtenanted. - For Row filter expression, enter
tenantid = 'Tenant1'andc_countryin(‘USA’,‘Spain’). - Choose Create filter.

- Repeat these steps to create another data filter filter-tenant2-order-details, with row filter expression
tenantid = 'Tenant2'andc_countryin(‘USA’,‘Canada’).


Grant access to IAM roles in Lake Formation
After you create the data filters, you need to attach them to the table to grant access to a principal. First let’s grant access to order_details to the IAM role Tenant1ReadRole using the data filter we created for Tenant1.
- On the Lake Formation console, in the navigation pane, under Permissions, choose Data Permissions.
- Choose Grant.
- In the Principals section, select IAM users and roles.
- For IAM users and roles, choose the role
Tenant1ReadRole. - In the LF-Tags or catalog resources section, choose Named data catalog resources.
- For Databases, choose
rs_spectrum_rls_blog. - For Tables, choose
order_details. - For Data filters, choose
filter-tenant1-order-details. - For Data filter permissions, choose Select.
- Choose Grant.

- Repeat these steps with the IAM role
Tenant2ReadRoleand data filterfilter-tenant2-order-details.

Attach the IAM roles to the Amazon Redshift cluster
To attach your roles to the cluster, complete the following steps:
- On the Amazon Redshift console, in the navigation menu, choose CLUSTERS, then select the name of the cluster that you want to update.
- On the Actions menu, choose Manage IAM roles.The IAM roles page appears.
- Either choose Enter ARN and enter an ARN of the
Tenant1ReadRoleIAM role, or choose the Tenant1ReadRole IAM role from the list. - Choose Add IAM role.
- Choose Done to associate the IAM role with the cluster.The cluster is modified to complete the change.
- Repeat these steps to add the
Tenant2ReadRoleIAM role to the Amazon Redshift cluster.
Amazon Redshift allows up to 50 IAM roles to attach to the cluster to access other AWS services.
Create an external schema in Amazon Redshift
Create an external schema on the Amazon Redshift cluster, one for each IAM role, using the following code:
Create Amazon Redshift users for each tenant and grant access to the external schema
Complete the following steps:
- Create Amazon Redshift users to restrict access to the external schemas (connect to the cluster with a user that has permission to create users or superusers) using the following code:
- Let’s create the read-only role (
tenant1_ro) to provide read-only access to the spectrum_tenant1 schema: - Grant usage on
spectrum_tenant1schema to the read-onlytenant1_rorole: - Now assign the user to the read-only
tenant1_rorole: - Repeat the same steps to grant permission to the user
tenant2_user:
Tenant1 and Tenant2 users run queries using the SQL editor or a SQL client
To test the permission levels for different users, connect to the database using the query editor with that user.
In the Query Editor in the Amazon Redshift console, connect to the cluster with tenant1_user and run the following query:
In the following screenshot, tenant1_user is only able to see records where the tenantid value is Tenant1 and only the customer PII fields specific to the US and Spain.

To validate the Lake Formation data filters, the following screenshot shows that Tenant1 can’t see any records for Tenant2.

Reconnect to the cluster using tenant2_user and run the following query:
In the following screenshot, tenant2_user is only able to see records where the tenantid value is Tenant2 and only the customer PII fields specific to the US and Canada.

To validate the Lake Formation data filters, the following screenshot shows that Tenant2 can’t see any records for Tenant1.
Conclusion
In this post, you learned how to implement row-level and cell-level security on an Amazon S3-based data lake using data filters and access control features in Lake Formation. You also learned how to use Redshift Spectrum to access the data from Amazon S3 while adhering to the row-level and cell-level security policies defined in Lake Formation.
You can further enhance your understanding of Lake Formation row-level and cell-level security by referring to Effective data lakes using AWS Lake Formation, Part 4: Implementing cell-level and row-level security.
To learn more about Redshift Spectrum, refer Amazon Redshift Spectrum Extends Data Warehousing Out to Exabytes—No Loading Required.
For more information about configuring row-level access control natively in Amazon Redshift, refer to Achieve fine-grained data security with row-level access control in Amazon Redshift.
About the authors
 Anusha Challa is a Senior Analytics Specialist Solutions Architect at AWS. Her expertise is in building large-scale data warehouses, both on premises and in the cloud. She provides architectural guidance to our customers on end-to-end data warehousing implementations and migrations.
 Ranjan Burman is an Analytics Specialist Solutions Architect at AWS.
Weird Old Computer Mice: Viagra, Bullets, & The 4th Dimension
Post Syndicated from LGR original https://www.youtube.com/watch?v=03k98-TphHs
[$] What’s in a (type) name?
Post Syndicated from original https://lwn.net/Articles/906496/
The kernel’s manual
pages are in a bit of an interesting position. They
are managed as a separate project, distinct from the kernel’s
documentation, and have the task of documenting both the kernel’s
system-call interface and the wrappers for that interface provided by the C
library. Sometimes the two objectives come into conflict, as can be seen
in a discussion that has been playing out over the course of the last year
on whether to use C standard type names to describe kernel-defined
structures.
Montenegro Is the Victim of a Cyberattack
Post Syndicated from Bruce Schneier original https://www.schneier.com/blog/archives/2022/09/montenegro-is-the-victim-of-a-cyberattack.html
Details are few, but Montenegro has suffered a cyberattack:
A combination of ransomware and distributed denial-of-service attacks, the onslaught disrupted government services and prompted the country’s electrical utility to switch to manual control.
[…]
But the attack against Montenegro’s infrastructure seemed more sustained and extensive, with targets including water supply systems, transportation services and online government services, among many others.
Government officials in the country of just over 600,000 people said certain government services remained temporarily disabled for security reasons and that the data of citizens and businesses were not endangered.
The Director of the Directorate for Information Security, Dusan Polovic, said 150 computers were infected with malware at a dozen state institutions and that the data of the Ministry of Public Administration was not permanently damaged. Polovic said some retail tax collection was affected.
Russia is being blamed, but I haven’t seen any evidence other than “they’re the obvious perpetrator.”
EDITED TO ADD (9/12): The Montenegro government is hedging on that Russia attribution. It seems to be a regular criminal ransomware attack. The Cuba Ransomware gang has Russian members, but that’s not the same thing as the government.