Post Syndicated from Mike Zorn original https://aws.amazon.com/blogs/big-data/launchdarklys-journey-from-ingesting-1-tb-to-100-tb-per-day-with-amazon-kinesis-data-streams/
This post was co-written with Mike Zorn, Software Architect at LaunchDarkly as the lead author.
LaunchDarkly’s feature management platform enables customers to release features and measure their impact. As part of this platform, SDKs gather event data, and the event ingestion platform consumes and analyzes this data to measure impact. As the platform launched and customer adoption increased, we had to scale the event data pipeline to meet the demands of the business for new use cases that required zero data loss. We will explain the challenges that we ran into with the initial architecture and the advantages achieved by using Amazon Kinesis Data Streams and additional AWS services in the new architecture. We will also go into the different factors that we considered in the Amazon Kinesis Data Streams implementation for cost efficiency and performance.
Problem statement
LaunchDarkly’s mission is to fundamentally change how companies deliver software by helping them innovate faster, deploy fearlessly, and make each release a masterpiece. With LaunchDarkly, we allow customers to deploy when they want, release when they are ready, and get total control of the code to ship fast, reduce risk, and reclaim their nights and weekends.
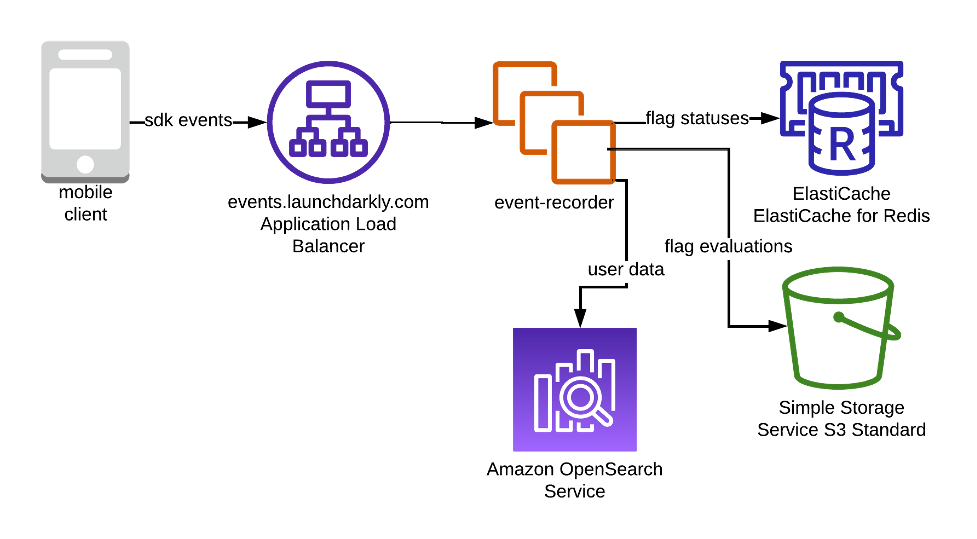
In 2017, the event ingestion platform consisted of a fleet of web servers that would write events to several databases, as shown below, that stored event data to power several features of the LaunchDarkly product. These features allow LaunchDarkly’s customers to gain full visibility into how a feature is performing over time, optimize features through experimentation, and quickly verify their implementation. Unfortunately, all of the database writes to power these features were performed within a single process on these web servers, so if any one of these databases had an availability issue, events would queue up in memory until that process ran out of memory and crashed. Since that same database would be used to write data from each web server, all of them would eventually run out of memory and crash. This cycle would repeat itself until the database availability issue was rectified. During that time, there was a permanent loss of all of the event data that was sent by the SDKs.
The current system was tolerant of some data loss as the applications that used this data was limited. But the new features and workflows had stringer requirements on data-loss prevention.
We decided to explore alternatives where all the consumers are built with isolated fault tolerance, so each consumer is independent of one another in case of any issues. We built an event-driven pipeline that would be highly durable, scalable, and also provide the ability for data replay. As a result, we scaled from ingesting about 1 TB of data a day to more than 100 TBs of data now.
Solution
The following diagram illustrates our updated design. To support the new use cases, we added Amazon Kinesis Data Streams, AWS Lambda, and Amazon Kinesis Data Firehose to the architecture.
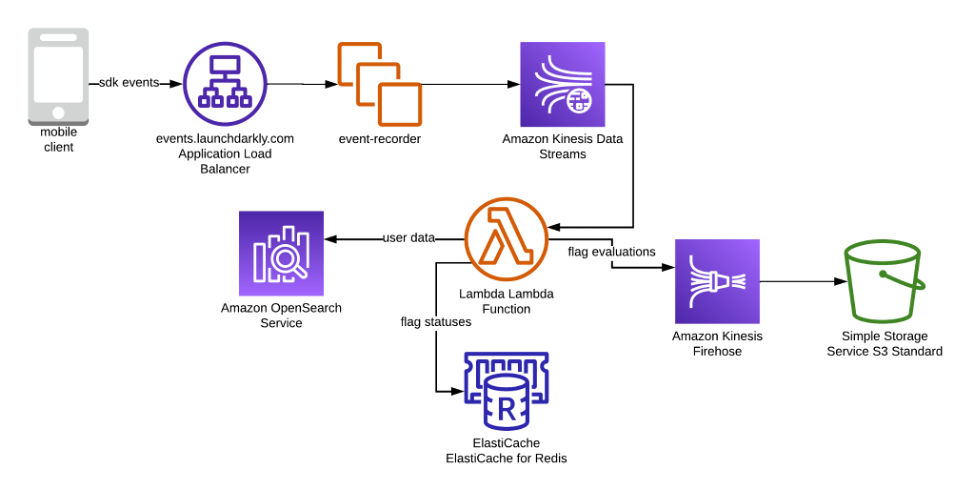
The design has the following key components
- Mobile client using the LaunchDarkly SDK to evaluate feature flags
- Application Load Balancer distributes traffic to Amazon EC2 nodes
- Amazon EC2 nodes run a go application that writes traffic to Amazon Kinesis Data Streams
- Amazon Kinesis Data Streams durably persist data
- AWS Lambda writes various types of data to databases
- Amazon OpenSearch Service records data about users
- Amazon ElastiCache records data about flag statuses
- Amazon Kinesis Firehose batches flag evaluation data and writes it to Amazon S3
- Amazon S3 records data about flag evaluations
Data flows from a LaunchDarkly SDK into the events API, which is backed by an Application Load Balancer (ALB). That ALB routes traffic to a fleet of Amazon EC2 servers. Those servers persist the data to Amazon Kinesis Data Streams. Data is then read out of Amazon Kinesis Data Streams by Lambda functions that transform and write the data in different formats to several databases. The design has a few properties that were very important to this use case.
- Durability
- Isolation
- Data replay
Durability would prevent data loss when issues in data processing arose. Isolation would prevent other consumers of data from failing when one consumer had a failure. Data replay would allow us to debug data anomalies and fix them retroactively.
Amazon Kinesis Data Streams satisfies these three properties. Data written to Amazon Kinesis Data Streams is persisted durably until the data ages out of the stream. Amazon Kinesis Data Streams allows for consumer isolation: each consumer maintains its own iterator position, so consumers can process data from a stream independently of one another. Finally, Amazon Kinesis Data Streams make data replay possible because consumers can set their shard iterator position to be in the past. For example, a consumer can be configured to start reading at 1 hour in the past if the last hour of data needs to be replayed.
A few additional technologies were considered that would allow us to achieve these design properties. Amazon Simple Notification Service (Amazon SNS) combined with Amazon Simple Queue Service (Amazon SQS) would allow for a system with durability and isolation. Data replay was not available out of the box and needed custom implementation to support this feature.
Apache Kafka was also considered, but in spite of the fact that it satisfies these design properties, it was not adopted because the team did not have prior experience with Apache Kafka. Amazon Kinesis Data Streams satisfies these design properties, and it is fully managed, which reduces the need to worry about a lack of operational expertise.
Amazon Kinesis Data Streams implementation deep dive
Before we started our Amazon Kinesis Data Streams implementation, during our initial proof-of-concept phase, we learned that although Amazon Kinesis Data Streams is fully managed, there are some aspects that need to be taken into consideration when implementing it at scale.
- Costs
- Client error handling
Amazon Kinesis Data Streams on-demand costs are proportional to the data volume put into the stream. However, if traffic is relatively even and predictable, provisioned throughput billing is more economical. Under provisioned throughput billing, customers also will be billed for put payloads, which is essentially an extra cost, especially if there are a number of small records. Since LaunchDarkly’s use case had predictable, even traffic, provisioned throughput was used. However, we had a small record size (about 100 bytes on average), so it was important to implement batching in order to control costs.
Kinesis Producer Library (KPL) supports a variety of languages, and if you use any of those, you can rely on that to efficiently batch records for you. However, since LaunchDarkly uses Go for backend applications, we had custom code because Go as a producer was not supported by KPL. Our solution was to batch data so that it was close to 25 kB (the size of a put payload). We did this by using protocol buffers and concatenating them together inside of a record.
Client errors occur when the application that writes to Amazon Kinesis Data Streams fails to write data successfully. These are important to minimize, and there are a few factors to consider to achieve that. First, design your application so that there are as few failure modes as possible in the final write path. In our application, we authenticate a request, check the value of some feature flags, and write the data to the Amazon Kinesis Data Stream. We optimized our code to not perform any database queries or network requests before the data is written to Amazon Kinesis Data Streams to avoid any query/call failures, which can cause data loss. Another step to implement is to increase the number of retries in the AWS SDK (we use 10). This way, if there’s a transient issue writing data to Amazon Kinesis Data Streams, the data will have a better likelihood of being persisted. Finally, having a coarse-grained rate limit is important if you’re using provisioned streams. Sometimes end producers will inadvertently configure an SDK to send incredible amounts of data to our system. In these scenarios, we have a rate limiter to prevent a single tenant from consuming too much of our provisioned capacity.
After we figured out how to address all these issues, we proceeded to migrate to the new architecture in two phases.
The first was to send our data into Amazon Kinesis Data Streams. The second was to move our consumer workload from our Amazon EC2 servers to AWS Lambda. For both of these phases, we used LaunchDarkly feature flag with a percentage rollout to gradually ramp up traffic to the new architecture.
The first phase, sending data to Amazon Kinesis Data Streams, went very smoothly. The batching mechanism worked as expected, and our throughput was also as expected. One thing that we had not expected was an increase in data transfer costs out of our virtual private cloud (VPC). By default, your Amazon Kinesis Data Streams traffic will go through your VPC’s network address translation (NAT) gateway. The charges are based on the data volume that flows through the NAT gateways. To reduce these costs, the design was optimized to configure a AWS Private Link endpoint in each Availability Zone where the Amazon EC2 application is hosted. This design optimization minimizes data transfer costs.
The second phase, moving the workload to AWS Lambda, did not go quite as smoothly. It turns out that dramatically changing the concurrency of a workload from tens of servers to hundreds of Lambda execution contexts can have some unintended consequences. In Amazon EC2, we aggregated our flag evaluation data on each host and flushed a file to Amazon S3 once a minute. In AWS Lambda, this aggregation became about 20 times less effective because of the increased concurrency. To overcome the issue of too many files for our downstream data processing systems to handle, we used Amazon Kinesis Data Firehose. We used it to automatically batch data into files in Amazon S3. Once we integrated that service into the architecture, we were able to migrate our entire workload to AWS Lambda.
Based on LaunchDarkly’s experience, Amazon Kinesis Data Streams are a good option for event data processing use cases. Once events are durably persisted in Amazon Kinesis Data Streams, stream consumers are easy to create, and event retention is managed for you. If you’re considering using Amazon Kinesis Data Streams, there are a few things you should account for in your implementation.
- Configure AWS Private Link endpoints to reduce data transfer costs.
- Use the KPL or implement your own record batching so that payloads are close to 25 kB.
- Use rate limits to ensure you do not exceed provisioned capacity (if you aren’t using on-demand streams).
- Increase retry counts to ensure data is written.
Conclusion
This system has been in production for over 3 years now, and we are very happy with it. It’s scaled from ingesting about 1 TB per day in 2018 to more than 100 TB per day now. Through that growth, this system has proven to be reliable, performant, and cost-effective. The system has maintained 99.99 percent availability and 99.99999 percent durability of data. End-to-end processing times have been within 30 s. Costs have scaled with increased usage, but they are well within our budget for this workload.
We hope that this post can guide you to build your event processing and analytics pipeline on top of Amazon Kinesis Data Streams while leveraging the power of fully managed technologies to not only accelerate business goals but also have a flexible system that onboards new use cases and features with ease.
About the Authors
 Mike Zorn is a Software Architect at LaunchDarkly. He’s helped LaunchDarkly’s infrastructure scale from a hundred million feature flag evaluations a day to the tens of trillions of evaluations that are served nowadays. He’s been in the software industry for over a decade, working at organizations ranging from the federal government to small startups.
 Chinmayi Narasimhadevara is a Solutions Architect focused on Analytics and Machine Learning at Amazon Web Services. She has over 15 years of experience in information technology. She helps AWS customers build advanced, highly scalable, and performant solutions.