Tag Archives: Amazon OpenSearch Service

Amazon CloudWatch metrics for Amazon OpenSearch Service storage and shard skew health

Post Syndicated from Nikhil Agarwal original https://aws.amazon.com/blogs/big-data/amazon-cloudwatch-metrics-for-amazon-opensearch-service-storage-and-shard-skew-health/

Amazon OpenSearch Service is a managed service that makes it easy to deploy, operate, and scale OpenSearch clusters in AWS to perform interactive log analytics, real-time application monitoring, website search, and more. OpenSearch is an open source, distributed search and analytics suite.

When working with OpenSearch Service, shard strategy is key. Shards distribute your workload across the data nodes of your cluster. When creating an index, you tell OpenSearch Service how many primary shards to create and how many replicas to create of each shard. The primary shards are independent partitions of the full dataset. OpenSearch Service automatically distributes your data across the primary shards in an index. Our recommendation is to use two replicas for your index. For example, if you set your index’s shard count to three primary shards and two replicas, you will have a total of nine shards. Properly configured indexes can help boost overall domain performance, whereas a misconfigured index will lead to storage and performance skew.

OpenSearch Service distributes the shards in your indexes to the data nodes in your domain, ensuring that no primary shard and its replicas are placed on the same node. The data for the shards are stored in the node’s storage. If your indexes (and therefore their shards) are very different sizes, the storage used on the data nodes in the domain will be unequal, or skewed. Storage skew leads to uneven memory and CPU utilization, intermittent and uneven latency, and uneven queueing and rejecting of requests. Therefore, it’s important to configure and maintain indexes such that shards can be distributed evenly across the data nodes of your cluster.

In this post, we explore how to deploy Amazon CloudWatch metrics using an AWS CloudFormation template to monitor an OpenSearch Service domain’s storage and shard skew. This solution uses an AWS Lambda function to extract storage and shard distribution metadata from your OpenSearch Service domain, calculates the level of skew, and then pushes this information to CloudWatch metrics so that you can easily monitor, alert, and respond.

Solution overview

The solution and associated resources are available for you to deploy into your own AWS account as a CloudFormation template. The template deploys the following resources:

  • An AWS Identity and Access Management (IAM) role for the Lambda function called OpensearchSkewMetricsLambdaRole. This allows write access to CloudWatch metrics and access to the CloudWatch log group and OpenSearch APIs.
  • An AWS Lambda function called Opensearch-SkewMetricsPublisher-py.
  • An Amazon CloudWatch log group for the Lambda function called /aws/lambda/Opensearch-skewmetrics-publisher-py.
  • An Amazon EventBridge rule for the Lambda function called EventRuleForOSSkew.
  • The following CloudWatch metrics for the Lambda function:
    • aws_/<region-name>/<MetricIdentifier>/_storagemetric
    • aws_/<region-name>/<MetricIdentifier>/_shardmetric

Prerequisites

For this walkthrough, you should have the following prerequisites:

  • An AWS account.
  • An OpenSearch Service domain.
  • This post requires you to add a Lambda role to the OpenSearch Service domain’s security configuration access policy. If your domain is using fine-grained access control, then you need to follow the steps as described in the section Mapping roles to users to enable access for the newly deployed Lambda execution role to the domain after deploying the CloudFormation template.

Deploy the CloudFormation template

To deploy the CloudFormation template, complete the following steps:

  1. Log in to your AWS account.
  2. Select the Region where you’re running your OpenSearch Service domain.
  3. To launch your CloudFormation stack, choose Launch Stack
  4. For Stack name, enter a name for the stack (maximum length 30 characters).
  5. For MetricIdentifier, enter a unique identifier that will help you identify the custom CloudWatch metrics for your domain.
  6. For OpensearchDomainURL, enter the domain endpoint that you are monitoring.
  7. Choose Next.
  8. Select I acknowledge that AWS CloudFormation might create IAM resources, then choose Create stack.
  9. Wait for the stack creation to complete.
  10. On the Lambda console, choose Functions in the navigation pane.
  11. Choose the Lambda function called Opensearch-SkewMetricsPublisher-py-<stackname>.
  12. In the Code section, choose Test.
  13. Keep the default values for the test event and run a quick test.

Make sure to grant the Lambda execution role permission to the OpenSearch Service domain’s resource-based policy, if you are using one. If fine-grained access control is enabled on the domain, then follow the steps in Mapping roles to users (as mentioned in the prerequisites) to allow the Lambda function to read from the domain in read-only access.

The Lambda function that sends OpenSearch domain metrics to CloudWatch is set to a default frequency of 1 day. You can change this configuration to monitor the domain at the required granularity by updating the event schedule for the rule deployed by the CloudFormation stack on the EventBridge console. Note that if the frequency is set to 1 minute, this will trigger the Lambda function every minute and will increase the Lambda cost.

This solution uses the cat/allocation API, which provides the number of data nodes in the domain along with each data node’s number of shards and storage usage attributes. For further details on domain storage and shard skew, refer to Node shard and storage skew. The Lambda function processes and sorts each data node’s storage and shard skew from the average value. Any data node’s skew above 10% from the average is generally considered to be significantly skewed. This will start to impact CPU, network, and disk bandwidth usage because the nodes with the highest storage utilization tend to be the resource-strained nodes, whereas nodes with less than 10% usage represent underutilized capacity.

Refer to Demystifying Elasticsearch shard allocation for details related to shard size and shard count strategy. In general, we recommend keeping shard sizes between 10–30 GB for workloads where search latency is a key performance objective and 30–50 GB for write-heavy workloads. For shard count, we recommend maintaining index shard counts that are divisible by the data node count. For additional details, refer to Sizing Amazon OpenSearch Service domains and Shard strategy.

View skew metrics in CloudWatch

After you run this solution in your account, it will create two CloudWatch metrics for monitoring. To access these CloudWatch metrics, use the following steps:

  1. On the CloudWatch console, under Metrics in the navigation pane, choose All metrics.
  2. Choose Browse and select Custom namespaces. You should see two custom metrics ending with _storageworkspace and _shardworkspace, respectively.
  3. Choose either of the custom metrics and then select NodeID.
  4. On the list of node IDs, select all the nodes displayed in the list, and the graph will be plotted automatically.

You can hover the mouse over the plotted lines to see the node skew information.

The following screenshots show examples of how the CloudWatch metrics will appear on the console.

The storage skew metrics will be similar to the following screenshot. Storage skew metrics shows the domain storage skew. If you hover over the graph, it shows the node list with available nodes in the domain. This list is sorted by the storage size (largest to smallest). The Lambda function will periodically post the latest storage skew results.

The shard skew metrics will be similar to the following screenshot. Shard skew metrics show the domain shard skew. If you hover over the graph, it shows the node list with available nodes in the domain. This list is sorted by the shard size (largest to smallest). The Lambda function will periodically post the latest storage skew results.

Storage skew occurs when one or more nodes within the domain has significantly more storage than other nodes. The CloudWatch metric will show higher deviation of storage usage for these nodes vs. other nodes. Similarly, shard skew occurs when one or more nodes has significantly more shards than others nodes. The CloudWatch metric will show higher deviation for these nodes vs. other nodes in the domain. When the domain storage or shard skew is detected, you can raise a support case to work with the AWS team for remediation actions. See How do I rebalance the uneven shard distribution in my Amazon OpenSearch Service cluster for information on how to take remediation actions to configure your domain shard strategy for optimal performance.

Costs

The cost associated with using this solution would be minimal, around few cents per month since it generates CloudWatch metrics. The solution also runs Lambda code, and in this case the Lambda functions make API calls. For pricing details, refer to Amazon CloudWatch Pricing and AWS Lambda Pricing.

Clean up

If you decide that you no longer want to keep the Lambda function and associated resources, you can navigate to the AWS CloudFormation console, choose the stack, and choose Delete.

If you want to add the CloudWatch skew monitor metrics mechanism back in at any point, you can create the stack again from the CloudFormation template.

Conclusion

You can use this solution to get a better understanding of your OpenSearch Service domain’s storage and shard skew to improve its performance and possibly lower the cost of operating your domain. See Use Elasticsearch’s _rollover API For efficient storage distribution for more details related to shard allocation and efficient storage distribution strategy.


About the authors

Nikhil Agarwal is Sr. Technical Manager with Amazon Web Services. He is passionate about helping customers achieve operational excellence in their cloud journey and working activity on technical solutions. He is also AI/ML enthusiastic and deep dives into customer’s ML-specific use cases. Outside of work, he enjoys traveling with family and exploring different gadgets.

Karthik Chemudupati is a Principal Technical Account Manager (TAM) with AWS, focused on helping customers achieve cost optimization and operational excellence. He has more than 19 years of IT experience in software engineering, cloud operations and automations. Karthik joined AWS in 2016 as a TAM and worked with more than dozen Enterprise Customers across US-West. Outside of work, he enjoys spending time with his family.

Gene Alpert is a Senior Analytics Specialist with AWS Enterprise Support. He has been focused on our Amazon OpenSearch Service customers and ecosystem for the past three years. Gene joined AWS in 2017. Outside of work he enjoys mountain biking, traveling, and playing Population:One in VR.

Try semantic search with the Amazon OpenSearch Service vector engine

Post Syndicated from Stavros Macrakis original https://aws.amazon.com/blogs/big-data/try-semantic-search-with-the-amazon-opensearch-service-vector-engine/

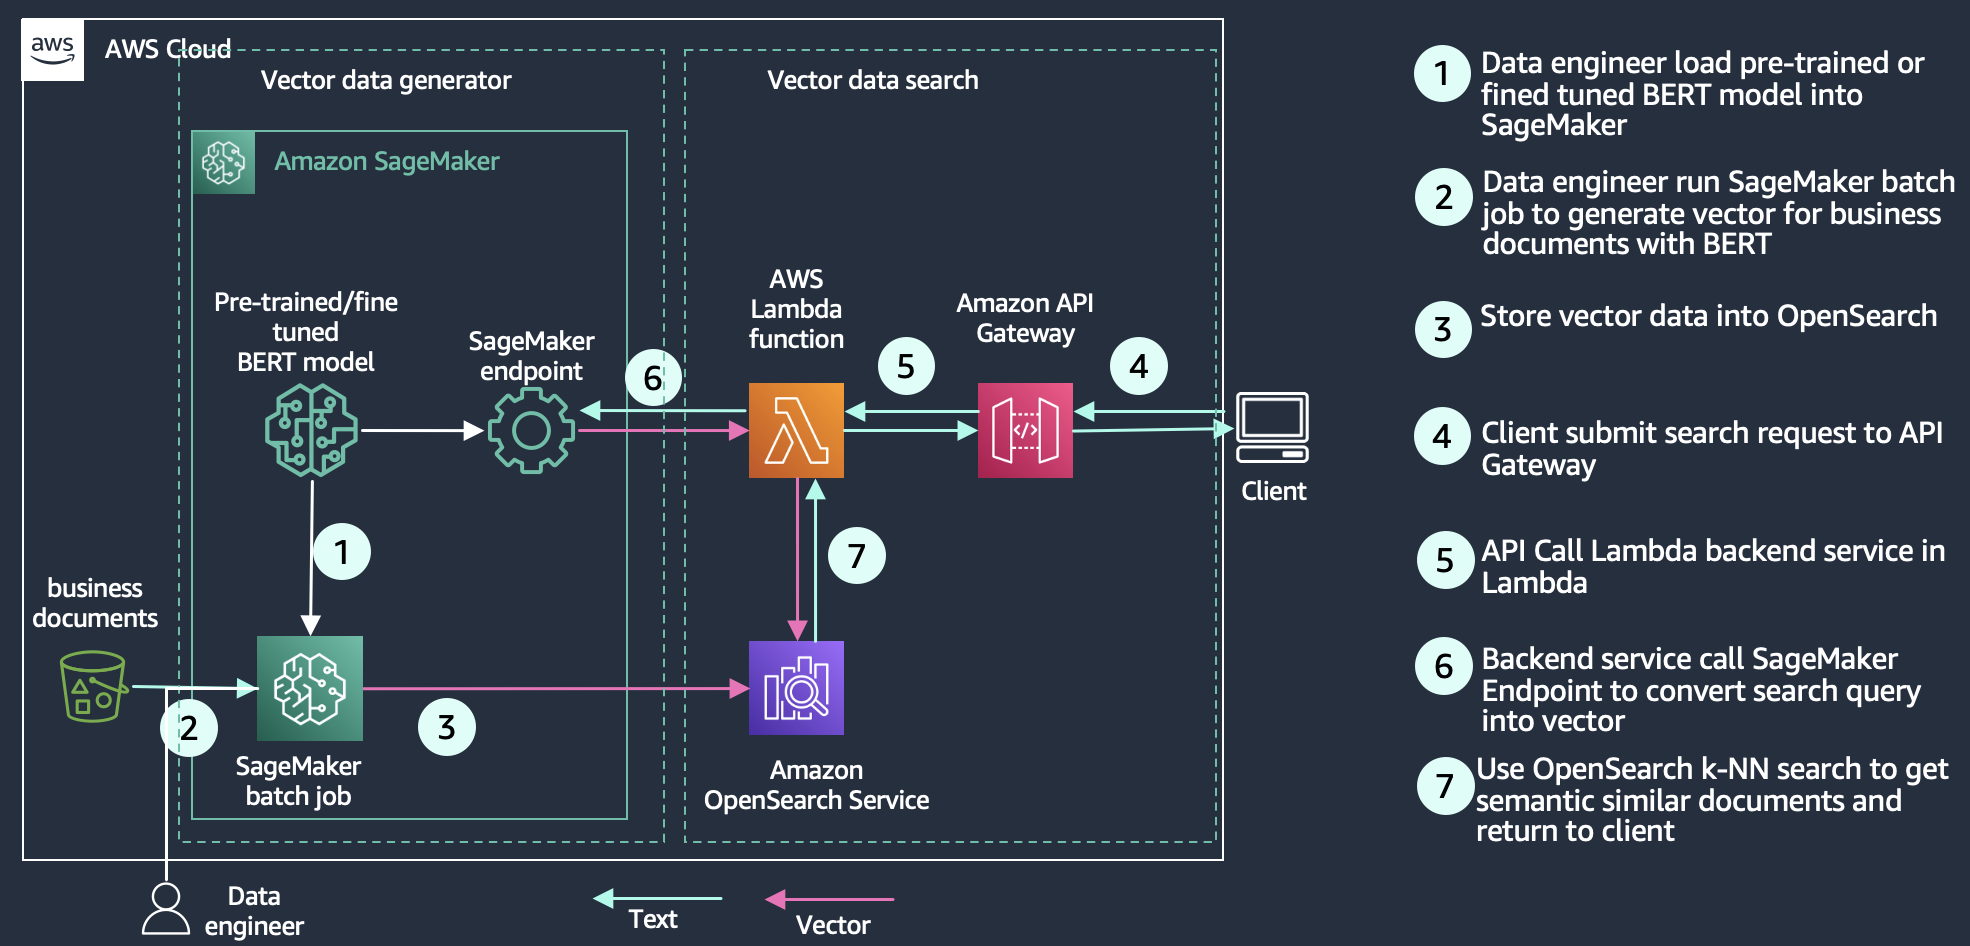
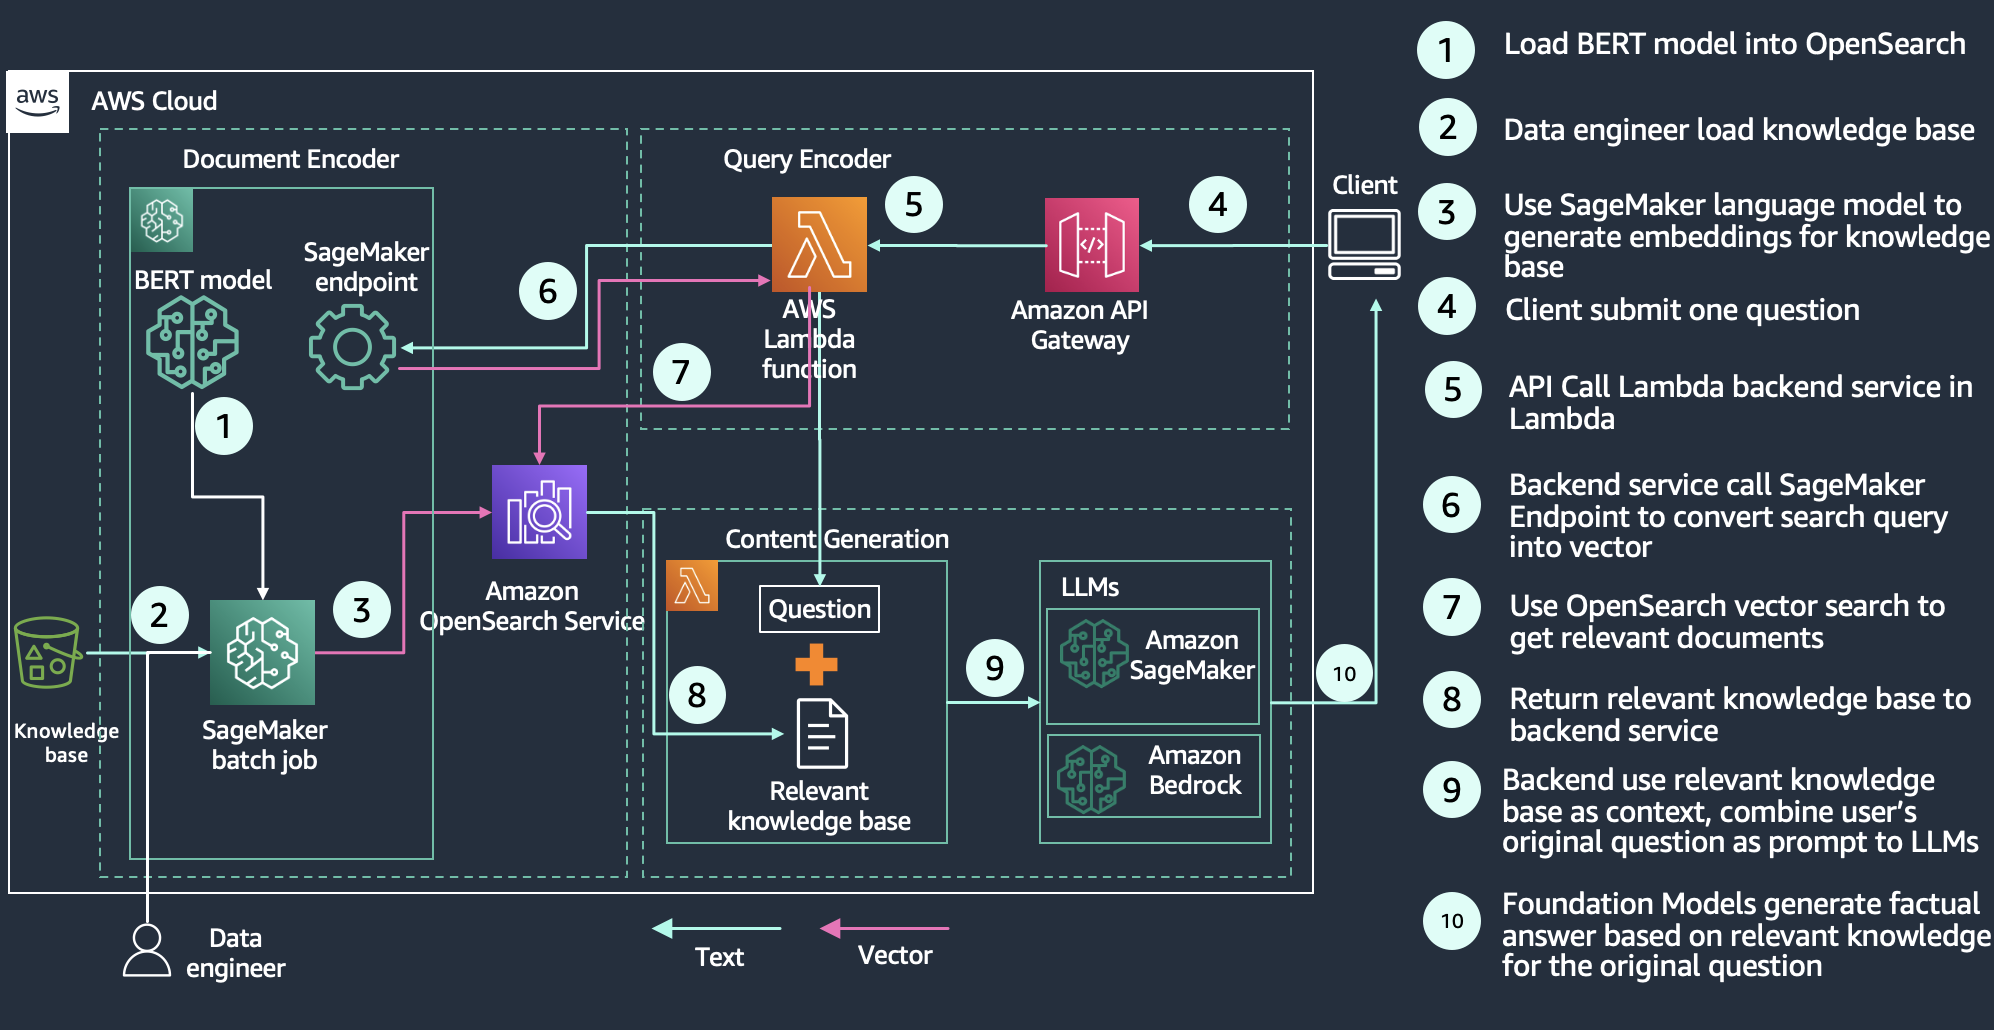
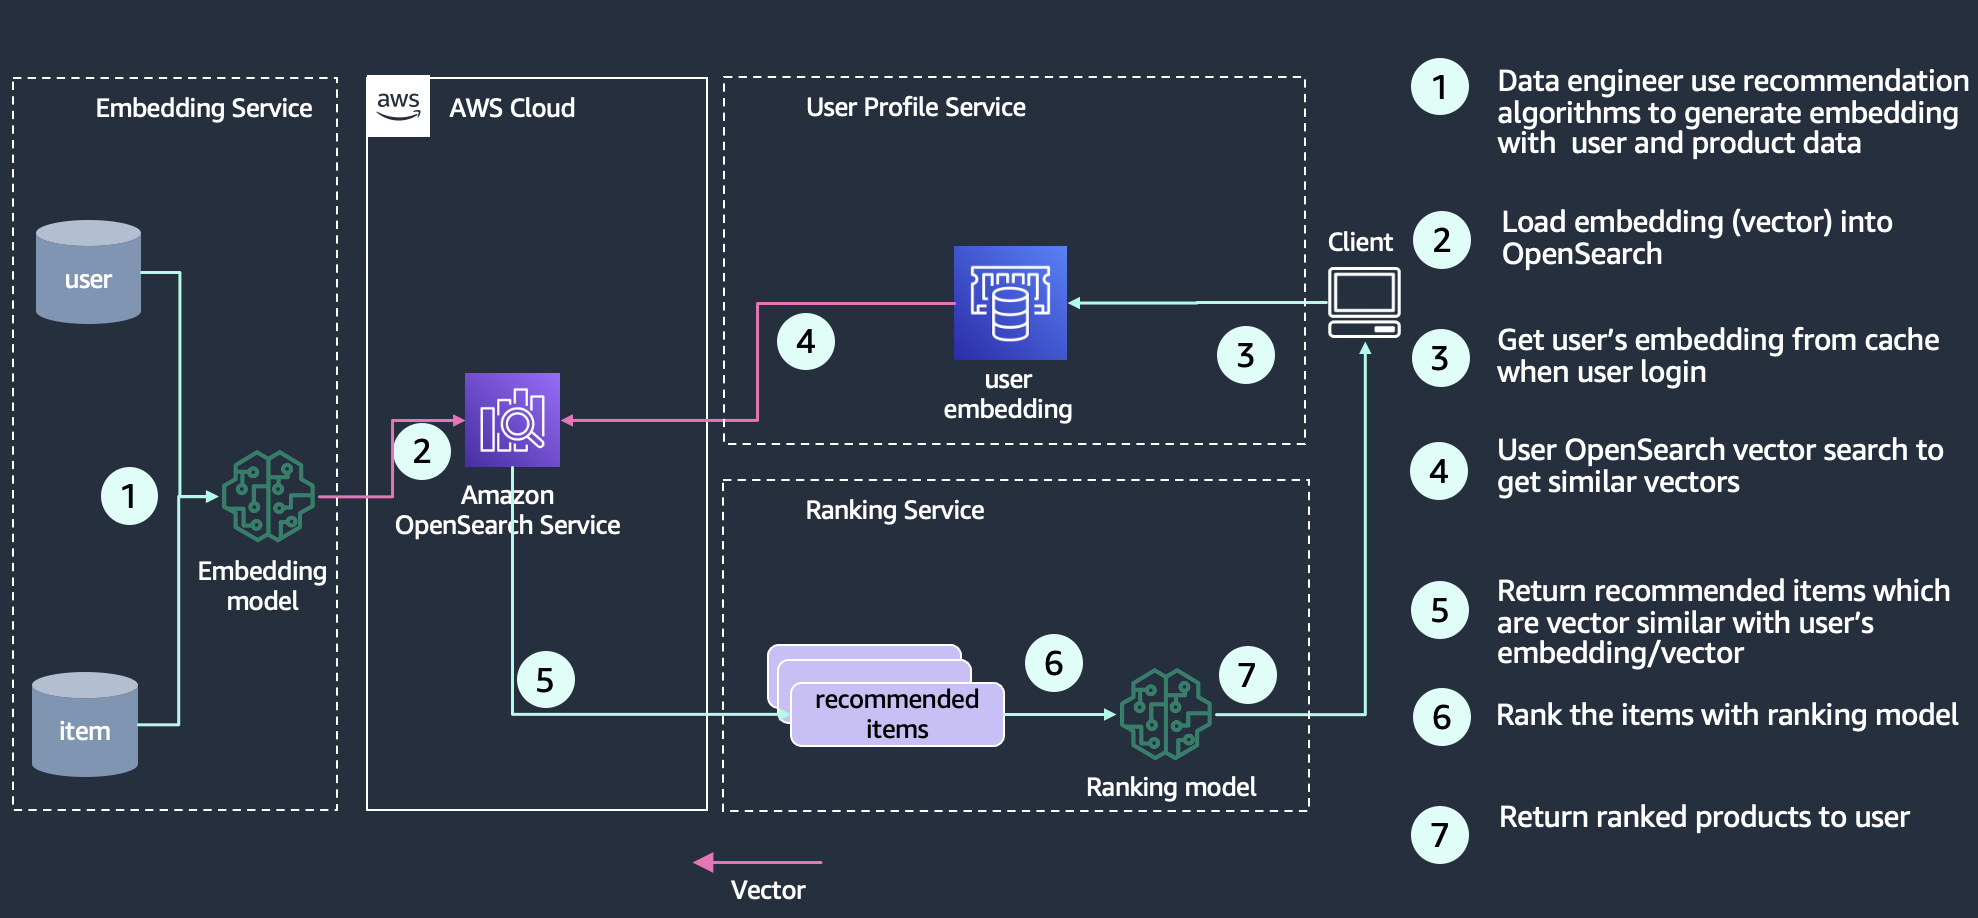
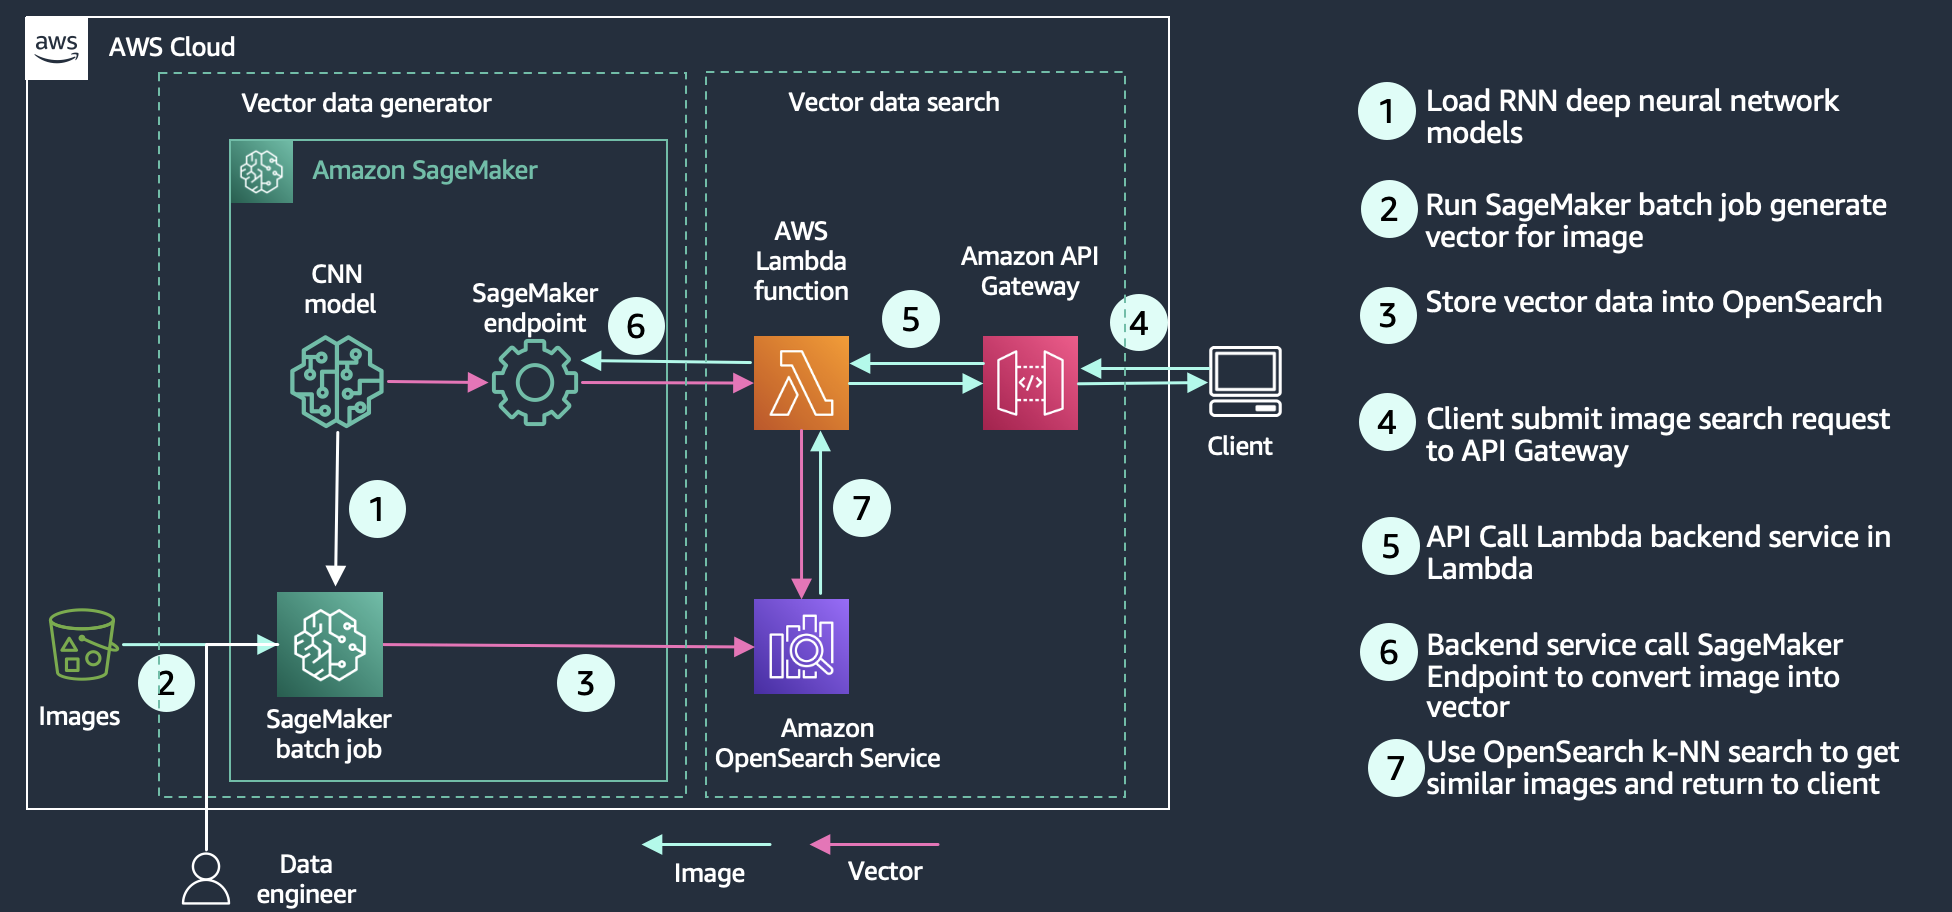
Amazon OpenSearch Service has long supported both lexical and vector search, since the introduction of its kNN plugin in 2020. With recent developments in generative AI, including AWS’s launch of Amazon Bedrock earlier in 2023, you can now use Amazon Bedrock-hosted models in conjunction with the vector database capabilities of OpenSearch Service, allowing you to implement semantic search, retrieval augmented generation (RAG), recommendation engines, and rich media search based on high-quality vector search. The recent launch of the vector engine for Amazon OpenSearch Serverless makes it even easier to deploy such solutions.

OpenSearch Service supports a variety of search and relevance ranking techniques. Lexical search looks for words in the documents that appear in the queries. Semantic search, supported by vector embeddings, embeds documents and queries into a semantic high-dimension vector space where texts with related meanings are nearby in the vector space and therefore semantically similar, so that it returns similar items even if they don’t share any words with the query.

We’ve put together two demos on the public OpenSearch Playground to show you the strengths and weaknesses of the different techniques: one comparing textual vector search to lexical search, the other comparing cross-modal textual and image search to textual vector search. With OpenSearch’s Search Comparison Tool, you can compare the different approaches. For the demo, we’re using the Amazon Titan foundation model hosted on Amazon Bedrock for embeddings, with no fine tuning. The dataset consists of a selection of Amazon clothing, jewelry, and outdoor products.

Background

A search engine is a special kind of database, allowing you to store documents and data and then run queries to retrieve the most relevant ones. End-user search queries usually consist of text entered in a search box. Two important techniques for using that text are lexical search and semantic search. In lexical search, the search engine compares the words in the search query to the words in the documents, matching word for word. Only items that have all or most of the words the user typed match the query. In semantic search, the search engine uses a machine learning (ML) model to encode text from the source documents as a dense vector in a high-dimensional vector space; this is also called embedding the text into the vector space. It similarly codes the query as a vector and then uses a distance metric to find nearby vectors in the multi-dimensional space. The algorithm for finding nearby vectors is called kNN (k Nearest Neighbors). Semantic search does not match individual query terms—it finds documents whose vector embedding is near the query’s embedding in the vector space and therefore semantically similar to the query, so the user can retrieve items that don’t have any of the words that were in the query, even though the items are highly relevant.

Textual vector search

The demo of textual vector search shows how vector embeddings can capture the context of your query beyond just the words that compose it.

In the text box at the top, enter the query tennis clothes. On the left (Query 1), there’s an OpenSearch DSL (Domain Specific Language for queries) semantic query using the amazon_products_text_embedding index, and on the right (Query 2), there’s a simple lexical query using the amazon_products_text index. You’ll see that lexical search doesn’t know that clothes can be tops, shorts, dresses, and so on, but semantic search does.

Search Comparison Tool

Compare semantic and lexical results

Similarly, in a search for warm-weather hat, the semantic results find lots of hats suitable for warm weather, whereas the lexical search returns results mentioning the words “warm” and “hat,” all of which are warm hats suitable for cold weather, not warm-weather hats. Similarly, if you’re looking for long dresses with long sleeves, you might search for long long-sleeved dress. A lexical search ends up finding some short dresses with long sleeves and even a child’s dress shirt because the word “dress” appears in the description, whereas the semantic search finds much more relevant results: mostly long dresses with long sleeves, with a couple of errors.

Cross-modal image search

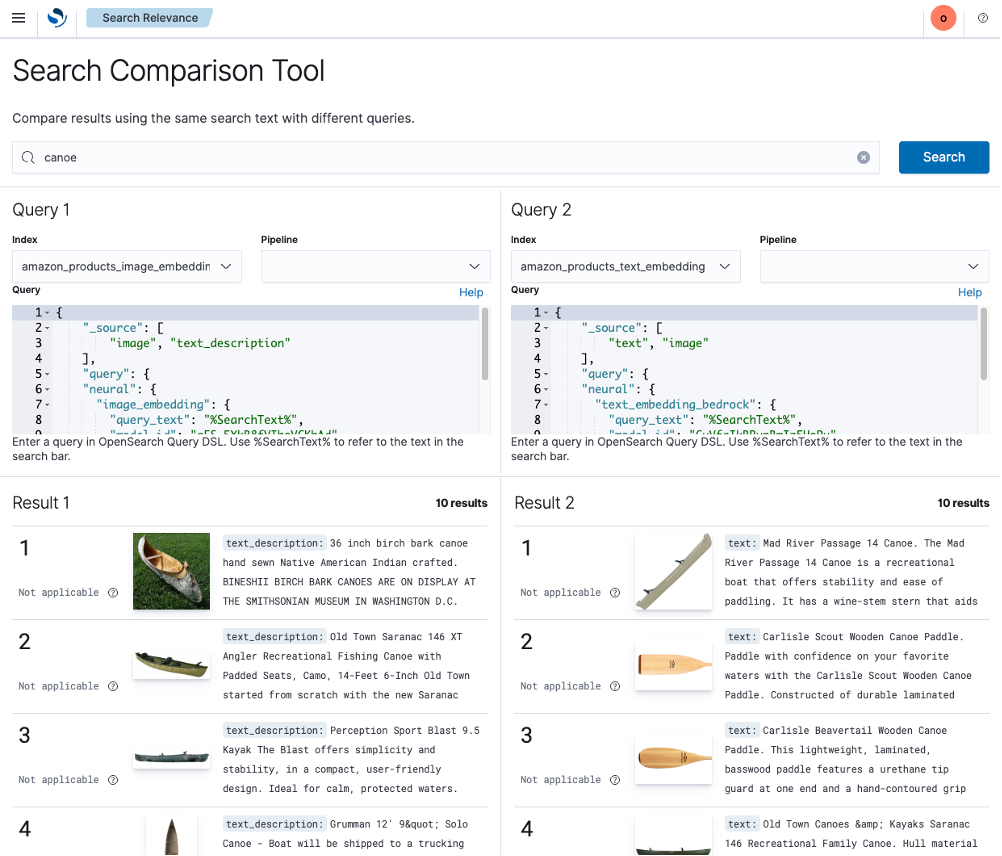
The demo of cross-modal textual and image search shows searching for images using textual descriptions. This works by finding images that are related to your textual descriptions using a pre-production multi-modal embedding. We’ll compare searching for visual similarity (on the left) and textual similarity (on the right). In some cases, we get very similar results.

Search Comparison Tool

Compare image and textual embeddings

For example, sailboat shoes does a good job with both approaches, but white sailboat shoes does much better using visual similarity. The query canoe finds mostly canoes using visual similarity—which is probably what a user would expect—but a mixture of canoes and canoe accessories such as paddles using textual similarity.

If you are interested in exploring the multi-modal model, please reach out to your AWS specialist.

Building production-quality search experiences with semantic search

These demos give you an idea of the capabilities of vector-based semantic vs. word-based lexical search and what can be accomplished by utilizing the vector engine for OpenSearch Serverless to build your search experiences. Of course, production-quality search experiences use many more techniques to improve results. In particular, our experimentation shows that hybrid search, combining lexical and vector approaches, typically results in a 15% improvement in search result quality over lexical or vector search alone on industry-standard test sets, as measured by the NDCG@10 metric (Normalized Discounted Cumulative Gain in the first 10 results). The improvement is because lexical outperforms vector for very specific names of things, and semantic works better for broader queries. For example, in the semantic vs. lexical comparison, the query saranac 146, a brand of canoe, works very well in lexical search, whereas semantic search doesn’t return relevant results. This demonstrates why the combination of semantic and lexical search provides superior results.

Conclusion

OpenSearch Service includes a vector engine that supports semantic search as well as classic lexical search. The examples shown in the demo pages show the strengths and weaknesses of different techniques. You can use the Search Comparison Tool on your own data in OpenSearch 2.9 or higher.

Further information

For further information about OpenSearch’s semantic search capabilities, see the following:


About the author

Stavros Macrakis is a Senior Technical Product Manager on the OpenSearch project of Amazon Web Services. He is passionate about giving customers the tools to improve the quality of their search results.

Amazon OpenSearch Serverless expands support for larger workloads and collections

Post Syndicated from Prashant Agrawal original https://aws.amazon.com/blogs/big-data/amazon-opensearch-serverless-expands-support-for-larger-workloads-and-collections/

We recently announced new enhancements to Amazon OpenSearch Serverless that can scan and search source data sizes of up to 6 TB. At launch, OpenSearch Serverless supported searching one or more indexes within a collection, with the total combined size of up to 1 TB. With the support for 6 TB source data, you can now scale up your log analytics, machine learning applications, and ecommerce data more effectively. With OpenSearch Serverless, you can enjoy the benefits of these expanded limits without having to worry about sizing, monitoring your usage, or manually scaling an OpenSearch domain. If you are new to OpenSearch Serverless, refer to Log analytics the easy way with Amazon OpenSearch Serverless to get started.

The compute capacity in OpenSearch Serverless used for data ingestion and search and query is measured in OpenSearch Compute Units (OCUs). To support larger datasets, we have raised the OCU limit from 50 to 100 for indexing and search, including redundancy for Availability Zone outages and infrastructure failures. These OCUs are shared among various collections, each containing one or more indexes of varied sizes. You can configure maximum OCU limits on search and indexing independently using the AWS Command Line Interface (AWS CLI), SDK, or AWS Management Console to manage costs. Furthermore, you can have multiple 6 TB collections. If you wish to expand the OCU limits for indexes and collection sizes beyond 6 TB, reach out to us through AWS Support.

Set max OCU to 100

To get started, you must first change the OCU limits for indexing and search to 100. Note that you only pay for the resources consumed and not for the max OCU configuration.

Ingesting the data

You can use the load generation scripts shared in the following workshop or you can use your own application or data generator to create load. You can run multiple instances of these scripts to generate a burst in indexing requests. As seen in the following screenshot, in this test, we created six indexes approximating to 1 TB or more.

Auto scaling resources in OpenSearch Serverless

The highlighted points in the following figures show how OpenSearch Serverless responds to the increasing indexing traffic from 2,000 bulk request operations to 7,000 bulk requests per second by auto scaling the OCUs. Each bulk request includes 7,500 documents. OpenSearch Serverless uses various system signals to automatically scale out the OCUs based on your workload demand.

OpenSearch Serverless also scales down indexing OCUs when there is a decrease in your workload’s activity level. The highlighted points in the following figures show a gradual decrease in indexing traffic from 7,000 bulk ingest operations to less than 1,000 operations per second. OpenSearch Serverless reacts to the changes in load by reducing the number of OCUs.

Conclusion

We encourage you to take advantage of the 6 TB index support and put it to the test! Migrate your data, explore the improved throughput, and take advantage of the enhanced scaling capabilities. Our goal is to deliver a seamless and efficient experience that aligns with your requirements.

To get started, refer to Log analytics the easy way with Amazon OpenSearch Serverless. To get hands-on with OpenSearch Serverless, follow the Getting started with Amazon OpenSearch Serverless workshop, which has a step-by-step guide for configuring and setting up an OpenSearch Serverless collection.

If you have feedback about this post, share it in the comments section. If you have questions about this post, start a new thread on the Amazon OpenSearch Service forum or contact AWS Support.


About the author

Prashant Agrawal is a Sr. Search Specialist Solutions Architect with Amazon OpenSearch Service. He works closely with customers to help them migrate their workloads to the cloud and helps existing customers fine-tune their clusters to achieve better performance and save on cost. Before joining AWS, he helped various customers use OpenSearch and Elasticsearch for their search and log analytics use cases. When not working, you can find him traveling and exploring new places. In short, he likes doing Eat → Travel → Repeat.

Configure SAML federation for Amazon OpenSearch Serverless with Okta

Post Syndicated from Aish Gunasekar original https://aws.amazon.com/blogs/big-data/configure-saml-federation-for-amazon-opensearch-serverless-with-okta/

Modern applications apply security controls across many systems and their subsystems. Keeping all of these systems in sync would be a major undertaking if you tried to implement it separately. Centralized identity management is the way to maintain a single identity provider (IdP) that can authenticate actors and manage and distribute their rights.

OpenSearch is an open-source search and analytics suite that enables you to ingest, store, analyze, and visualize full text and log data. Amazon OpenSearch Serverless makes it simple to deploy, scale, and operate OpenSearch in the AWS Cloud, freeing you from the undifferentiated heavy lifting of sizing, scaling, and operating an OpenSearch cluster. When you use OpenSearch Serverless, you can integrate with your existing Security Assertion Markup Language 2.0 (SAML)-compliant IdP to provide granular access control for your OpenSearch Serverless collections. Our customers use a variety of IdPs, including AWS IAM Identity Center (successor to AWS SSO), Okta, Keycloak, Active Directory Federation Services (AD FS), and Auth0.

In this post, you will learn how to use Okta as your IdP and integrate it with OpenSearch Serverless to securely manage your users and groups for secure access to your data.

Solution overview

The flow of access requests is depicted in the following figure.

When you navigate to OpenSearch Dashboards, the workflow steps are as follows:

  1. OpenSearch Serverless generates a SAML authentication request.
  2. OpenSearch Serverless redirects your request back to the browser.
  3. The browser redirects to the Okta URL via the Okta application setup.
  4. Okta parses the SAML request, authenticates the user, and generates a SAML response.
  5. Okta returns the encoded SAML response to the browser.
  6. The browser sends the SAML response back to the OpenSearch Serverless Assertion Consumer Services (ACS) URL.
  7. ACS verifies the SAML response and logs in the user with the permissions defined in the data access policy.

Prerequisites

Complete the following prerequisite steps:

  1. Create an OpenSearch Serverless collection. For instructions, refer to Preview: Amazon OpenSearch Serverless – Run Search and Analytics Workloads without Managing Clusters.
  2. Make a note of your AWS account ID to use while configuring your application in Okta.
  3. Create an Okta account, which you will use as an IdP.
  4. Create users and a group in Okta:
    1. Log in to your Okta account, and in the navigation pane, choose Directory, then choose Groups.
    2. Choose Add Group and name itopensearch-serverless, then choose Save.
    3. Choose Assign People to add users.
    4. You can add users to theopensearch-serverlessgroup by choosing the plus sign next to the user name, or you can choose Add All.
    5. Add your users, then choose Save.
    6. To create new users, choose People in the navigation pane under Directory, then choose Add Person.
    7. Provide your first name, last name, user name (email ID), and primary email address.
    8. For Password, choose Set by admin and First-time password.
    9. To create your user, choose Save.
    10. In the navigation pane, choose Groups, then choose theopensearch-serverless group you created earlier.

The following graphic gives a quick demonstration of setting up a user and group.

Configure an application in Okta

To configure an application in Okta, complete the following steps:

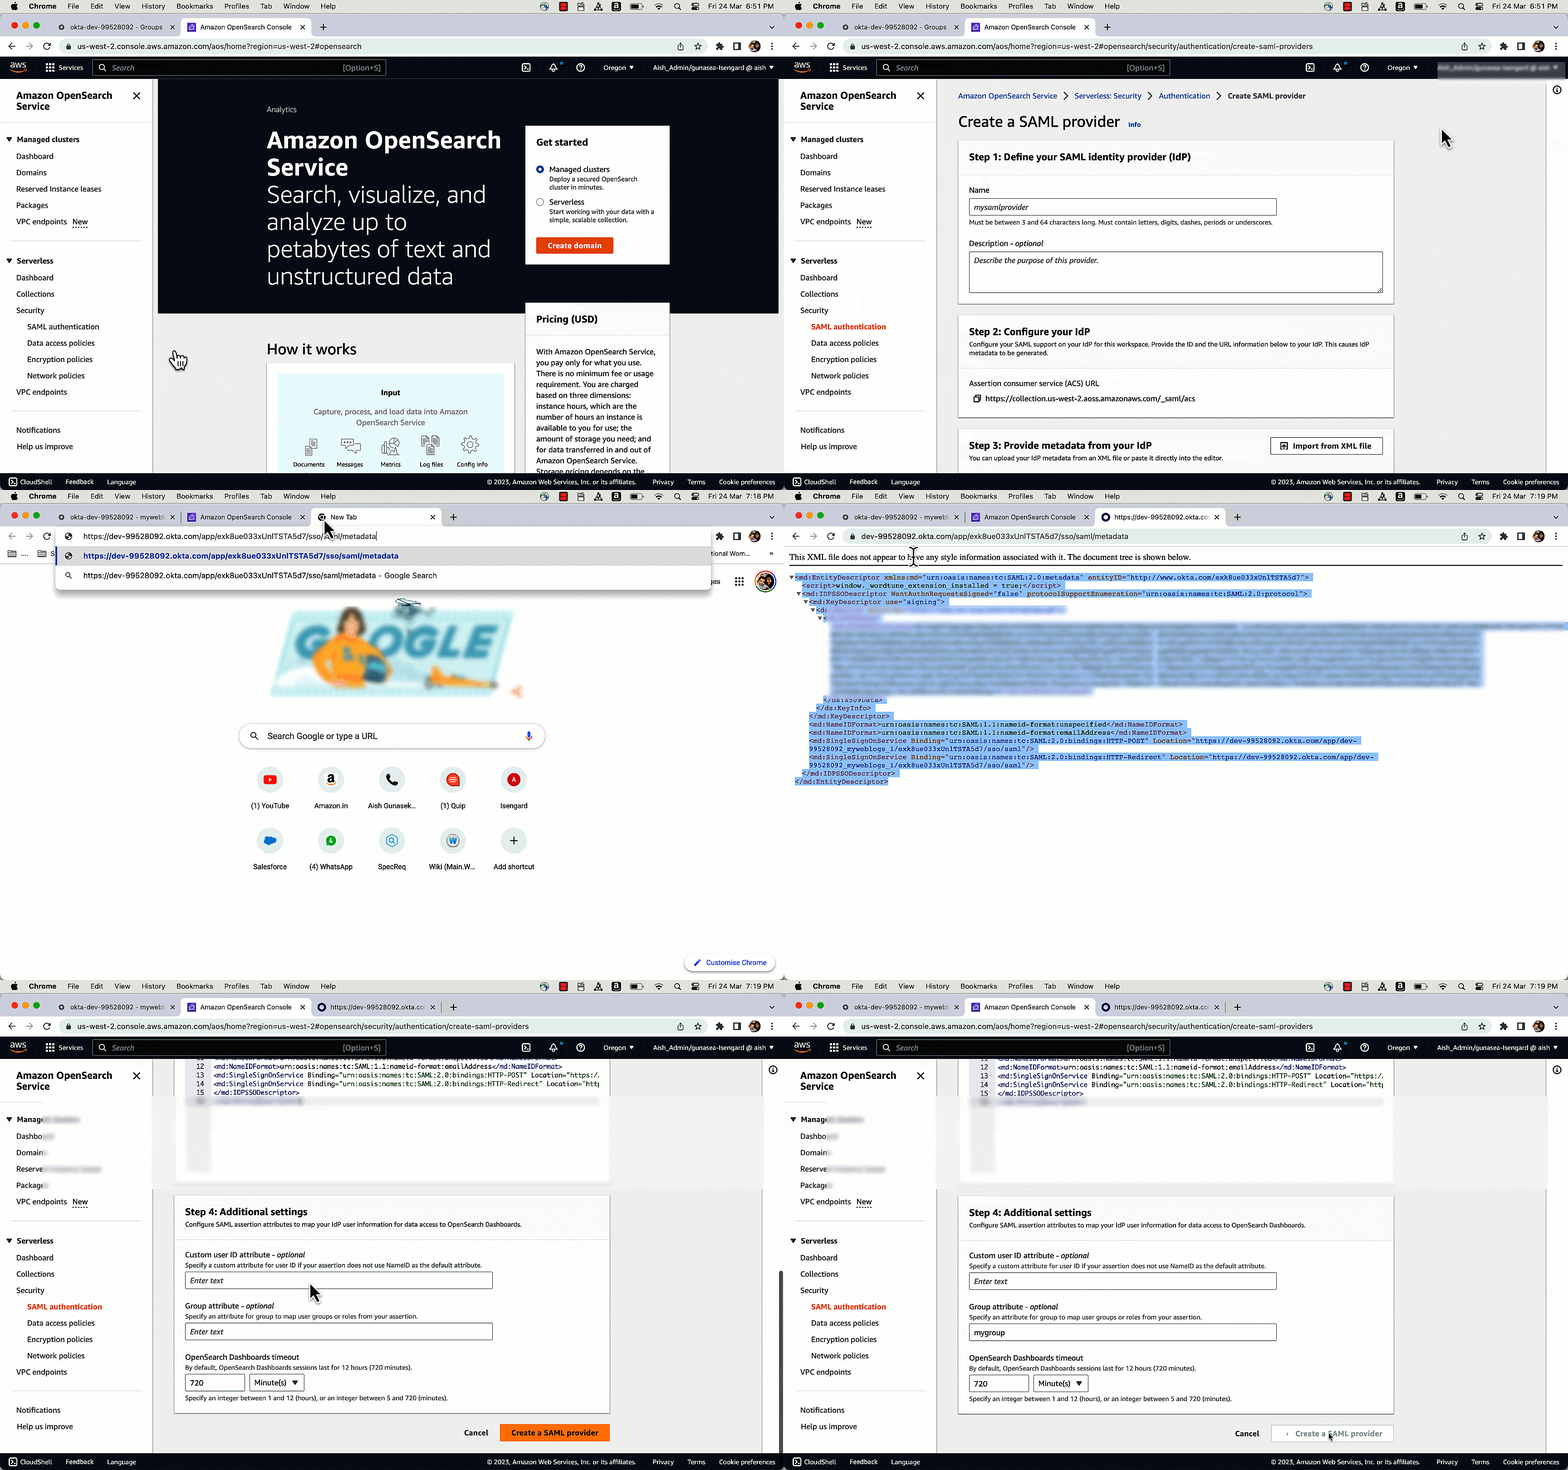
  1. Navigate to the Applications page on the Okta console.
  2. Choose App Integration, select SAML 2.0 web application, then choose Next.
  3. For Name, enter a name for the app (for example, myweblogs), then choose Next.
  4. Under Application ACS URL, enter the URL using the format https://collection.<REGION>.aoss.amazonaws.com/_saml/acs (replace <REGION> with the corresponding Region) to generate the IdP metadata.
  5. Select Use this for Recipient URL and Destination URL to use the same ACS URL as the recipient and destination.
  6. Specify aws:opensearch:<AWS-Account-ID> under Audience URI (SP Entity ID). This specifies who the assertion is intended for within the SAML assertion.
  7. Under Group Attribute Statements, enter a name that is relevant to your application, such as mygroup, and select unspecified as the name format. (Don’t forget this name, you’ll need it later.)
  8. Select equals as the filter and enter opensearch-serverless.
  9. Select I’m a software vendor. I’d like to integrate my app with Okta and choose Finish.
  10. After an app is created, choose the sign-on tab, scroll down to the metadata details, and copy the value for Metadata URL.

The following graphic gives a quick demonstration of setting up an application in Okta via the preceding steps.

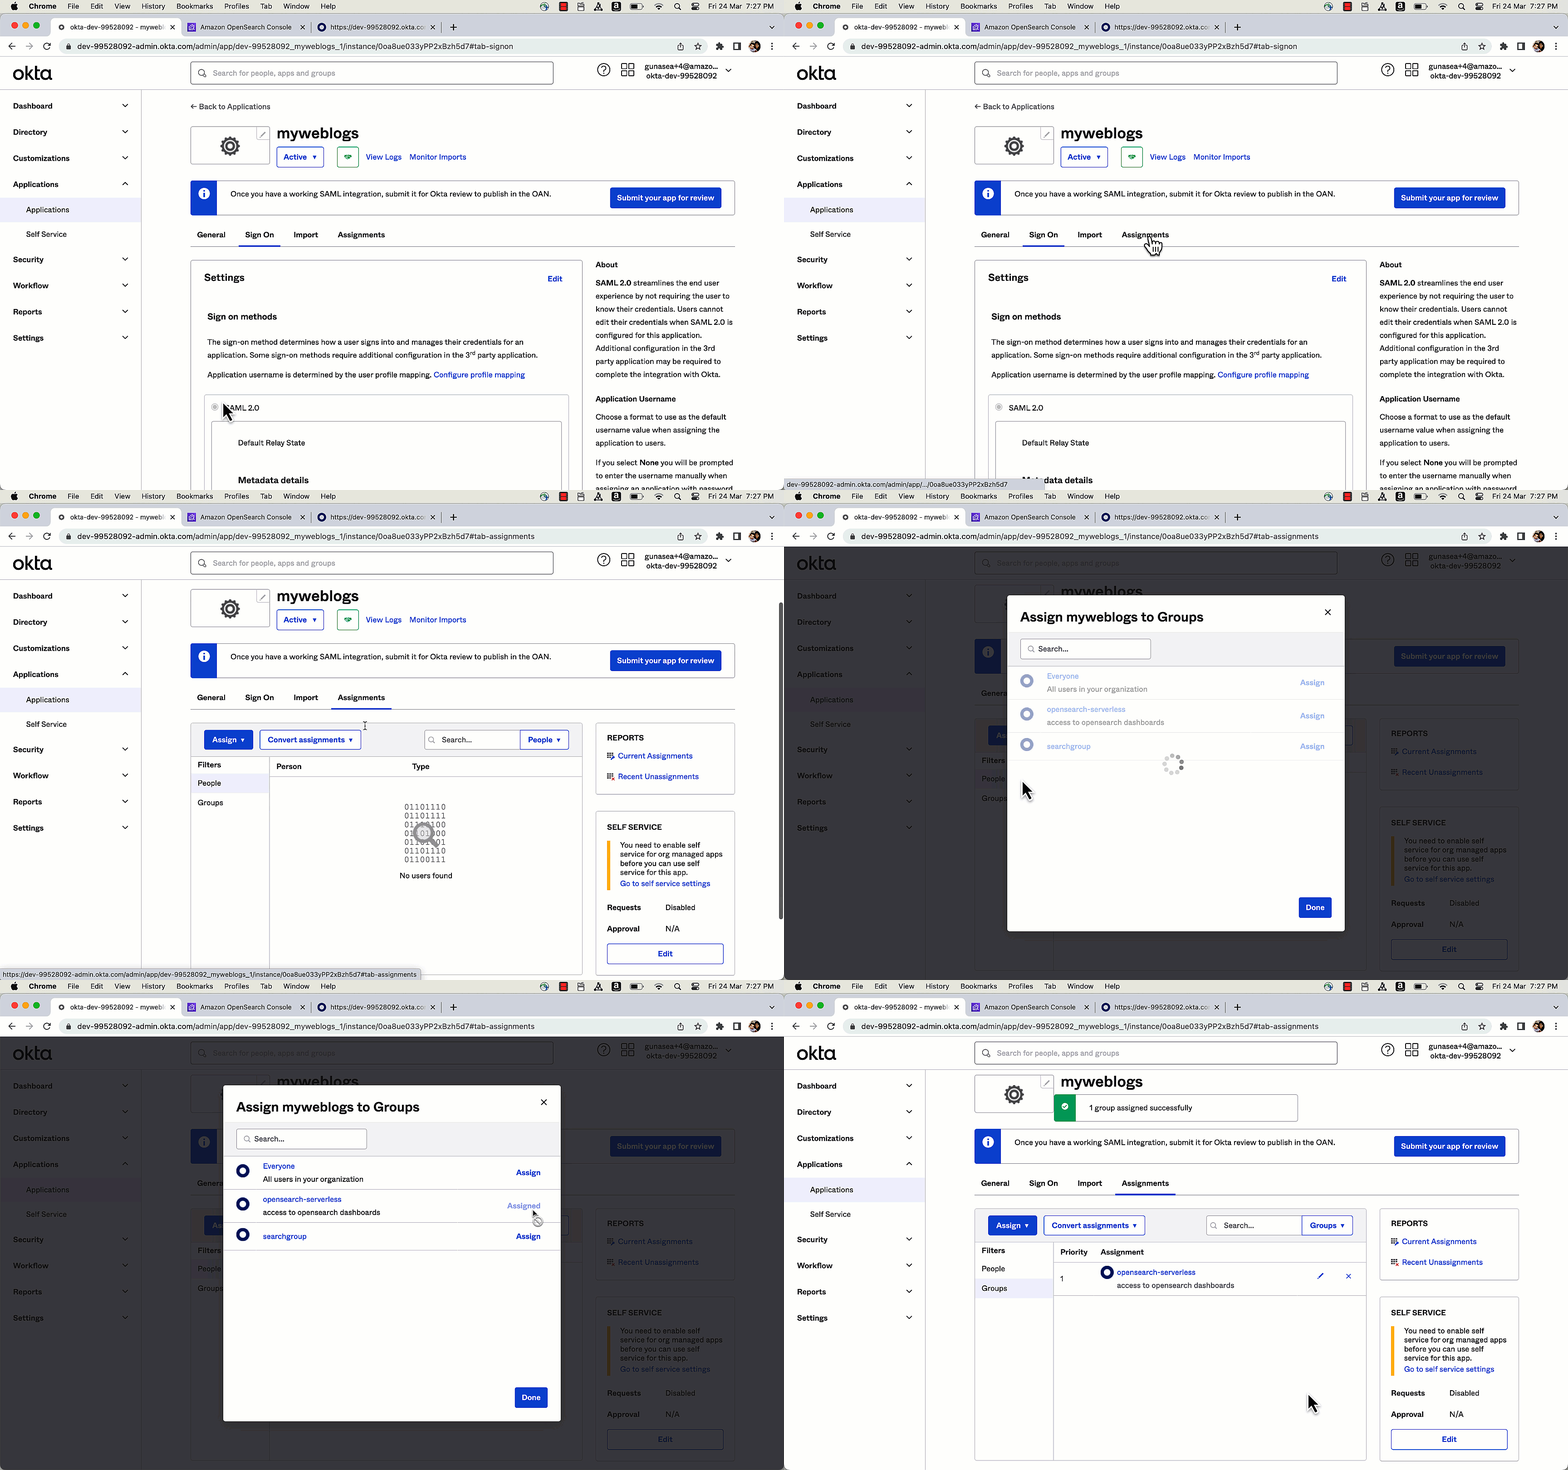
Next, you associate the users and groups to the application that you created in the previous step.

  1. On the Applications page, choose the app you created earlier.
  2. On the Assignments tab, choose Assign.
  3. Select Assign To Groups and choose the group you wish to assign to (opensearch-serverlessin this case).
  4. Choose Done.

The following graphic gives a quick demonstration of assigning groups to the application via the preceding steps.

Set up SAML on OpenSearch Serverless

In this section, you create a SAML provider that you’ll use for your OpenSearch Serverless collection. Complete the following steps:

  1. Open the OpenSearch Serverless console on a new tab.
  2. In the navigation pane, under Serverless, choose SAML authentication.
  3. Select Add SAML provider.
  4. Provide a recognizable name (for example, okta) and a description.
  5. Open a new tab and enter the copied metadata URL into your browser.

You should see the metadata for the Okta application.

  1. Take note of this metadata and copy it to your clipboard.
  2. On the OpenSearch Service console tab, enter this metadata in the Provide metadata from your IdP section.
  3. Under Additional settings, enter mygroup or the group attribute provided in the Okta configuration.
  4. Choose Create a SAML provider.

The SAML provider has now been created.

The following graphic gives a quick demonstration of setting up the SAML provider in OpenSearch Serverless via the preceding steps.

Update the data access policy

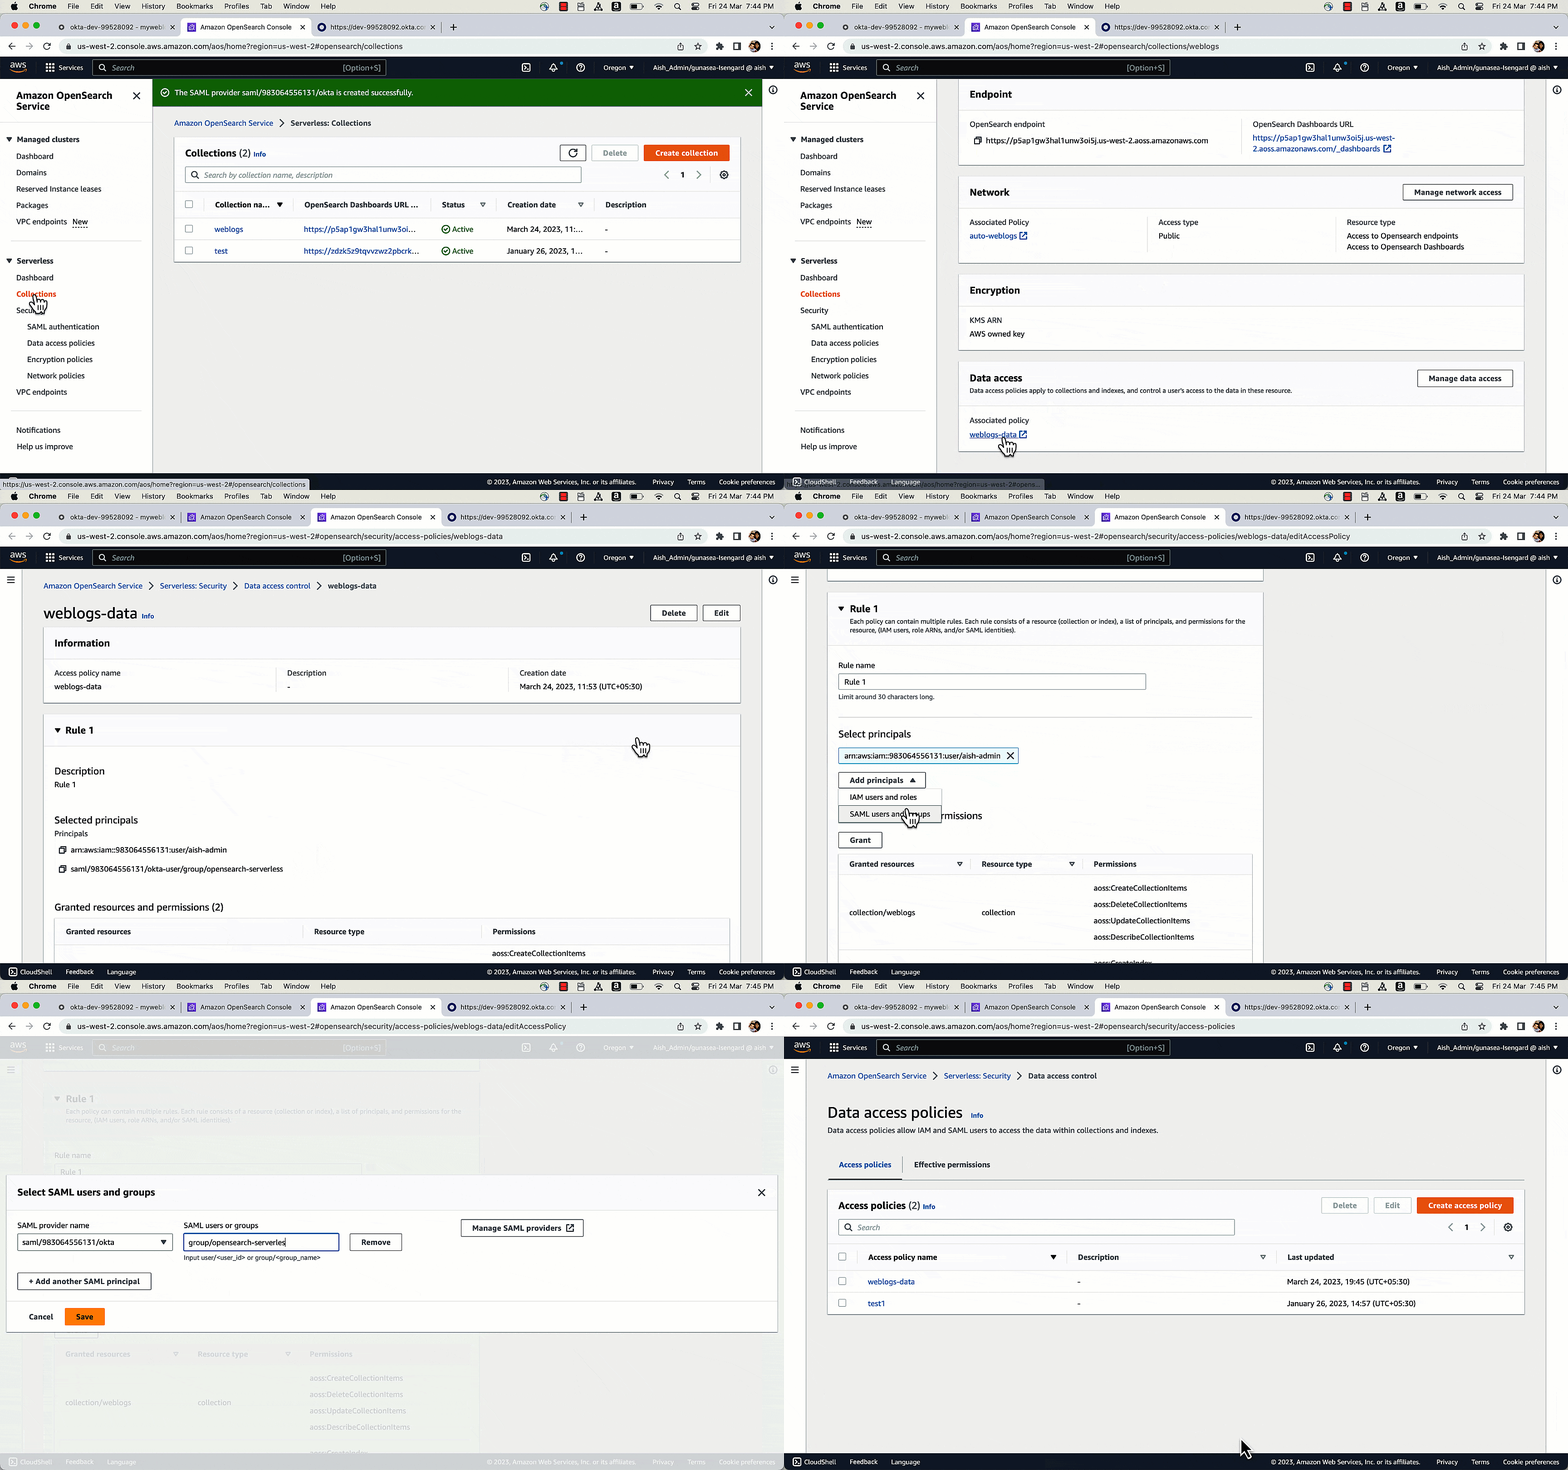
You need to configure the right permissions in the data access policies associated with your OpenSearch collection so your Okta group members can access the OpenSearch Dashboards endpoint.

  1. On the OpenSearch Serverless console, open your collection.
  2. Choose the data access policy associated with the collection in the Data Access section.
  3. Choose Edit.
  4. Choose Principals and Add a SAML principal.
  5. Select the SAML provider you created earlier and enter group/opensearch-serverless next to it.
  6. The OpenSearch Dashboards endpoint can be accessed by all group members. You can grant access to collections, indexes, or both.
  7. Choose Save.

Log in to OpenSearch Dashboards

Now that you have set permissions to access the dashboards, choose the Dashboards URL under the general information for the OpenSearch Serverless collection. This should take you to the website
https://collection-endpoint/_dashboards/

You will see a list with all the access options. Choose the SAML provider that you created (okta in this case) and log in using your Okta credentials. You will now be logged into OpenSearch Dashboards with the permissions that are part of the data access policy. You can perform searches or create visualizations from the dashboard.

Clean up

To avoid unwanted charges, delete the OpenSearch Serverless collection, data access policy, and SAML provider created as part of this demonstration.

Summary

In this post, you learned how to set up Okta as an IdP to access OpenSearch Dashboards using SAML. You also learned how to set up users and groups within Okta and configure their access to OpenSearch Dashboards. For more details, refer to SAML authentication for Amazon OpenSearch Serverless.

You can also refer to the Getting started with Amazon OpenSearch Serverless workshop to know more about OpenSearch Serverless.

If you have feedback about this post, submit it in the comments section. If you have questions about this post, start a new thread on the OpenSearch Service forum or contact AWS Support.


About the Authors

Aish Gunasekar is a Specialist Solutions architect with a focus on Amazon OpenSearch Service. Her passion at AWS is to help customers design highly scalable architectures and help them in their cloud adoption journey. Outside of work, she enjoys hiking and baking.

Prashant Agrawal is a Sr. Search Specialist Solutions Architect with Amazon OpenSearch Service. He works closely with customers to help them migrate their workloads to the cloud and helps existing customers fine-tune their clusters to achieve better performance and save on cost. Before joining AWS, he helped various customers use OpenSearch and Elasticsearch for their search and log analytics use cases. When not working, you can find him traveling and exploring new places. In short, he likes doing Eat → Travel → Repeat.

How FIS ingests and searches vector data for quick ticket resolution with Amazon OpenSearch Service

Post Syndicated from Rupesh Tiwari original https://aws.amazon.com/blogs/big-data/how-fis-ingests-and-searches-vector-data-for-quick-ticket-resolution-with-amazon-opensearch-service/

This post was co-written by Sheel Saket, Senior Data Science Manager at FIS, and Rupesh Tiwari, Senior Architect at Amazon Web Services.

Do you ever find yourself grappling with multiple defect logging mechanisms, scattered project management tools, and fragmented software development platforms? Have you experienced the frustration of lacking a unified view, hindering your ability to efficiently manage and identify common trending issues within your enterprise? Are you constantly facing challenges when it comes to addressing defects and their impact, causing disruptions in your production cycles?

If these questions resonate with you, then you’re not alone. FIS, a leading technology and services provider, has encountered these very challenges. In their quest for a solution, they teamed up with AWS to tackle these obstacles head-on. In this post, we take you on a journey through their collaborative project, exploring how they used Amazon OpenSearch Service to transform their operations, enhance efficiency, and gain valuable insights.

This post shares FIS’s journey in overcoming challenges and provides step-by-step instructions for provisioning the solution architecture in your AWS account. You’ll learn how to implement a transformative solution that empowers your organization with near-real-time data indexing and visualization capabilities.

In the following sections, we dive into the details of FIS’s journey and discover how they overcame these challenges, revolutionizing their approach to defect management and software development.

Challenges for near-real-time ticket visualization and search

FIS faced several challenges in achieving near-real-time ticket visualization and search capabilities, including the
following:

  • Integrating ticket data from tens of different third-party systems
  • Overcoming API call thresholds and limitations from various systems
  • Implementing an efficient KNN vector search algorithm for resolving issues and performing trend analysis
  • Establishing a robust data ingestion and indexing process for real-time updates from 15,000 tickets per day
  • Ensuring unified access to ticket information across 20 development teams
  • Providing secure and scalable access to ticket data for up to 250 teams

Despite these challenges, FIS successfully enhanced their operational efficiency, enabled quick ticket resolution, and gained valuable insights through the integration of OpenSearch Service.

Let’s delve into the technical walkthrough of the architecture diagram and mechanisms. The following section provides step-by-step instructions for provisioning and implementing the solution on your AWS Management Console, along with a helpful video tutorial.

Solution overview

The architecture diagram of FIS’s near-real-time data indexing and visualization solution incorporates various AWS services for specific functions. The solution uses GitHub as the data source, employs Amazon Simple Storage Service (Amazon S3) for scalable storage, manages APIs with Amazon API Gateway, performs serverless computing using AWS Lambda, and facilitates data streaming and ETL (extract, transform, and load) processes through Amazon Kinesis Data Streams and Amazon Kinesis Data Firehose. OpenSearch Service is employed for analytics and application monitoring. This architecture ensures a robust and scalable solution, enabling FIS to efficiently index and visualize data in near-real time. With these AWS services, FIS effectively manages their data pipeline and gains valuable insights for their business processes.

The following diagram illustrates the solution architecture.

Architecture Diagram

The workflow includes the following steps:

  1. GitHub webhook events stream data to both Amazon S3 and OpenSearch
    Service, facilitating real-time data analysis.
  2. A Lambda function connects to an API Gateway REST API, processing and structuring the received payloads.
  3. The Lambda function adds the structured data to a Kinesis data stream, enabling immediate data streaming and quick ticket insights.
  4. Kinesis Data Firehose streams the records from the Kinesis data stream to an S3 bucket, simultaneously creating an index in OpenSearch Service.
  5. OpenSearch Service uses the indexed data to provide near-real-time visualization and enable efficient ticket analysis through K-Nearest Neighbor (KNN) search, enhancing productivity and optimizing data operations.

The following sections provide step-by-step instructions for setting up the solution. Additionally, we have created a video guide that demonstrates each step in detail. You are welcome to watch the video and follow along with this post if you prefer.

Prerequisites

You should have the following prerequisites:

Implement the solution

Complete the following steps to implement the solution:

  1. Create an OpenSearch Service domain.
  2. Create an S3 bucket named git-data.
  3. Create a Kinesis data stream named git-data-stream.
  4. Create a Firehose delivery stream named git-data-delivery-stream with
    git-data-stream as the source and git-data as the destination, and a buffer interval of 60 seconds.
  5. Create a Lambda function named git-webhook-handler with a timeout of 5 minutes. Add code to add data to the Kinesis data stream.
  6. Grant the Lambda function’s execution role permission to put_record on the Kinesis data stream.
  7. Create a REST API in API Gateway named git-webhook-handler-api. Create a resource named
    git-data with a POST method, integrate it with the Lambda function git-webhook-handler created in the previous step, and deploy the REST API.
  8. Create a delivery stream with the Kinesis data stream as the source and OpenSearch Service as the destination. Provide the AWS Identity and Access Management (IAM) role for Kinesis Data Firehose with the necessary permissions to create an index in OpenSearch Service. Finally, add the IAM role as a backend service in OpenSearch Service.
  9. Navigate to your GitHub repository and create a webhook to enable seamless integration with the solution. Copy the REST API URL and enter this newly created webhook.

Test the solution

To test the solution, complete the following steps:

  1. Go to your GitHub repository and choose the Star button, and verify that you receive a response with a status code of 200.
  2. Also, check for the ShardId and SequenceNumber in the recent deliveries to confirm successful event addition to the Kinesis data stream.

Kinesis data stream

  1. On the Kinesis console, use the Data Viewer to confirm the arrival of data records.

kinesis record data

  1. Navigate to the OpenSearch Dashboard and choose the dev tool.
  2. Search for the records and observe that all the Git events are displayed
    in the result pane.

opensearch devtool

  1. On the Amazon S3 console, open the bucket and view the data records.

s3 bucket records

Security

We adhere to IAM best practices to uphold security:

  1. Craft a Lambda execution role for read/write operations on the Kinesis data stream.
  2. Generate an IAM role for Kinesis Data Firehose to manage Amazon S3 and OpenSearch
    Service access.
  3. Link this IAM role in OpenSearch Service security to confer backend user privileges.

Clean up

To avoid incurring future charges, delete all the resources you created.

Benefits of near-real-time ticket visualization and search

During our demonstration, we showcased the utilization of GitHub as the streaming data source. However, it’s important to note that the solution we presented has the flexibility to scale and incorporate multiple data sources from various services. This allows for the consolidation and visualization of diverse data in near-real time, using the capabilities of OpenSearch Service.

With the implementation of the solution described in this post, FIS effectively overcame all the challenges they faced.

In this section, we delve into the details of the challenges and benefits they achieved:

  • Integrating ticket data from multiple third-party systems – Near-real-time data streaming ensures an up-to-date information flow from third-party providers for timely insights
  • Overcoming API call thresholds and limitations imposed by different systems – Unrestricted data flow with no threshold or rate limiting enables seamless integration and continuous updates
  • Accommodating scalability requirements for up to 250 teams – The asynchronous, serverless architecture effortlessly scales more than 250 times larger without infrastructure modifications
  • Efficiently resolving tickets and performing trend analysis – OpenSearch Service semantic KNN search identifies duplicates and defects, and optimizes operations for improved efficiency
  • Gaining valuable insights for business processes – Artificial intelligence (AI) and machine
    learning (ML) analytics use the data stored in the S3 bucket, empowering deeper insights and informed decision-making
  • Ensuring secure access to ticket data and regulatory compliance – Secure data access and compliance with data protection regulations ensure data privacy and regulatory compliance

Conclusion

FIS, in collaboration with AWS, successfully addressed several challenges to achieve near-real-time ticket visualization and search capabilities. With OpenSearch Service, FIS enhanced operational efficiency by efficiently resolving ticketsand performing trend analysis. With their data ingestion and indexing process, FIS processed 15,000 tickets per day in real time. The solution provided secure and scalable access to ticket data for more than 250 teams, enabling unified collaboration. FIS experienced a remarkable 30% reduction in ticket resolution time, empowering teams to quickly address
issues.

As Sheel Saket, Senior Data Science Manager at FIS, states, “Our near-real-time solution transformed how we identify and resolve tickets, improving our overall productivity.”

Furthermore, organizations can further improve the solution by adopting Amazon OpenSearch Ingestion for data ingestion, which offers cost savings and out-of-the-box data processing capabilities. By embracing this transformative solution, organizations can optimize their ticket management, drive productivity, and deliver exceptional experiences to customers.

Want to know more? You can reach out to FIS from their official FIS contact page, follow FIS Twitter, and visit the FIS LinkedIn page.


About the Author

Rupesh Tiwari is a Senior Solutions Architect at AWS in New York City, with a focus on Financial Services. He has over 18 years of IT experience in the finance, insurance, and education domains, and specializes in architecting large-scale applications and cloud-native big data workloads. In his spare time, Rupesh enjoys singing karaoke, watching comedy TV series, and creating joyful moments with his family.

Sheel Saket is a Senior Data Science Manager at FIS in Chicago, Illinois. He has over 11 years of IT experience in the finance, insurance, and e-commerce domains, and specializes in architecting large-scale AI solutions and cloud MLOps. In his spare time, Sheel enjoys listening to audiobooks, podcasts, and watching movies with his family.

AWS Week in Review – Agents for Amazon Bedrock, Amazon SageMaker Canvas New Capabilities, and More – July 31, 2023

Post Syndicated from Donnie Prakoso original https://aws.amazon.com/blogs/aws/aws-week-in-review-agents-for-amazon-bedrock-amazon-sagemaker-canvas-new-capabilities-and-more-july-31-2023/

This July, AWS communities in ASEAN wrote a new history. First, the AWS User Group Malaysia recently held the first AWS Community Day in Malaysia.

Another significant milestone has been achieved by the AWS User Group Philippines. They just celebrated their tenth anniversary by running 2 days of AWS Community Day Philippines. Here are a few photos from the event, including Jeff Barr sharing his experiences attending AWS User Group meetup, in Manila, Philippines 10 years ago.

Big congratulations to AWS Community Heroes, AWS Community Builders, AWS User Group leaders and all volunteers who organized and delivered AWS Community Days! Also, thank you to everyone who attended and help support our AWS communities.

Last Week’s Launches
We had interesting launches last week, including from AWS Summit, New York. Here are some of my personal highlights:

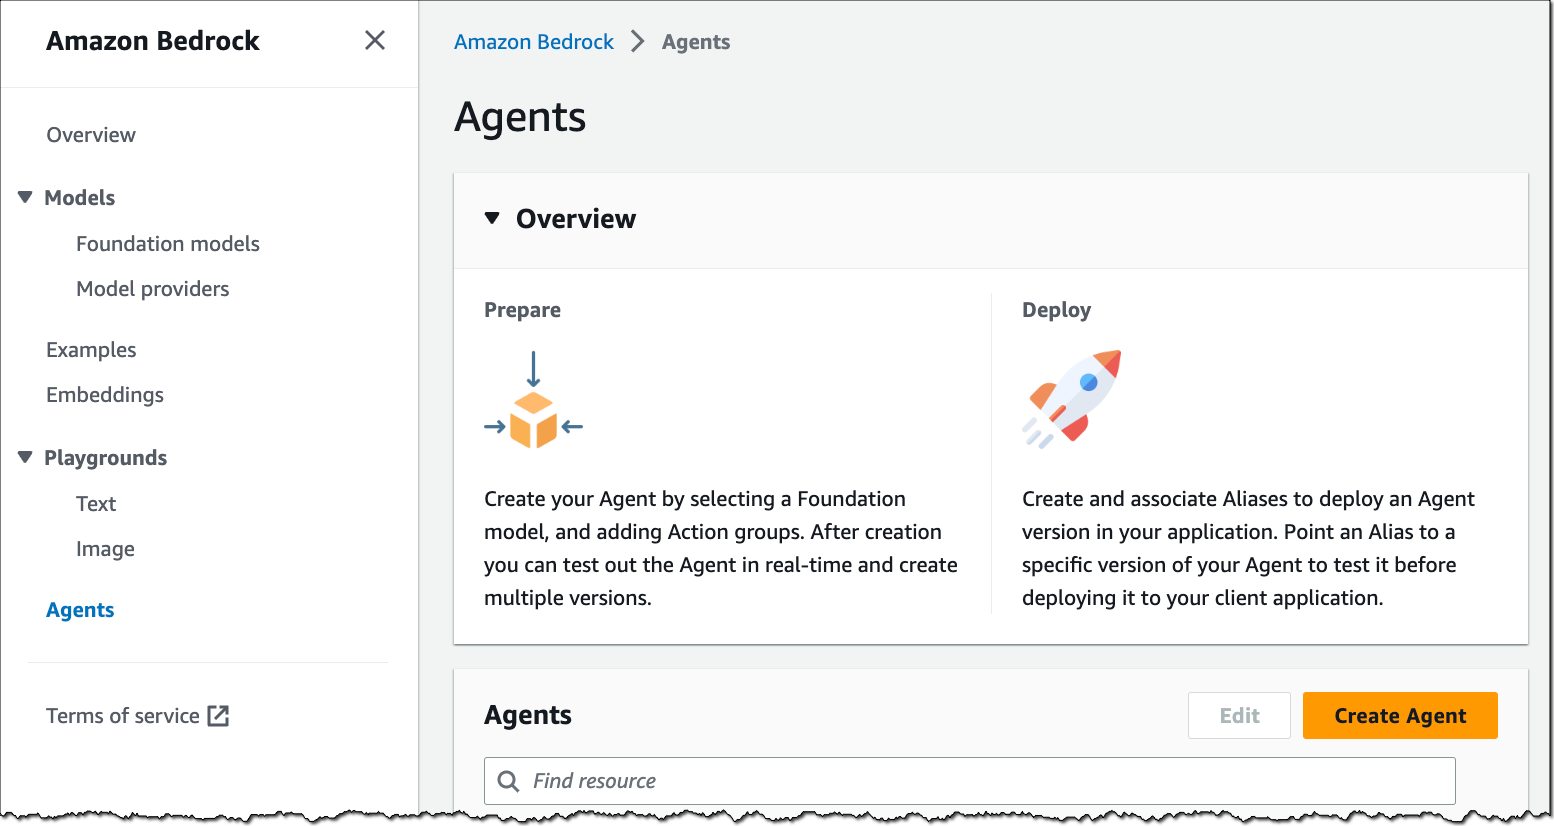
(Preview) Agents for Amazon Bedrock – You can now create managed agents for Amazon Bedrock to handle tasks using API calls to company systems, understand user requests, break down complex tasks into steps, hold conversations to gather more information, and take actions to fulfill requests.

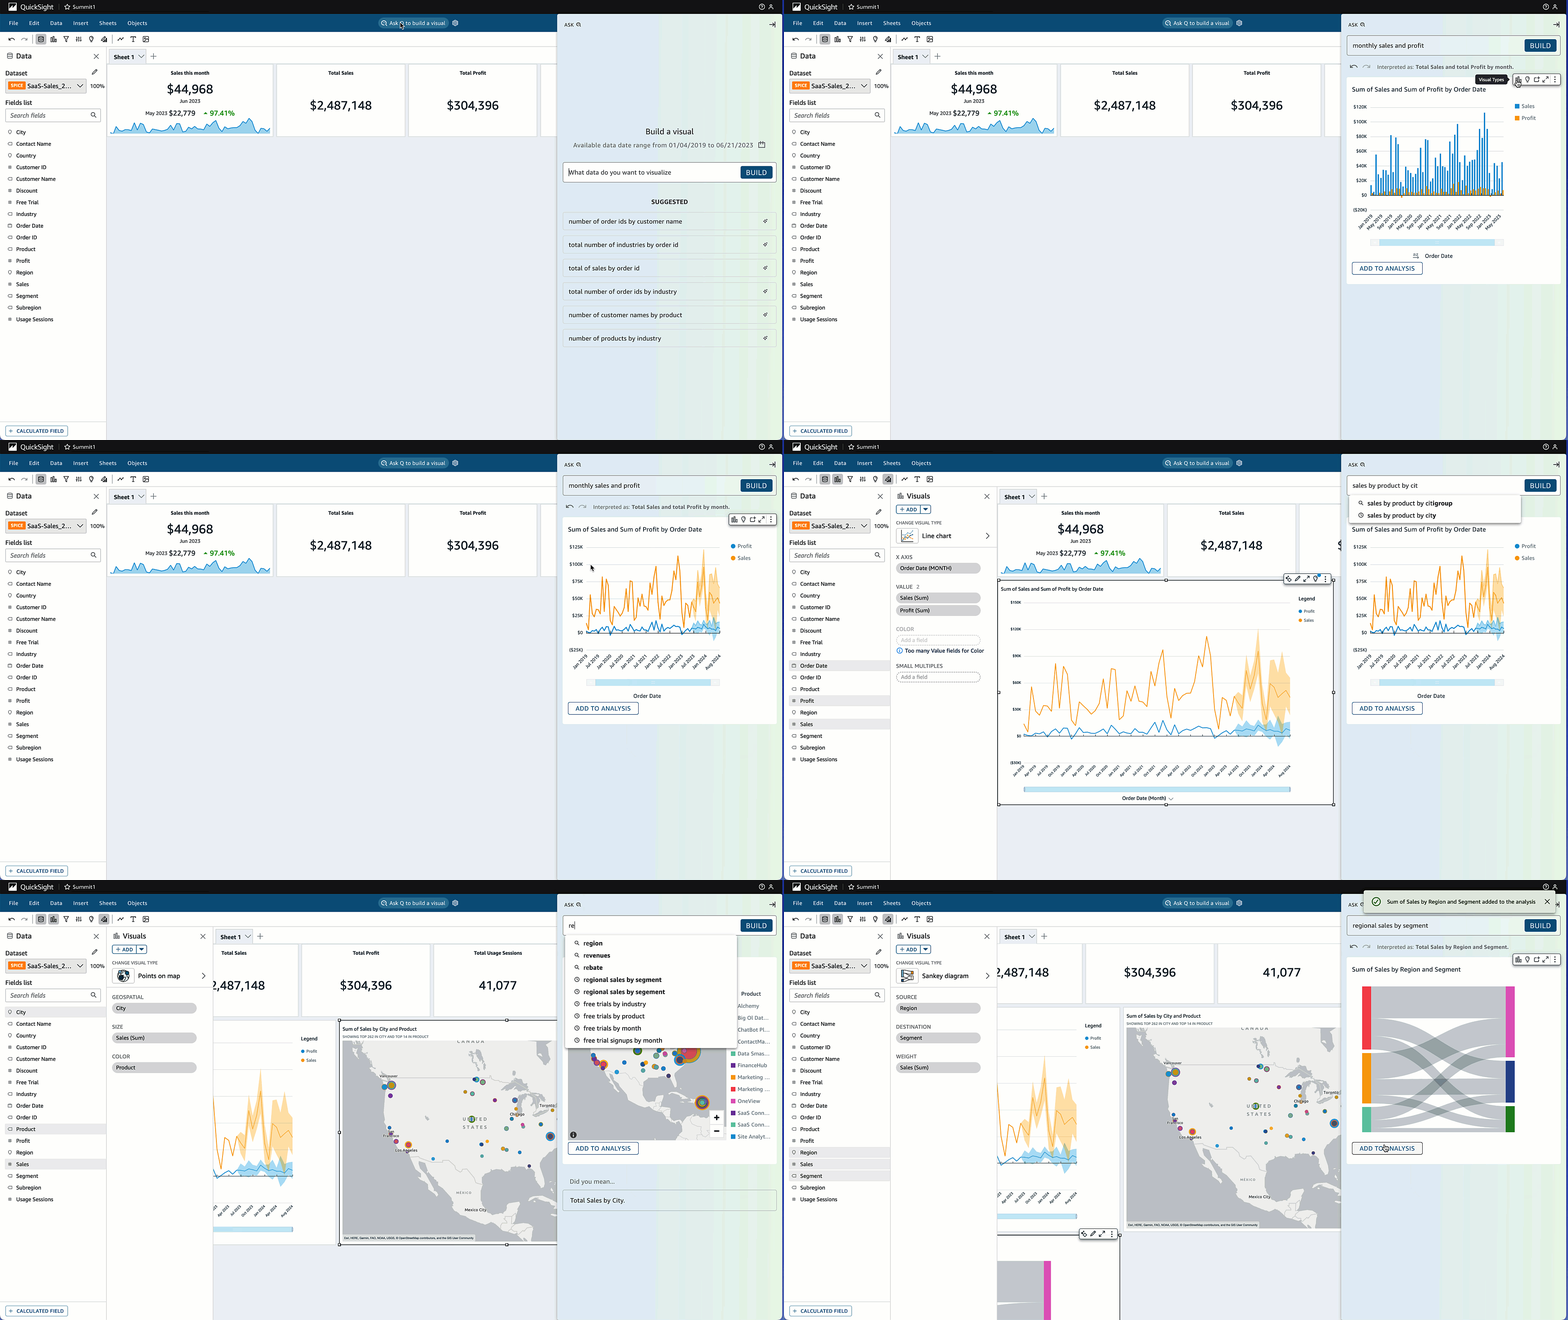
(Coming Soon) New LLM Capabilities in Amazon QuickSight Q – We are expanding the innovation in QuickSight Q by introducing new LLM capabilities through Amazon Bedrock. These Generative BI capabilities will allow organizations to easily explore data, uncover insights, and facilitate sharing of insights.

AWS Glue Studio support for Amazon CodeWhisperer – You can now write specific tasks in natural language (English) as comments in the Glue Studio notebook, and Amazon CodeWhisperer provides code recommendations for you.

(Preview) Vector Engine for Amazon OpenSearch Serverless – This capability empowers you to create modern ML-augmented search experiences and generative AI applications without the need to handle the complexities of managing the underlying vector database infrastructure.

Last week, Amazon SageMaker Canvas also released a set of new capabilities:

AWS Open-Source Updates
As always, my colleague Ricardo has curated the latest updates for open-source news at AWS. Here are some of the highlights.

cdk-aws-observability-accelerator is a set of opinionated modules to help you set up observability for your AWS environments with AWS native services and AWS-managed observability services such as Amazon Managed Service for Prometheus, Amazon Managed Grafana, AWS Distro for OpenTelemetry (ADOT) and Amazon CloudWatch.

iac-devtools-cli-for-cdk is a command line interface tool that automates many of the tedious tasks of building, adding to, documenting, and extending AWS CDK applications.

Upcoming AWS Events
There are upcoming events that you can join to learn. Let’s start with AWS events:

And let’s learn from our fellow builders and join AWS Community Days:

Open for Registration for AWS re:Invent
We want to be sure you know that AWS re:Invent registration is now open!


This learning conference hosted by AWS for the global cloud computing community will be held from November 27 to December 1, 2023, in Las Vegas.

Pro-tip: You can use information on the Justify Your Trip page to prove the value of your trip to AWS re:Invent trip.

Give Us Your Feedback
We’re focused on improving our content to provide a better customer experience, and we need your feedback to do so. Please take this quick survey to share insights on your experience with the AWS Blog. Note that this survey is hosted by an external company, so the link does not lead to our website. AWS handles your information as described in the AWS Privacy Notice.

That’s all for this week. Check back next Monday for another Week in Review.

Happy building!

Donnie

This post is part of our Week in Review series. Check back each week for a quick round-up of interesting news and announcements from AWS!


P.S. We’re focused on improving our content to provide a better customer experience, and we need your feedback to do so. Please take this quick survey to share insights on your experience with the AWS Blog. Note that this survey is hosted by an external company, so the link does not lead to our website. AWS handles your information as described in the AWS Privacy Notice.

Introducing the vector engine for Amazon OpenSearch Serverless, now in preview

Post Syndicated from Pavani Baddepudi original https://aws.amazon.com/blogs/big-data/introducing-the-vector-engine-for-amazon-opensearch-serverless-now-in-preview/

We are pleased to announce the preview release of the vector engine for Amazon OpenSearch Serverless. The vector engine provides a simple, scalable, and high-performing similarity search capability in Amazon OpenSearch Serverless that makes it easy for you to build modern machine learning (ML) augmented search experiences and generative artificial intelligence (AI) applications without having to manage the underlying vector database infrastructure. This post summarizes the features and functionalities of our vector engine.

Using augmented ML search and generative AI with vector embeddings

Organizations across all verticals are rapidly adopting generative AI for its ability to handle vast datasets, generate automated content, and provide interactive, human-like responses. Customers are exploring ways to transform the end-user experience and interaction with their digital platform by integrating advanced conversational generative AI applications such as chatbots, question and answer systems, and personalized recommendations. These conversational applications enable you to search and query in natural language and generate responses that closely resemble human-like responses by accounting for the semantic meaning, user intent, and query context.

ML-augmented search applications and generative AI applications use vector embeddings, which are numerical representations of text, image, audio, and video data to generate dynamic and relevant content. The vector embeddings are trained on your private data and represent the semantic and contextual attributes of the information. Ideally, these embeddings can be stored and managed close to your domain-specific datasets, such as within your existing search engine or database. This enables you to process a user’s query to find the closest vectors and combine them with additional metadata without relying on external data sources or additional application code to integrate the results. Customers want a vector database option that is simple to build on and enables them to move quickly from prototyping to production so they can focus on creating differentiated applications. The vector engine for OpenSearch Serverless extends OpenSearch’s search capabilities by enabling you to store, search, and retrieve billions of vector embeddings in real time and perform accurate similarity matching and semantic searches without having to think about the underlying infrastructure.

Exploring the vector engine’s capabilities

Built on OpenSearch Serverless, the vector engine inherits and benefits from its robust architecture. With the vector engine, you don’t have to worry about sizing, tuning, and scaling the backend infrastructure. The vector engine automatically adjusts resources by adapting to changing workload patterns and demand to provide consistently fast performance and scale. As the number of vectors grows from a few thousand during prototyping to hundreds of millions and beyond in production, the vector engine will scale seamlessly, without the need for reindexing or reloading your data to scale your infrastructure. Additionally, the vector engine has separate compute for indexing and search workloads, so you can seamlessly ingest, update, and delete vectors in real time while ensuring that the query performance your users experience remains unaffected. All the data is persisted in Amazon Simple Storage Service (Amazon S3), so you get the same data durability guarantees as Amazon S3 (eleven nines). Even though we are still in preview, the vector engine is designed for production workloads with redundancy for Availability Zone outages and infrastructure failures.

The vector engine for OpenSearch Serverless is powered by the k-nearest neighbor (kNN) search feature in the open-source OpenSearch Project, proven to deliver reliable and precise results. Many customers today are using OpenSearch kNN search in managed clusters for offering semantic search and personalization in their applications. With the vector engine, you can get the same functionality with the simplicity of a serverless environment. The vector engine supports the popular distance metrics such as Euclidean, cosine similarity, and dot product, and can accommodate 16,000 dimensions, making it well-suited to support a wide range of foundational and other AI/ML models. You can also store diverse fields with various data types such as numeric, boolean, date, keyword, geopoint for metadata, and text for descriptive information to add more context to the stored vectors. Colocating the data types reduces the complexity and maintainability and avoids data duplication, version compatibility challenges, and licensing issues, effectively simplifying your application stack. Because the vector engine supports the same OpenSearch open-source suite APIs, you can take advantage of its rich query capabilities, such as full text search, advanced filtering, aggregations, geo-spatial query, nested queries for faster retrieval of data, and enhanced search results. For example, if your use case requires you to find the results within 15 miles of the requestor, the vector engine can do this in a single query, eliminating the need for maintaining two different systems and then combining the results through application logic. With support for integration with LangChain, Amazon Bedrock, and Amazon SageMaker, you can easily integrate your preferred ML and AI system with the vector engine.

The vector engine supports a wide range of use cases across various domains, including image search, document search, music retrieval, product recommendation, video search, location-based search, fraud detection, and anomaly detection. We also anticipate a growing trend for hybrid searches that combine lexical search methods with advanced ML and generative AI capabilities. For example, when a user searches for a “red shirt” on your e-commerce website, semantic search helps expand the scope by retrieving all shades of red, while preserving the tuning and boosting logic implemented on the lexical (BM25) search. With OpenSearch filtering, you can further enhance the relevance of your search results by providing users with options to refine their search based on size, brand, price range, and availability in nearby stores, allowing for a more personalized and precise experience. The hybrid search support in the vector engine enables you to query vector embeddings, metadata, and descriptive information within a single query call, making it easy to provide more accurate and contextually relevant search results without building complex application code.

You can get started in minutes with the vector engine by creating a specialized vector search collection under OpenSearch Serverless using the AWS Management Console, AWS Command Line Interface (AWS CLI), or the AWS software development kit (AWS SDK). Collections are a logical grouping of indexed data that works together to support a workload, while the physical resources are automatically managed in the backend. You don’t have to declare how much compute or storage is needed or monitor the system to make sure it’s running well. OpenSearch Serverless applies different sharding and indexing strategies for the three available collection types: time series, search, and vector search. The vector engine’s compute capacity used for data ingestion, and search and query are measured in OpenSearch Compute Units (OCUs). One OCU can handle 4 million vectors for 128 dimensions or 500K for 768 dimensions at 99% recall rate. The vector engine is built on OpenSearch Serverless, which is a highly available service and requires a minimum of 4 OCUs (two OCUs for the ingest including primary and standby, and two OCUs for the search with two active replicas across Availability Zones) for that first collection in an account. All subsequent collections using the same AWS Key Management Service (AWS KMS) key can share those OCUs.

Get started with vector embeddings

To get started using vector embeddings using the console, complete the following steps:

  1. Create a new collection on the OpenSearch Serverless console.
  2. Provide a name and optional description.
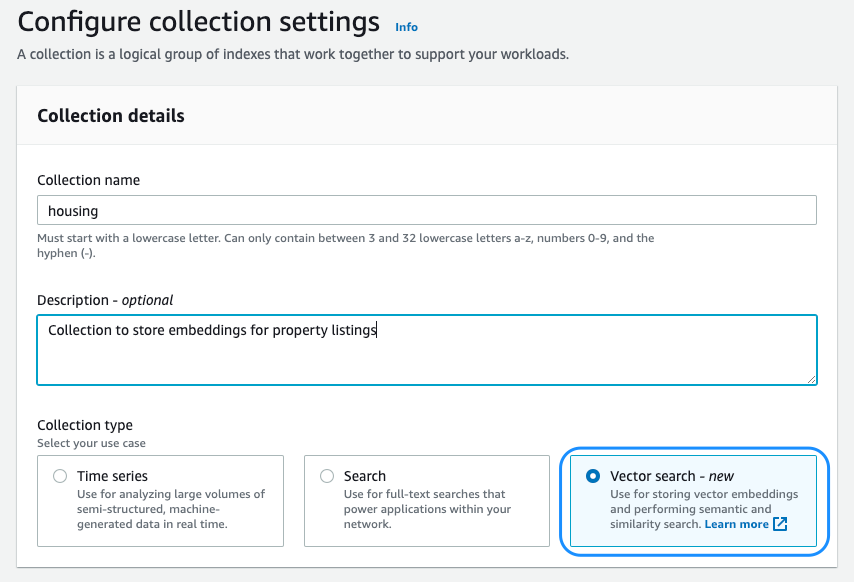
  3. Currently, vector embeddings are supported exclusively by vector search collections; therefore, for Collection type, select Vector search.
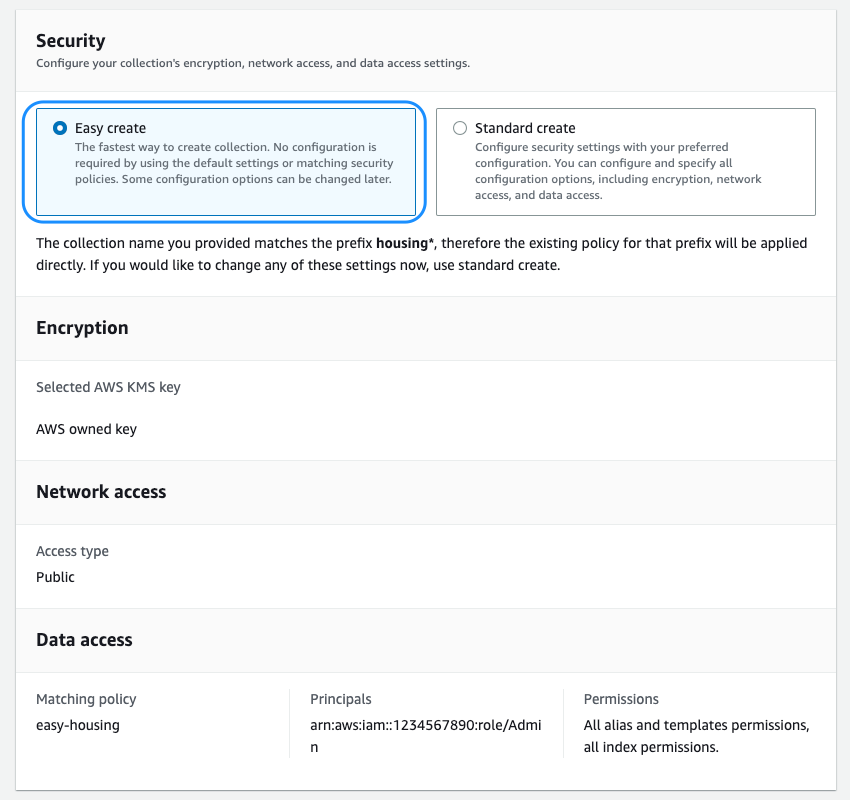
  4. Next, you must configure the security policies, which includes encryption, network, and data access policies.

We are introducing the new Easy create option, which streamlines the security configuration for faster onboarding. All the data in the vector engine is encrypted in transit and at rest by default. You can choose to bring your own encryption key or use the one provided by the service that is dedicated for your collection or account. You can choose to host your collection on a public endpoint or within a VPC. The vector engine supports fine-grained AWS Identity and Access Management (IAM) permissions so that you can define who can create, update, and delete encryption, network, collections, and indexes, thereby enabling organizational alignment.

  1. With the security settings in place, you can finish creating the collection.

After the collection is successfully created, you can create the vector index. At this point, you can use the API or the console to create an index. An index is a collection of documents with a common data schema and provides a way for you to store, search, and retrieve your vector embeddings and other fields. The vector index supports up to 1,000 fields.

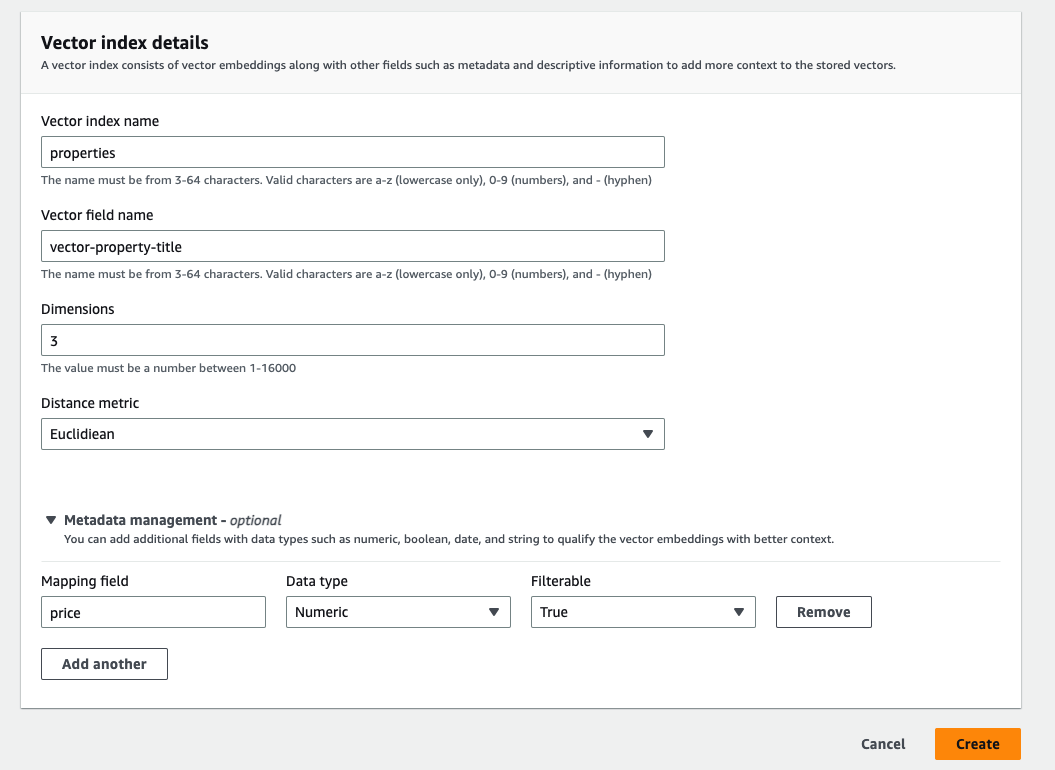
  1. To create the vector index, you must define the vector field name, dimensions, and the distance metric.

The vector index supports up to 16,000 dimensions and three types of distance metrics: Euclidean, cosine, and dot product.

Once you have successfully created the index, you can use OpenSearch’s powerful query capabilities to get comprehensive search results.

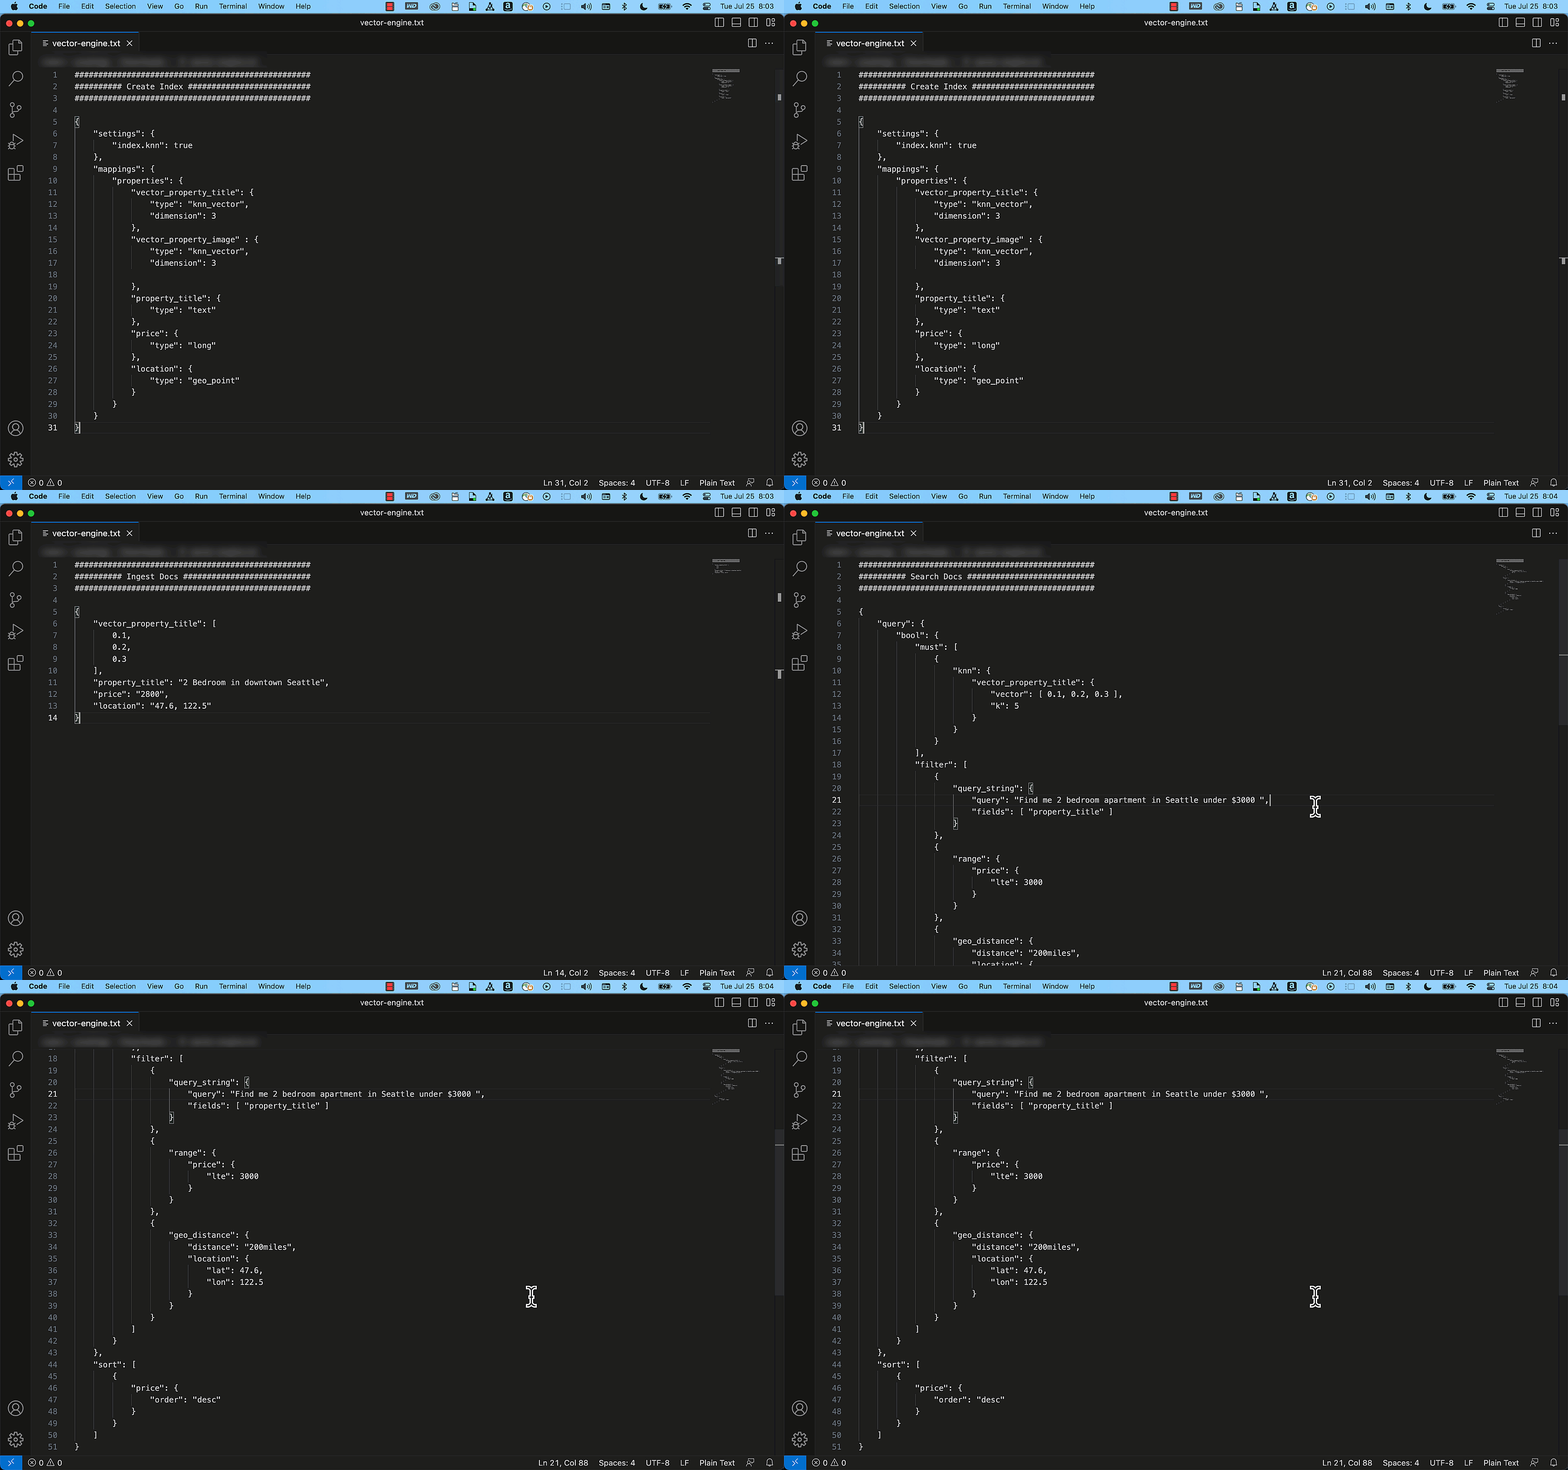
The following example shows how easily you can create a simple property listing index with the title, description, price, and location details as fields using the OpenSearch API. By using the query APIs, this index can efficiently provide accurate results to match your search requests, such as “Find me a two-bedroom apartment in Seattle that is under $3000.”

From preview to GA and beyond

Today, we are excited to announce the preview of the vector engine, making it available for you to begin testing it out immediately. As we noted earlier, OpenSearch Serverless was designed to provide a highly available service to power your enterprise applications, with independent compute resources for index and search and built-in redundancy.

We recognize that many of you are in the experimentation phase and would like a more economical option for dev-test. Prior to GA, we plan to offer two features that will enable us to reduce the cost of your first collection. The first is a new dev-test option that enables you to launch a collection with no active standby or replica, reducing the entry cost by 50%. The vector engine still provides durability guarantees because it persists all the data in Amazon S3. The second is to initially provision a 0.5 OCU footprint, which will scale up as needed to support your workload, further lowering costs if your initial workload is in the tens of thousands to low-hundreds of thousands of vectors (depending on the number of dimensions). Between these two features, we will reduce the minimum OCUs needed to power your first collection from 4 OCUs down to 1 OCU per hour.

We are also working on features that will allow us to achieve workload pause and resume capabilities in the coming months, which is particularly useful for the vector engine because many of these use cases don’t require continuous indexing of the data.

Lastly, we are diligently focused on optimizing the performance and memory usage of the vector graphs, including improving caching, merging and more.

While we work on these cost reductions, we will be offering the first 1400 OCU-hours per month free on vector collections until the dev-test option is made available. This will enable you to test the vector engine preview for up to two weeks every month at no cost, based on your workload.

Summary

The vector engine for OpenSearch Serverless introduces a simple, scalable, and high-performing vector storage and search capability that makes it straightforward for you to quickly store and query billions of vector embeddings generated from a variety of ML models, such as those provided by Amazon Bedrock, with response times in milliseconds.

The preview release of vector engine for OpenSearch Serverless is now available in eight Regions globally: US East (Ohio), US East (N. Virginia), US West (Oregon), Asia Pacific (Singapore), Asia Pacific (Sydney), Asia Pacific (Tokyo), Europe (Frankfurt), and Europe (Ireland).

We are the excited about the future ahead and your feedback will play a vital role in guiding the progress of this product. We encourage you to try out the vector engine for OpenSearch Serverless and share your use cases, questions, and feedback in the comments section.

In the coming weeks, we will be publishing a series of posts to provide you with detailed guidance on how to integrate the vector engine with LangChain, Amazon Bedrock, and SageMaker. To learn more about the vector engine’s capabilities, refer to our Getting Started with Amazon OpenSearch Serverless documentation


About the authors

Pavani Baddepudi is a Principal Product Manager for Search Services at AWS and the lead PM for OpenSearch Serverless. Her interests include distributed systems, networking, and security. When not working, she enjoys hiking and exploring new cuisines.

Carl Meadows is Director of Product Management at AWS and is responsible for Amazon Elasticsearch Service, OpenSearch, Open Distro for Elasticsearch, and Amazon CloudSearch. Carl has been with Amazon Elasticsearch Service since before it was launched in 2015. He has a long history of working in the enterprise software and cloud services spaces. When not working, Carl enjoys making and recording music.

Content Repository for Unstructured Data with Multilingual Semantic Search: Part 2

Post Syndicated from Patrik Nagel original https://aws.amazon.com/blogs/architecture/content-repository-for-unstructured-data-with-multilingual-semantic-search-part-2/

Leveraging vast unstructured data poses challenges, particularly for global businesses needing cross-language data search. In Part 1 of this blog series, we built the architectural foundation for the content repository. The key component of Part 1 was the dynamic access control-based logic with a web UI to upload documents.

In Part 2, we extend the content repository with multilingual semantic search capabilities while maintaining the access control logic from Part 1. This allows users to ingest documents in content repository across multiple languages and then run search queries to get reference to semantically similar documents.

Solution overview

Building on the architectural foundation from Part 1, we introduce four new building blocks to extend the search functionality.

Optical character recognition (OCR) workflow: To automatically identify, understand, and extract text from ingested documents, we use Amazon Textract and a sample review dataset of .png format documents (Figure 1). We use Amazon Textract synchronous application programming interfaces (APIs) to capture key-value pairs for the reviewid and reviewBody attributes. Based on your specific requirements, you can choose to capture either the complete extracted text or parts the text.

Sample document for ingestion

Figure 1. Sample document for ingestion

Embedding generation: To capture the semantic relationship between the text, we use a machine learning (ML) model that maps words and sentences to high-dimensional vector embeddings. You can use Amazon SageMaker, a fully-managed ML service, to build, train, and deploy your ML models to production-ready hosted environments. You can also deploy ready-to-use pre-trained models from multiple avenues such as SageMaker JumpStart. For this blog post, we use the open-source pre-trained universal-sentence-encoder-multilingual model from TensorFlow Hub. The model inference endpoint deployed to a SageMaker endpoint generates embeddings for the document text and the search query. Figure 2 is an example of n-dimensional vector that is generated as the output of the reviewBody attribute text provided to the embeddings model.

Sample embedding representation of the value of reviewBody

Figure 2. Sample embedding representation of the value of reviewBody

Embedding ingestion: To make the embeddings searchable for the content repository users, you can use the k-Nearest Neighbor (k-NN) search feature of Amazon OpenSearch Service. The OpenSearch k-NN plugin provides different methods. For this blog post, we use the Approximate k-NN search approach, based on the Hierarchical Navigable Small World (HNSW) algorithm. HNSW uses a hierarchical set of proximity graphs in multiple layers to improve performance when searching large datasets to find the “nearest neighbors” for the search query text embeddings.

Semantic search: We make the search service accessible as an additional backend logic on Amazon API Gateway. Authenticated content repository users send their search query using the frontend to receive the matching documents. The solution maintains end-to-end access control logic by using the user’s enriched Amazon Cognito provided identity (ID) token claim with the department attribute to compare it with the ingested documents.

Technical architecture

The technical architecture includes two parts:

  1. Implementing multilingual semantic search functionality: Describes the processing workflow for the document that the user uploads; makes the document searchable.
  2. Running input search query: Covers the search workflow for the input query; finds and returns the nearest neighbors of the input text query to the user.

Part 1. Implementing multilingual semantic search functionality

Our previous blog post discussed blocks A through D (Figure 3), including user authentication, ID token enrichment, Amazon Simple Storage Service (Amazon S3) object tags for dynamic access control, and document upload to the source S3 bucket. In the following section, we cover blocks E through H. The overall workflow describes how an unstructured document is ingested in the content repository, run through the backend OCR and embeddings generation process and finally the resulting vector embedding are stored in OpenSearch service.

Technical architecture for implementing multi-lingual semantic search functionality

Figure 3. Technical architecture for implementing multilingual semantic search functionality

  1. The OCR workflow extracts text from your uploaded documents.
    • The source S3 bucket sends an event notification to Amazon Simple Queue Service (Amazon SQS).
    • The document transformation AWS Lambda function subscribed to the Amazon SQS queue invokes an Amazon Textract API call to extract the text.
  2. The document transformation Lambda function makes an inference request to the encoder model hosted on SageMaker. In this example, the Lambda function submits the reviewBody attribute to the encoder model to generate the embedding.
  3. The document transformation Lambda function writes an output file in the transformed S3 bucket. The text file consists of:
    • The reviewid and reviewBody attributes extracted from Step 1
    • An additional reviewBody_embeddings attribute from Step 2
      Note: The workflow tags the output file with the same S3 object tags as the source document for downstream access control.
  4. The transformed S3 bucket sends an event notification to invoke the indexing Lambda function.
  5. The indexing Lambda function reads the text file content. Then indexing Lambda function makes an OpenSearch index API call along with source document tag as one of the indexing attributes for access control.

Part 2. Running user-initiated search query

Next, we describe how the user’s request produces query results (Figure 4).

Search query lifecycle

Figure 4. Search query lifecycle

  1. The user enters a search string in the web UI to retrieve relevant documents.
  2. Based on the active sign-in session, the UI passes the user’s ID token to the search endpoint of the API Gateway.
  3. The API Gateway uses Amazon Cognito integration to authorize the search API request.
  4. Once validated, the search API endpoint request invokes the search document Lambda function.
  5. The search document function sends the search query string as the inference request to the encoder model to receive the embedding as the inference response.
  6. The search document function uses the embedding response to build an OpenSearch k-NN search query. The HNSW algorithm is configured with the Lucene engine and its filter option to maintain the access control logic based on the custom department claim from the user’s ID token. The OpenSearch query returns the following to the query embeddings:
    • Top three Approximate k-NN
    • Other attributes, such as reviewid and reviewBody
  7. The workflow sends the relevant query result attributes back to the UI.

Prerequisites

You must have the following prerequisites for this solution:

Walkthrough

Setup

The following steps deploy two AWS CDK stacks into your AWS account:

  • content-repo-search-stack (blog-content-repo-search-stack.ts) creates the environment detailed in Figure 3, except for the SageMaker endpoint, which you create in a spearate step.
  • demo-data-stack (userpool-demo-data-stack.ts) deploys sample users, groups, and role mappings.

To continue setup, use the following commands:

  1. Clone the project Git repository:
    git clone https://github.com/aws-samples/content-repository-with-multilingual-search content-repository
  2. Install the necessary dependencies:
    cd content-repository/backend-cdk 
    npm install
  3. Configure environment variables:
    export CDK_DEFAULT_ACCOUNT=$(aws sts get-caller-identity --query 'Account' --output text)
    export CDK_DEFAULT_REGION=$(aws configure get region)
  4. Bootstrap your account for AWS CDK usage:
    cdk bootstrap aws://$CDK_DEFAULT_ACCOUNT/$CDK_DEFAULT_REGION
  5. Deploy the code to your AWS account:
    cdk deploy --all

The complete stack set-up may take up to 20 minutes.

Creation of SageMaker endpoint

Follow below steps to create the SageMaker endpoint in the same AWS Region where you deployed the AWS CDK stack.

    1. Sign in to the SageMaker console.
    2. In the navigation menu, select Notebook, then Notebook instances.
    3. Choose Create notebook instance.
    4. Under the Notebook instance settings, enter content-repo-notebook as the notebook instance name, and leave other defaults as-is.
    5. Under the Permissions and encryption section (Figure 5), you need to set the IAM role section to the role with the prefix content-repo-search-stack. In case you don’t see this role automatically populated, select it from the drop-down. Leave the rest of the defaults, and choose Create notebook instance.

      Notebook permissions

      Figure 5. Notebook permissions

    6. The notebook creation status changes to Pending before it’s available for use within 3-4 minutes.
    7. Once the notebook is in the Available status, choose Open Jupyter.
    8. Choose the Upload button and upload the create-sagemaker-endpoint.ipynb file in the backend-cdk folder of the root of the blog repository.
    9. Open the create-sagemaker-endpoint.ipynb notebook. Select the option Run All from the Cell menu (Figure 6). This might take up to 10 minutes.

      Run create-sagemaker-endpoint notebook cells

      Figure 6. Run create-sagemaker-endpoint notebook cells

    10. After all the cells have successfully run, verify that the AWS Systems Manager parameter sagemaker-endpoint is updated with the value of the SageMaker endpoint name. An example of value as the output of the cell is in Figure 7. In case you don’t see the output, check if the preceding steps were run correctly.

      SSM parameter updated with SageMaker endpoint

      Figure 7. SSM parameter updated with SageMaker endpoint

    11. Verify in the SageMaker console that the inference endpoint with the prefix tensorflow-inference has been deployed and is set to status InService.
    12. Upload sample data to the content repository:
      • Update the S3_BUCKET_NAME variable in the upload_documents_to_S3.sh script in the root folder of the blog repository with the s3SourceBucketName from the AWS CDK output of the content-repo-search-stack.
      • Run upload_documents_to_S3.sh script to upload 150 sample documents to the content repository. This takes 5-6 minutes. During this process, the uploaded document triggers the workflow described in the Implementing multilingual semantic search functionality.

Using the search service

At this stage, you have deployed all the building blocks for the content repository in your AWS account. Next, as part of the upload sample data to the content repository, you pushed a limited corpus of 150 sample documents (.png format). Each document is in one of the four different languages – English, German, Spanish and French. With the added multilingual search capability, you can query in one language and receive semantically similar results across different languages while maintaining the access control logic.

  1. Access the frontend application:
    • Copy the amplifyHostedAppUrl value of the AWS CDK output from the content-repo-search-stack shown in the terminal.
    • Enter the URL in your web browser to access the frontend application.
    • A temporary page displays until the automated build and deployment of the React application completes after 4-5 minutes.
  2. Sign into the application:
    • The content repository provides two demo users with credentials as part of the demo-data-stack in the AWS CDK output. Copy the password from the terminal associated with the sales-user, which belongs to the sales department.
    • Follow the prompts from the React webpage to sign in with the sales-user and change the temporary password.
  3. Enter search queries and verify results. The search action invokes the workflow described in Running input search query. For example:
    • Enter works well as the search query. Note the multilingual output and the semantically similar results (Figure 8).

      Positive sentiment multi-lingual search result for the sales-user

        Figure 8. Positive sentiment multilingual search result for the sales-user

    • Enter bad quality as the search query. Note the multilingual output and the semantically similar results (Figure 9).

      Negative sentiment multi-lingual search result for the sales-user

      Figure 9. Negative sentiment multi-lingual search result for the sales-user

  4. Sign out as the sales-user with the Log Out button on the webpage.
  5. Sign in using the marketing-user credentials to verify access control:
    • Follow the sign in procedure in step 2 but with the marketing-user.
    • This time with works well as search query, you find different output. This is because the access control only allows marketing-user to search for the documents that belong to the marketing department (Figure 10).

      Positive sentiment multi-lingual search result for the marketing-user

      Figure 10. Positive sentiment multilingual search result for the marketing-user

Cleanup

In the backend-cdk subdirectory of the cloned repository, delete the deployed resources: cdk destroy --all.

Additionally, you need to access the Amazon SageMaker console to delete the SageMaker endpoint and notebook instance created as part of the Walkthrough setup section.

Conclusion

In this blog, we enriched the content repository with multi-lingual semantic search features while maintaining the access control fundamentals that we implemented in Part 1. The building blocks of the semantic search for unstructured documents—Amazon Textract, Amazon SageMaker, and Amazon OpenSearch Service—set a foundation for you to customize and enhance the search capabilities for your specific use case. For example, you can leverage the fast developments in Large Language Models (LLM) to enhance the semantic search experience. You can replace the encoder model with an LLM capable of generating multilingual embeddings while still maintaining the OpenSearch service to store and index data and perform vector search.

Alcion supports their multi-tenant platform with Amazon OpenSearch Serverless

Post Syndicated from Zack Rossman original https://aws.amazon.com/blogs/big-data/alcion-supports-their-multi-tenant-platform-with-amazon-opensearch-serverless/

This is a guest blog post co-written with Zack Rossman from Alcion.

Alcion, a security-first, AI-driven backup-as-a-service (BaaS) platform, helps Microsoft 365 administrators quickly and intuitively protect data from cyber threats and accidental data loss. In the event of data loss, Alcion customers need to search metadata for the backed-up items (files, emails, contacts, events, and so on) to select specific item versions for restore. Alcion uses Amazon OpenSearch Service to provide their customers with accurate, efficient, and reliable search capability across this backup catalog. The platform is multi-tenant, which means that Alcion requires data isolation and strong security so as to ensure that tenants can only search their own data.

OpenSearch Service is a fully managed service that makes it easy to deploy, scale, and operate OpenSearch in the AWS Cloud. OpenSearch is an Apache-2.0-licensed, open-source search and analytics suite, comprising OpenSearch (a search, analytics engine, and vector database), OpenSearch Dashboards (a visualization and utility user interface), and plugins that provide advanced capabilities like enterprise-grade security, anomaly detection, observability, alerting, and much more. Amazon OpenSearch Serverless is a serverless deployment option that makes it simple to use OpenSearch without configuring, managing, and scaling OpenSearch Service domains.

In this post, we share how adopting OpenSearch Serverless enabled Alcion to meet their scale requirements, reduce their operational overhead, and secure their tenants’ data by enforcing tenant isolation within their multi-tenant environment.

OpenSearch Service managed domains

For the first iteration of their search architecture, Alcion chose the managed domains deployment option in OpenSearch Service and was able to launch their search functionality in production in less than a month. To meet their security, scale, and tenancy requirements, they stored data for each tenant in a dedicated index and used fine-grained access control in OpenSearch Service to prevent cross-tenant data leaks. As their workload evolved, Alcion engineers tracked OpenSearch domain utilization via the provided Amazon CloudWatch metrics, making changes to increase storage and optimize their compute resources.

The team at Alcion used several features of OpenSearch Service managed domains to improve their operational stance. They introduced index aliases, which provide a single alias name to access (read and write) multiple underlying indexes. They also configured Index State Management (ISM) policies to help them control their data lifecycle by rolling indexes over based on index size. Together, the ISM policies and index aliases were necessary to scale indexes for large tenants. Alcion also used index templates to define the shards per index (partitioning) of their data so as to automate their data lifecycle and improve the performance and stability of their domains.

The following architecture diagram shows how Alcion configured their OpenSearch managed domains.

The following diagram shows how Microsoft 365 data was indexed to and queried from tenant-specific indexes. Alcion implemented request authentication by providing the OpenSearch primary user credentials with each API request.

OpenSearch Serverless overview and tenancy model options

OpenSearch Service managed domains provided a stable foundation for Alcion’s search functionality, but the team needed to manually provision resources to the domains for their peak workload. This left room for cost optimizations because Alcion’s workload is bursty—there are large variations in the number of search and indexing transactions per second, both for a single customer and taken as a whole. To reduce costs and operational burden, the team turned to OpenSearch Serverless, which offers auto-scaling capability.

To use OpenSearch Serverless, the first step is to create a collection. A collection is a group of OpenSearch indexes that work together to support a specific workload or use case. The compute resources for a collection, called OpenSearch Compute Units (OCUs), are shared across all collections in an account that share an encryption key. The pool of OCUs is automatically scaled up and down to meet the demands of indexing and search traffic.

The level of effort required to migrate from an OpenSearch Service managed domain to OpenSearch Serverless was manageable thanks to the fact that OpenSearch Serverless collections support the same OpenSearch APIs and libraries as OpenSearch Service managed domains. This allowed Alcion to focus on optimizing the tenancy model for the new search architecture. Specifically, the team needed to decide how to partition tenant data within collections and indexes while balancing security and total cost of ownership. Alcion engineers, in collaboration with the OpenSearch Serverless team, considered three tenancy models:

  • Silo model: Create a collection for each tenant
  • Pool model: Create a single collection and use a single index for multiple tenants
  • Bridge model: Create a single collection and use a single index per tenant

All three design choices had benefits and trade-offs that had to be considered for designing the final solution.

Silo model: Create a collection for each tenant

In this model, Alcion would create a new collection whenever a new customer onboarded to their platform. Although tenant data would be cleanly separated between collections, this option was disqualified because the collection creation time meant that customers wouldn’t be able to back up and search data immediately after registration.

Pool model: Create a single collection and use a single index for multiple tenants

In this model, Alcion would create a single collection per AWS account and index tenant-specific data in one of many shared indexes belonging to that collection. Initially, pooling tenant data into shared indexes was attractive from a scale perspective because this led to the most efficient use of index resources. But after further analysis, Alcion found that they would be well within the per-collection index quota even if they allocated one index for each tenant. With that scalability concern resolved, Alcion pursued the third option because siloing tenant data into dedicated indexes results in stronger tenant isolation than the shared index model.

Bridge model: Create a single collection and use a single index per tenant

In this model, Alcion would create a single collection per AWS account and create an index for each of the hundreds of tenants managed by that account. By assigning each tenant to a dedicated index and pooling these indexes in a single collection, Alcion reduced onboarding time for new tenants and siloed tenant data into cleanly separated buckets.

Implementing role-based access control for supporting multi-tenancy

OpenSearch Serverless offers a multi-point, inheritable set of security controls, covering data access, network access, and encryption. Alcion took full advantage of OpenSearch Serverless data access policies to implement role-based access control (RBAC) for each tenant-specific index with the following details:

  • Allocate an index with a common prefix and the tenant ID (for example, index-v1-<tenantID>)
  • Create a dedicated AWS Identity and Access Management (IAM) role that is used to sign requests to the OpenSearch Serverless collection
  • Create an OpenSearch Serverless data access policy that grants document read/write permissions within a dedicated tenant index to the IAM role for that tenant
  • OpenSearch API requests to a tenant index are signed with temporary credentials belonging to the tenant-specific IAM role

The following is an example OpenSearch Serverless data access policy for a mock tenant with ID t-eca0acc1-12345678910. This policy grants the IAM role document read/write access to the dedicated tenant access.

[
    {
        "Rules": [
            {
                "Resource": [
                    "index/collection-searchable-entities/index-v1-t-eca0acc1-12345678910"
                ],
                "Permission": [
                    "aoss:ReadDocument",
                    "aoss:WriteDocument",
                ],
                "ResourceType": "index"
            }
        ],
        "Principal": [
            "arn:aws:iam::12345678910:role/OpenSearchAccess-t-eca0acc1-1b9f-4b3f-95d6-12345678910"
        ],
        "Description": "Allow document read/write access to OpenSearch index belonging to tenant t-eca0acc1-1b9f-4b3f-95d6-12345678910"
    }
] 

The following architecture diagram depicts how Alcion implemented indexing and searching for Microsoft 365 resources using the OpenSearch Serverless shared collection approach.

The following is the sample code snippet for sending an API request to an OpenSearch Serverless collection. Notice how the API client is initialized with a signer object that signs requests with the same IAM principal that is linked to the OpenSearch Serverless data access policy from the previous code snippet.

package alcion

import (
	"context"
	"encoding/json"
	"strings"

	"github.com/aws/aws-sdk-go-v2/aws"
	"github.com/aws/aws-sdk-go-v2/config"
	"github.com/aws/aws-sdk-go-v2/credentials/stscreds"
	"github.com/aws/aws-sdk-go-v2/service/sts"
	"github.com/opensearch-project/opensearch-go/v2"
	"github.com/opensearch-project/opensearch-go/v2/opensearchapi"
	"github.com/opensearch-project/opensearch-go/v2/signer"
	awssignerv2 "github.com/opensearch-project/opensearch-go/v2/signer/awsv2"
	"github.com/pkg/errors"
)

const (
	// Scope the API request to the AWS OpenSearch Serverless service
	aossService = "aoss"

	// Mock values
	indexPrefix        = "index-v1-"
	collectionEndpoint = "<https://kfbr3928z4y6vot2mbpb.us-east-1.aoss.amazonaws.com>"
	tenantID           = "t-eca0acc1-1b9f-4b3f-95d6-b0b96b8c03d0"
	roleARN            = "arn:aws:iam::1234567890:role/OpenSearchAccess-t-eca0acc1-1b9f-4b3f-95d6-b0b96b8c03d0"
)

func CreateIndex(ctx context.Context, tenantID string) (*opensearchapi.Response, error) {

	sig, err := createRequestSigner(ctx)
	if err != nil {
		return nil, errors.Wrapf(err, "error creating new signer for AWS OSS")
	}

	cfg := opensearch.Config{
		Addresses: []string{collectionEndpoint},
		Signer:    sig,
	}

	aossClient, err := opensearch.NewClient(cfg)
	if err != nil {
		return nil, errors.Wrapf(err, "error creating new OpenSearch API client")
	}

  body, err := getSearchBody()
  if err != nil {
    return nil, errors.Wrapf(err, "error getting search body")
  }

	req := opensearchapi.SearchRequest{
		Index: []string{indexPrefix + tenantID},
		Body:  body,
	}

	return req.Do(ctx, aossClient)
}

func createRequestSigner(ctx context.Context) (signer.Signer, error) {

	awsCfg, err := config.LoadDefaultConfig(ctx)
	if err != nil {
		return nil, errors.Wrapf(err, "error loading default config")
	}

	stsClient := sts.NewFromConfig(awsCfg)
	provider := stscreds.NewAssumeRoleProvider(stsClient, roleARN)

	awsCfg.Credentials = aws.NewCredentialsCache(provider)
	return awssignerv2.NewSignerWithService(awsCfg, aossService)
}

func getSearchBody() (*strings.Reader, error) {
	// Match all documents, page size = 10
	query := map[string]interface{}{
		"size": 10,
	}

	queryJson, err := json.Marshal(query)
  if err != nil {
    return nil, err
  }

	return strings.NewReader(string(queryJson)), nil
} 

Conclusion

In May of 2023, Alcion rolled out its search architecture based on the shared collection and dedicated index-per-tenant model in all production and pre-production environments. The team was able to tear out complex code and operational processes that had been dedicated to scaling OpenSearch Service managed domains. Furthermore, thanks to the auto scaling capabilities of OpenSearch Serverless, Alcion has reduced their OpenSearch costs by 30% and expects the cost profile to scale favorably.

In their journey from managed to serverless OpenSearch Service, Alcion benefited in their initial choice of OpenSearch Service managed domains. In migrating forward, they were able to reuse the same OpenSearch APIs and libraries for their OpenSearch Serverless collections that they used for their OpenSearch Service managed domain. Additionally, they updated their tenancy model to take advantage of OpenSearch Serverless data access policies. With OpenSearch Serverless, they were able to effortlessly adapt to their customers’ scale needs while ensuring tenant isolation.

For more information about Alcion, visit their website.


About the Authors

Zack Rossman is a Member of Technical Staff at Alcion. He is the tech lead for the search and AI platforms. Prior to Alcion, Zack was a Senior Software Engineer at Okta, developing core workforce identity and access management products for the Directories team.

Niraj Jetly is a Software Development Manager for Amazon OpenSearch Serverless. Niraj leads several data plane teams responsible for launching Amazon OpenSearch Serverless. Prior to AWS, Niraj led several product and engineering teams as CTO, VP of Engineering, and Head of Product Management for over 15 years. Niraj is a recipient of over 15 innovation awards, including being named CIO of the year in 2014 and top 100 CIO in 2013 and 2016. A frequent speaker at several conferences, he has been quoted in NPR, WSJ, and The Boston Globe.

Jon Handler is a Senior Principal Solutions Architect at Amazon Web Services based in Palo Alto, CA. Jon works closely with OpenSearch and Amazon OpenSearch Service, providing help and guidance to a broad range of customers who have search and log analytics workloads that they want to move to the AWS Cloud. Prior to joining AWS, Jon’s career as a software developer included 4 years of coding a large-scale, ecommerce search engine. Jon holds a Bachelor of the Arts from the University of Pennsylvania and a Master of Science and a PhD in Computer Science and Artificial Intelligence from Northwestern University.

Build a serverless log analytics pipeline using Amazon OpenSearch Ingestion with managed Amazon OpenSearch Service

Post Syndicated from Hajer Bouafif original https://aws.amazon.com/blogs/big-data/build-a-serverless-log-analytics-pipeline-using-amazon-opensearch-ingestion-with-managed-amazon-opensearch-service/

In this post, we show how to build a log ingestion pipeline using the new Amazon OpenSearch Ingestion, a fully managed data collector that delivers real-time log and trace data to Amazon OpenSearch Service domains. OpenSearch Ingestion is powered by the open-source data collector Data Prepper. Data Prepper is part of the open-source OpenSearch project. With OpenSearch Ingestion, you can filter, enrich, transform, and deliver your data for downstream analysis and visualization. OpenSearch Ingestion is serverless, so you don’t need to worry about scaling your infrastructure, operating your ingestion fleet, and patching or updating the software.

For a comprehensive overview of OpenSearch Ingestion, visit Amazon OpenSearch Ingestion, and for more information about the Data Prepper open-source project, visit Data Prepper.

In this post, we explore the logging infrastructure for a fictitious company, AnyCompany. We explore the components of the end-to-end solution and then show how to configure OpenSearch Ingestion’s main parameters and how the logs come in and out of OpenSearch Ingestion.

Solution overview

Consider a scenario in which AnyCompany collects Apache web logs. They use OpenSearch Service to monitor web access and identify possible root causes to error logs of type 4xx and 5xx. The following architecture diagram outlines the use of every component used in the log analytics pipeline: Fluent Bit collects and forwards logs; OpenSearch Ingestion processes, routes, and ingests logs; and OpenSearch Service analyzes the logs.

The workflow contains the following stages:

  1. Generate and collectFluent Bit collects the generated logs and forwards them to OpenSearch Ingestion. In this post, you create fake logs that Fluent Bit forwards to OpenSearch Ingestion. Check the list of supported clients to review the required configuration for each client supported by OpenSearch Ingestion.
  2. Process and ingest – OpenSearch Ingestion filters the logs based on response value, processes the logs using a grok processor, and applies conditional routing to ingest the error logs to an OpenSearch Service index.
  3. Store and analyze – We can analyze the Apache httpd error logs using OpenSearch Dashboards.

Prerequisites

To implement this solution, make sure you have the following prerequisites:

Configure OpenSearch Ingestion

First, you define the appropriate AWS Identity and Access Management (IAM) permissions to write to and from OpenSearch Ingestion. Then you set up the pipeline configuration in the OpenSearch Ingestion. Let’s explore each step in more detail.

Configure IAM permissions

OpenSearch Ingestion works with IAM to secure communications into and out of OpenSearch Ingestion. You need two roles, authenticated using AWS Signature V4 (SigV4) signed requests. The originating entity requires permissions to write to OpenSearch Ingestion. OpenSearch Ingestion requires permissions to write to your OpenSearch Service domain. Finally, you must create an access policy using OpenSearch Service’s fine-grained access control, which allows OpenSearch Ingestion to create indexes and write to them in your domain.

The following diagram illustrates the IAM permissions to allow OpenSearch Ingestion to write to an OpenSearch Service domain. Refer to Setting up roles and users in Amazon OpenSearch Ingestion to get more details on roles and permissions required to use OpenSearch Ingestion.

In the demo, you use the AWS Cloud9 EC2 instance profile’s credentials to sign requests sent to OpenSearch Ingestion. You use Fluent Bit to fetch the credentials and assume the role you pass in the aws_role_arn you configure later.

  1. Create an ingestion role (called IngestionRole) to allow Fluent Bit to ingest the logs into your pipeline.

Create a trust relationship to allow Fluent Bit to assume the ingestion role, as shown in the following code. Fluent Bit attempts to fetch the credentials in the following order. In configuring the access policy for this role, you grant permission for the osis:Ingest.

{
    "Version": "2012-10-17",
    "Statement": [
        {
            "Effect": "Allow",
            "Principal": {
                "AWS": "{your-account-id}"
            },
            "Action": "sts:AssumeRole"
        }
    ]
}
  1. Create a pipeline role (called PipelineRole) with a trust relationship for OpenSearch Ingestion to assume that role. The domain-level access policy of the OpenSearch domain grants the pipeline role access to the domain.
  1. Finally, configure your domain’s security plugin to enable OpenSearch Ingestion’s assumed role to create indexes and write data to the domain.

In this demo, the OpenSearch Service domain uses fine-grained access control for authentication, so you need to map the OpenSearch Ingestion pipeline role to the OpenSearch backend role all_access. For instructions, refer to Step 2: Include the pipeline role in the domain access policy page.

Create the pipeline in OpenSearch Ingestion

To create an OpenSearch Ingestion pipeline, complete the following steps:

  1. On the OpenSearch Service console, choose Pipelines in the navigation pane.
  2. Choose Create pipeline.
  3. For Pipeline name, enter a name.

  1. Input the minimum and maximum Ingestion OpenSearch Compute Units (Ingestion OCUs). In this example, we use the default pipeline capacity settings of minimum 1 Ingestion OCU and maximum 4 Ingestion OCUs.

Each OCU is a combination of approximately 8 GB of memory and 2 vCPUs that can handle an estimated 8 GiB per hour. OpenSearch Ingestion supports up to 96 OCUs, and it automatically scales up and down based on your ingest workload demand.

  1. In the Pipeline configuration section, configure Data Prepper to process your data by choosing the appropriate blueprint configuration template on the Configuration blueprints menu. For this post, we choose AWS-LogAggregationWithConditionalRouting.

The OpenSearch Ingestion pipeline configuration consists of four sections:

  • Source – This is the input component of a pipeline. It defines the mechanism through which a pipeline consumes records. In this post, you use the http_source plugin and provide the Fluent Bit output URI value within the path attribute.
  • Processors – This represents an intermediate processing to filter, transform, and enrich your input data. Refer to Supported plugins for more details on the list of operations supported in OpenSearch Ingestion. In this post, we use the grok processor COMMONAPACHELOG, which matches input logs against the common Apache log pattern and makes it easy to query in OpenSearch Service.
  • Sink – This is the output component of a pipeline. It defines one or more destinations to which a pipeline publishes records. In this post, you define an OpenSearch Service domain and index as sink.
  • Route – This is the part of a processor that allows the pipeline to route the data into different sinks based on specific conditions. In this example, you create four routes based in the response field value of the log. If the response field value of the log line matches 2xx or 3xx, the log is sent to the OpenSearch Service index aggregated_2xx_3xx. If the response field value matches 4xx, the log is sent to the index aggregated_4xx. If the response field value matches 5xx, the log is sent to the index aggregated_5xx.
  1. Update the blueprint based on your use case. The following code shows an example of the pipeline configuration YAML file:
version: "2"
log-aggregate-pipeline:
  source:
    http:
      # Provide the FluentBit output URI value.
      path: "/log/ingest"
  processor:
    - date:
        from_time_received: true
        destination: "@timestamp"
    - grok:
        match:
          log: [ "%{COMMONAPACHELOG_DATATYPED}" ]
  route:
    - 2xx_status: "/response >= 200 and /response < 300"
    - 3xx_status: "/response >= 300 and /response < 400"
    - 4xx_status: "/response >= 400 and /response < 500"
    - 5xx_status: "/response >= 500 and /response < 600"
  sink:
    - opensearch:
        # Provide an AWS OpenSearch Service domain endpoint
        hosts: [ "{your-domain-endpoint}" ]
        aws:
          # Provide a Role ARN with access to the domain. This role should have a trust relationship with osis-pipelines.amazonaws.com
          sts_role_arn: "arn:aws:iam::{your-account-id}:role/PipelineRole"
          # Provide the region of the domain.
          region: "{AWS_Region}"
        index: "aggregated_2xx_3xx"
        routes:
          - 2xx_status
          - 3xx_status
    - opensearch:
        # Provide an AWS OpenSearch Service domain endpoint
        hosts: [ "{your-domain-endpoint}"  ]
        aws:
          # Provide a Role ARN with access to the domain. This role should have a trust relationship with osis-pipelines.amazonaws.com
          sts_role_arn: "arn:aws:iam::{your-account-id}:role/PipelineRole"
          # Provide the region of the domain.
          region: "{AWS_Region}"
        index: "aggregated_4xx"
        routes:
          - 4xx_status
    - opensearch:
        # Provide an AWS OpenSearch Service domain endpoint
        hosts: [ "{your-domain-endpoint}"  ]
        aws:
          # Provide a Role ARN with access to the domain. This role should have a trust relationship with osis-pipelines.amazonaws.com
          sts_role_arn: "arn:aws:iam::{your-account-id}:role/PipelineRole"
          # Provide the region of the domain.
          region: "{AWS_Region}"
        index: "aggregated_5xx"
        routes:
          - 5xx_status

Provide the relevant values for your domain endpoint, account ID, and Region related to your configuration.

  1. Check the health of your configuration setup by choosing Validate pipeline when you finish the update.

When designing a production workload, deploy your pipeline within a VPC. For instructions, refer to Securing Amazon OpenSearch Ingestion pipelines within a VPC.

  1. For this post, select Public access under Network.

  1. In the Log publishing options section, select Publish to CloudWatch logs and Create new group.

OpenSearch Ingestion uses the log levels of INFO, WARN, ERROR, and FATAL. Enabling log publishing helps you monitor your pipelines in production.

  1. Choose Next and Create pipeline.
  2. Select the pipeline and choose View details to see the progress of the pipeline creation.

Wait until the status changes to Active to start using the pipeline.

Send logs to the OpenSearch Ingestion pipeline

To start sending logs to the OpenSearch Ingestion pipeline, complete the following steps:

  1. On the AWS Cloud9 console, create a Fluent Bit configuration file and update the following attributes:
    • Host – Enter the ingestion URL of your OpenSearch Ingestion pipeline.
    • aws_service – Enter osis.
    • aws_role_arn – Enter the ARN of the IAM role IngestionRole.

The following code shows an example of the Fluent-bit.conf file:

[SERVICE]
    parsers_file          ./parsers.conf
    
[INPUT]
    name                  tail
    refresh_interval      5
    path                  /var/log/*.log
    read_from_head        true
[FILTER]
    Name parser
    Key_Name log
    Parser apache
[OUTPUT]
    Name http
    Match *
    Host {Ingestion URL}
    Port 443
    URI /log/ingest
    format json
    aws_auth true
    aws_region {AWS_region}
    aws_role_arn arn:aws:iam::{your-account-id}:role/IngestionRole
    aws_service osis
    Log_Level trace
    tls On
  1. In the AWS Cloud9 environment, create a docker-compose YAML file to deploy Fluent Bit and Flog containers:
version: '3'
services:
  fluent-bit:
    container_name: fluent-bit
    image: docker.io/amazon/aws-for-fluent-bit
    volumes:
      - ./fluent-bit.conf:/fluent-bit/etc/fluent-bit.conf
      - ./apache-logs:/var/log
  flog:
    container_name: flog
    image: mingrammer/flog
    command: flog -t log -f apache_common -o web/log/test.log -w -n 100000 -d 1ms -p 1000
    volumes:
      - ./apache-logs:/web/log

Before you start the Docker containers, you need to update the IAM EC2 instance role in AWS Cloud9 so it can sign the requests sent to OpenSearch Ingestion.

  1. For demo purposes, create an IAM service-linked role and choose EC2 under Use case to allow the AWS Cloud9 EC2 instance to call OpenSearch Ingestion on your behalf.
  2. Add the OpenSearch Ingestion policy, which is the same policy you used with IngestionRole.
  3. Add the AdministratorAccess permission policy to the role as well.

Your role definition should look like the following screenshot.

  1. After you create the role, go back to AWS Cloud9, select your demo environment, and choose View details.
  2. On the EC2 instance tab, choose Manage EC2 instance to view the details of the EC2 instance attached to your AWS Cloud9 environment.

  1. On the Amazon EC2 console, replace the IAM role of your AWS Cloud9 EC2 instance with the new role.
  2. Open a terminal in AWS Cloud9 and run the command docker-compose up.

Check the output in the terminal—if everything is working correctly, you get status 200.

Fluent Bit collects logs from the /var/log repository in the container and pushes the data to the OpenSearch Ingestion pipeline.

  1. Open OpenSearch Dashboards, navigate to Dev Tools, and run the command GET _cat/indices to validate that the data has been delivered by OpenSearch Ingestion to your OpenSearch Service domain.

You should see the three indexes created: aggregated_2xx_3xx, aggregated_4xx, and aggregated_5xx.

Now you can focus on analyzing your log data and reinvent your business without having to worry about any operational overhead regarding your ingestion pipeline.

Best practices for monitoring

You can monitor the Amazon CloudWatch metrics made available to you to maintain the right performance and availability of your pipeline. Check the list of available pipeline metrics related to the source, buffer, processor, and sink plugins.

Navigate to the Metrics tab for your specific OpenSearch Ingestion pipeline to explore the graphs available to each metric, as shown in the following screenshot.

In your production workloads, make sure to configure the following CloudWatch alarms to notify you when the pipeline metrics breach a specific threshold so you can promptly remediate each issue.

Managing cost

While OpenSearch Ingestion automatically provisions and scales the OCUs for your spiky workloads, you only pay for the compute resources actively used by your pipeline to ingest, process, and route data. Therefore, setting up a maximum capacity of Ingestion OCUs allows you to handle your workload peak demand while controlling cost.

For production workloads, make sure to configure a minimum of 2 Ingestion OCUs to ensure 99.9% availability for the ingestion pipeline. Check the sizing recommendations and learn how OpenSearch Ingestion responds to workload spikes.

Clean up

Make sure you clean up unwanted AWS resources created during this post in order to prevent additional billing for these resources. Follow these steps to clean up your AWS account:

  1. On the AWS Cloud9 console, choose Environments in the navigation pane.
  2. Select the environment you want to delete and choose Delete.
  3. On the OpenSearch Service console, choose Domains under Managed clusters in the navigation pane.
  4. Select the domain you want to delete and choose Delete.
  5. Select Pipelines under Ingestion in the navigation pane.
  6. Select the pipeline you want to delete and on the Actions menu, choose Delete.

Conclusion

In this post, you learned how to create a serverless ingestion pipeline to deliver Apache access logs to an OpenSearch Service domain using OpenSearch Ingestion. You learned the IAM permissions required to start using OpenSearch Ingestion and how to use a pipeline blueprint instead of creating a pipeline configuration from scratch.

You used Fluent Bit to collect and forward Apache logs, and used OpenSearch Ingestion to process and conditionally route the log data to different indexes in OpenSearch Service. For more examples about writing to OpenSearch Ingestion pipelines, refer to Sending data to Amazon OpenSearch Ingestion pipelines.

Finally, the post provided you with recommendations and best practices to deploy OpenSearch Ingestion pipelines in a production environment while controlling cost.

Follow this post to build your serverless log analytics pipeline, and refer to Top strategies for high volume tracing with Amazon OpenSearch Ingestion to learn more about high volume tracing with OpenSearch Ingestion.


About the authors

Hajer Bouafif is an Analytics Specialist Solutions Architect at Amazon Web Services. She focuses on OpenSearch Service and helps customers design and build well-architected analytics workloads in diverse industries. Hajer enjoys spending time outdoors and discovering new cultures.

Francisco Losada is an Analytics Specialist Solutions Architect based out of Madrid, Spain. He works with customers across EMEA to architect, implement, and evolve analytics solutions at AWS. He advocates for OpenSearch, the open-source search and analytics suite, and supports the community by sharing code samples, writing content, and speaking at conferences. In his spare time, Francisco enjoys playing tennis and running.

Muthu Pitchaimani is a Search Specialist with Amazon OpenSearch Service. He builds large-scale search applications and solutions. Muthu is interested in the topics of networking and security, and is based out of Austin, Texas.

AWS Week in Review – Updates on Amazon FSx for NetApp ONTAP, AWS Lambda, eksctl, Karpetner, and More – July 17, 2023

Post Syndicated from Channy Yun original https://aws.amazon.com/blogs/aws/aws-week-in-review-updates-on-amazon-fsx-for-netapp-ontap-aws-lambda-eksctl-karpetner-and-more-july-17-2023/

The Data Centered: Eastern Oregon, a five-part mini-documentary series looking at the real-life impact of the more than $15 billion investment AWS has made in the local community, and how the company supports jobs, generates economic growth, provides skills training and education, and unlocks opportunities for local businesses suppliers.

Last week, I watched a new episode introducing the Data Center Technician training program offered by AWS to train people with little or no previous technical experience in the skills they need to work in data centers and other information technology (IT) roles. This video reminded me of my first days of cabling and transporting servers in data centers. Remember, there are still people behind cloud computing.

Last Week’s Launches
Here are some launches that got my attention:

Amazon FSx for NetApp ONTAP Updates – Jeff Barr introduced Amazon FSx for NetApp ONTAP support for SnapLock, an ONTAP feature that gives you the power to create volumes that provide write once read many (WORM) functionality for regulatory compliance and ransomware protection. In addition, FSx for NetApp ONTAP now supports IPSec encryption of data in transit and two additional monitoring and troubleshooting capabilities that you can use to monitor file system events and diagnose network connectivity.

AWS Lambda detects and stops recursive loops in Lambda functions – In certain scenarios, due to resource misconfiguration or code defects, a processed event might be sent back to the same service or resource that invoked the Lambda function. This can cause an unintended recursive loop and result in unintended usage and costs for customers. With this launch, Lambda will stop recursive invocations between Amazon SQS, Lambda, and Amazon SNS after 16 recursive calls. For more information, refer to our documentation or the launch blog post.

Email notification

Amazon CloudFront supports for 3072-bit RSA certificates – You can now associate their 3072-bit RSA certificates with CloudFront distributions to enhance communication security between clients and CloudFront edge locations. To get started, associate a 3072-bit RSA certificate with your CloudFront distribution using console or APIs. There are no additional fees associated with this feature. For more information, please refer to the CloudFront Developer Guide.

Running GitHub Actions with AWS CodeBuild – Two weeks ago, AWS CodeBuild started to support GitHub Actions. You can now define GitHub Actions steps directly in the BuildSpec and run them alongside CodeBuild commands. Last week, the AWS DevOps Blog published the blog post about using the Liquibase GitHub Action for deploying changes to an Amazon Aurora database in a private subnet. You can learn how to integrate AWS CodeBuild and nearly 20,000 GitHub Actions developed by the open source community.

CodeBuild configuration showing the GitHub repository URL

Amazon DynamoDB local version 2.0 – You can develop and test applications by running Amazon DynamoDB local in your local development environment without incurring any additional costs. The new 2.0 version allows Java developers to use DynamoDB local to work with Spring Boot 3 and frameworks such as Spring Framework 6 and Micronaut Framework 4 to build modernized, simplified, and lightweight cloud-native applications.

For a full list of AWS announcements, be sure to keep an eye on the What’s New at AWS page.

Open Source Updates
Last week, we introduced new open source projects and significant roadmap contributions to the Jupyter community.

New joint maintainership between Weaveworks and AWS for eksctl – Now the eksctl open source project has been moved from the Weaveworks GitHub organization to a new top level GitHub organization—eksctl-io—that will be jointly maintained by Weaveworks and AWS moving forward. The eksctl project can now be found on GitHub.

Karpenter now supports Windows containers – Karpenter is an open source flexible, high-performance Kubernetes node provisioning and management solution that you can use to quickly scale Amazon EKS clusters. With the launch of version 0.29.0, Karpenter extends the automated node provisioning support to Windows containers running on EKS. Read this blog post for a step-by-step guide on how to get started with Karpenter for Windows node groups.

Updates in Amazon Aurora and Amazon OpenSearch Service – Following the announcement of updates to the PostgreSQL database in May by the open source community, we’ve updated Amazon Aurora PostgreSQL-Compatible Edition to support PostgreSQL 15.3, 14.8, 13.11, 12.15, and 11.20. These releases contain product improvements and bug fixes made by the PostgreSQL community, along with Aurora-specific improvements. You can also run OpenSearch version 2.7 in Amazon OpenSearch Service. With OpenSearch 2.7 (also released in May), we’ve made several improvements to observability, security analytics, index management, and geospatial capabilities in OpenSearch Service.

To learn about weekly updates for open source at AWS, check out the latest AWS open source newsletter by Ricardo.

Upcoming AWS Events
Check your calendars and sign up for these AWS events:

AWS Storage Day on August 9 – Join a one-day virtual event that will help you to better understand AWS storage services and make the most of your data. Register today.

AWS Global Summits – Sign up for the AWS Summit closest to your city: Hong Kong (July 20), New York City (July 26), Taiwan (August 2-3), São Paulo (August 3), and Mexico City (August 30).

AWS Community Days – Join a community-led conference run by AWS user group leaders in your region: Malaysia (July 22), Philippines (July 29-30), Colombia (August 12), and West Africa (August 19).

AWS re:Invent 2023 – Join us to hear the latest from AWS, learn from experts, and connect with the global cloud community. Registration is now open.

You can browse all upcoming AWS-led in-person and virtual events, and developer-focused events such as AWS DevDay.

Take the AWS Blog Customer Survey
We’re focused on improving our content to provide a better customer experience, and we need your feedback to do so. Take our survey to share insights regarding your experience on the AWS Blog.

This survey is hosted by an external company. AWS handles your information as described in the AWS Privacy Notice. AWS will own the data gathered via this survey and will not share the information collected with survey respondents.

That’s all for this week. Check back next Monday for another Week in Review!

Channy

This post is part of our Week in Review series. Check back each week for a quick roundup of interesting news and announcements from AWS!

Access Amazon OpenSearch Serverless collections using a VPC endpoint

Post Syndicated from Raj Ramasubbu original https://aws.amazon.com/blogs/big-data/access-amazon-opensearch-serverless-collections-using-a-vpc-endpoint/

Amazon OpenSearch Serverless helps you index, analyze, and search your logs and data using OpenSearch APIs and dashboards. The OpenSearch Serverless collection is a group of indexes. API and dashboard clients can access the collections from public networks or one or more VPCs. For VPC access to collections and dashboards, you can create VPC endpoints. In this post, we demonstrate how you can create and use VPC endpoints and OpenSearch Serverless network policies to control access to your collections and OpenSearch dashboards from multiple network locations.

The demo in this post uses an AWS Lambda-based client in a VPC to ingest data into a collection via a VPC endpoint and a browser in a public network accessing the same collection.

Solution overview

To illustrate how you can ingest data into an OpenSearch Serverless collection from within a VPC, we use a Lambda function. We use a VPC-hosted Lambda function to create an index in an OpenSearch Serverless collection and add documents to the index using a VPC endpoint. We then use a publicly accessible OpenSearch Serverless dashboard to see the documents ingested from Lambda function.

The following sections detail the steps to ingest data into the collection using Lambda and access the OpenSearch Serverless dashboard.

Prerequisites

This setup assumes that you have already created a VPC with private subnets.

Ingest data using Lambda and access the OpenSearch Serverless dashboard

To set up your solution, complete the following steps:

  1. On the OpenSearch Service console, create a private connection between your VPC and OpenSearch Serverless using a VPC endpoint. Use the private subnets and a security group from your VPC.
  2. Create an OpenSearch collection using the VPC endpoint created in the previous step.
  3. Create a network policy to enable VPC access to the OpenSearch endpoint so the Lambda function can ingest documents to the collection. You should also enable public access to the OpenSearch dashboard endpoint so we can see the documents ingested.
  4. After you create the collection, create a data access policy to grant ingestion access to the Lambda function’s AWS Identity and Access Management (IAM) role.
  5. Additionally, grant read access to the dashboard user’s IAM role.
  6. Add IAM permissions to the Lambda function’s IAM role and the dashboard user’s IAM role for the OpenSearch Serverless collection.
  7. Create a Lambda function in the same VPC and subnet that we used for the OpenSearch endpoint (see the following code). This function creates an index called sitcoms-eighties in the OpenSearch Serverless collection and adds a sample document to the index:
import datetime
import time
from opensearchpy import OpenSearch, RequestsHttpConnection
from requests_aws4auth import AWS4Auth
import boto3

host = '<Insert-OpenSearch-Serverless-Endpoint>'
region = 'us-east-1'
service = 'aoss'
credentials = boto3.Session().get_credentials()
awsauth = AWS4Auth(credentials.access_key, credentials.secret_key, region, service,session_token=credentials.token)

# Build the OpenSearch client
client = OpenSearch(
    hosts=[{'host': host, 'port': 443}],
    http_auth=awsauth,
    use_ssl=True,
    verify_certs=True,
    connection_class=RequestsHttpConnection,
    timeout=300
)

def lambda_handler (event, context):

    # Create index
    response = client.indices.create('sitcoms-eighties')
    print('\nCreating index:')
    print(response)
    time.sleep(5)
    
    dt = datetime.datetime.now()
    # Add a document to the index.
    response = client.index(
        index='sitcoms-eighties',
        body={
            'title': 'Seinfeld',
            'creator': 'Larry David',
            'year': 1989,
            'createtime': dt
        },
        id='1',
    )
    print('\nDocument added:')
    print(response)
  1. Run the Lambda function, and you should see the output as shown in the following screenshot.
  2. You can now see the documents from this index through your publicly accessible OpenSearch Dashboards URL.
  3. Create the index pattern in OpenSearch Dashboards, and then you can see the documents as shown in the following screenshot.

Use a VPC DNS resolver from your network

A client in your VPN network can connect to the collection or dashboards over a VPC endpoint. The client needs to find the VPC endpoint’s IP address using an Amazon Route 53 inbound resolver endpoint. To learn more about Route 53 inbound resolver endpoints, refer to Resolving DNS queries between VPCs and your network. The following diagram shows a sample setup.

The flow for this architecture is as follows:

  1. The DNS query for the OpenSearch Serverless client is routed to a locally configured on-premises DNS server.
  2. The on-premises DNS as configured performs conditional forwarding for the zone us-east-1.aoss.amazonaws.com to a Route 53 inbound resolver endpoint IP address. You must replace your Region name in the preceding zone name.
  3. The inbound resolver endpoint performs DNS resolution by forwarding the query to the private hosted zone that was created along with the OpenSearch Serverless VPC endpoint.
  4. The IP addresses returned by the DNS query are the private IP addresses of the interface VPC endpoint, which allow your on-premises host to establish private connectivity over AWS Site-to-Site VPN.
  5. The interface endpoint is a collection of one or more elastic network interfaces with a private IP address in your account that serves as an entry point for traffic going to an OpenSearch Serverless endpoint.

Summary

OpenSearch Serverless allows you to set up and control access to the service using VPC endpoints and network policies. In this post, we explored how to access an OpenSearch Serverless collection API and dashboard from within a VPC, on premises, and public networks. If you have any questions or suggestions, please write to us in the comments section.


About the Authors

Raj Ramasubbu is a Senior Analytics Specialist Solutions Architect focused on big data and analytics and AI/ML with Amazon Web Services. He helps customers architect and build highly scalable, performant, and secure cloud-based solutions on AWS. Raj provided technical expertise and leadership in building data engineering, big data analytics, business intelligence, and data science solutions for over 18 years prior to joining AWS. He helped customers in various industry verticals like healthcare, medical devices, life science, retail, asset management, car insurance, residential REIT, agriculture, title insurance, supply chain, document management, and real estate.

Vivek Kansal works with the Amazon OpenSearch team. In his role as Principal Software Engineer, he uses his experience in the areas of security, policy engines, cloud-native solutions, and networking to help secure customer data in OpenSearch Service and OpenSearch Serverless in an evolving threat landscape.

AWS Week in Review – Generative AI with LLM Hands-on Course, Amazon SageMaker Data Wrangler Updates, and More – July 3, 2023

Post Syndicated from Donnie Prakoso original https://aws.amazon.com/blogs/aws/aws-week-in-review-generative-ai-with-llm-hands-on-course-amazon-sagemaker-data-wrangler-updates-and-more-july-3-2023/

In last week’s AWS Week in Review post, Danilo mentioned that it’s summer in London. Well, I’m based in Singapore, and it’s mostly summer here. But, June is a special month here as it marks the start of durian season.

Starting next week, I’ll be travelling to Thailand, Malaysia, and the Philippines. But before I go, I want to share some interesting updates from last week for you.

Let’s get started.

Last Week’s Launches
Here are some launches that caught my attention:

New Hands-on Course: Generative AI with Large Language Models – Generative AI has been a technology highlight for the past few months. If you are on your journey to learn large language models (LLM), then you can try the new hands-on course Generative AI with LLMs at Coursera. Antje wrote a post to announce this collaboration course between DeepLearning.AI and AWS. This course is designed to prepare data scientists and engineers to become experts in selecting, training, fine-tuning, and deploying LLMs for real-world applications.

Generative AI with large language models

Amazon SageMaker Data Wrangler direct connection to Snowflake – With this announcement, you can now browse databases, tables, schemas, and query data from Snowflake in SageMaker Data Wrangler. This unlocks the possibility for you to join your data with other popular data sources, such as S3, Amazon Athena, Amazon Redshift, Amazon EMR and over 50 SaaS applications to create the right data set for machine learning.

Amazon SageMaker Role Manager now provides CDK library to create fine-grained permissions — The CDK support for Amazon SageMaker Role Manager lets you define permissions with fine-grained access for SageMaker users, jobs, and SageMaker pipelines programmatically. This will reduce manual efforts and consistent permissions management. For example, the following code grants permissions with a set of related machine learning activities specific to a persona.


export class myCDKStack extends cdk.Stack {
  constructor(scope: cdk.App, id: string, props?: cdk.StackProps) {
    super(scope, id, props);

    const persona = new Persona(this, 'example-persona-id', {
        activities: [
            Activity.runStudioAppsV2(this, 'example-id1', {}), 
            Activity.accessS3Buckets(this, 'example-id2', {s3buckets: [s3.S3Bucket.fromBucketName('DOC-EXAMPLE-BUCKET')]}) 
            Activity.accessAwsServices(this, 'example-id3', {})
        ]
    });

    const role = persona.createRole(this, 'example-IAM-role-id', 'example-IAM-role-name');
    
    }
}                                   
                

AWS SDK for SAP ABAP – Great news for SAP ABAP developers! We just recently announced the general availability of the AWS SDK for SAP ABAP. With this, ABAP developers can use simple, secure and configurable connections between ABAP environments and 200+ supported AWS services in all AWS Regions, including AWS GovCloud (US) Regions. This AWS SDK helps ABAP developers to modernize their business processes with AWS services.

Amazon OpenSearch Ingestion now supports ingesting events from Amazon Security Lake – Amazon OpenSearch Ingestion now lets you bring data in the Apache Parquet format. As Amazon Security Lake also uses Open Cybersecurity Schema Framework (OCSF) in Apache Parquet format, it means you can easily ingest data from Amazon Security Lake.

For a full list of AWS announcements, be sure to keep an eye on the What’s New at AWS page.

AWS Open-Source Updates
As always, my colleague Ricardo has curated the latest updates for open-source news at AWS. Here are some of the highlights.

lightsail-miab-installer – This handy command-line tool developed by my colleague Rio Astamal was designed to simplify the process of setting up Mail-in-a-Box on Amazon Lightsail. With lightsail-miab-installer, you can effortlessly streamline the installation and configuration of Mail-in-a-Box, making it even more accessible and user-friendly.

rdsconn – This amazing tool, created by AWS Hero Aidan Steele, simplifies the process of connecting to an AWS RDS instance within a VPC directly from your laptop. Using the recently launched EC2 Instance Connect, rdsconn eliminates the need for cumbersome SSH tunnels.

cdk-appflow – If you’re using AWS CDK to build your applications and Amazon AppFlow to create bidirectional data transfer integrations between various SaaS applications and AWS, then you’re going to love cdk-appflow, a new AWS CDK construct for Amazon AppFlow. It’s currently in technical preview, but you’re more than welcome to try it and provide us with your feedback.

Upcoming AWS Events
There are also upcoming events that you can join to learn. Let’s start with AWS Summit events:

And, let’s learn from our fellow builders and join AWS Community Days:

Open for Registration for AWS re:Invent
Before I end this post, AWS re:Invent registration is now open!

This learning conference hosted by AWS for the global cloud computing community will be held from Nov 27 to Dec 1, 2023 in Las Vegas.

Pro-tip: You can use information on the Justify Your Trip page to prove the value of your trip to AWS re:Invent.

That’s all for this week. Check back next Monday for another Week in Review.

Happy building.
Donnie

This post is part of our Week in Review series. Check back each week for a quick roundup of interesting news and announcements from AWS!

Amazon OpenSearch Service’s vector database capabilities explained

Post Syndicated from Jon Handler original https://aws.amazon.com/blogs/big-data/amazon-opensearch-services-vector-database-capabilities-explained/

OpenSearch is a scalable, flexible, and extensible open-source software suite for search, analytics, security monitoring, and observability applications, licensed under the Apache 2.0 license. It comprises a search engine, OpenSearch, which delivers low-latency search and aggregations, OpenSearch Dashboards, a visualization and dashboarding tool, and a suite of plugins that provide advanced capabilities like alerting, fine-grained access control, observability, security monitoring, and vector storage and processing. Amazon OpenSearch Service is a fully managed service that makes it simple to deploy, scale, and operate OpenSearch in the AWS Cloud.

As an end-user, when you use OpenSearch’s search capabilities, you generally have a goal in mind—something you want to accomplish. Along the way, you use OpenSearch to gather information in support of achieving that goal (or maybe the information is the original goal). We’ve all become used to the “search box” interface, where you type some words, and the search engine brings back results based on word-to-word matching. Let’s say you want to buy a couch in order to spend cozy evenings with your family around the fire. You go to Amazon.com, and you type “a cozy place to sit by the fire.” Unfortunately, if you run that search on Amazon.com, you get items like fire pits, heating fans, and home decorations—not what you intended. The problem is that couch manufacturers probably didn’t use the words “cozy,” “place,” “sit,” and “fire” in their product titles or descriptions.

In recent years, machine learning (ML) techniques have become increasingly popular to enhance search. Among them are the use of embedding models, a type of model that can encode a large body of data into an n-dimensional space where each entity is encoded into a vector, a data point in that space, and organized such that similar entities are closer together. An embedding model, for instance, could encode the semantics of a corpus. By searching for the vectors nearest to an encoded document — k-nearest neighbor (k-NN) search — you can find the most semantically similar documents. Sophisticated embedding models can support multiple modalities, for instance, encoding the image and text of a product catalog and enabling similarity matching on both modalities.

A vector database provides efficient vector similarity search by providing specialized indexes like k-NN indexes. It also provides other database functionality like managing vector data alongside other data types, workload management, access control and more. OpenSearch’s k-NN plugin provides core vector database functionality for OpenSearch, so when your customer searches for “a cozy place to sit by the fire” in your catalog, you can encode that prompt and use OpenSearch to perform a nearest neighbor query to surface that 8-foot, blue couch with designer arranged photographs in front of fireplaces.

Using OpenSearch Service as a vector database

With OpenSearch Service’s vector database capabilities, you can implement semantic search, Retrieval Augmented Generation (RAG) with LLMs, recommendation engines, and search rich media.

Semantic search

With semantic search, you improve the relevance of retrieved results using language-based embeddings on search documents. You enable your search customers to use natural language queries, like “a cozy place to sit by the fire” to find their 8-foot-long blue couch. For more information, refer to Building a semantic search engine in OpenSearch to learn how semantic search can deliver a 15% relevance improvement, as measured by normalized discounted cumulative gain (nDCG) metrics compared with keyword search. For a concrete example, our Improve search relevance with ML in Amazon OpenSearch Service workshop explores the difference between keyword and semantic search, based on a Bidirectional Encoder Representations from Transformers (BERT) model, hosted by Amazon SageMaker to generate vectors and store them in OpenSearch. The workshop uses product question answers as an example to show how keyword search using the keywords/phrases of the query leads to some irrelevant results. Semantic search is able to retrieve more relevant documents by matching the context and semantics of the query. The following diagram shows an example architecture for a semantic search application with OpenSearch Service as the vector database.

Architecture diagram showing how to use Amazon OpenSearch Service to perform semantic search to improve relevance

Retrieval Augmented Generation with LLMs

RAG is a method for building trustworthy generative AI chatbots using generative LLMs like OpenAI, ChatGPT, or Amazon Titan Text. With the rise of generative LLMs, application developers are looking for ways to take advantage of this innovative technology. One popular use case involves delivering conversational experiences through intelligent agents. Perhaps you’re a software provider with knowledge bases for product information, customer self-service, or industry domain knowledge like tax reporting rules or medical information about diseases and treatments. A conversational search experience provides an intuitive interface for users to sift through information through dialog and Q&A. Generative LLMs on their own are prone to hallucinations—a situation where the model generates a believable but factually incorrect response. RAG solves this problem by complementing generative LLMs with an external knowledge base that is typically built using a vector database hydrated with vector-encoded knowledge articles.

As illustrated in the following diagram, the query workflow starts with a question that is encoded and used to retrieve relevant knowledge articles from the vector database. Those results are sent to the generative LLM whose job is to augment those results, typically by summarizing the results as a conversational response. By complementing the generative model with a knowledge base, RAG grounds the model on facts to minimize hallucinations. You can learn more about building a RAG solution in the Retrieval Augmented Generation module of our semantic search workshop.

Architecture diagram showing how to use Amazon OpenSearch Service to perform retrieval-augmented generation

Recommendation engine

Recommendations are a common component in the search experience, especially for ecommerce applications. Adding a user experience feature like “more like this” or “customers who bought this also bought that” can drive additional revenue through getting customers what they want. Search architects employ many techniques and technologies to build recommendations, including Deep Neural Network (DNN) based recommendation algorithms such as the two-tower neural net model, YoutubeDNN. A trained embedding model encodes products, for example, into an embedding space where products that are frequently bought together are considered more similar, and therefore are represented as data points that are closer together in the embedding space. Another possibility
is that product embeddings are based on co-rating similarity instead of purchase activity. You can employ this affinity data through calculating the vector similarity between a particular user’s embedding and vectors in the database to return recommended items. The following diagram shows an example architecture of building a recommendation engine with OpenSearch as a vector store.

Architecture diagram showing how to use Amazon OpenSearch Service as a recommendation engine

Media search

Media search enables users to query the search engine with rich media like images, audio, and video. Its implementation is similar to semantic search—you create vector embeddings for your search documents and then query OpenSearch Service with a vector. The difference is you use a computer vision deep neural network (e.g. Convolutional Neural Network (CNN)) such as ResNet to convert images into vectors. The following diagram shows an example architecture of building an image search with OpenSearch as the vector store.

Architecture diagram showing how to use Amazon OpenSearch Service to search rich media like images, videos, and audio files

Understanding the technology

OpenSearch uses approximate nearest neighbor (ANN) algorithms from the NMSLIB, FAISS, and Lucene libraries to power k-NN search. These search methods employ ANN to improve search latency for large datasets. Of the three search methods the k-NN plugin provides, this method offers the best search scalability for large datasets. The engine details are as follows:

  • Non-Metric Space Library (NMSLIB) – NMSLIB implements the HNSW ANN algorithm
  • Facebook AI Similarity Search (FAISS) – FAISS implements both HNSW and IVF ANN algorithms
  • Lucene – Lucene implements the HNSW algorithm

Each of the three engines used for approximate k-NN search has its own attributes that make one more sensible to use than the others in a given situation. You can follow the general information in this section to help determine which engine will best meet your requirements.

In general, NMSLIB and FAISS should be selected for large-scale use cases. Lucene is a good option for smaller deployments, but offers benefits like smart filtering where the optimal filtering strategy—pre-filtering, post-filtering, or exact k-NN—is automatically applied depending on the situation. The following table summarizes the differences between each option.

.

NMSLIB-HNSW

FAISS-HNSW

FAISS-IVF

Lucene-HNSW

Max Dimension

16,000

16,000

16,000

1024

Filter

Post filter

Post filter

Post filter

Filter while search

Training Required

No

No

Yes

No

Similarity Metrics

l2, innerproduct, cosinesimil, l1, linf

l2, innerproduct

l2, innerproduct

l2, cosinesimil

Vector Volume

Tens of billions

Tens of billions

Tens of billions

< Ten million

Indexing latency

Low

Low

Lowest

Low

Query Latency & Quality

Low latency & high quality

Low latency & high quality

Low latency & low quality

High latency & high quality

Vector Compression

Flat

Flat

Product Quantization

Flat

Product Quantization

Flat

Memory Consumption

High

High

Low with PQ

Medium

Low with PQ

High

Approximate and exact nearest-neighbor search

The OpenSearch Service k-NN plugin supports three different methods for obtaining the k-nearest neighbors from an index of vectors: approximate k-NN, score script (exact k-NN), and painless extensions (exact k-NN).

Approximate k-NN

The first method takes an approximate nearest neighbor approach—it uses one of several algorithms to return the approximate k-nearest neighbors to a query vector. Usually, these algorithms sacrifice indexing speed and search accuracy in return for performance benefits such as lower latency, smaller memory footprints, and more scalable search. Approximate k-NN is the best choice for searches over large indexes (that is, hundreds of thousands of vectors or more) that require low latency. You should not use approximate k-NN if you want to apply a filter on the index before the k-NN search, which greatly reduces the number of vectors to be searched. In this case, you should use either the score script method or painless extensions.

Score script

The second method extends the OpenSearch Service score script functionality to run a brute force, exact k-NN search over knn_vector fields or fields that can represent binary objects. With this approach, you can run k-NN search on a subset of vectors in your index (sometimes referred to as a pre-filter search). This approach is preferred for searches over smaller bodies of documents or when a pre-filter is needed. Using this approach on large indexes may lead to high latencies.

Painless extensions

The third method adds the distance functions as painless extensions that you can use in more complex combinations. Similar to the k-NN score script, you can use this method to perform a brute force, exact k-NN search across an index, which also supports pre-filtering. This approach has slightly slower query performance compared to the k-NN score script. If your use case requires more customization over the final score, you should use this approach over score script k-NN.

Vector search algorithms

The simple way to find similar vectors is to use k-nearest neighbors (k-NN) algorithms, which compute the distance between a query vector and the other vectors in the vector database. As we mentioned earlier, the score script k-NN and painless extensions search methods use the exact k-NN algorithms under the hood. However, in the case of extremely large datasets with high dimensionality, this creates a scaling problem that reduces the efficiency of the search. Approximate nearest neighbor (ANN) search methods can overcome this by employing tools that restructure indexes more efficiently and reduce the dimensionality of searchable vectors. There are different ANN search algorithms; for example, locality sensitive hashing, tree-based, cluster-based, and graph-based. OpenSearch implements two ANN algorithms: Hierarchical Navigable Small Worlds (HNSW) and Inverted File System (IVF). For a more detailed explanation of how the HNSW and IVF algorithms work in OpenSearch, see blog post “Choose the k-NN algorithm for your billion-scale use case with OpenSearch”.

Hierarchical Navigable Small Worlds

The HNSW algorithm is one of the most popular algorithms out there for ANN search. The core idea of the algorithm is to build a graph with edges connecting index vectors that are close to each other. Then, on search, this graph is partially traversed to find the approximate nearest neighbors to the query vector. To steer the traversal towards the query’s nearest neighbors, the algorithm always visits the closest candidate to the query vector next.

Inverted File

The IVF algorithm separates your index vectors into a set of buckets, then, to reduce your search time, only searches through a subset of these buckets. However, if the algorithm just randomly split up your vectors into different buckets, and only searched a subset of them, it would yield a poor approximation. The IVF algorithm uses a more elegant approach. First, before indexing begins, it assigns each bucket a representative vector. When a vector is indexed, it gets added to the bucket that has the closest representative vector. This way, vectors that are closer to each other are placed roughly in the same or nearby buckets.

Vector similarity metrics

All search engines use a similarity metric to rank and sort results and bring the most relevant results to the top. When you use a plain text query, the similarity metric is called TF-IDF, which measures the importance of the terms in the query and generates a score based on the number of textual matches. When your query includes a vector, the similarity metrics are spatial in nature, taking advantage of proximity in the vector space. OpenSearch supports several similarity or distance measures:

  • Euclidean distance – The straight-line distance between points.
  • L1 (Manhattan) distance – The sum of the differences of all of the vector components. L1 distance measures how many orthogonal city blocks you need to traverse from point A to point B.
  • L-infinity (chessboard) distance – The number of moves a King would make on an n-dimensional chessboard. It’s different than Euclidean distance on the diagonals—a diagonal step on a 2-dimensional chessboard is 1.41 Euclidean units away, but 2 L-infinity units away.
  • Inner product – The product of the magnitudes of two vectors and the cosine of the angle between them. Usually used for natural language processing (NLP) vector similarity.
  • Cosine similarity – The cosine of the angle between two vectors in a vector space.
  • Hamming distance – For binary-coded vectors, the number of bits that differ between the two vectors.

Advantage of OpenSearch as a vector database

When you use OpenSearch Service as a vector database, you can take advantage of the service’s features like usability, scalability, availability, interoperability, and security. More importantly, you can use OpenSearch’s search features to enhance the search experience. For example, you can use Learning to Rank in OpenSearch to integrate user clickthrough behavior data into your search application and improve search relevance. You can also combine OpenSearch text search and vector search capabilities to search documents with keyword and semantic similarity. You can also use other fields in the index to filter documents to improve relevance. For advanced users, you can use a hybrid scoring model to combine OpenSearch’s text-based relevance score, computed with the Okapi BM25 function and its vector search score to improve the ranking of your search results.

Scale and limits

OpenSearch as vector database support billions of vector records. Keep in mind the following calculator regarding number of vectors and dimensions to size your cluster.

Number of vectors

OpenSearch VectorDB takes advantage of the sharding capabilities of OpenSearch and can scale to billions of vectors at single-digit millisecond latencies by sharding vectors and scale horizontally by adding more nodes. The number of vectors that can fit in a single machine is a function of the off-heap memory availability on the machine. The number of nodes required will depend on the amount of memory that can be used for the algorithm per node and the total amount of memory required by the algorithm. The more nodes, the more memory and better performance. The amount of memory available per node is computed as memory_available = (node_memoryjvm_size) * circuit_breaker_limit, with the following parameters:

  • node_memory – The total memory of the instance.
  • jvm_size – The OpenSearch JVM heap size. This is set to half of the instance’s RAM, capped at approximately 32 GB.
  • circuit_breaker_limit – The native memory usage threshold for the circuit breaker. This is set to 0.5.

Total cluster memory estimation depends on total number of vector records and algorithms. HNSW and IVF have different memory requirements. You can refer to Memory Estimation for more details.

Number of dimensions

OpenSearch’s current dimension limit for the vector field knn_vector is 16,000 dimensions. Each dimension is represented as a 32-bit float. The more dimensions, the more memory you’ll need to index and search. The number of dimensions is usually determined by the embedding models that translate the entity to a vector. There are a lot of options to choose from when building your knn_vector field. To determine the correct methods and parameters to choose, refer to Choosing the right method.

Customer stories:

Amazon Music

Amazon Music is always innovating to provide customers with unique and personalized experiences. One of Amazon Music’s approaches to music recommendations is a remix of a classic Amazon innovation, item-to-item collaborative filtering, and vector databases. Using data aggregated based on user listening behavior, Amazon Music has created an embedding model that encodes music tracks and customer representations into a vector space where neighboring vectors represent tracks that are similar. 100 million songs are encoded into vectors, indexed into OpenSearch, and served across multiple geographies to power real-time recommendations. OpenSearch currently manages 1.05 billion vectors and supports a peak load of 7,100 vector queries per second to power Amazon Music recommendations.

The item-to-item collaborative filter continues to be among the most popular methods for online product recommendations because of its effectiveness at scaling to large customer bases and product catalogs. OpenSearch makes it easier to operationalize and further the scalability of the recommender by providing scale-out infrastructure and k-NN indexes that grow linearly with respect to the number of tracks and similarity search in logarithmic time.

The following figure visualizes the high-dimensional space created by the vector embedding.

A visualization of the vector encoding of Amazon Music entries in the large vector space

Brand protection at Amazon

Amazon strives to deliver the world’s most trustworthy shopping experience, offering customers the widest possible selection of authentic products. To earn and maintain our customers’ trust, we strictly prohibit the sale of counterfeit products, and we continue to invest in innovations that ensure only authentic products reach our customers. Amazon’s brand protection programs build trust with brands by accurately representing and completely protecting their brand. We strive to ensure that public perception mirrors the trustworthy experience we deliver. Our brand protection strategy focuses on four pillars: (1) Proactive Controls (2) Powerful Tools to Protect Brands (3) Holding Bad Actors Accountable (4) Protecting and Educating Customers. Amazon OpenSearch Service is a key part of Amazon’s Proactive Controls.

In 2022, Amazon’s automated technology scanned more than 8 billion attempted changes daily to product detail pages for signs of potential abuse. Our proactive controls found more than 99% of blocked or removed listings before a brand ever had to find and report it. These listings were suspected of being fraudulent, infringing, counterfeit, or at risk of other forms of abuse. To perform these scans, Amazon created tooling that uses advanced and innovative techniques, including the use of advanced machine learning models to automate the detection of intellectual property infringements in listings across Amazon’s stores globally. A key technical challenge in implementing such automated system is the ability to search for protected intellectual property within a vast billion-vector corpus in a fast, scalable and cost effective manner. Leveraging Amazon OpenSearch Service’s scalable vector database capabilities and distributed architecture, we successfully developed an ingestion pipeline that has indexed a total of 68 billion, 128- and 1024-dimension vectors into OpenSearch Service to enable brands and automated systems to conduct infringement detection, in real-time, through a highly available and fast (sub-second) search API.

Conclusion

Whether you’re building a generative AI solution, searching rich media and audio, or bringing more semantic search to your existing search-based application, OpenSearch is a capable vector database. OpenSearch supports a variety of engines, algorithms, and distance measures that you can employ to build the right solution. OpenSearch provides a scalable engine that can support vector search at low latency and up to billions of vectors. With OpenSearch and its vector DB capabilities, your users can find that 8-foot-blue couch easily, and relax by a cozy fire.


About the Authors

Jon Handler is a Senior Principal Solutions Architect with AWSJon Handler is a Senior Principal Solutions Architect at Amazon Web Services based in Palo Alto, CA. Jon works closely with OpenSearch and Amazon OpenSearch Service, providing help and guidance to a broad range of customers who have search and log analytics workloads that they want to move to the AWS Cloud. Prior to joining AWS, Jon’s career as a software developer included four years of coding a large-scale, eCommerce search engine. Jon holds a Bachelor of the Arts from the University of Pennsylvania, and a Master of Science and a Ph. D. in Computer Science and Artificial Intelligence from Northwestern University.

Jianwei Li is a Principal Analytics Specialist TAM at Amazon Web Services. Jianwei provides consultant service for customers to help customer design and build modern data platform. Jianwei has been working in big data domain as software developer, consultant and tech leader.

Dylan Tong is a Senior Product Manager at AWS. He works with customers to help drive their success on the AWS platform through thought leadership and guidance on designing well architected solutions. He has spent most of his career building on his expertise in data management and analytics by working for leaders and innovators in the space.

Vamshi Vijay Nakkirtha is a Software Engineering Manager working on the OpenSearch Project and Amazon OpenSearch Service. His primary interests include distributed systems. He is an active contributor to various plugins, like k-NN, GeoSpatial, and dashboard-maps.

Ingest, transform, and deliver events published by Amazon Security Lake to Amazon OpenSearch Service

Post Syndicated from Kevin Fallis original https://aws.amazon.com/blogs/big-data/ingest-transform-and-deliver-events-published-by-amazon-security-lake-to-amazon-opensearch-service/

With the recent introduction of Amazon Security Lake, it has never been simpler to access all your security-related data in one place. Whether it’s findings from AWS Security Hub, DNS query data from Amazon Route 53, network events such as VPC Flow Logs, or third-party integrations provided by partners such as Barracuda Email Protection, Cisco Firepower Management Center, or Okta identity logs, you now have a centralized environment in which you can correlate events and findings using a broad range of tools in the AWS and partner ecosystem.

Security Lake automatically centralizes security data from cloud, on-premises, and custom sources into a purpose-built data lake stored in your account. With Security Lake, you can get a more complete understanding of your security data across your entire organization. You can also improve the protection of your workloads, applications, and data. Security Lake has adopted the Open Cybersecurity Schema Framework (OCSF), an open standard. With OCSF support, the service can normalize and combine security data from AWS and a broad range of enterprise security data sources.

When it comes to near-real-time analysis of data as it arrives in Security Lake and responding to security events your company cares about, Amazon OpenSearch Service provides the necessary tooling to help you make sense of the data found in Security Lake.

OpenSearch Service is a fully managed and scalable log analytics framework that is used by customers to ingest, store, and visualize data. Customers use OpenSearch Service for a diverse set of data workloads, including healthcare data, financial transactions information, application performance data, observability data, and much more. Additionally, customers use the managed service for its ingest performance, scalability, low query latency, and ability to analyze large datasets.

This post shows you how to ingest, transform, and deliver Security Lake data to OpenSearch Service for use by your SecOps teams. We also walk you through how to use a series of prebuilt visualizations to view events across multiple AWS data sources provided by Security Lake.

Understanding the event data found in Security Lake

Security Lake stores the normalized OCSF security events in Apache Parquet format—an optimized columnar data storage format with efficient data compression and enhanced performance to handle complex data in bulk. Parquet format is a foundational format in the Apache Hadoop ecosystem and is integrated into AWS services such as Amazon Redshift Spectrum, AWS Glue, Amazon Athena, and Amazon EMR. It’s a portable columnar format, future proofed to support additional encodings as technology develops, and it has library support across a broad set of languages like Python, Java, and Go. And the best part is that Apache Parquet is open source!

The intent of OCSF is to provide a common language for data scientists and analysts that work with threat detection and investigation. With a diverse set of sources, you can build a complete view of your security posture on AWS using Security Lake and OpenSearch Service.

Understanding the event architecture for Security Lake

Security Lake provides a subscriber framework to provide access to the data stored in Amazon S3. Services such as Amazon Athena and Amazon SageMaker use query access. The solution, in this post, uses data access to respond to events generated by Security Lake.

When you subscribe for data access, events arrive via Amazon Simple Queue Service (Amazon SQS). Each SQS event contains a notification object that has a “pointer” via data used to create a URL to the Parquet object on Amazon S3. Your subscriber processes the event, parses the data found in the object, and transforms it to whatever format makes sense for your implementation.

The solution we provide in this post uses a subscriber for data access. Let’s drill down into what the implementation looks like so that you understand how it works.

Solution overview

The high-level architecture for integrating Security Lake with OpenSearch Service is as follows.

The workflow contains the following steps:

  1. Security Lake persists Parquet formatted data into an S3 bucket as determined by the administrator of Security Lake.
  2. A notification is placed in Amazon SQS that describes the key to get access to the object.
  3. Java code in an AWS Lambda function reads the SQS notification and prepares to read the object described in the notification.
  4. Java code uses Hadoop, Parquet, and Avro libraries to retrieve the object from Amazon S3 and transform the records in the Parquet object into JSON documents for indexing in your OpenSearch Service domain.
  5. The documents are gathered and then sent to your OpenSearch Service domain, where index templates map the structure into a schema optimized for Security Lake logs in OCSF format.

Steps 1–2 are managed by Security Lake; steps 3–5 are managed by the customer. The shaded components are your responsibility. The subscriber implementation for this solution uses Lambda and OpenSearch Service, and these resources are managed by you.

If you are evaluating this as solution for your business, remember that Lambda has a 15-minute maximum execution time at the time of this writing. Security Lake can produce up to 256MB object sizes and this solution may not be effective for your company’s needs at large scale. Various levers in Lambda have impacts on the cost of the solution for log delivery. Make cost conscious decisions when evaluating sample solutions. This implementation using Lambda is suitable for smaller companies where to volume of logs for CloudTrail and VPC flow logs are more suitable for a Lambda based approach where the cost to transform and deliver logs to Amazon OpenSearch Service are more budget friendly.

Now that you have some context, let’s start building the implementation for OpenSearch Service!

Prerequisites

Creation of Security Lake for your AWS accounts is a prerequisite for building this solution. Security Lake integrates with an AWS Organizations account to enable the offering for selected accounts in the organization. For a single AWS account that doesn’t use Organizations, you can enable Security Lake without the need for Organizations. You must have administrative access to perform these operations. For multiple accounts, it’s suggested that you delegate the Security Lake activities to another account in your organization. For more information about enabling Security Lake in your accounts, review Getting started.

Additionally, you may need to take the provided template and adjust it to your specific environment. The sample solution relies on access to a public S3 bucket hosted for this blog so egress rules and permissions modifications may be required if you use S3 endpoints.

This solution assumes that you’re using a domain deployed in a VPC. Additionally, it assumes that you have fine-grained access controls enabled on the domain to prevent unauthorized access to data you store as part of the integration with Security Lake. VPC-deployed domains are privately routable and have no access to the public internet by design. If you want to access your domain in a more public setting, you need to create a NGINX proxy to broker a request between public and private settings.

The remaining sections in this post are focused on how to create the integration with OpenSearch Service.

Create the subscriber

To create your subscriber, complete the following steps:

  1. On the Security Lake console, choose Subscribers in the navigation pane.
  2. Choose Create subscriber.
  3. Under Subscriber details, enter a meaningful name and description.
  4. Under Log and event sources, specify what the subscriber is authorized to ingest. For this post, we select All log and event sources.
  5. For Data access method, select S3.
  6. Under Subscriber credentials, provide the account ID and an external ID for which AWS account you want to provide access.
  7. For Notification details, select SQS queue.
  8. Choose Create when you are finished filling in the form.

It will take a minute or so to initialize the subscriber framework, such as the SQS integration and the permission generated so that you can access the data from another AWS account. When the status changes from Creating to Created, you have access to the subscriber endpoint on Amazon SQS.

  1. Save the following values found in the subscriber Details section:
    1. AWS role ID
    2. External ID
    3. Subscription endpoint

Use AWS CloudFormation to provision Lambda integration between the two services

An AWS CloudFormation template takes care of a large portion of the setup for the integration. It creates the necessary components to read the data from Security Lake, transform it into JSON, and then index it into your OpenSearch Service domain. The template also provides the necessary AWS Identity and Access Management (IAM) roles for integration, the tooling to create an S3 bucket for the Java JAR file used in the solution by Lambda, and a small Amazon Elastic Compute Cloud (Amazon EC2) instance to facilitate the provisioning of templates in your OpenSearch Service domain.

To deploy your resources, complete the following steps:

  1. On the AWS CloudFormation console, create a new stack.
  2. For Prepare template, select Template is ready.
  3. Specify your template source as Amazon S3 URL.

You can either save the template to your local drive or copy the link for use on the AWS CloudFormation console. In this example, we use the template URL that points to a template stored on Amazon S3. You can either use the URL on Amazon S3 or install it from your device.

  1. Choose Next.
  2. Enter a name for your stack. For this post, we name the stack blog-lambda. Start populating your parameters based on the values you copied from Security Lake and OpenSearch Service. Ensure that the endpoint for the OpenSearch domain has a forward slash / at the end of the URL that you copy from OpenSearch Service.
  3. Populate the parameters with values you have saved or copied from OpenSearch Service and Security Lake, then choose Next.
  4. Select Preserve successfully provisioned resources to preserve the resources in case the stack roles back so you can debug the issues.
  5. Scroll to bottom of page and choose Next.
  6. On the summary page, select the check box that acknowledges IAM resources will be created and used in this template.
  7. Choose Submit.

The stack will take a few minutes to deploy.

  1. After the stack has deployed, navigate to the Outputs tab for the stack you created.
  2. Save the CommandProxyInstanceID for executing scripts and save the two role ARNs to use in the role mappings step.

You need to associate the IAM roles for the tooling instance and the Lambda function with OpenSearch Service security roles so that the processes can work with the cluster and the resources within.

Provision role mappings for integrations with OpenSearch Service

With the template-generated IAM roles, you need to map the roles using role mapping to the predefined all_access role in your OpenSearch Service cluster. You should evaluate your specific use of any roles and ensure they are aligned with your company’s requirements.

  1. In OpenSearch Dashboards, choose Security in the navigation pane.
  2. Choose Roles in the navigation pane and look up the all_access role.
  3. On the role details page, on the Mapped users tab, choose Manage mapping.
  4. Add the two IAM roles found in the outputs of the CloudFormation template, then choose Map.

Provision the index templates used for OCSF format in OpenSearch Service

Index templates have been provided as part of the initial setup. These templates are crucial to the format of the data so that ingestion is efficient and tuned for aggregations and visualizations. Data that comes from Security Lake is transformed into a JSON format, and this format is based directly on the OCSF standard.

For example, each OCSF category has a common Base Event class that contains multiple objects that represent details like the cloud provider in a Cloud object, enrichment data using an Enrichment object that has a common structure across events but can have different values based on the event, and even more complex structures that have inner objects, which themselves have more inner objects such as the Metadata object, still part of the Base Event class. The Base Event class is the foundation for all categories in OCSF and helps you with the effort of correlating events written into Security Lake and analyzed in OpenSearch.

OpenSearch is technically schema-less. You don’t have to define a schema up front. The OpenSearch engine will try to guess the data types and the mappings found in the data coming from Security Lake. This is known as dynamic mapping. The OpenSearch engine also provides you with the option to predefine the data you are indexing. This is known as explicit mapping. Using explicit mappings to identifying your data source types and how they are stored at time of ingestion is key to getting high volume ingest performance for time-centric data indexed at heavy load.

In summary, the mapping templates use composable templates. In this construct, the solution establishes an efficient schema for the OCSF standard and gives you the capability to correlate events and specialize on specific categories in the OCSF standard.

You load the templates using the tools proxy created by your CloudFormation template.

  1. On the stack’s Outputs tab, find the parameter CommandProxyInstanceID.

We use that value to find the instance in AWS Systems Manager.

  1. On the Systems Manager console, choose Fleet manager in the navigation pane.
  2. Locate and select your managed node.
  3. On the Node actions menu, choose Start terminal session.
  4. When you’re connected to the instance, run the following commands:
    cd;pwd
    . /usr/share/es-scripts/es-commands.sh | grep -o '{\"acknowledged\":true}' | wc -l

You should see a final result of 42 occurrences of {“acknowledged”:true}, which demonstrates the commands being sent were successful. Ignore the warnings you see for migration. The warnings don’t affect the scripts and as of this writing can’t be muted.

  1. Navigate to Dev Tools in OpenSearch Dashboards and run the following command:
    GET _cat/templates

This confirms that the scripts were successful.

Install index patterns, visualizations, and dashboards for the solution

For this solution, we prepackaged a few visualizations so that you can make sense of your data. Download the visualizations to your local desktop, then complete the following steps:

  1. In OpenSearch Dashboards, navigate to Stack Management and Saved Objects.
  2. Choose Import.
  3. Choose the file from your local device, select your import options, and choose Import.

You will see numerous objects that you imported. You can use the visualizations after you start importing data.

Enable the Lambda function to start processing events into OpenSearch Service

The final step is to go into the configuration of the Lambda function and enable the triggers so that the data can be read from the subscriber framework in Security Lake. The trigger is currently disabled; you need to enable it and save the config. You will notice the function is throttled, which is by design. You need to have templates in the OpenSearch cluster so that the data indexes in the desired format.

  1. On the Lambda console, navigate to your function.
  2. On the Configurations tab, in the Triggers section, select your SQS trigger and choose Edit.
  3. Select Activate trigger and save the setting.
  4. Choose Edit concurrency.
  5. Configure your concurrency and choose Save.

Enable the function by setting the concurrency setting to 1. You can adjust the setting as needed for your environment.

You can review the Amazon CloudWatch logs on the CloudWatch console to confirm the function is working.

You should see startup messages and other event information that indicates logs are being processed. The provided JAR file is set for information level logging and if needed, to debug any concerns, there is a verbose debug version of the JAR file you can use. Your JAR file options are:

If you choose to deploy the debug version, the verbosity of the code will show some error-level details in the Hadoop libraries. To be clear, Hadoop code will display lots of exceptions in debug mode because it tests environment settings and looks for things that aren’t provisioned in your Lambda environment, like a Hadoop metrics collector. Most of these startup errors are not fatal and can be ignored.

Visualize the data

Now that you have data flowing into OpenSearch Service from Security Lake via Lambda, it’s time to put those imported visualizations to work. In OpenSearch Dashboards, navigate to the Dashboards page.

You will see four primary dashboards aligned around the OCSF category for which they support. The four supported visualization categories are for DNS activity, security findings, network activity, and AWS CloudTrail using the Cloud API.

Security findings

The findings dashboard is a series of high-level summary information that you use for visual inspection of AWS Security Hub findings in a time window specified by you in the dashboard filters. Many of the encapsulated visualizations give “filter on click” capabilities so you can narrow your discoveries. The following screenshot shows an example.

The Finding Velocity visualization shows findings over time based on severity. The Finding Severity visualization shows which “findings” have passed or failed, and the Findings table visualization is a tabular view with actual counts. Your goal is to be near zero in all the categories except informational findings.

Network activity

The network traffic dashboard provides an overview for all your accounts in the organization that are enabled for Security Lake. The following example is monitoring 260 AWS accounts, and this dashboard summarizes the top accounts with network activities. Aggregate traffic, top accounts generating traffic and top accounts with the most activity are found in the first section of the visualizations.

Additionally, the top accounts are summarized by allow and deny actions for connections. In the visualization below, there are fields that you can drill down into other visualizations. Some of these visualizations have links to third party website that may or may not be allowed in your company. You can edit the links in the Saved objects in the Stack Management plugin.

For drill downs, you can drill down by choosing the account ID to get a summary by account. The list of egress and ingress traffic within a single AWS account is sorted by the volume of bytes transferred between any given two IP addresses.

Finally, if you choose the IP addresses, you’ll be redirected to Project Honey Pot, where you can see if the IP address is a threat or not.

DNS activity

The DNS activity dashboard shows you the requestors for DNS queries in your AWS accounts. Again, this is a summary view of all the events in a time window.

The first visualization in the dashboard shows DNS activity in aggregate across the top five active accounts. Of the 260 accounts in this example, four are active. The next visualization breaks the resolves down by the requesting service or host, and the final visualization breaks out the requestors by account, VPC ID, and instance ID for those queries run by your solutions.

API Activity

The final dashboard gives an overview of API activity via CloudTrail across all your accounts. It summarizes things like API call velocity, operations by service, top operations, and other summary information.

If we look at the first visualization in the dashboard, you get an idea of which services are receiving the most requests. You sometimes need to understand where to focus the majority of your threat discovery efforts based on which services may be consumed differently over time. Next, there are heat maps that break down API activity by region and service and you get an idea of what type of API calls are most prevalent in your accounts you are monitoring.

As you scroll down on the form, more details present themselves such as top five services with API activity and the top API operations for the organization you are monitoring.

Conclusion

Security Lake integration with OpenSearch Service is easy to achieve by following the steps outlined in this post. Security Lake data is transformed from Parquet to JSON, making it readable and simple to query. Enable your SecOps teams to identify and investigate potential security threats by analyzing Security Lake data in OpenSearch Service. The provided visualizations and dashboards can help to navigate the data, identify trends and rapidly detect any potential security issues in your organization.

As next steps, we recommend to use the above framework and associated templates that provide you with easy steps to visualize your Security Lake data using OpenSearch Service.

In a series of follow-up posts, we will review the source code and walkthrough published examples of the Lambda ingestion framework in the AWS Samples GitHub repo. The framework can be modified for use in containers to help address companies that have longer processing times for large files published in Security Lake. Additionally, we will discuss how to detect and respond to security events using example implementations that use OpenSearch plugins such as Security Analytics, Alerting, and the Anomaly Detection available in Amazon OpenSearch Service.


About the authors

Kevin Fallis (@AWSCodeWarrior) is an Principal AWS Specialist Search Solutions Architect. His passion at AWS is to help customers leverage the correct mix of AWS services to achieve success for their business goals. His after-work activities include family, DIY projects, carpentry, playing drums, and all things music.

Jimish Shah is a Senior Product Manager at AWS with 15+ years of experience bringing products to market in log analytics, cybersecurity, and IP video streaming. He’s passionate about launching products that offer delightful customer experiences, and solve complex customer problems. In his free time, he enjoys exploring cafes, hiking, and taking long walks

Ross Warren is a Senior Product SA at AWS for Amazon Security Lake based in Northern Virginia. Prior to his work at AWS, Ross’ areas of focus included cyber threat hunting and security operations. When he is not talking about AWS he likes to spend time with his family, bake bread, make sawdust and enjoy time outside.

Improved resiliency with backpressure and admission control for Amazon OpenSearch Service

Post Syndicated from Ketan Verma original https://aws.amazon.com/blogs/big-data/improved-resiliency-with-backpressure-and-admission-control-for-amazon-opensearch-service/

Amazon OpenSearch Service is a managed service that makes it simple to secure, deploy, and operate OpenSearch clusters at scale in the AWS Cloud. Last year, we introduced Shard Indexing Backpressure and admission control, which monitors cluster resources and incoming traffic to selectively reject requests that would otherwise pose stability risks like out of memory and impact cluster performance due to memory contentions, CPU saturation and GC overhead, and more.

We are now excited to introduce Search Backpressure and CPU-based admission control for OpenSearch Service, which further enhances the resiliency of clusters. These improvements are available for all OpenSearch versions 1.3 or higher.

Search Backpressure

Backpressure prevents a system from being overwhelmed with work. It does so by controlling the traffic rate or by shedding excessive load in order to prevent crashes and data loss, improve performance, and avoid total failure of the system.

Search Backpressure is a mechanism to identify and cancel in-flight resource-intensive search requests when a node is under duress. It’s effective against search workloads with anomalously high resource usage (such as complex queries, slow queries, many hits, or heavy aggregations), which could otherwise cause node crashes and impact the cluster’s health.

Search Backpressure is built on top of the task resource tracking framework, which provides an easy-to-use API to monitor each task’s resource usage. Search Backpressure uses a background thread that periodically measures the node’s resource usage and assigns a cancellation score to each in-flight search task based on factors like CPU time, heap allocations, and elapsed time. A higher cancellation score corresponds to a more resource-intensive search request. Search requests are cancelled in descending order of their cancellation score to recover nodes quickly, but the number of cancellations is rate-limited to avoid wasteful work.

The following diagram illustrates the Search Backpressure workflow.

Search requests return an HTTP 429 “Too Many Requests” status code upon cancellation. OpenSearch returns partial results if only some shards fail and partial results are allowed. See the following code:

{
    "error": {
        "root_cause": [
            {
                "type": "task_cancelled_exception",
                "reason": "cancelled task with reason: heap usage exceeded [403mb >= 77.6mb], elapsed time exceeded [1.7m >= 45s]"
            }
        ],
        "type": "search_phase_execution_exception",
        "reason": "SearchTask was cancelled",
        "phase": "fetch",
        "grouped": true,
        "failed_shards": [
            {
                "shard": 0,
                "index": "nyc_taxis",
                "node": "9gB3PDp6Speu61KvOheDXA",
                "reason": {
                    "type": "task_cancelled_exception",
                    "reason": "cancelled task with reason: heap usage exceeded [403mb >= 77.6mb], elapsed time exceeded [1.7m >= 45s]"
                }
            }
        ],
        "caused_by": {
            "type": "task_cancelled_exception",
            "reason": "cancelled task with reason: heap usage exceeded [403mb >= 77.6mb], elapsed time exceeded [1.7m >= 45s]"
        }
    },
    "status": 429
}

Monitoring Search Backpressure

You can monitor the detailed Search Backpressure state using the node stats API:

curl -X GET "https://{endpoint}/_nodes/stats/search_backpressure"

You can also view the cluster-wide summary of cancellations using Amazon CloudWatch. The following metrics are now available in the ES/OpenSearchService namespace:

  • SearchTaskCancelled – The number of coordinator node cancellations
  • SearchShardTaskCancelled – The number of data node cancellations

The following screenshot shows an example of tracking these metrics on the CloudWatch console.

CPU-based admission control

Admission control is a gatekeeping mechanism that proactively limits the number of requests to a node based on its current capacity, both for organic increases and spikes in traffic.

In addition to the JVM memory pressure and request size thresholds, it now also monitors each node’s rolling average CPU usage to reject incoming _search and _bulk requests. It prevents nodes from being overwhelmed with too many requests leading to hot spots, performance problems, request timeouts, and other cascading failures. Excessive requests return an HTTP 429 “Too Many Requests” status code upon rejection.

Handling HTTP 429 errors

You’ll receive HTTP 429 errors if you send excessive traffic to a node. It indicates either insufficient cluster resources, resource-intensive search requests, or an unintended spike in the workload.

Search Backpressure provides the reason for rejection, which can help fine-tune resource-intensive search requests. For traffic spikes, we recommend client-side retries with exponential backoff and jitter.

You can also follow these troubleshooting guides to debug excessive rejections:

Conclusion

Search Backpressure is a reactive mechanism to shed excessive load, while admission control is a proactive mechanism to limit the number of requests to a node beyond its capacity. Both work in tandem to improve the overall resiliency of an OpenSearch cluster.

Search Backpressure is available in OpenSearch, and we are always looking for external contributions. You can refer to the RFC to get started.


About the authors

Ketan Verma is a Senior SDE working on Amazon OpenSearch Service. He is passionate about building large-scale distributed systems, improving performance, and simplifying complex ideas with simple abstractions. Outside work, he likes to read and improve his home barista skills.

Suresh N S is a Senior SDE working on Amazon OpenSearch Service. He is passionate towards solving problems in large scale distributed systems.

Pritkumar Ladani is an SDE-2 working on Amazon OpenSearch Service. He likes to contribute to open source software development, and is passionate about distributed systems. He is an amateur badminton player and enjoys trekking.

Bukhtawar Khan is a Principal Engineer working on Amazon OpenSearch Service. He is interested in building distributed and autonomous systems. He is a maintainer and an active contributor to OpenSearch.

Implement alerts in Amazon OpenSearch Service with PagerDuty

Post Syndicated from Manikanta Gona original https://aws.amazon.com/blogs/big-data/implement-alerts-in-amazon-opensearch-service-with-pagerduty/

In today’s fast-paced digital world, businesses rely heavily on their data to make informed decisions. This data is often stored and analyzed using various tools, such as Amazon OpenSearch Service, a powerful search and analytics service offered by AWS. OpenSearch Service provides real-time insights into your data to support use cases like interactive log analytics, real-time application monitoring, website search, and more. Analyzing logs can help businesses quickly identify and troubleshoot issues.

However, with the increasing amount of data, it can be challenging to monitor everything manually. Manual monitoring consumes a lot of resources and is hard to maintain as the application landscape changes. We need a sustainable and automated approach to monitor critical applications and infrastructure.

With automated alerting with a third-party service like PagerDuty, an incident management platform, combined with the robust and powerful alerting plugin provided by OpenSearch Service, businesses can proactively manage and respond to critical events. You can use this proactive alerting to monitor data patterns for existing data, monitor clusters, detect patterns, and more.

OpenSearch Dashboard provides an alerting plugin that you can use to set up various types of monitors and alerts. You can use the plugin to set up different monitors, including cluster health, an individual document, a custom query, or aggregated data. These monitors can be used to send alerts to users.

In this post, we demonstrate how to implement PagerDuty as the notification mechanism to get notified based on cluster health status. These notifications can be delivered via various channels, including email, SMS, or custom webhooks (like PagerDuty). The OpenSearch Service alerting plugin supports complex alert rules and provides a user interface to manage them.

Solution overview

PagerDuty is a cloud-based incident management platform that helps businesses handle their alerts and incidents in real time. PagerDuty works by consolidating alerts from various monitoring tools and routing them to the right team member, ensuring that issues are addressed promptly. Many businesses are using PagerDuty for real-time incident notifications via multiple channels, ensuring that the right team members are alerted quickly.

In this post, we describe how to set up PagerDuty and integrate it with an OpenSearch Service custom webhook for alert notifications when a threshold is met.

The following diagram illustrate OpenSearch Service running within an Amazon VPC using monitors and triggers to send a notification to the PagerDuty service using an Events API custom webhook

We need to set up a service and integration on PagerDuty to begin receiving incident notifications from OpenSearch Service. A service in PagerDuty represents an application, component, or team that we can trigger the notification against.

Prerequisites

Before you get started, create the following resources, if not already available:

Create a service on PagerDuty

To create a service on PagerDuty, complete the following steps:

  1. Log in to PagerDuty using your personal or enterprise account that is being used to enable the integration with OpenSearch Service.
  2. On the Services tab, choose New Service.
  3. Enter a name and optional description, then choose Next.

In the next step, we create or assign an escalation policy for the service. An escalation policy represents the order of responsibility for reacting to the issues detected on a service.

  1. If you already have an escalation policy defined within the organization or team, select Select an existing Escalation Policy and specify your policy. Otherwise, select Generate a new Escalation Policy, then choose Next.

In the next step, we can group the alerts based on time or content:

    • To group alerts together based on the alert content, select Content-Based grouping.
    • To group them based on a specific time duration, select Time-Based grouping.
    • Selecting the Intelligent grouping option will group the alerts intelligently based on content or time.
  1. Leave the defaults and choose Next.
  2. On the Integrations page, select the Events API V2 integration (this will be used for integration with OpenSearch Service) and choose Create Service.

If you don’t select the integration during this step, you can add it later.

  1. Take note of the integration key on the Integrations tab.

Create a notification channel on OpenSearch Service with a custom webhook

Custom webhooks provide the ability to send these notifications to third-party services like PagerDuty using a REST API. After we configure the notification channel, we can use it for other monitors beyond this use case and to detect data patterns that are stored within the cluster.

Complete the following steps to configure the notification channel:

  1. On the OpenSearch Dashboards page, choose Notifications under Amazon OpenSearch Plugins in the navigation pane.
  2. On the Channels tab, choose Create channel.
  3. Enter a name for the channel and an optional description.
  4. For Channel type, choose Custom webhook.
  5. For Method, choose POST.
  6. For Define endpoints by, select Custom attributes URL.
  1. For Host, enter events.PagerDuty.com.
  2. For Path, enter v2/enqueue.
  3. Under Webhook headers, choose Add header.
  4. Enter X-Routing-Key as the key and the integration key you obtained earlier as the value.
  5. Choose Create and ensure the channel is successfully created.

Configure OpenSearch Service alerts to send notifications to PagerDuty

We can monitor OpenSearch cluster health in two different ways:

  • Using the OpenSearch Dashboard alerting plugin by setting up a per cluster metrics monitor. This provides a query to retrieve metrics related to the cluster health.
  • Integrating with Amazon CloudWatch, a monitoring and observability service.

In this use case, we use the alerting plugin. Complete the following steps:

  1. On the OpenSearch Dashboards page, choose Alerting under Amazon OpenSearch Plugins in the navigation pane.
  2. On the Monitors tab, choose Create monitor.
  3. For Monitor name, enter a name (for example, Monitor Cluster Health).
  4. For Monitor type, select Per cluster metrics monitor.
  5. Under Schedule¸ configure the monitor to run every minute.
  6. In the Query section, for Request type, choose Cluster health.
  7. Choose Preview query.
  8. Create a trigger by choosing Add trigger.
  9. For Trigger name, enter a name (for example, Cluster Health Status is Red).
  10. Leave Severity level at 1 (Highest).
  11. Under Trigger condition, delete the default code and enter the following:
ctx.results[0].status == "red"
  1. Choose Preview condition response to confirm that Trigger condition response shows as false, indicating that the cluster is healthy.
  2. Under Actions, choose Add action.
  3. For Action name, enter a name (for example, Send a PagerDuty notification).
  4. For Channels, choose the channel you created earlier.
  5. For Message, enter the following code:
{ "event_action": "trigger",
"payload" :
	{	"summary": "{{ctx.trigger.name}}",
		"source": " {{ctx.monitor.name}}",
		"severity": "critical",
		"custom_details":
			{ 
				"-Severity" : "{{ctx.trigger.severity}}",
				"-Period start" : "{{ctx.periodStart}}",
				"-Period end": "{{ctx.periodEnd}}"
			}
	}
}

Note that apart from the custom_details section in the code, the rest of the fields are mandatory for PagerDuty.

  1. Choose Send test message and test to make sure you receive an alert on the PagerDuty service.
  2. Choose Create and ensure the monitor was created successfully.

A notification will be sent to the PagerDuty service as part of the test, which will trigger a notification via a phone call or text message for the person who is available based on the escalation policy defined earlier. This notification can be safely acknowledged and resolved from PagerDuty because this is was a test.

Clean up

To clean up the infrastructure and avoid additional charges, complete the following steps:

  1. Delete the PagerDuty service.
  2. Delete the OpenSearch Service domain that was created as part of the prerequisites.

Conclusion

The integration of OpenSearch Service alerts with PagerDuty provides a powerful and efficient solution for managing and responding to critical events in real time. With this integration, you can easily set up alerts and notifications to stay informed about potential issues within your OpenSearch Service clusters or issues related to data and documents stored within the cluster, and proactively take action to resolve any problems that arise. Additionally, the integration allows for seamless collaboration between teams, enabling them to work together to identify and troubleshoot issues as they occur.

For more information about anomaly detection and alerts in OpenSearch Service, refer to Anomaly Detection in Amazon OpenSearch and Configuring Alerts in Amazon OpenSearch.


About the Authors

Manikanta Gona is a Data and ML Engineer at AWS Professional Services. He joined AWS in 2021 with 6+ years of experience in IT. At AWS, he is focused on Data Lake implementations, and Search, Analytical workloads using Amazon OpenSearch Service. In his spare time, he love to garden, and go on hikes and biking with his husband.

Vivek Shrivastava is a Principal Data Architect, Data Lake in AWS Professional Services. He is a Bigdata enthusiast and holds 14 AWS Certifications. He is passionate about helping customers build scalable and high-performance data analytics solutions in the cloud. In his spare time, he loves reading and finds areas for home automation

Ravikiran Rao is a Data Architect at AWS and is passionate about solving complex data challenges for various customers. Outside of work, he is a theatre enthusiast and an amateur tennis player.

Hari Krishna KC is a Data Architect with the AWS Professional Services Team. He specializes in AWS Data Lakes & AWS OpenSearch Service and have helped numerous client migrate their workload to Data Lakes and Search data stores

Configure Amazon OpenSearch Service for high availability

Post Syndicated from Rohin Bhargava original https://aws.amazon.com/blogs/big-data/configure-amazon-opensearch-service-for-high-availability/

Amazon OpenSearch Service is a fully open-source search and analytics engine that securely unlocks real-time search, monitoring, and analysis of business and operational data for use cases like recommendation engines, ecommerce sites, and catalog search. To be successful in your business, you need your systems to be highly available and performant, minimizing downtime and avoiding failure. When you use OpenSearch Service as your primary means of monitoring your infrastructure, you need to ensure its availability as well. Downtime for OpenSearch Service can have a significant effect on your business outcomes, such as loss of revenue, loss in productivity, loss in brand value, and more.

The industry standard for measuring availability is class of nines. OpenSearch Service provides 3 9’s of availability, when you follow best practices, which means it guarantees less than 43.83 minutes of downtime a month. In this post, you will learn how you can configure your OpenSearch Service domain for high availability and performance by following best practices and recommendations while setting up your domain.

There are two essential elements that influence your domain’s availability: the resource utilization of your domain, which is mostly driven by your workload, and external events such as infrastructure failures. Although the former can be controlled through continuous monitoring of the domain’s performance and health and scaling the domain accordingly, the latter cannot. To mitigate the impact of external events such as an Availability Zone outage, instance or disk failure, or networking issues on your domain, you must provision additional capacity, distributed over multiple Availability Zones, and keep multiple copies of data. Failure to do so may result in degraded performance, unavailability, and, in the worst-case situation, data loss.

Let’s look at the options available to you to ensure that domain is available and performant.

Cluster configuration

Under this section we will talk about various configuration options you have to setup your cluster properly which includes specifying the number of AZ for the deployment, setting up the master and data nodes, setting up indexes and shards.

Multi-AZ deployment

Data nodes are responsible for processing indexing and search requests in your domain. Deploying your data nodes across multiple Availability Zones improves the availability of your domain by adding redundant, per-zone data storage and processing. With a Multi-AZ deployment, your domain can remain available even when a full Availability Zone becomes unavailable. For production workloads, AWS recommends using three Availability Zones for your domain. Use two Availability Zones for Regions that support only two for improved availability. This ensures that your domain is available in the event of a Single-AZ failure.

Dedicated cluster manager (master nodes)

AWS recommends using three dedicated cluster manager (CM) nodes for all production workloads. CM nodes track the cluster’s health, the state and location of its indexes and shards, the mapping for all the indexes, and the availability of its data nodes, and it maintains a list of cluster-level tasks in process. Without dedicated CM nodes, the cluster uses data nodes, which makes the cluster vulnerable to workload demands. You should size CM nodes based on the size of the task—primarily, the data node counts, the index counts, and the shard counts. OpenSearch Service always deploys CM nodes across three Availability Zones, when supported by the Region (two in one Availability Zones and one in other Availability Zones if regions have only two Availability Zones). For a running domain, only one of the three CM nodes works as an elected leader. The other two CM nodes participate in an election if the elected CM node fails.

The following table shows AWS’s recommendations for CM sizing. CM nodes do work based on the number of nodes, indexes, shards, and mapping. The more work, the more compute and memory you need to hold and work with the cluster state.

Instance Count Cluster Manager Node RAM Size Maximum Supported Shard Count Recommended Minimum Dedicated Cluster Manager Instance Type
1–10 8 GiB 10,000 m5.large.search or m6g.large.search
11–30 16 GiB 30,000 c5.2xlarge.search or c6g.2xlarge.search
31–75 32 GiB 40,000 c5.4xlarge.search or c6g.4xlarge.search
76 – 125 64 GiB 75,000 r5.2xlarge.search or r6g.2xlarge.search
126 – 200 128 GiB 75,000 r5.4xlarge.search or r6g.4xlarge.search

Indexes and shards

Indexes are a logical construct that houses a collection of documents. You partition your index for parallel processing by specifying a primary shard count, where shards represent a physical unit for storing and processing data. In OpenSearch Service, a shard can be either a primary shard or a replica shard. You use replicas for durability—if the primary shard is lost, OpenSearch Service promotes one of the replicas to primary—and for improving search throughput. OpenSearch Service ensures that the primary and replica shards are placed in different nodes and across different Availability Zones, if deployed in more than one Availability Zone. For high availability, AWS recommends configuring at least two replicas for each index in a three-zone setup to avoid disruption in performance and availability. In a Multi-AZ setup, if a node fails or in the rare worst case an Availability Zone fails, you will still have a copy of the data.

Cluster monitoring and management

As discussed earlier, selecting your configuration based on best practices is only half the job. We also need to continuously monitor the resource utilization and performance to determine if the domain needs to be scaled. An under-provisioned or over-utilized domain can result in performance degradation and eventually unavailability.

CPU utilization

You use the CPU in your domain to run your workload. As a general rule, you should target 60% average CPU utilization for any data node, with peaks at 80%, and tolerate small spikes to 100%. When you consider availability, and especially considering the unavailability of a full zone, there are two scenarios. If you have two Availability Zones, then each zone handles 50% of the traffic. If a zone becomes unavailable, the other zone will take all of that traffic, doubling CPU utilization. In that case, you need to be at around 30–40% average CPU utilization in each zone to maintain availability. If you are running three Availability Zones, each zone is taking 33% of the traffic. If a zone becomes unavailable, each other zone will gain approximately 17% traffic. In this case, you should target 50–60% average CPU utilization.

Memory utilization

OpenSearch Service supports two types of garbage collection. The first is G1 garbage collection (G1GC), which is used by OpenSearch Service nodes, powered by AWS Graviton 2. The second is Concurrent Mark Sweep (CMS), which is used by all nodes powered by other processors. Out of all the memory allocated to a node, half of the memory (up to 32 GB) is assigned to the Java heap, and the rest of the memory is used by other operating system tasks, the file system cache, and so on. To maintain availability for a domain, we recommend keeping the max JVM utilization at around 80% in CMS and 95% in G1GC. Anything beyond that would impact the availability of your domain and make your cluster unhealthy. We also recommend enabling auto-tune, which actively monitors the memory utilization and triggers the garbage collector.

Storage utilization

OpenSearch Service publishes several guidelines for sizing of domains. We provide an empirical formula so that you can determine the right amount of storage required for your requirements. However, it’s important to keep an eye out for the depletion of storage with time and changes in workload characteristics. To ensure the domain doesn’t run out of storage and can continue to index data, you should configure Amazon CloudWatch alarms and monitor your free storage space.

AWS also recommends choosing a primary shard count so that each shard is within an optimal size band. You can determine the optimal shard size through proof-of-concept testing with your data and traffic. We use 10–30 GB primary shard sizes for search use cases and 45–50 GB primary shard sizes for log analytics use cases as a guideline. Because shards are the workers in your domain, they are directly responsible for the distribution of the workload across the data nodes. If your shards are too large, you may see stress in your Java heap from large aggregations, worse query performance, and worse performance on cluster-level tasks like shard rebalancing, snapshots, and hot-to-warm migrations. If your shards are too small, they can overwhelm the domain’s Java heap space, worsen query performance through excessive internal networking, and make cluster-level tasks slow. We also recommend keeping the number of shards per node proportional to the heap available (half of the instance’s RAM up to 32 GB)—25 shards per GB of Java heap. This makes a practical limit of 1,000 shards on any data node in your domain.

Conclusion

In this post, you learned various tips and tricks to set up a highly available domain using OpenSearch Service, which helps you to keep OpenSearch Service performant and available by running it across three Availability Zones.

Stay tuned for a series of posts focusing on the various features and functionalities with OpenSearch Service. If you have feedback about this post, submit it in the comments section. If you have questions about this post, start a new thread on the OpenSearch Service forum or contact AWS Support.


About the authors

Rohin Bhargava is a Sr. Product Manager with the Amazon OpenSearch Service team. His passion at AWS is to help customers find the correct mix of AWS services to achieve success for their business goals.

Prashant Agrawal is a Sr. Search Specialist Solutions Architect with Amazon OpenSearch Service. He works closely with customers to help them migrate their workloads to the cloud and helps existing customers fine-tune their clusters to achieve better performance and save on cost. Before joining AWS, he helped various customers use OpenSearch and Elasticsearch for their search and log analytics use cases. When not working, you can find him traveling and exploring new places. In short, he likes doing Eat → Travel → Repeat.
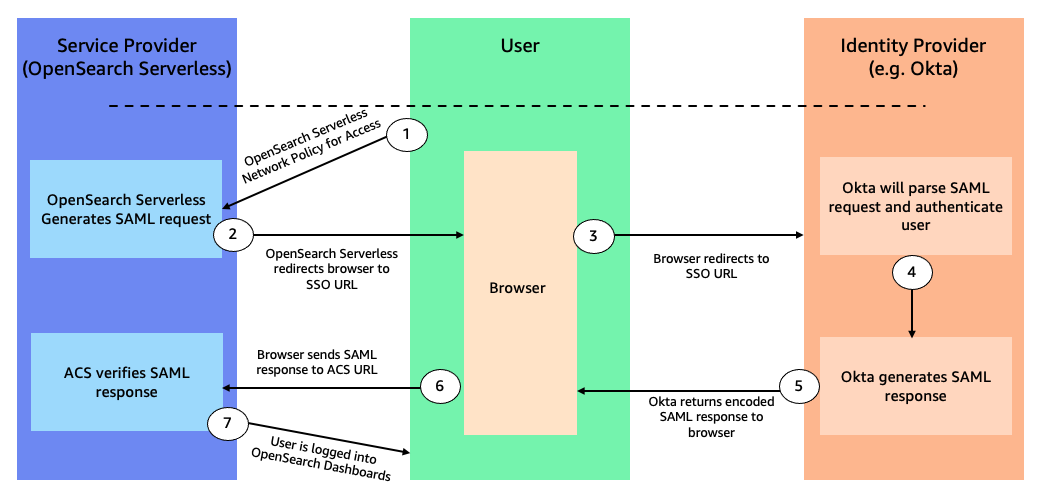
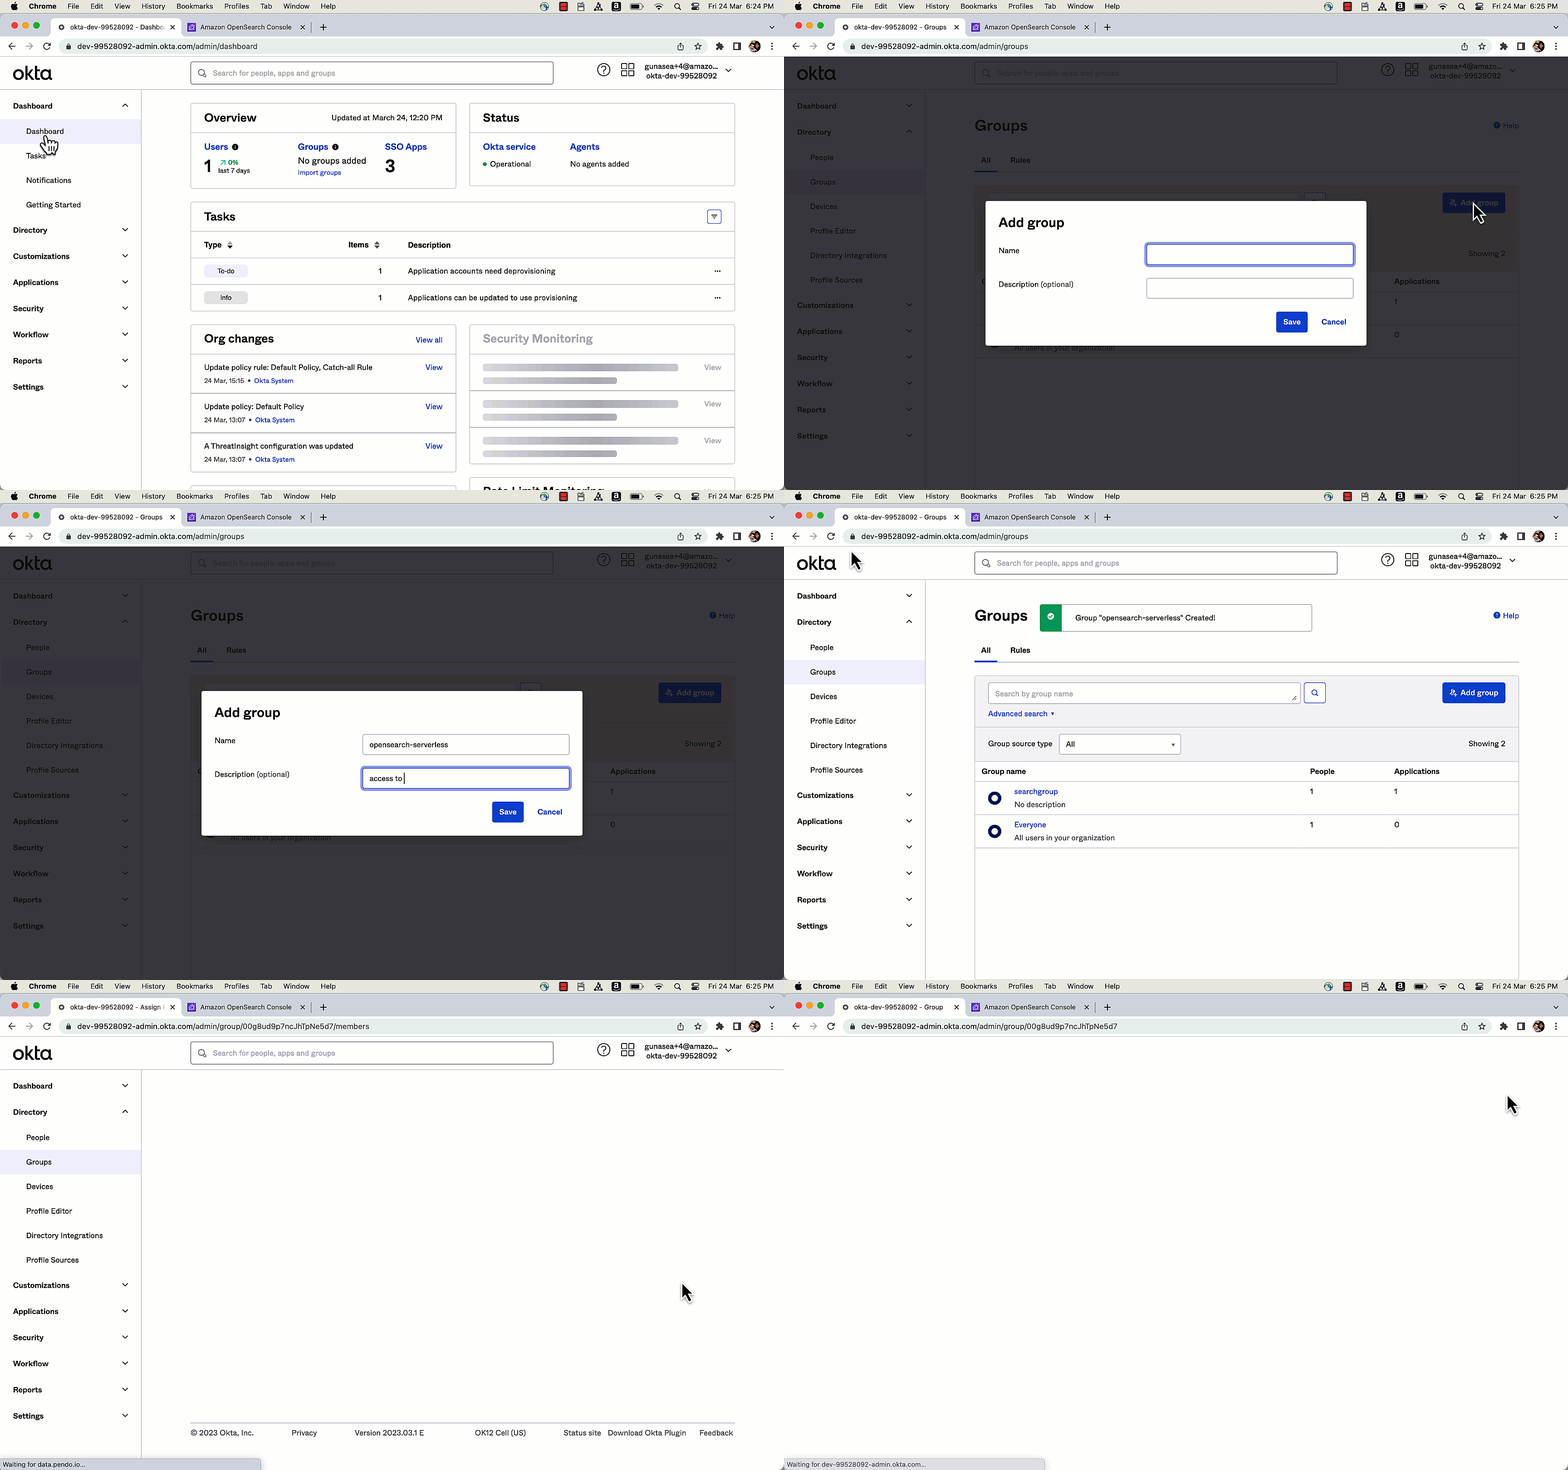
Amazon OpenSearch Service Under the Hood: Multi-AZ with standby

Post Syndicated from Rohin Bhargava original https://aws.amazon.com/blogs/big-data/amazon-opensearch-service-under-the-hood-multi-az-with-standby/

Amazon OpenSearch Service recently announced Multi-AZ with standby, a new deployment option for managed clusters that enables 99.99% availability and consistent performance for business-critical workloads. With Multi-AZ with standby, clusters are resilient to infrastructure failures like hardware or networking failure. This option provides improved reliability and the added benefit of simplifying cluster configuration and management by enforcing best practices and reducing complexity.

In this post, we share how Multi-AZ with standby works under the hood to achieve high resiliency and consistent performance to meet the four 9s.

Background

One of the principles in designing highly available systems is that they need to be ready for impairments before they happen. OpenSearch is a distributed system, which runs on a cluster of instances that have different roles. In OpenSearch Service, you can deploy data nodes to store your data and respond to indexing and search requests, you can also deploy dedicated cluster manager nodes to manage and orchestrate the cluster. To provide high availability, one common approach for the cloud is to deploy infrastructure across multiple AWS Availability Zones. Even in the rare case that a full zone becomes unavailable, the available zones continue to serve traffic with replicas.

When you use OpenSearch Service, you create indexes to hold your data and specify partitioning and replication for those indexes. Each index is comprised of a set of primary shards and zero to many replicas of those shards. When you additionally use the Multi-AZ feature, OpenSearch Service ensures that primary shards and replica shards are distributed so that they’re in different Availability Zones.

When there is an impairment in an Availability Zone, the service would scale up in other Availability Zones and redistribute shards to spread out the load evenly. This approach was reactive at best. Additionally, shard redistribution during failure events causes increased resource utilization, leading to increased latencies and overloaded nodes, further impacting availability and effectively defeating the purpose of fault-tolerant, multi-AZ clusters. A more effective, statically stable cluster configuration requires provisioning infrastructure to the point where it can continue operating correctly without having to launch any new capacity or redistribute any shards even if an Availability Zone becomes impaired.

Designing for high availability

OpenSearch Service manages tens of thousands of OpenSearch clusters. We’ve gained insights into which cluster configurations like hardware (data or cluster-manager instance types) or storage (EBS volume types), shard sizes, and so on are more resilient to failures and can meet the demands of common customer workloads. Some of these configurations have been included in Multi-AZ with standby to simplify configuring the clusters. However, this alone is not enough. A key ingredient in achieving high availability is maintaining data redundancy.

When you configure a single replica (two copies) for your indexes, the cluster can tolerate the loss of one shard (primary or replica) and still recover by copying the remaining shard. A two-replica (three copies) configuration can tolerate failure of two copies. In the case of a single replica with two copies, you can still sustain data loss. For example, you could lose data if there is a catastrophic failure in one Availability Zone for a prolonged duration, and at the same time, a node in a second zone fails. To ensure data redundancy at all times, the cluster enforces a minimum of two replicas (three copies) across all its indexes. The following diagram illustrates this architecture.

The Multi-AZ with standby feature deploys infrastructure in three Availability Zones, while keeping two zones as active and one zone as standby. The standby zone offers consistent performance even during zonal failures by ensuring same capacity at all times and by using a statically stable design without any capacity provisioning or data movements during failure. During normal operations, the active zone serves coordinator traffic for read and write requests and shard query traffic, and only replication traffic goes to the standby zone. OpenSearch uses synchronous replication protocol for write requests, which by design has zero replication lag, enabling the service to instantaneously promote a standby zone to active in the event of any failure in an active zone. This event is referred to as a zonal failover. The previously active zone is demoted to the standby mode and recovery operations to bring the state back to healthy begin.

Why zonal failover is critical but hard to do right

One or more nodes in an Availability Zone can fail due to a wide variety of reasons, like hardware failures, infrastructure failures like fiber cuts, power or thermal issues, or inter-zone or intra-zone networking problems. Read requests can be served by any of the active zones, whereas write requests need to be synchronously replicated to all copies across multiple Availability Zones. OpenSearch Service orchestrates two modes of failovers: read failovers and the write failovers.

The primarily goals of read failovers are high availability and consistent performance. This requires the system to constantly monitor for faults and shift traffic away from the unhealthy nodes in the impacted zone. The system takes care of handling the failovers gracefully, allowing all in-flight requests to finish while simultaneously shifting new incoming traffic to a healthy zone. However, it’s also possible for multiple shard copies across both active zones to be unavailable in cases of two node failures or one zone plus one node failure (often referred to as double faults), which poses a risk to availability. To solve this challenge, the system uses a fail-open mechanism to serve traffic off the third zone while it may still be in a standby mode to ensure the system remains highly available. The following diagram illustrates this architecture.

An impaired network device impacting inter-zone communication can cause write requests to significantly slow down, owing to the synchronous nature of replication. In such an event, the system orchestrates a write failover to isolate the impaired zone, cutting off all ingress and egress traffic. Although with write failovers the recovery is immediate, it results in all nodes along with its shards being taken offline. However, after the impacted zone is brought back after network recovery, shard recovery should still be able to use unchanged data from its local disk, avoiding full segment copy. Because the write failover results in the shard copy to be unavailable, we exercise write failovers with extreme caution, neither too frequently nor during transient failures.

The following graph depicts that during a zonal failure, automatic read failover prevents any impact to availability.

The following depicts that during a networking slowdown in a zone, write failover helps recover availability.

To ensure that the zonal failover mechanism is predictable (able to seamlessly shift traffic during an actual failure event), we regularly exercise failovers and keep rotating active and standby zones even during steady state. This not only verifies all network paths, ensuring we don’t hit surprises like clock skews, stale credentials, or networking issues during failover, but it also keeps gradually shifting caches to avoid cold starts on failovers, ensuring we deliver consistent performance at all times.

Improving the resiliency of the service

OpenSearch Service uses several principles and best practices to increase reliability, like automatic detection and faster recovery from failure, throttling excess requests, fail fast strategies, limiting queue sizes, quickly adapting to meet workload demands, implementing loosely coupled dependencies, continuously testing for failures, and more. We discuss a few of these methods in this section.

Automatic failure detection and recovery

All faults get monitored at a minutely granularity, across multiple sub-minutely metrics data points. Once detected, the system automatically triggers a recovery action on the impacted node. Although most classes of failures discussed so far in this post refer to binary failures where the failure is definitive, there is another kind of failure: non-binary failures, termed gray failures, whose manifestations are subtle and usually defy quick detection. Slow disk I/O is one example, which causes performance to be adversely impacted. The monitoring system detects anomalies in I/O wait times, latencies, and throughput, to detect and replace a node with slow I/O. Faster and effective detection and quick recovery is our best bet for a wide variety of infrastructure failures beyond our control.

Effective workload management in a dynamic environment

We’ve studied workload patterns that cause the system either to be overloaded with too many requests, maxing out CPU/memory, or a few rogue queries that can that either allocate huge chunks of memory or runaway queries that can exhaust multiple cores, either degrading the latencies of other critical requests or causing multiple nodes to fail due to the system’s resources running low. Some of the improvements in this direction are being done as a part of search backpressure initiatives, starting with tracking the request footprint at various checkpoints that prevents accommodating more requests and cancels the ones already running if they breach the resource limits for a sustained duration. To supplement backpressure in traffic shaping, we use admission control, which provides capabilities to reject a request at the entry point to avoid doing non-productive work (requests either time out or get cancelled) when the system is already run high on CPU and memory. Most of the workload management mechanisms have configurable knobs. No one size fits all workloads, therefore we use Auto-Tune to control them more granularly.

The cluster manager performs critical coordination tasks like metadata management and cluster formation, and orchestrates a few background operations like snapshot and shard placement. We added a task throttler to control the rate of dynamic mapping updates, snapshot tasks, and so on to prevent overwhelming it and to let critical operations run deterministically all the time. But what happens when there is no cluster manager in the cluster? The next section covers how we solved this.

Decoupling critical dependencies

In the event of cluster manager failure, searches continue as usual, but all write requests start to fail. We concluded that allowing writes in this state should still be safe as long as it doesn’t need to update the cluster metadata. This change further improves the write availability without compromising data consistency. Other service dependencies were evaluated to ensure downstream dependencies can scale as the cluster grows.

Failure mode testing

Although it’s hard to mimic all kinds of failures, we rely on AWS Fault Injection Simulator (AWS FIS) to inject common faults in the system like node failures, disk impairment, or network impairment. Testing with AWS FIS regularly in our pipelines helps us improve our detection, monitoring, and recovery times.

Contributing to open source

OpenSearch is an open-source, community-driven software. Most of the changes including the high availability design to support active and standby zones have been contributed to open source; in fact, we follow an open-source first development model. The fundamental primitive that enables zonal traffic shift and failover is based on a weighted traffic routing policy (active zones are assigned weights as 1 and standby zones are assigned weights as 0). Write failovers use the zonal decommission action, which evacuates all traffic from a given zone. Resiliency improvements for search backpressure and cluster manager task throttling are some of the ongoing efforts. If you’re excited to contribute to OpenSearch, open up a GitHub issue and let us know your thoughts.

Summary

Efforts to improve reliability is a never-ending cycle as we continue to learn and improve. With the Multi-AZ with standby feature, OpenSearch Service has integrated best practices for cluster configuration, improved workload management, and achieved four 9s of availability and consistent performance. OpenSearch Service also raised the bar by continuously verifying availability with zonal traffic rotations and automated tests via AWS FIS.

We are excited to continue our efforts into improving the reliability and fault tolerance even further and to see what new and existing solutions builders can create using OpenSearch Service. We hope this leads to a deeper understanding of the right level of availability based on the needs of your business and how this offering achieves the availability SLA. We would love to hear from you, especially about your success stories achieving high levels of availability on AWS. If you have other questions, please leave a comment.


About the authors

Bukhtawar Khan is a Principal Engineer working on Amazon OpenSearch Service. He is interested in building distributed and autonomous systems. He is a maintainer and an active contributor to OpenSearch.

Gaurav Bafna is a Senior Software Engineer working on OpenSearch at Amazon Web Services. He is fascinated about solving problems in distributed systems. He is a maintainer and an active contributor to OpenSearch.

Murali Krishna is a Senior Principal Engineer at AWS OpenSearch Service. He has built AWS OpenSearch Service and AWS CloudSearch. His areas of expertise include Information Retrieval, Large scale distributed computing, low latency real time serving systems etc. He has vast experience in designing and building web scale systems for crawling, processing, indexing and serving text and multimedia content. Prior to Amazon, he was part of Yahoo!, building crawling and indexing systems for their search products.

Ranjith Ramachandra is a Senior Engineering Manager working on Amazon OpenSearch Service. He is passionate about highly scalable distributed systems, high performance and resilient systems.

Rohin Bhargava is a Sr. Product Manager with the Amazon OpenSearch Service team. His passion at AWS is to help customers find the correct mix of AWS services to achieve success for their business goals.

Use SAML Identities for programmatic access to Amazon OpenSearch Service

Post Syndicated from Muthu Pitchaimani original https://aws.amazon.com/blogs/big-data/use-saml-identities-for-programmatic-access-to-amazon-opensearch-service/

Customers of Amazon OpenSearch Service can already use Security Assertion Markup Language (SAML) to access OpenSearch Dashboards.

This post outlines two methods by which programmatic users can now access OpenSearch using SAML identities. This applies to all identity providers (IdPs) that support SAML 2.0, including prevalent ones like Active Directory Federation Service (ADFS), Okta, AWS IAM Identity Center (Successor to AWS Single Sign-On), KeyCloak, and others. Although we outline the methods as they pertain to OpenSearch Service and AWS Identity and Access Management (IAM), programmatic access to each of these individual providers is outside the scope of this post. Most of these providers do provide such a facility.

Single sign-on methods

When you use single sign-on (SSO), there are two different authentication methods:

  • Identity provider initiated – This is when a user or a user-agent first authenticates with an IdP and gets a SAML assertion that establishes the identity of the user. This assertion is then passed to a service provider (SP) that provides access to a protected resource.
  • Service provider initiated – Although the IdP-initiated exchange is straightforward, a more typical sign-on experience is when the protected resource is accessed directly. The SP then redirects the user to the IdP for authentication along with a SAML authentication request. The IdP responds with an authentication assertion inside a SAML response. After that, the SSO experience is the same as that of an IdP-initiated flow.

For programmatic access to OpenSearch Service, an external IdP is the IdP, and OpenSearch Service and IAM both serve as SPs. To configure your IdP of choice as the SAML IdP for IAM, refer to Creating IAM SAML identity providers. To configure OpenSearch Service, refer to SAML authentication for OpenSearch Dashboards.

In the following sections, we outline two methods to access OpenSearch Service API:

Method 1: Use AWS STS

The following figure shows the sequence of calls to access OpenSearch Service API using AWS STS.

Let’s explore each step in more detail.

Steps 1 and 2

Steps 1 and 2 vary depending upon your chosen IdP. In general, they typically provide an authentication API or session API or another similar API to authenticate and retrieve the SAML authentication assertion response. We use this SAML assertion in the next step.

Steps 3 and 4

Call the AssumeRoleWithSAML AWS STS API to exchange the SAML assertion for temporary credentials associated with your SAML identity. See the following code:

curl --location 'https://sts.amazonaws.com?
Version=2011-06-15&
Action=AssumeRoleWithSAML&
RoleArn=<ARN of the role being assumed>&
PrincipalArn=<ARN of the IdP integrated with IAM>&
SAMLAssertion=<Base-64 encoded SAML assertion>'

The response contains the temporary AWS STS credentials with AccessKeyId, SecretAccessKey, and a SessionToken.

Step 5

Use the temporary credentials from the last step to sign all API requests to OpenSearch Service. Also ensure the role that you assumed with the AssumeRoleWithSAML call has sufficient permission to access the requisite data in OpenSearch Service. Refer to Mapping roles to users for more information about mapping this role as a backend role. As an additional step to ensure consistency, this AWS STS role and any SAML group the user is part of can be mapped to the same role in OpenSearch Service. The following code shows a model to make this call:

curl --location ‘<OpenSearch Service domain URL>/_search' \
--header 'X-Amz-Security-Token: Fwo...==(truncated)' \
--header 'X-Amz-Date: 20230327T134710Z' \
--header 'Authorization: AWS4-HMAC-SHA256 Credential=ASI..(truncated)/20230327/us-east-1/es/aws4_request, SignedHeaders=host;x-amz-date;x-amz-security-token, Signature=95eb…(truncated)'

Method 2: Use OpenSearch Dashboards’ console proxy

OpenSearch Dashboards has a component called a console proxy that can proxy requests to OpenSearch. This allows OpenSearch clients to make the same API calls in Domain Specific Language (DSL) to this console proxy instead of directly calling OpenSearch. The console proxy forwards these calls to OpenSearch and responds back to the clients in the same format as OpenSearch.

The following figure shows the sequence of calls you can make to the console proxy to gain programmatic access to OpenSearch Service.

Steps 1 and 2

The first two steps are similar to method 1, and they will vary depending on what IdP is chosen. Essentially, you need to obtain a SAML authentication assertion response from the IdP.

Steps 3 and 4

Use the SAML assertion from the previous steps and POST it to the Assertion Consumer Service (ACS) URL, _opendistro/_security/saml/acs/idpinitiated, to exchange the assertion for the security_authentication token. The following code shows the command line for these steps:

curl --location ‘<dashboards URL>/_opendistro/_security/saml/acs/idpinitiated' \
--header 'content-type: application/x-www-form-urlencoded' \
--data-urlencode ‘SAMLResponse=Base-64 encoded SAML assertion' \
--data-urlencode 'RelayState=’

If you’re using the OpenSearch engine, the dashboard URL is <domain URL>/_dashboards. If you’re using the Elasticsearch engine, the dashboard URL is <domain URL>/_plugin/kibana. OpenSearch Dashboards processes this and responds with a redirect response with code 302 and an empty body. The response headers now also contain a cookie named security_authentication, which is the token you must use in all subsequent calls.

Steps 5–8

Use the security_authentication cookie in the API calls to the console proxy to perform programmatic API calls. The following code shows a command line for these steps:

curl --location ‘<dashboardsURL>/api/console/proxy?path=_search&method=GET' \
--header 'content-type: application/json' \
--header 'cookie: security_authentication=Fe26.2**1...(truncated)' \
--header 'osd-xsrf: true' \
--data '{
  "query": {
    "match_all": {}
  }
}’

Make sure to include a header called osd-xsrf : true for programmatic access to dashboards. The console proxy path is /api/console/proxy for Elasticsearch engines version 6.x and 7.x and OpenSearch engine version 1.x and 2.x.

Similar to method 1, make sure to map roles and groups associated with a particular SAML identity as the correct backend role with requisite permissions.

Comparing these methods

You can use method 1 in any domain regardless of the engine as long as fine-grained access control is enabled. Method 2 only works for domains with Elasticsearch engine versions greater than 6.7 and all OpenSearch engine versions.

The OpenSearch Dashboards process is generally meant for human interactions, which has a lower API call rate and volume than those of programmatic calls. OpenSearch can handle considerably higher API call rates and volume, so take care not to send high-volume API calls using method 2. As a best practice for programmatic access with SAML identities, we recommend method 1 wherever possible to avoid performance bottlenecks.

Conclusion

Both of the methods outlined in this post provide a similar flow to access OpenSearch Service programmatically using SAML identities (exchanging a SAML assertion for an authentication token). AssumeRoleWithSAML is a key and fairly straightforward-to-use API that enables this access and is our recommended method. Try one of OpenSearch Service labs and launch an OpenSearch Service domain to experiment with these methods. Good luck!


About the author

Muthu Pitchaimani is a Search Specialist with Amazon OpenSearch Service. He builds large-scale search applications and solutions. Muthu is interested in the topics of networking and security, and is based out of Austin, Texas.