Post Syndicated from Raghavarao Sodabathina original https://aws.amazon.com/blogs/big-data/federate-access-to-amazon-sagemaker-unified-studio-with-aws-iam-identity-center-and-ping-identity/
With an identity provider (IdP), you can manage your user identities outside of AWS and give these external user identities permissions to use AWS resources in your AWS accounts. External IdPs, such as Ping Identity, can integrate with AWS IAM Identity Center to be the source of truth for Amazon SageMaker Unified Studio. SageMaker Unified Studio also supports trusted identity propagation for SQL analytics, including Amazon Athena and Amazon Redshift.
SageMaker Unified Studio provides an integrated experience to use your data and tools for analytics and AI. You can use SageMaker Unified Studio to discover your data and put it to work using familiar AWS analytics and machine learning (ML) services for model development, generative AI, big data processing, and SQL analytics, assisted by Amazon Q Developer. By default, SageMaker domains support AWS Identity and Access Management (IAM) user credentials. You can also enable access to SageMaker domains in SageMaker Unified Studio for users with single sign-on (SSO) with IAM Identity Center and direct SAML integration with SageMaker Unified Studio.
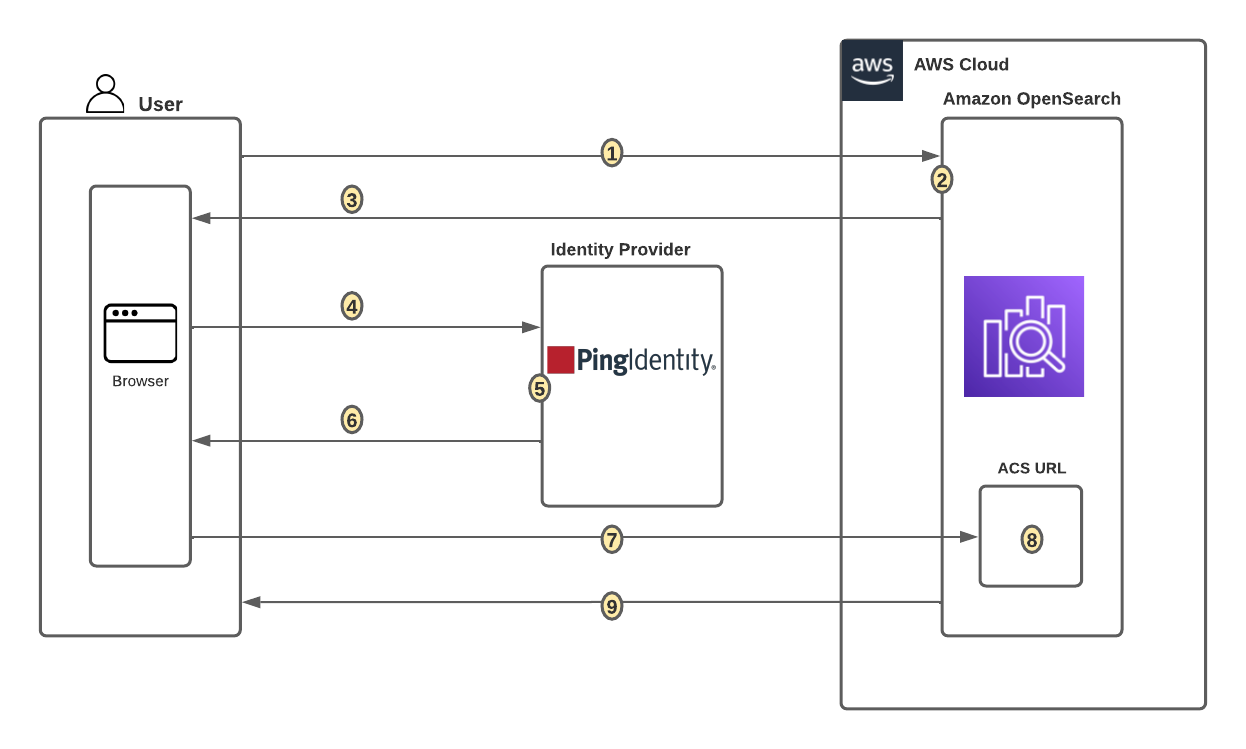
Users can access SageMaker Unified Studio with their existing corporate credentials. With IAM Identity Center, administrators can connect their existing external IdPs and continue to manage users and groups in those existing identity systems, which can then be synchronized with IAM Identity Center using System for Cross-domain Identity Management (SCIM).In this post, we show how to set up workforce access with SageMaker Unified Studio using Ping Identity as an external IdP with IAM Identity Center.
In this post, we show how to set up workforce access with SageMaker Unified Studio using Ping Identity as an external IdP with IAM Identity Center.
Solution overview
We walk through the following high-level steps to implement this solution:
- Enable IAM Identity Center.
- Create a SageMaker Unified Studio domain.
- Set up your IdP (for this example, Ping Identity).
- Connect Ping Identity and IAM Identity Center.
- Set up automatic provisioning of users and groups in IAM Identity Center.
- Configure SageMaker Unified Studio SSO user access.
Prerequisites
For this walkthrough, you should have the following prerequisites:
- An AWS account with IAM Identity Center enabled. It is recommended to use an organization-level IAM Identity Center instance for best practices and centralized identity management across your AWS organization.
- A Ping Identity account.
- A browser with network connectivity to Ping Identity and SageMaker Unified Studio.
Enable IAM Identity Center
To enable IAM Identity Center, follow the instructions in Enable IAM Identity Center.
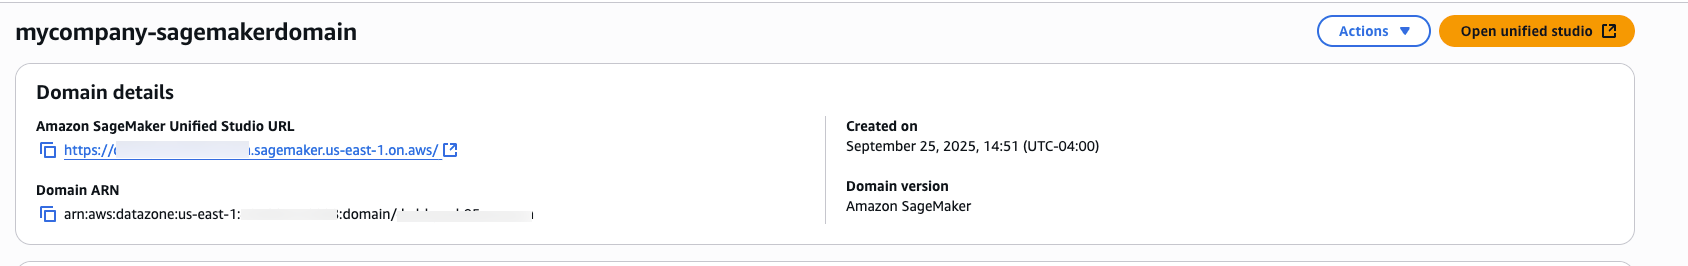
Create a SageMaker Unified Studio domain
To create a SageMaker Unified Studio domain, refer to the instructions in Create a Amazon SageMaker Unified Studio domain – manual setup.
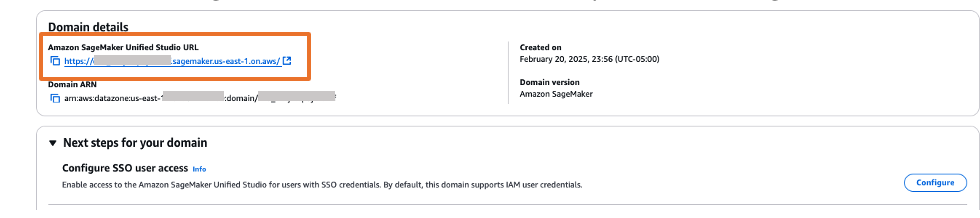
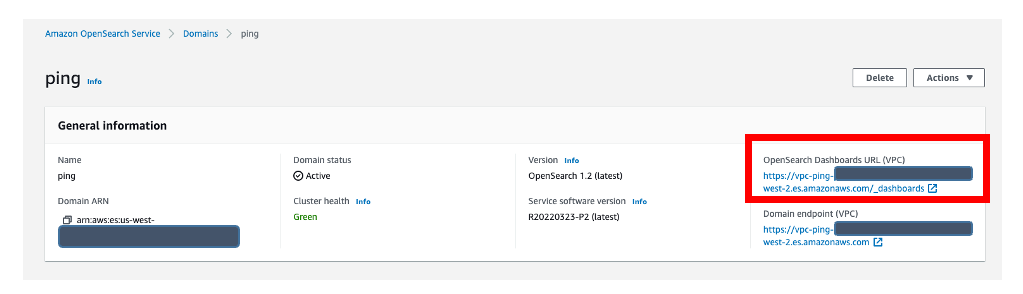
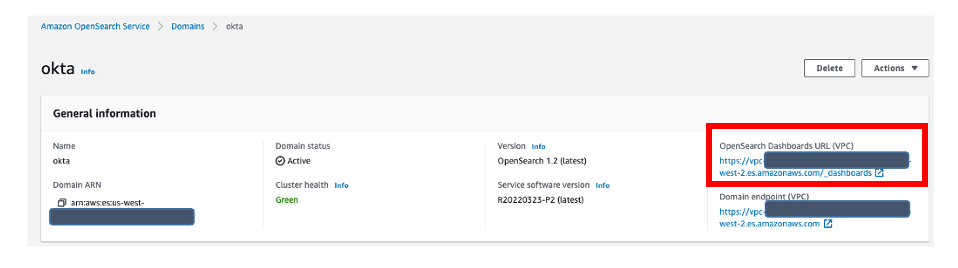
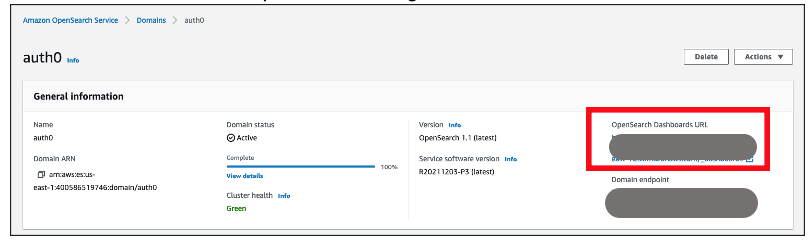
On the SageMaker console, go to the domain details and copy the Amazon Resource Name (ARN) under Domain ARN. You will use this value when you add your trust policy and when you connect your IAM IdP to your Ping Identity instance.
Set up your IdP (Ping Identity)
In this section, we walk through the procedure to set up your IdP (for this example, Ping Identity).
Create an environment in Ping Identity
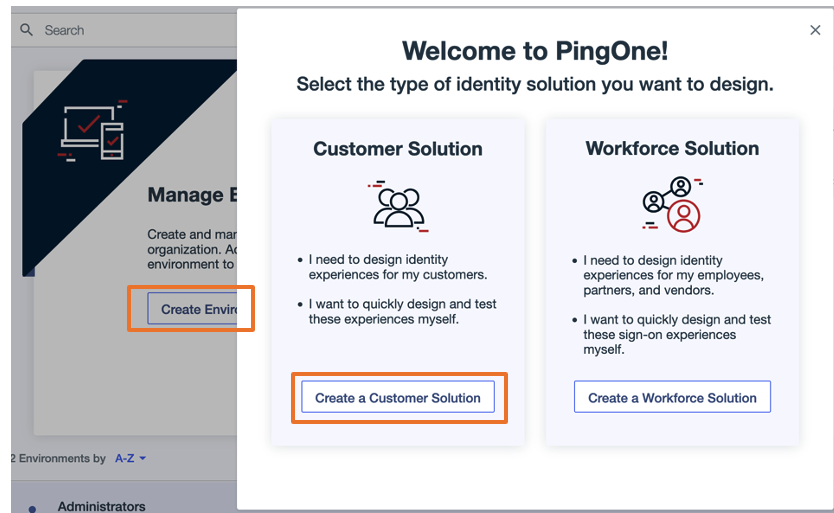
Complete the following steps to create an environment for Ping Identity:
- Log in to your Ping Identity account.
- Choose Create Environment.
- Choose Create a Customer Solution.
- In the Tailor your experiences pop-up, choose Skip.

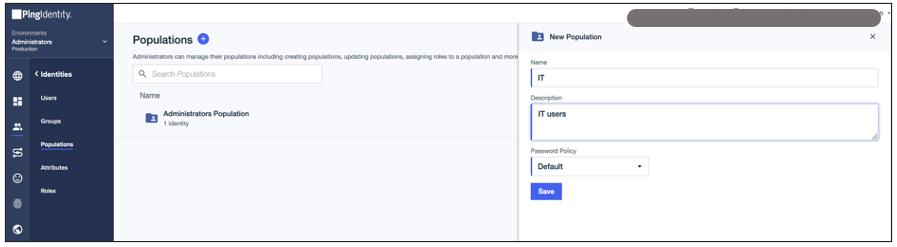
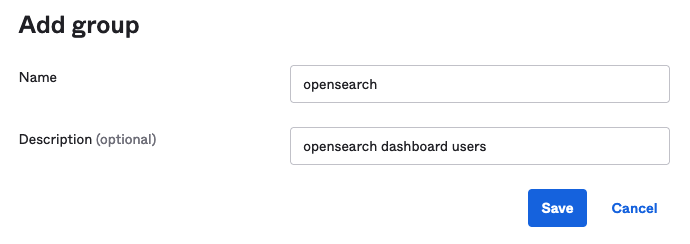
Create a group in Ping Identity
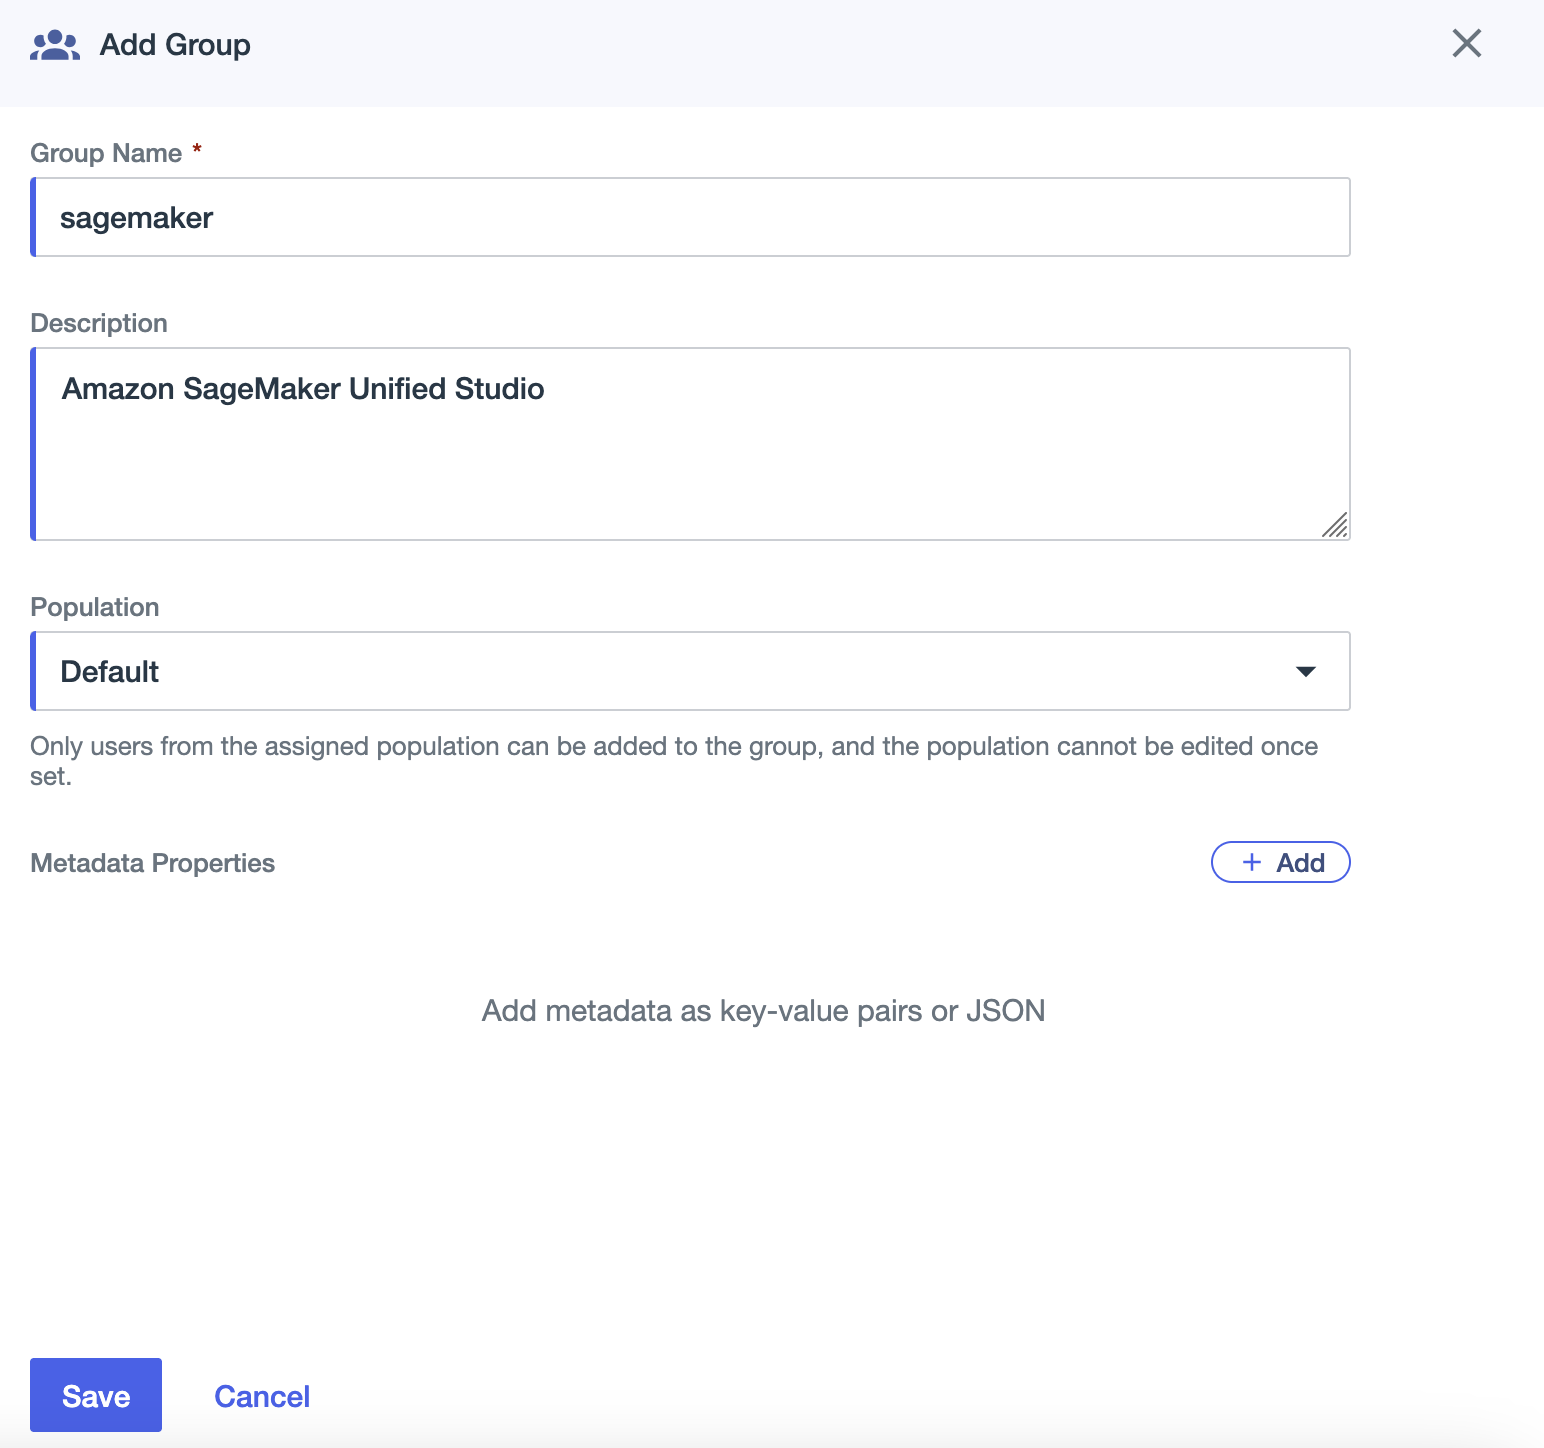
Complete the following steps to create a group in Ping Identity:
- On the Environments page, choose Manage Environments.
- In the navigation pane, choose Directory, then choose Groups.
- Choose the plus sign to add a group.
- For Group Name, enter
sagemaker - For Description, enter an optional description (for example,
Amazon SageMaker Unified Studio). - For Population, choose Default.
- Choose Save.

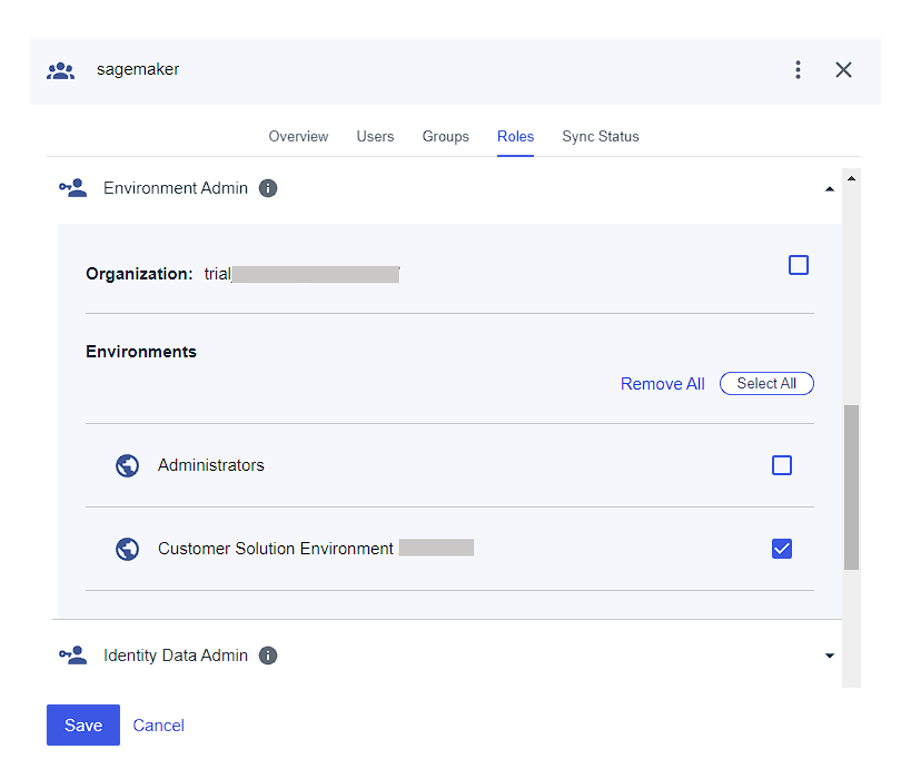
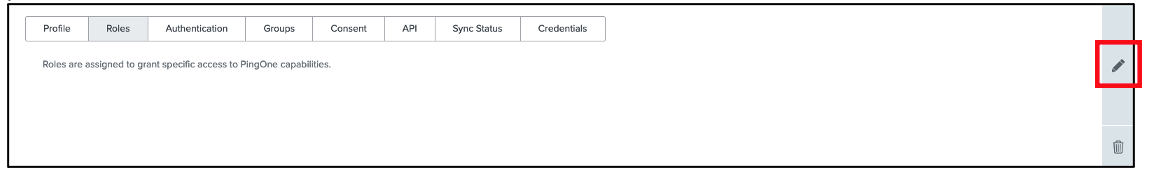
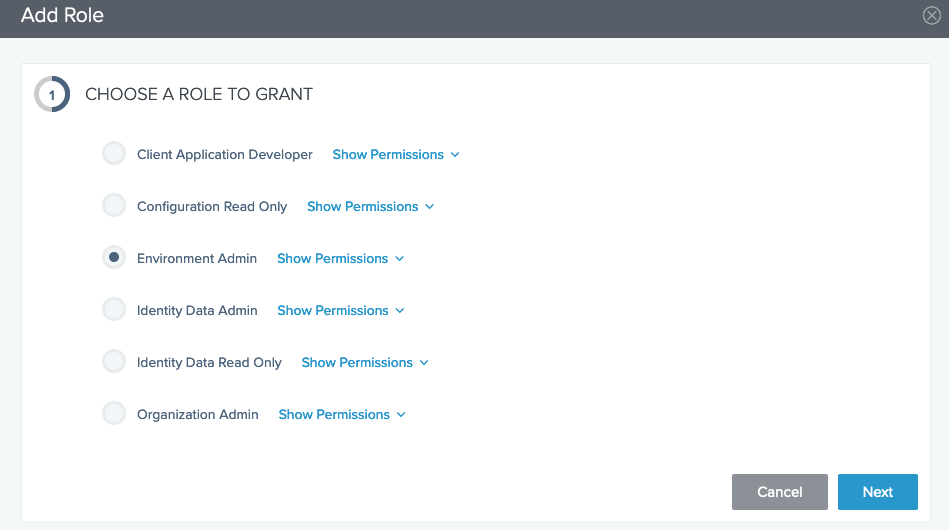
- On the Roles tab for the
sagemakergroup, assign the Environment Admin role to the group.

Create a user in Ping Identity
Complete the following steps to create a user:
- In the navigation pane, choose Directory, then choose Users.
- Choose the plus sign to create a user.
- Provide values for Given name, Family name, Username, and Email.
- For Password, choose First time password.
- Choose Save.
You can add more users as needed.
Assign group to user
Complete the following steps to assign your group to your user:
- In the navigation pane, choose Directory, then choose Groups.
- Choose the
sagemakergroup you created. - On the Users tab, choose the plus sign to add a user.
- Add the user you created.
Connect Ping Identity and IAM Identity Center
To configure the integration between Ping Identity and IAM Identity Center, you need access to both management consoles. Although Ping Identity’s application catalog includes IAM Identity Center, we recommend configuring a standard SAML application for greater control over settings and attribute mappings.
Complete the following steps:
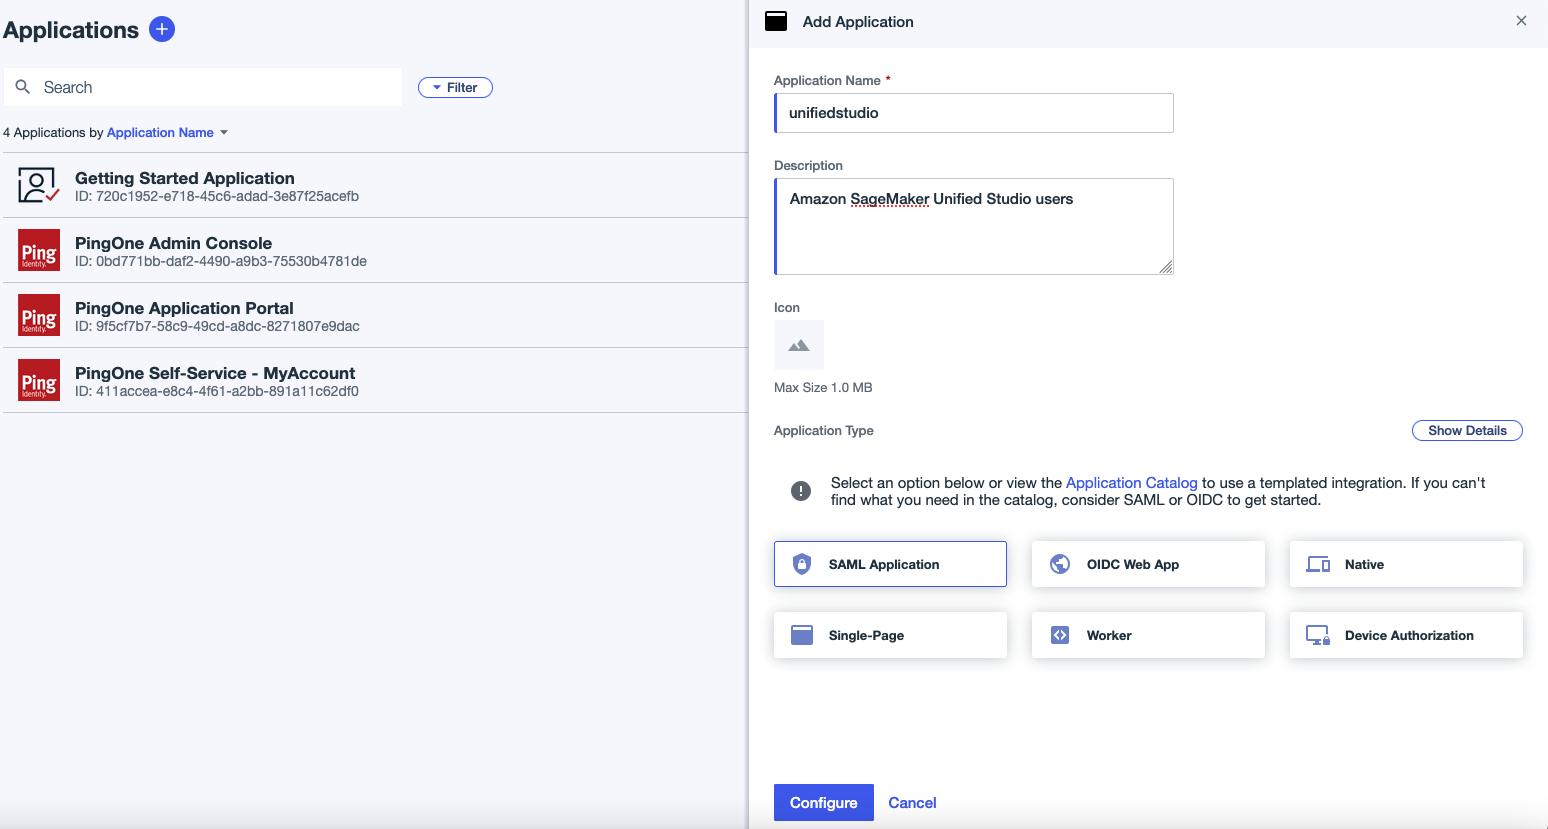
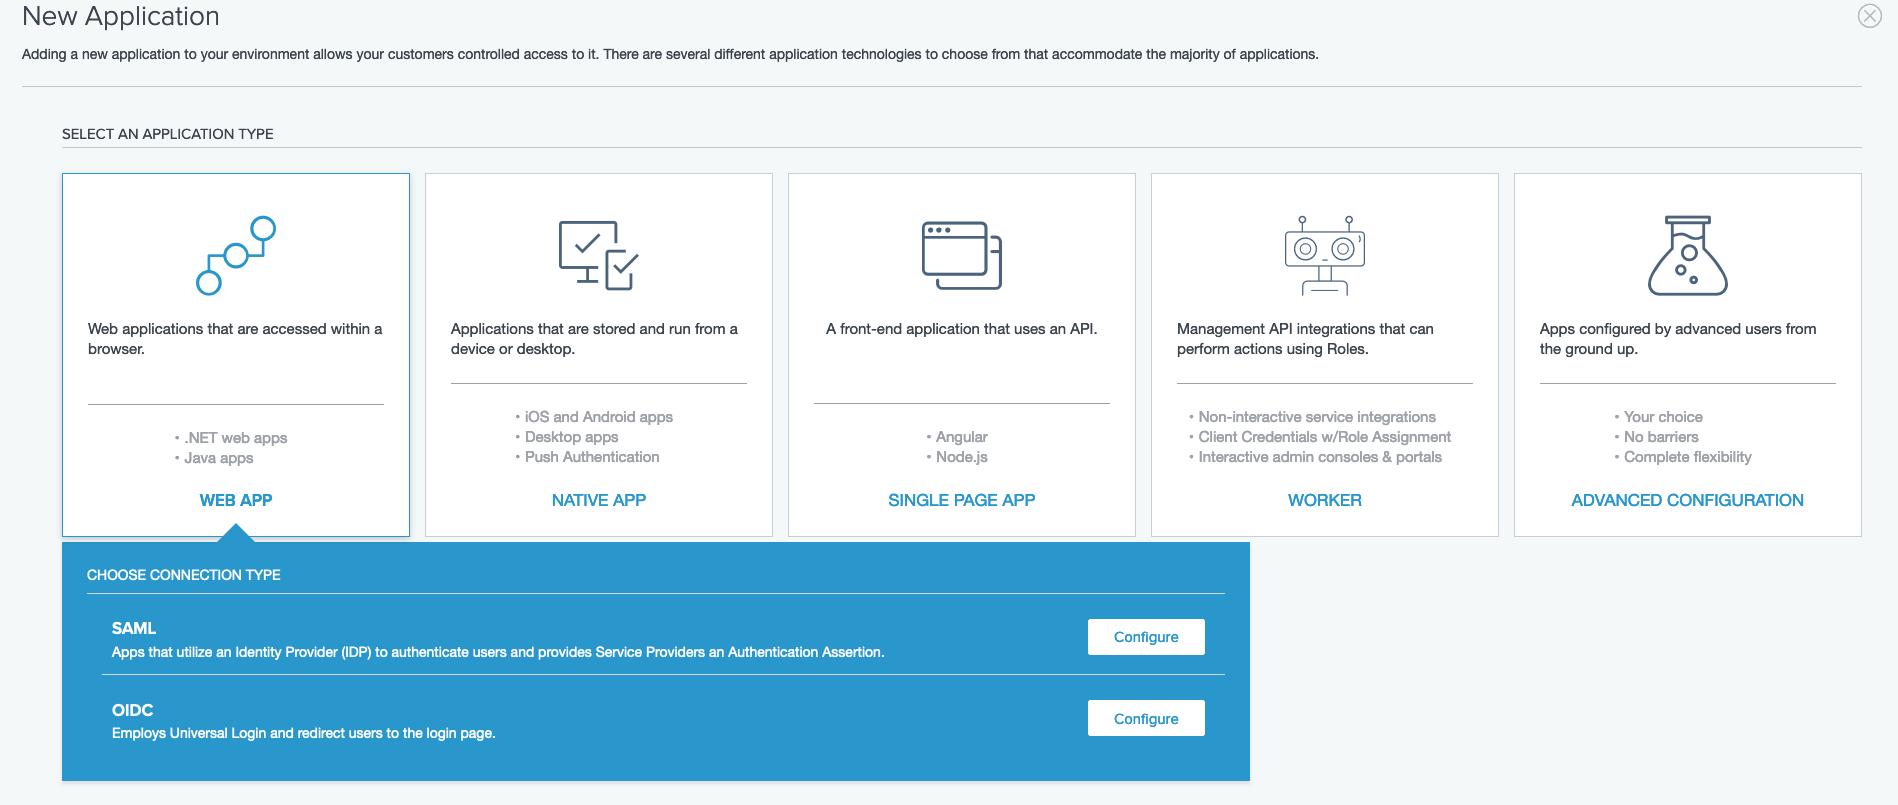
- Go to the Ping Identity environment you created and choose Applications in the navigation pane.
- Choose the plus sign to add an application:
- For Application name, enter a name (for this example, we use
unifiedstudio). - For Description, enter an optional description.
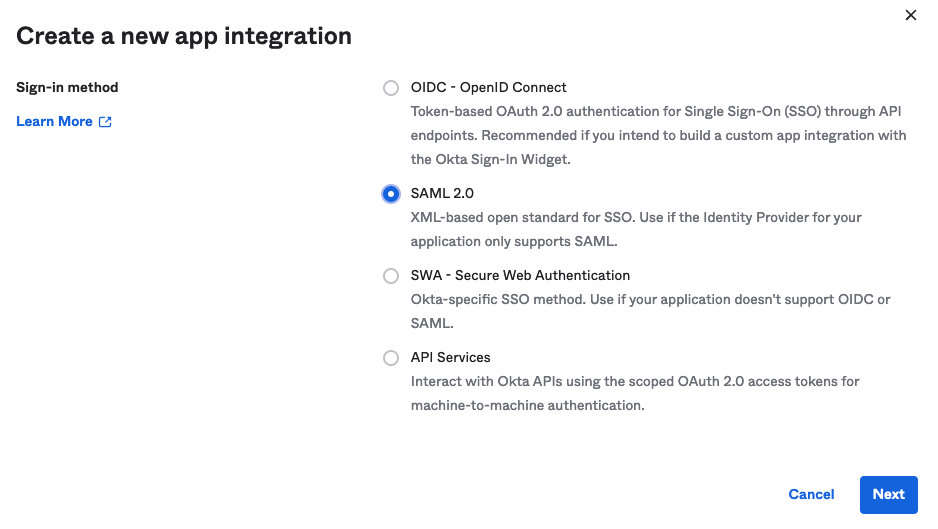
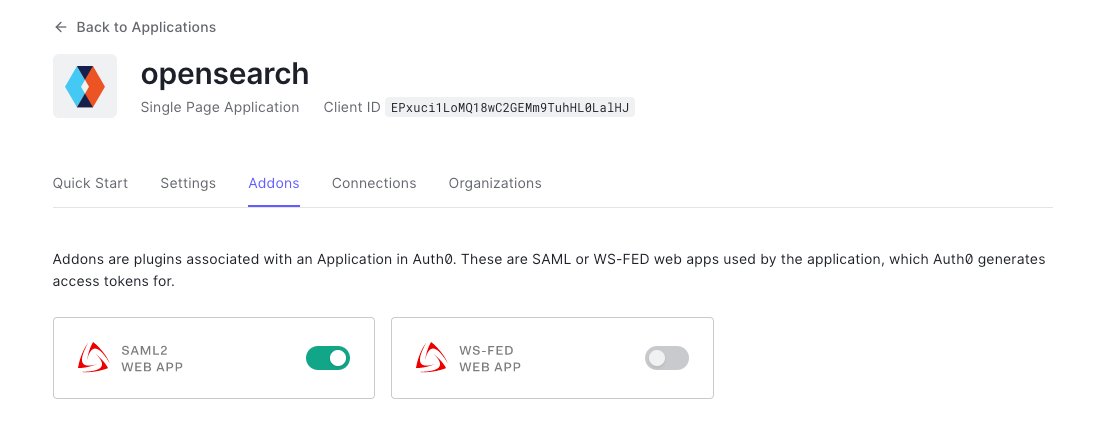
- For Application Type, choose SAML Application.
- Choose Configure.

- For Application name, enter a name (for this example, we use
- Sign in to the IAM Identity Center console as a user with administrative privileges.
- In the navigation pane, choose Settings to update your settings:
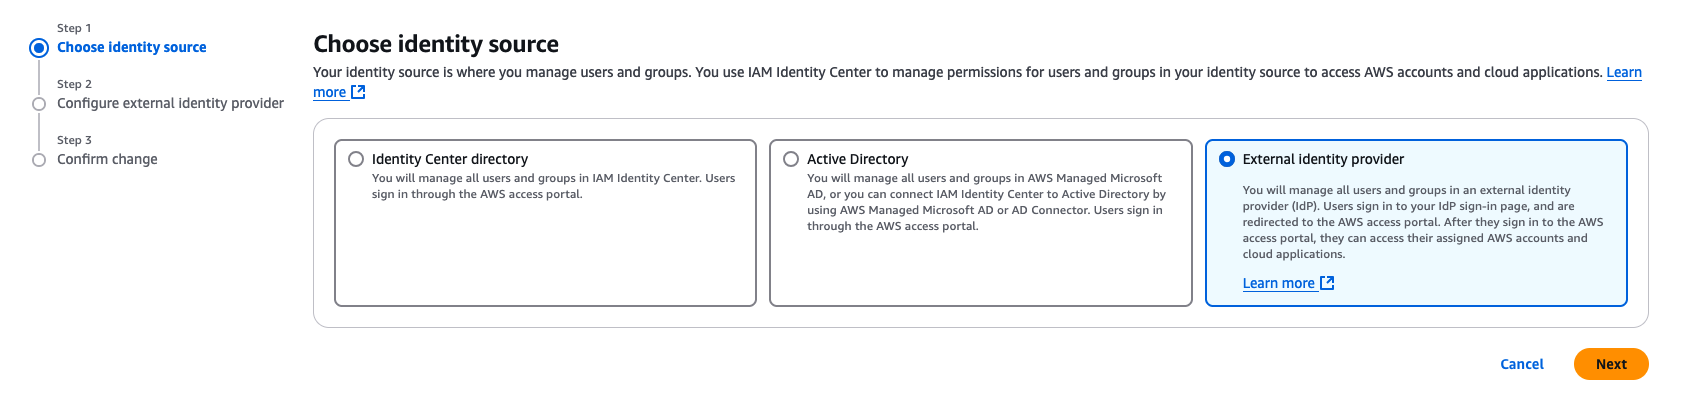
- On the Identity source tab, choose Change identity source on the Actions dropdown menu.

- For Choose identity source, select External identity provider, then choose Next.

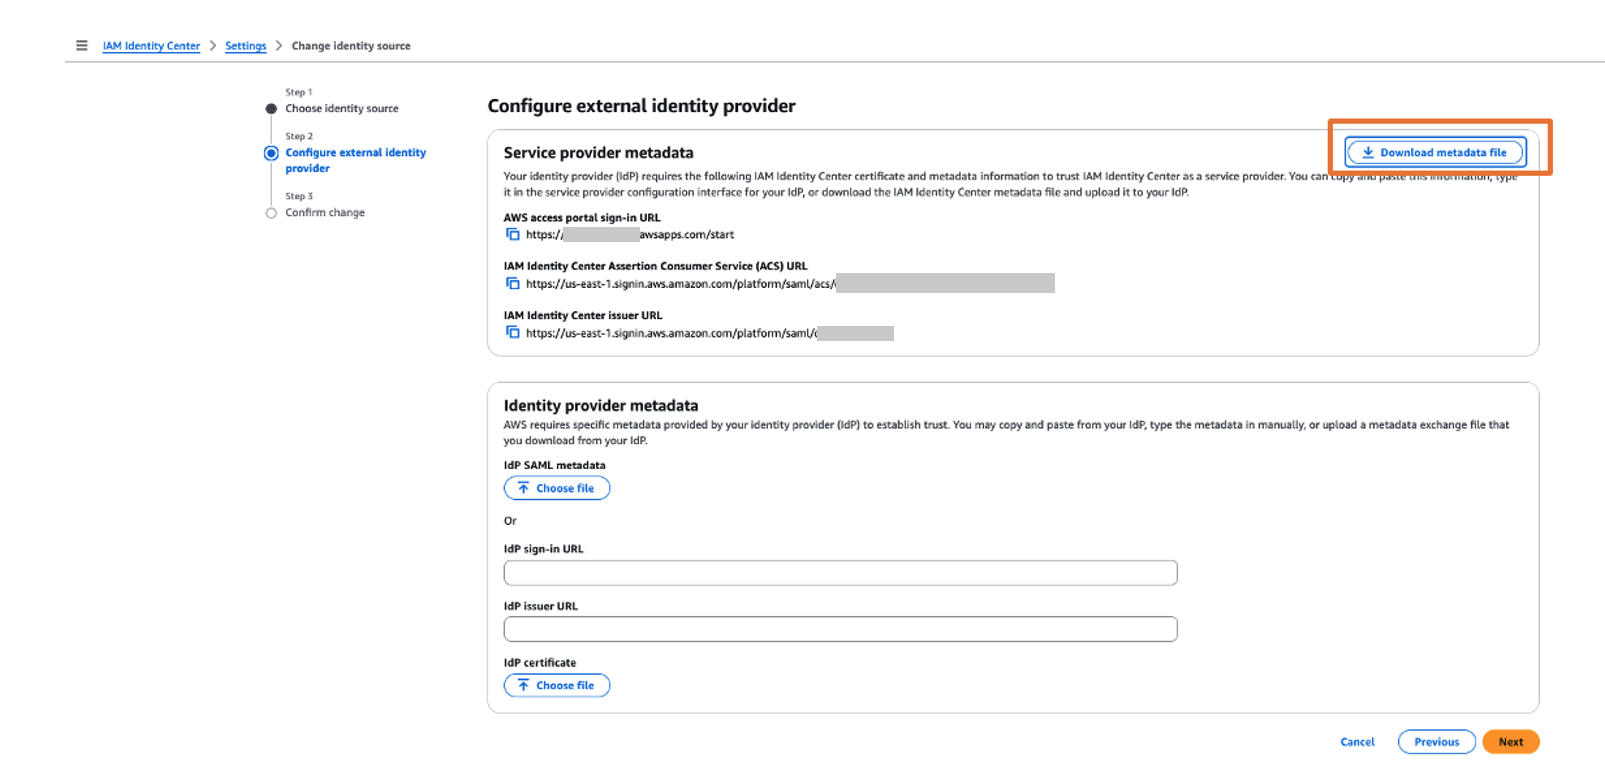
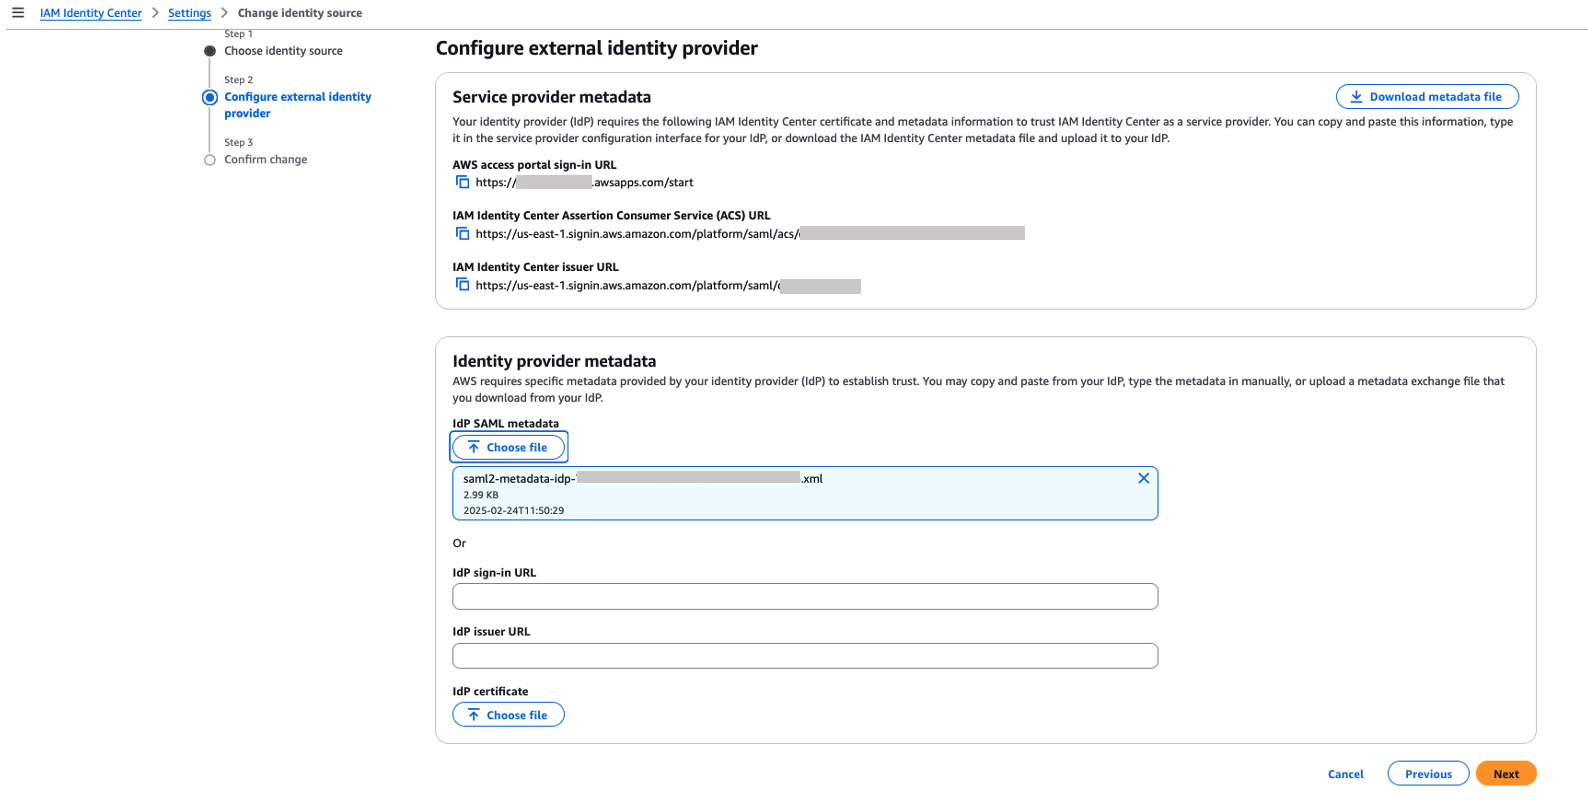
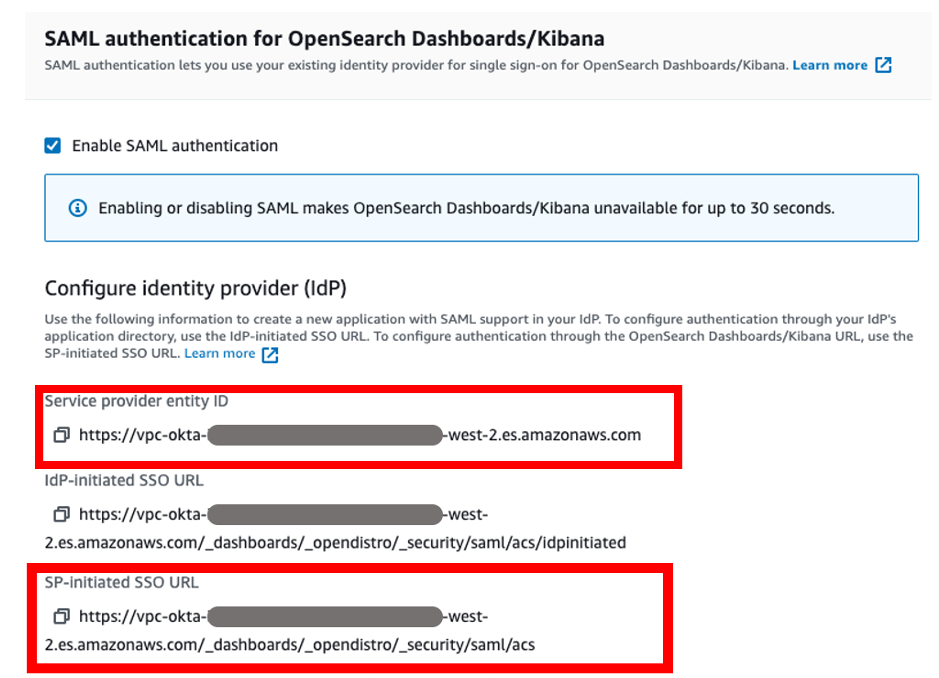
- In the Service provider metadata section, choose Download metadata file to download the IAM Identity Center metadata file.
You will use this service provider metadata file in the next step when you connect Ping Identity with IAM Identity Center.

- On the Identity source tab, choose Change identity source on the Actions dropdown menu.
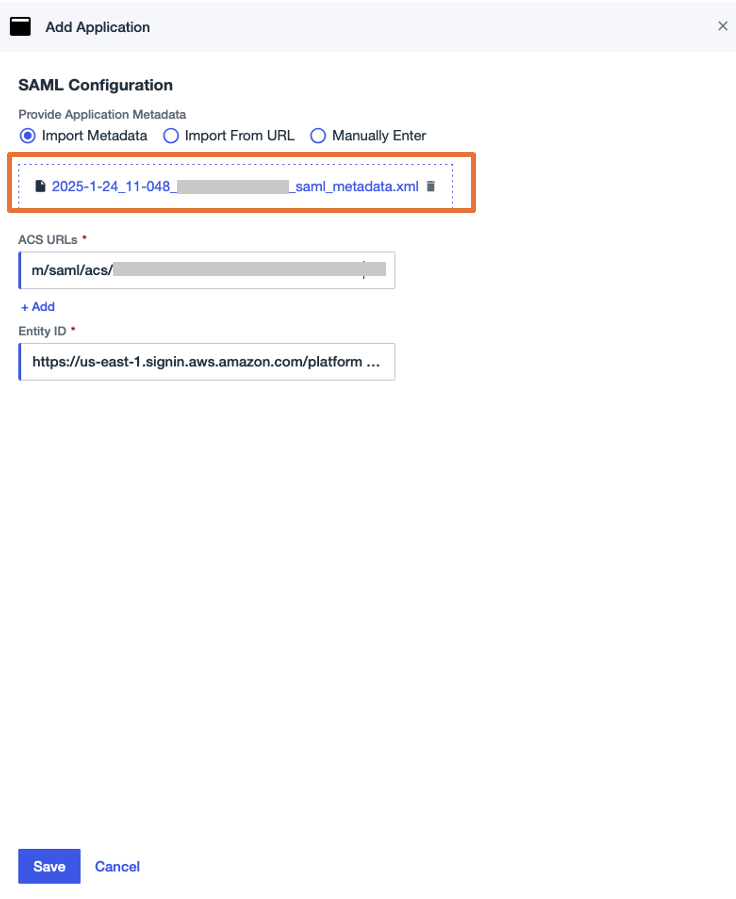
- Return to the Ping Identity console and the SAML application page.
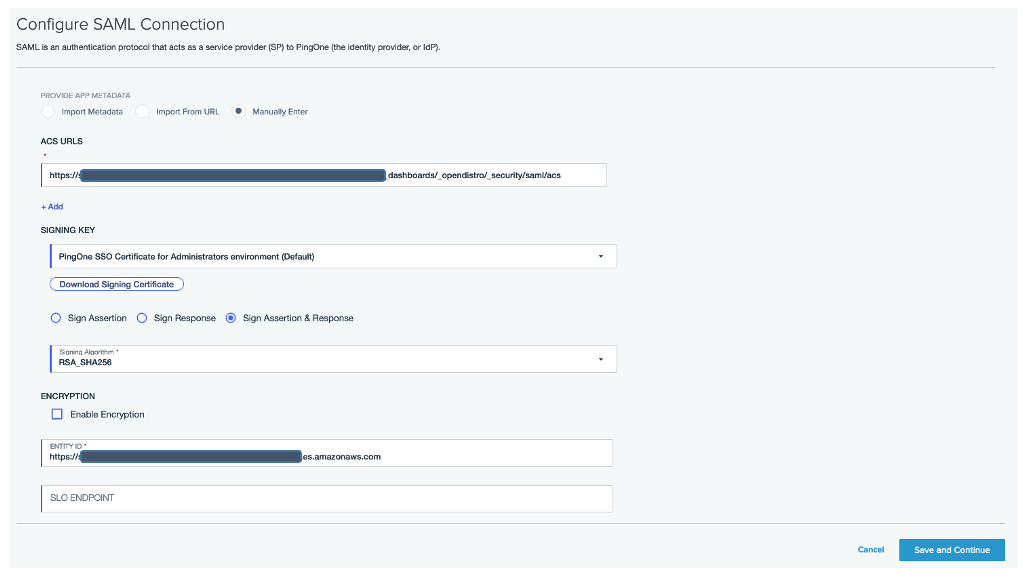
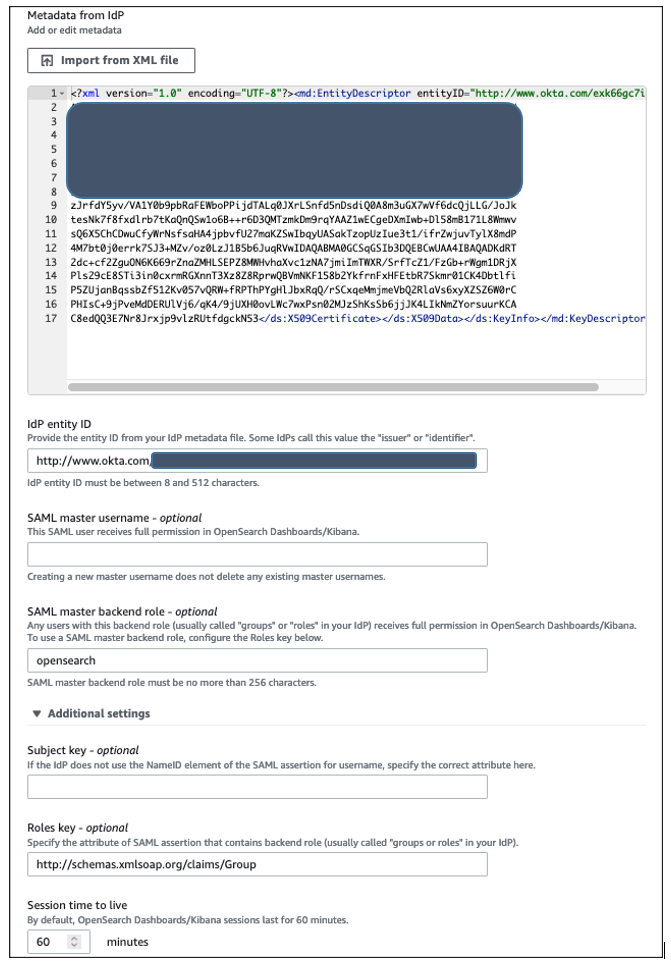
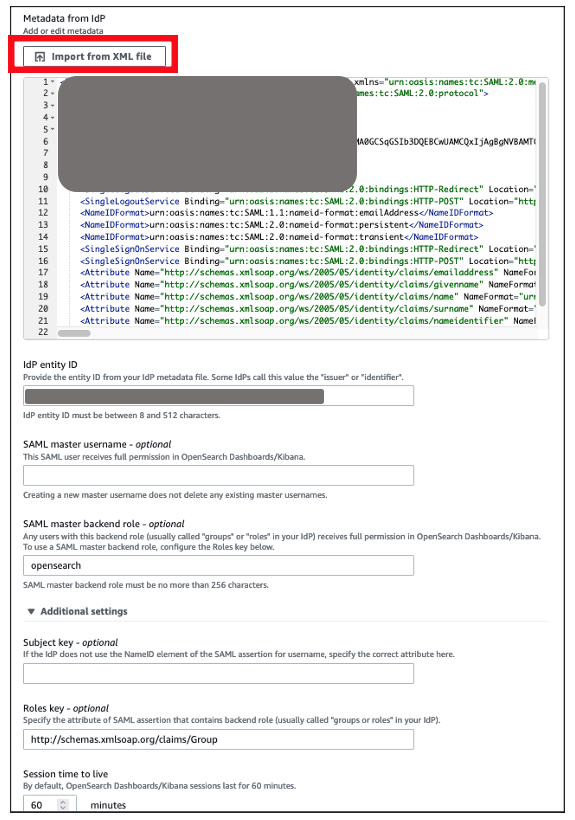
- In the SAML Configuration section, select Import Metadata, upload the metadata file you downloaded, then choose Save.

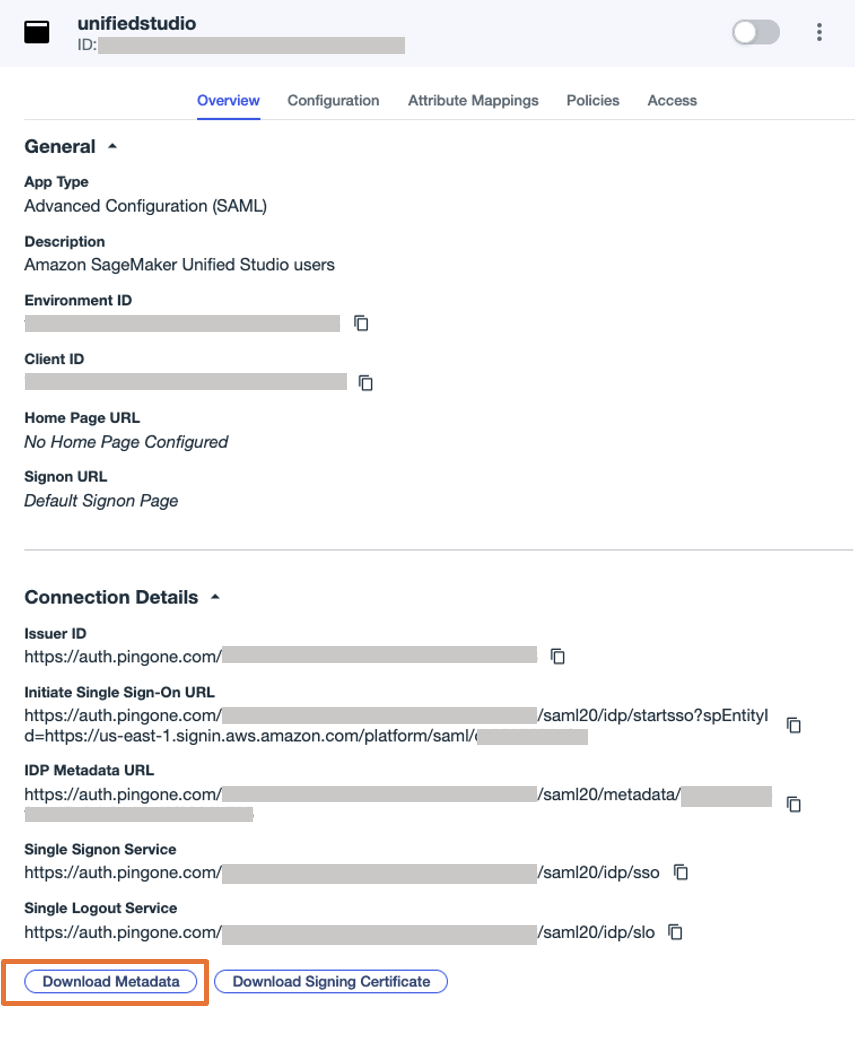
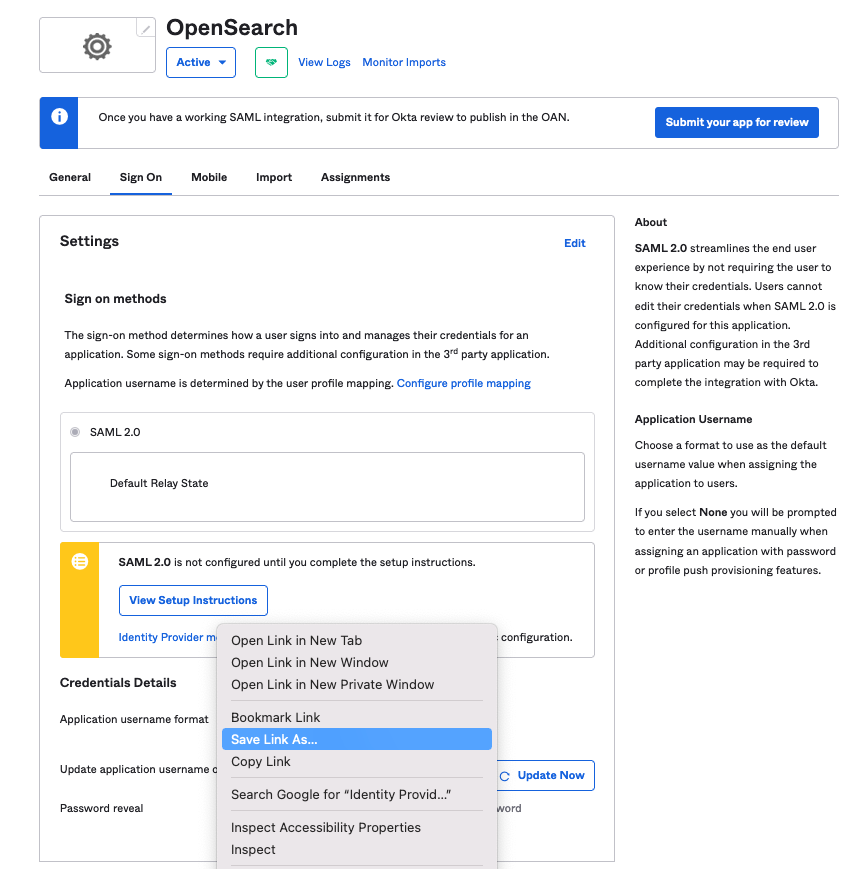
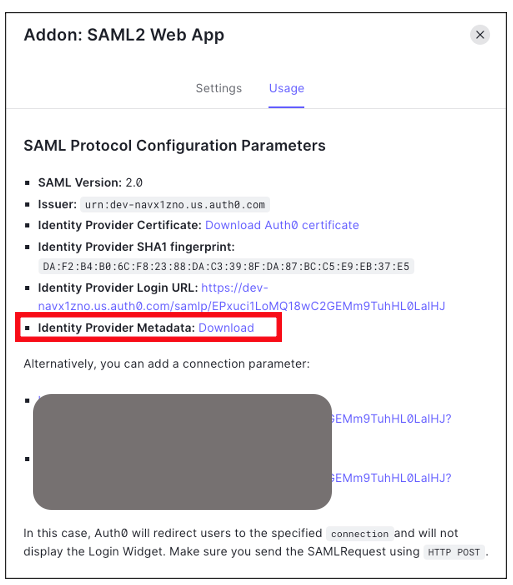
- On the Overview tab of the application page, choose Download Metadata under Connection details to download the Ping Identity IdP metadata.
You will use this for the SAML configuration in IAM Identity Center to set up Ping Identity as an IdP in the next step.
- Return to the IAM Identity Center console and continue configuring your identity source:
- In the Identity provider metadata section, choose Choose file under IdP SAML metadata, upload the metadata file you downloaded from Ping Identity, then choose Next.

- Choose Accept to accept the disclaimer.
- Choose Change identity source.
- In the Identity provider metadata section, choose Choose file under IdP SAML metadata, upload the metadata file you downloaded from Ping Identity, then choose Next.
- Return to the Ping Identity console to complete the SAML configuration.
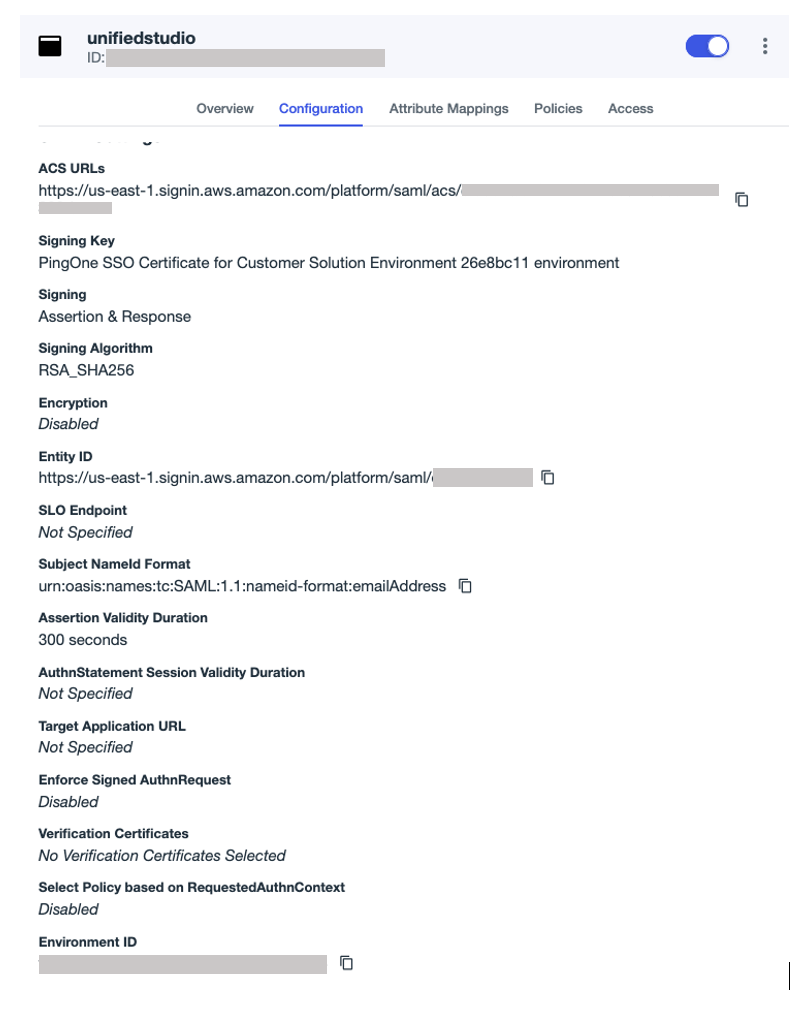
- On the Configuration tab, choose the edit icon to update the configuration:
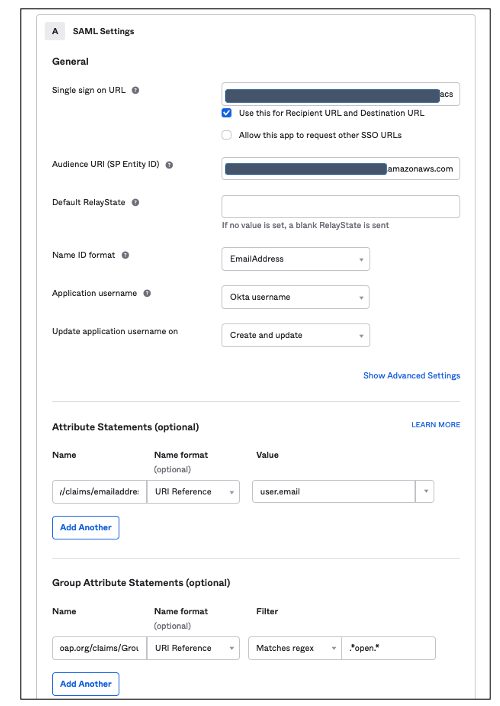
- For Sign, choose Sign Assertion & Response.
- For Subject Name ID, enter
urn:oasis:names:tc:SAML:1.1:nameid-format:emailAddress. - For Assertion Validity Duration, enter
300. - Leave the remaining values as default.

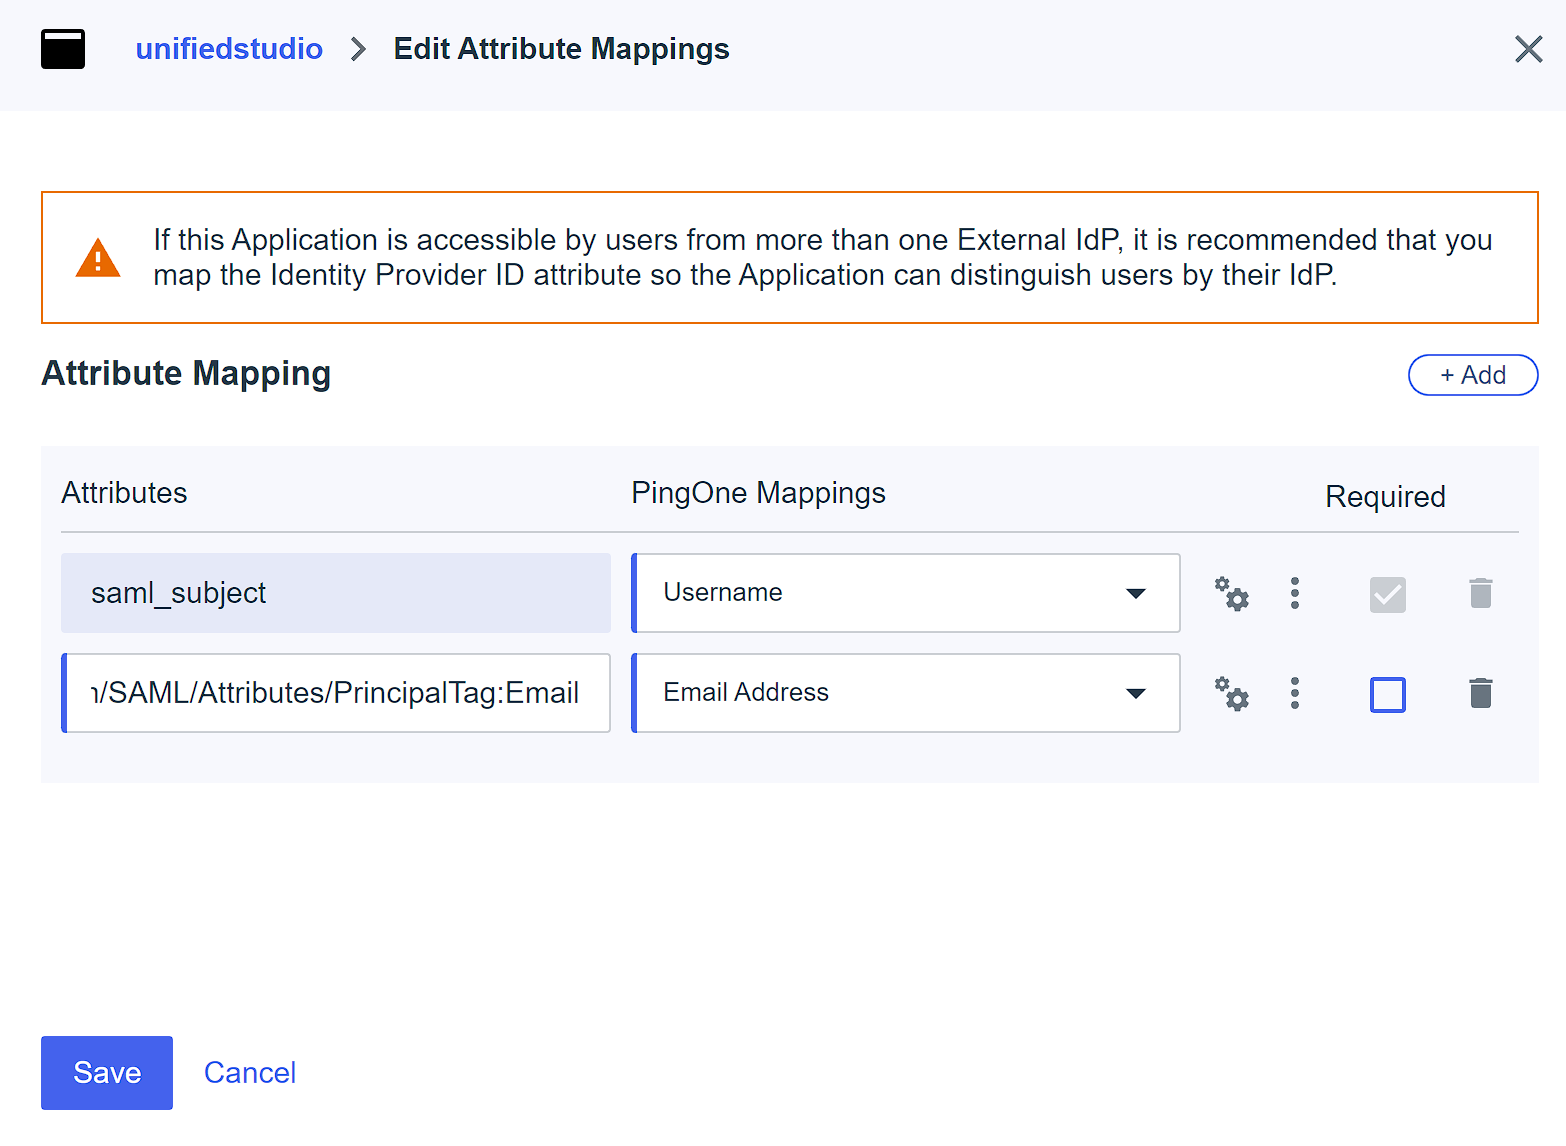
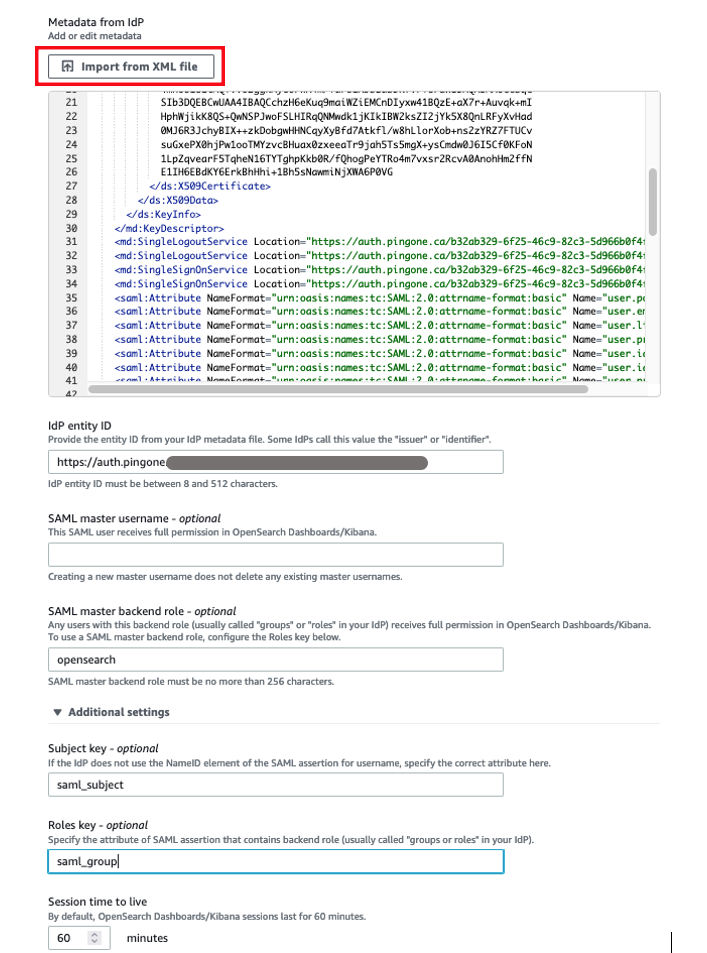
- On the Attributes tab, choose the edit icon.
- Choose +Add to add two attribute mappings:
- Map the attribute
saml-subjecttoUsername, and leave Name format as default. - Map the attribute
https://aws.amazon.com/SAML/Attributes/PrincipalTag:EmailtoEmail Address,and set Name format to Unspecified. - Choose Save.

- Map the attribute
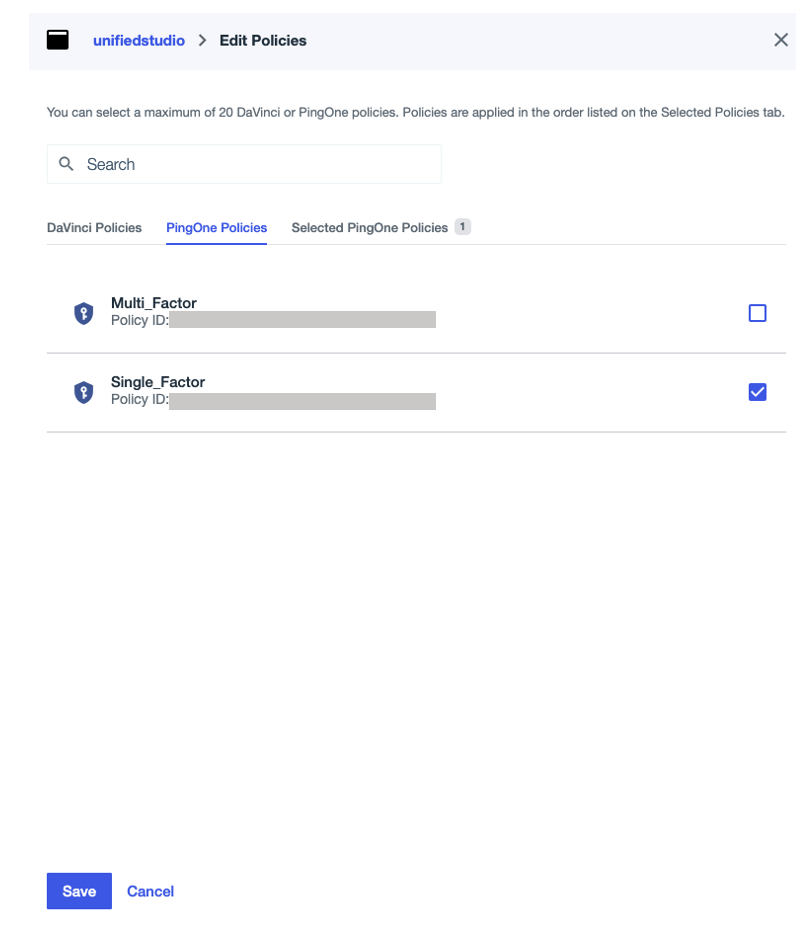
- On the PingOne Policies tab, select Single Factor, then choose Save.
This post uses single-factor authentication for demonstration purposes only. In your environments, follow your organization’s security standards and governance framework.
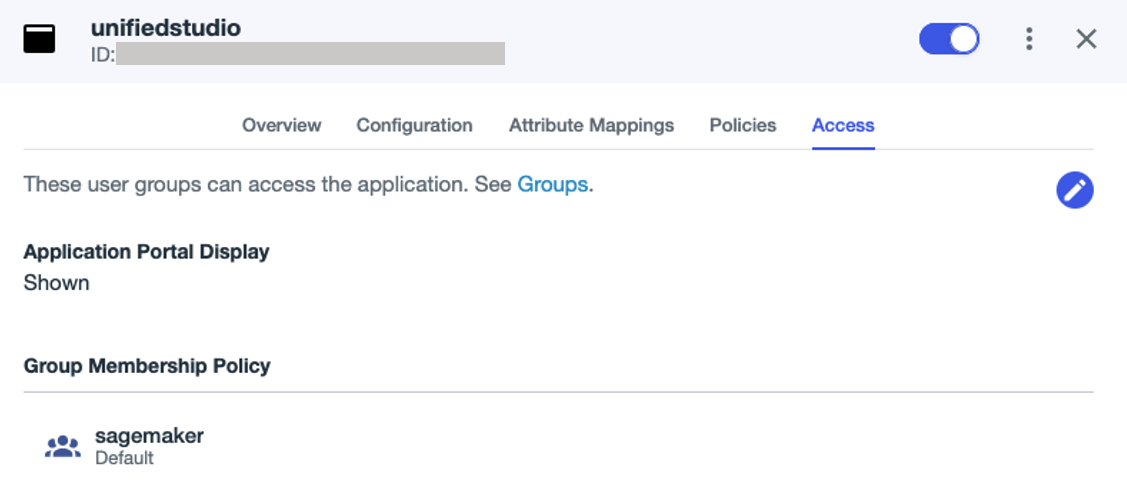
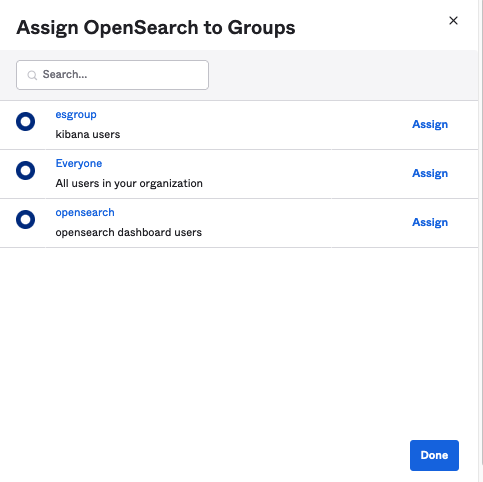
- On the Access tab, search for the
sagemakergroup under Group Membership Policy, and assign theunifiedstudioSAML application to the group. - Enable the application.


Set up automatic provisioning of users and groups from Ping Identity into IAM Identity Center
To configure the automatic provisioning of users and groups between Ping Identity and IAM Identity Center through SCIM, you must have access to both management consoles. Complete the following steps:
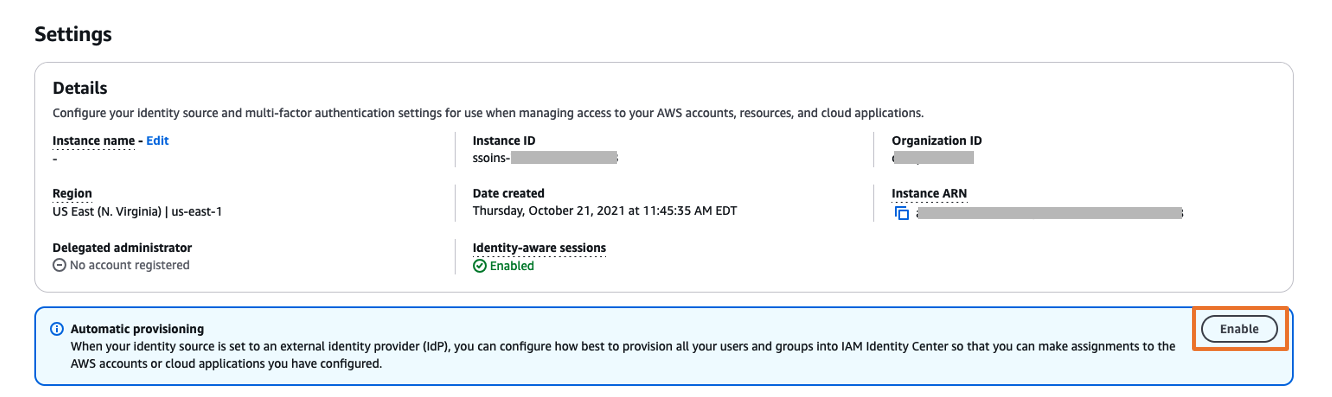
- On the IAM Identity Center console, choose Settings in the navigation pane.
- In the Automatic provisioning section, choose Enable.

This enables automatic provisioning in IAM Identity Center and displays the necessary SCIM endpoint and access token information.
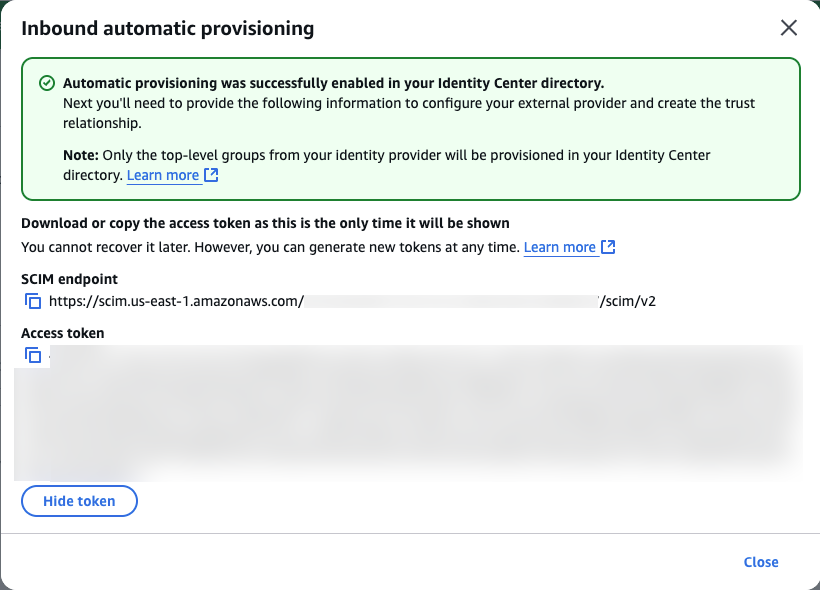
- In the Inbound automatic provisioning dialog box, copy the values for SCIM endpoint and Access token, then choose Close.
You will use these values to configure provisioning in Ping Identity in the next step.
This completes the setup process in IAM Identity Center.
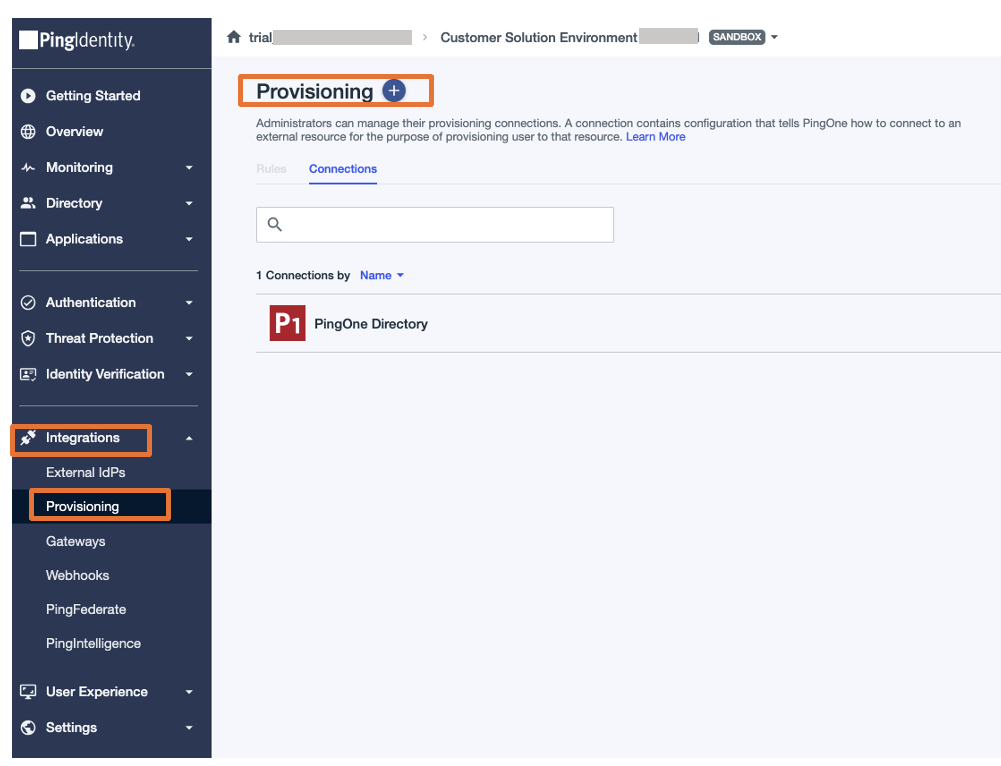
- Log in to the Ping Identity console.
- In the navigation pane, choose Integrations, then choose Provisioning.
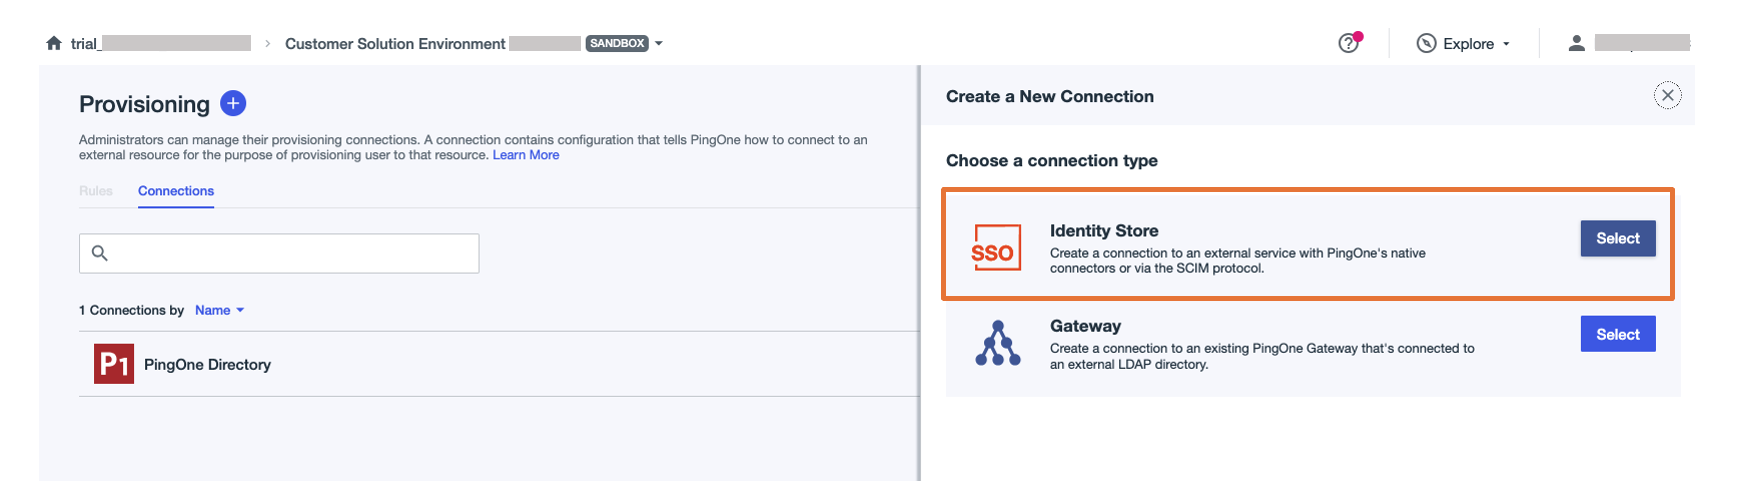
- Choose the plus sign to add a new connection.

- For Choose a connection type, choose Select next to Identity Store.

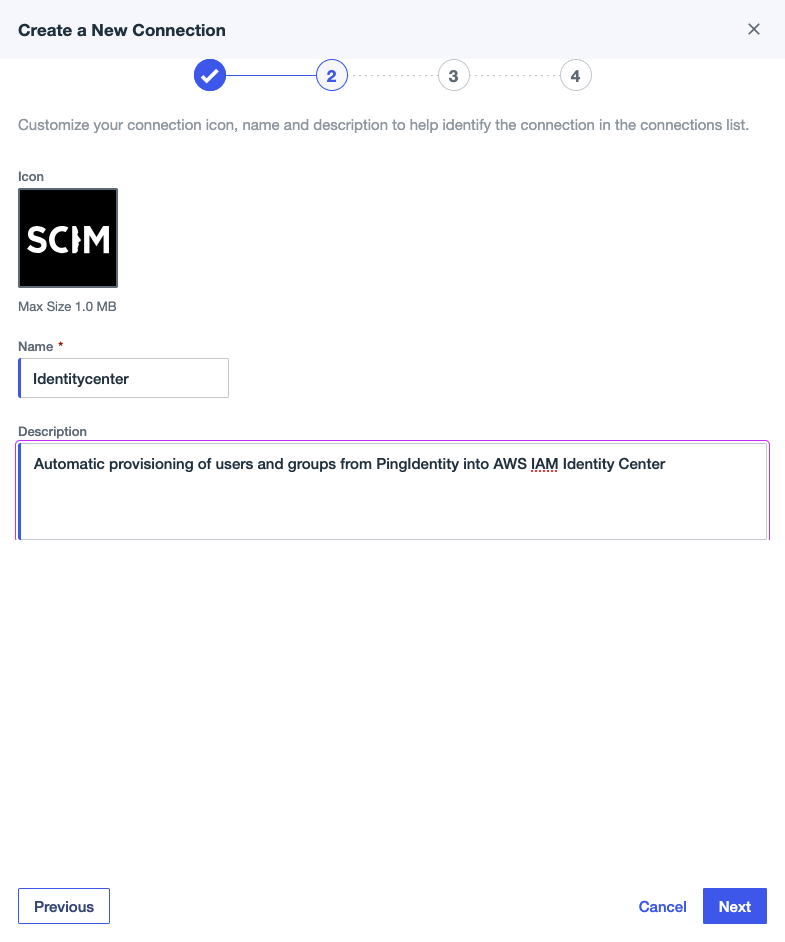
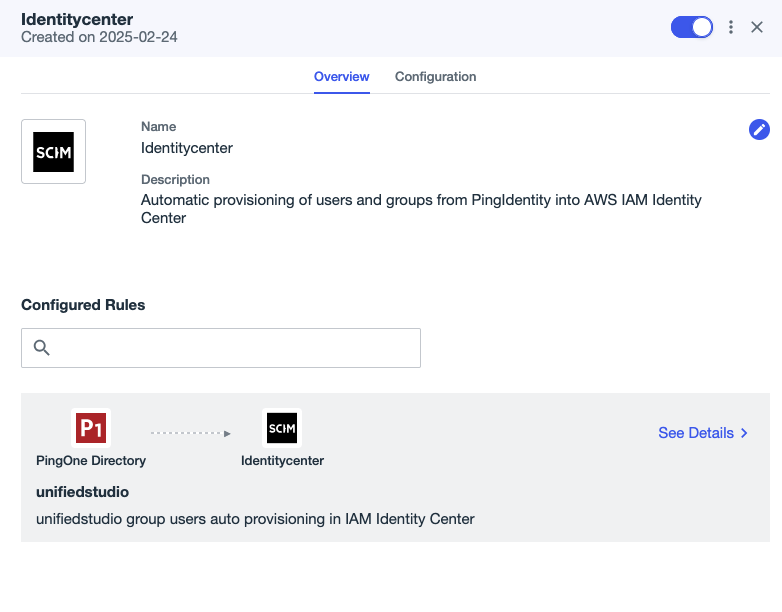
- Provide a name (for this example, we use
Identitycenter) and an optional description, then choose Next.

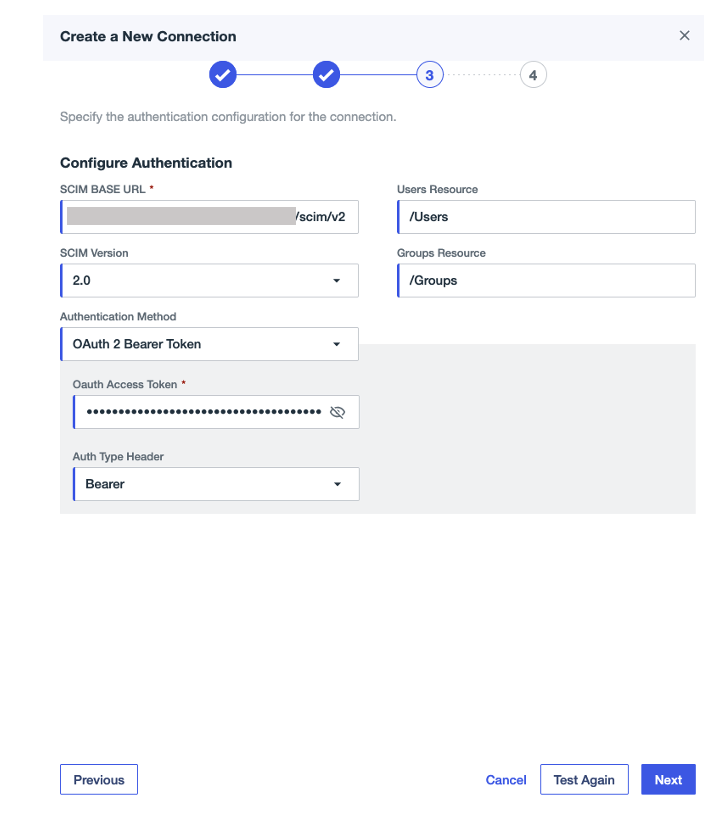
- Under Configuration Authentication, provide the following configuration:
- For SCIM BASE URL, enter the SCIM endpoint from IAM Identity Center.
- For Authentication Method, choose OAuth 2 Bearer Token.
- For Oauth Access Token, enter the access token from IAM Identity Center.
- For Auth Type Header, choose Bearer (default option).
- Choose Test Connection to validate the connection between Ping Identity and IAM Identity Center, then choose Next.

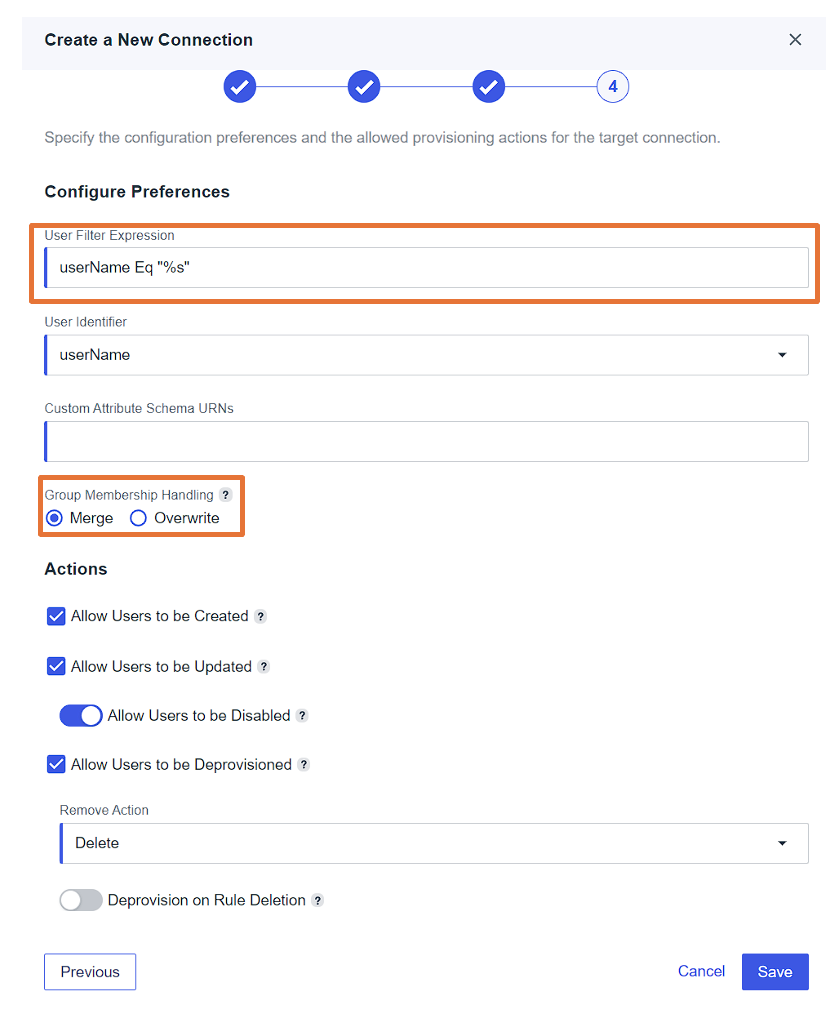
- Under Configuration Preference, provide the following configuration:
- For User Filter Expression, enter
userName Eq “%s”. - For Group Membership Handling, select Merge.
- Leave the remaining settings as default and choose Save.

- For User Filter Expression, enter
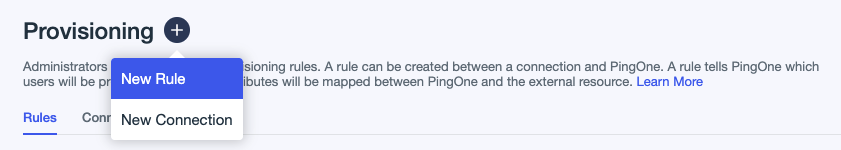
- On the Provisioning tab, choose the plus sign, then choose New Rule to create a rule for the SCIM connection.

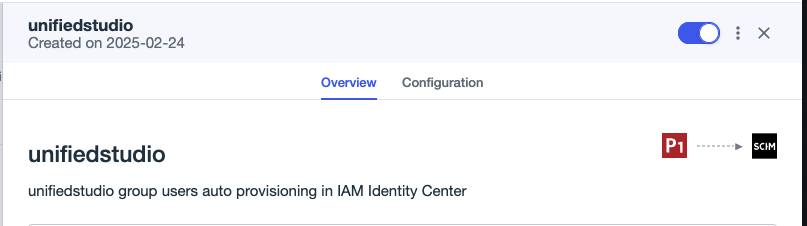
- Enter a name (for this example,
unifiedstudio) and an optional description, then choose Create Rule. - Under the newly created rule, choose the plus sign next to Available Connections to add the connection
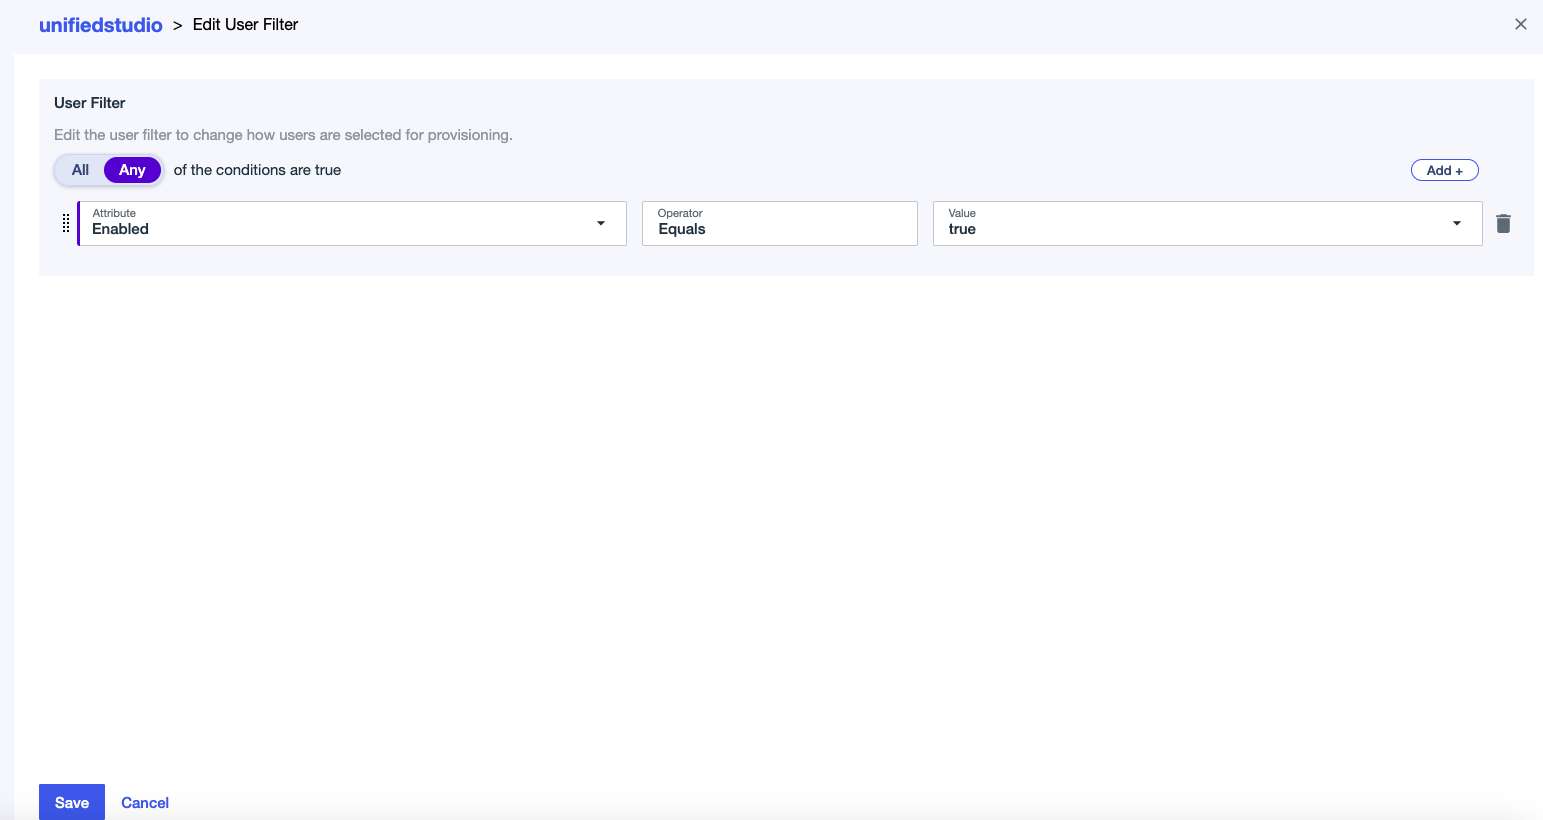
identitycenter, then choose Save. - Edit the user filter:
- For Attribute, choose Enabled.
- For Operator, choose Equals.
- For Value, choose true.
- Choose Save.

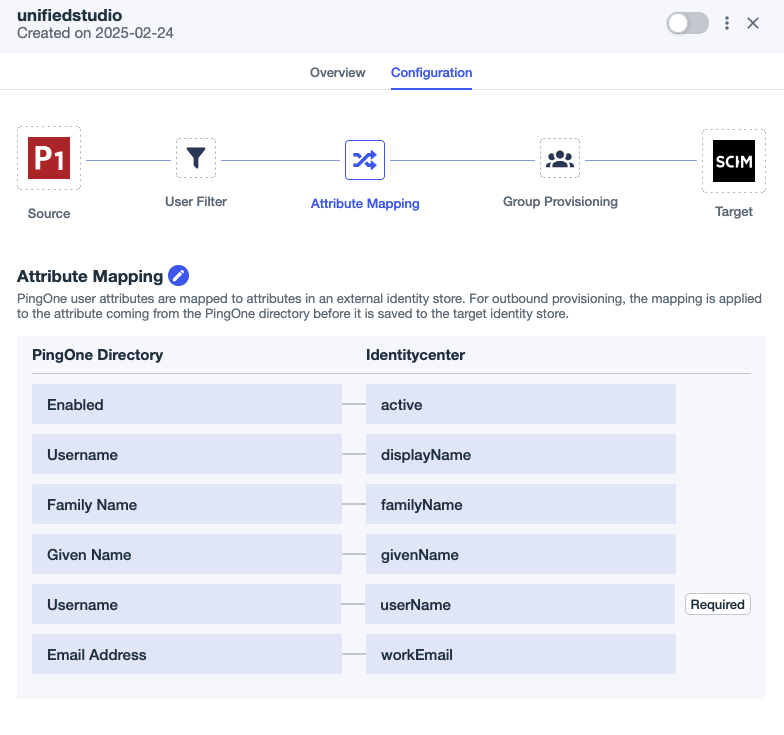
- Choose the edit icon next to Attribute Mapping and set the attribute mappings as shown in the following screenshot:
- Delete the Primary Phone attribute mapping because it’s optional in AWS. Leaving this field blank can cause Ping Identity’s SCIM connector to generate errors during user provisioning.
- Add a new attribute called
Usernameunder PingOne Directory and then map todisplayNameunder Identitycenter.

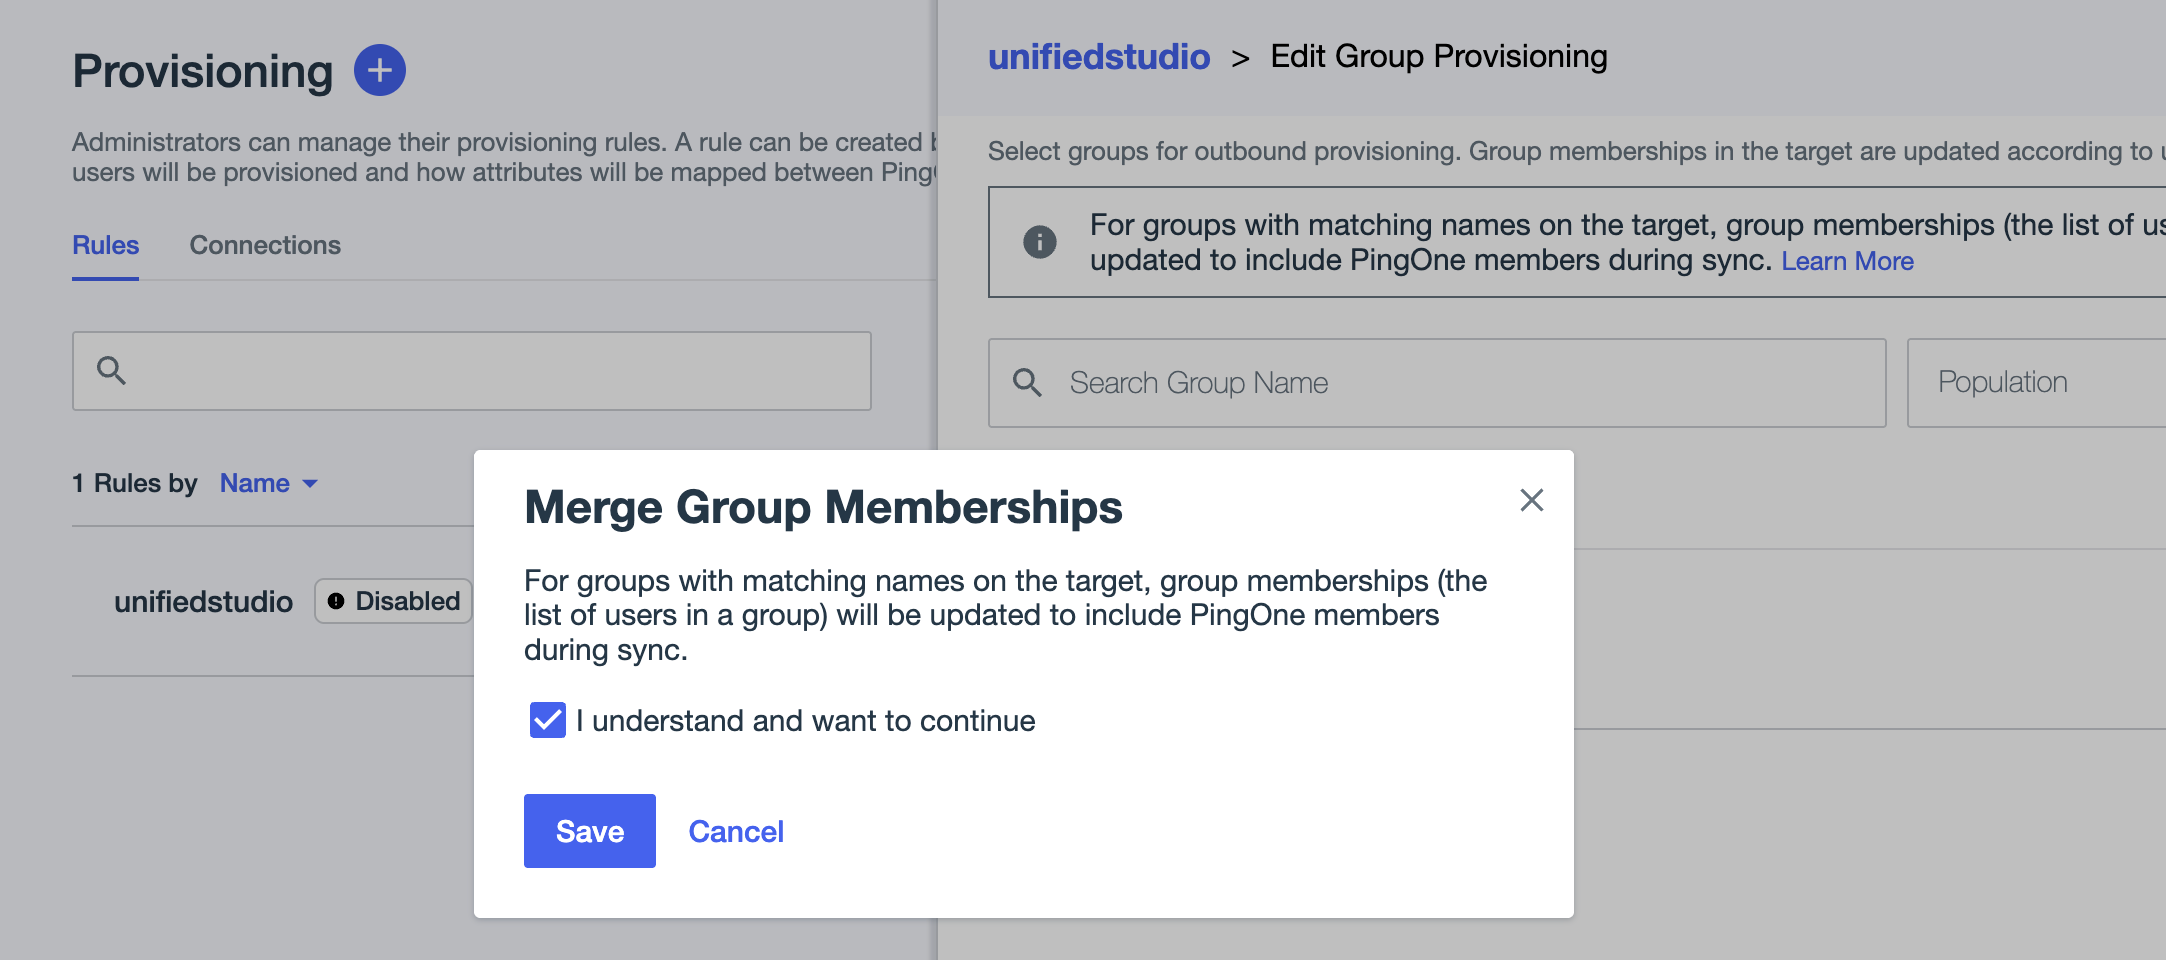
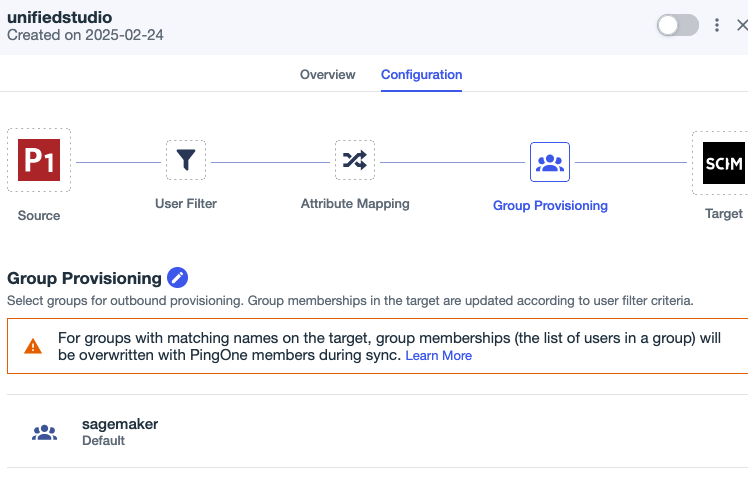
- Under Group Provisioning, choose the
sagemakergroup if you want to sync allsagemakergroup users with auto provisioning.- In the pop-up, select I understand and want to continue, then choose Save.


- On the Provisioning page, choose the Connections tab.
- Enable the SCIM connection
Identitycenterand ruleunifiedstudio.

This completes the SCIM setup process between Ping Identity and IAM Identity Center.
Configure SageMaker Unified Studio SSO user access
Complete the following steps to configure SSO user access to SageMaker Unified Studio for your SageMaker domain:
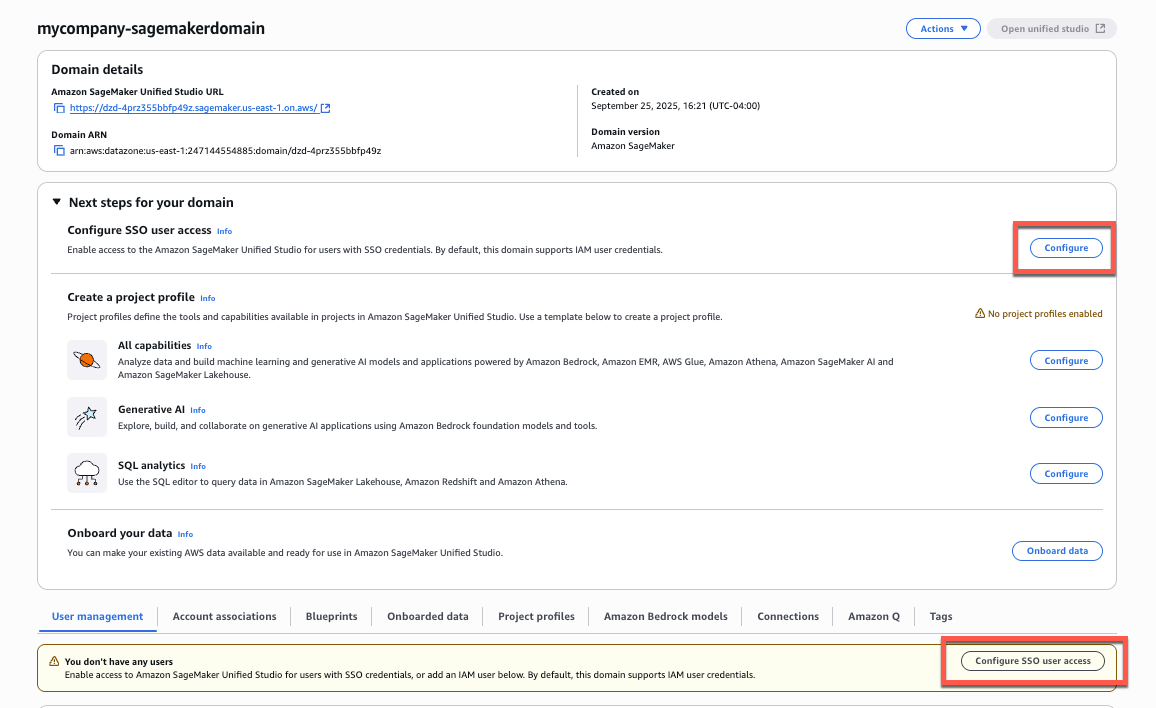
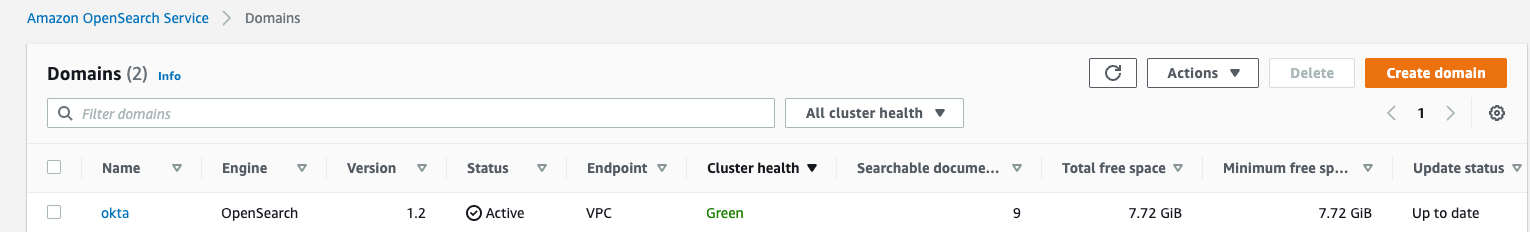
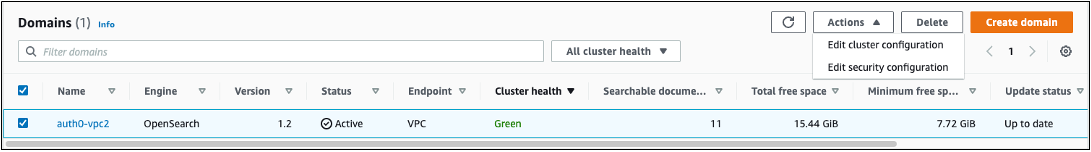
- On the SageMaker console, choose Domains in the navigation pane.
- Choose the domain for which you want to configure SAML user access.
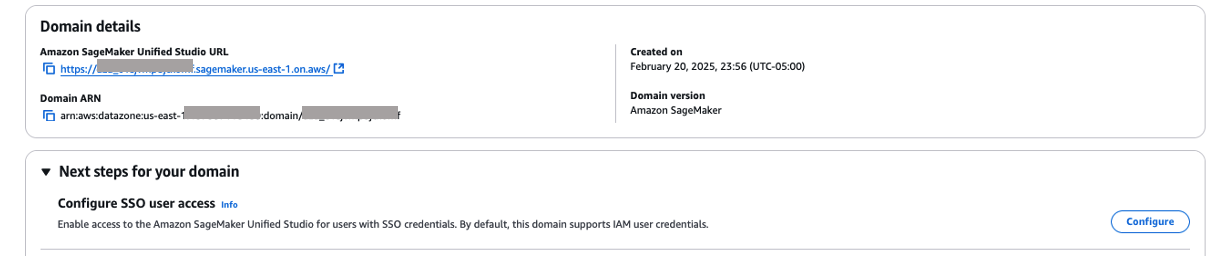
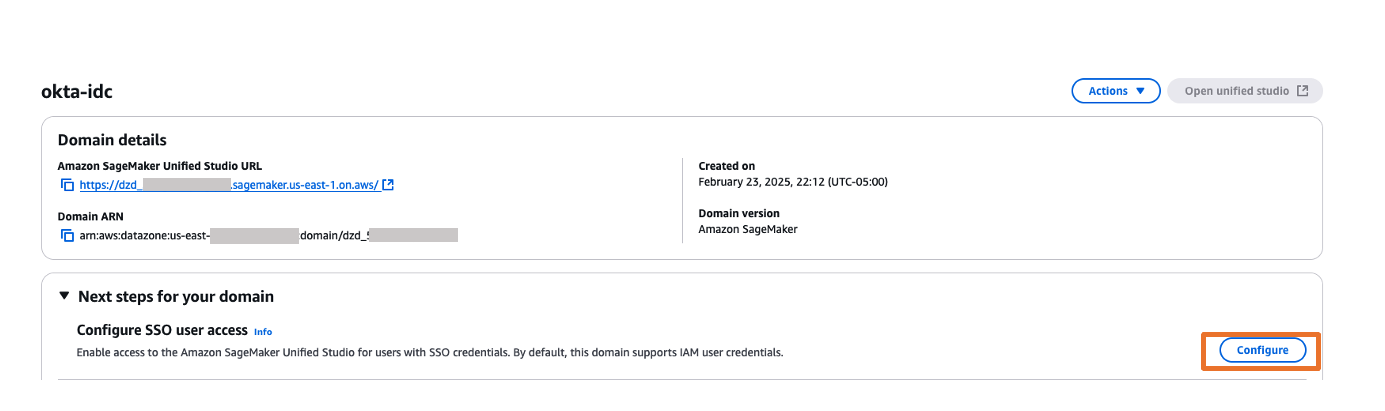
- On the domain details page, you can find the SSO configuration in two locations:
- From the main domain view, choose Configure next to Configure SSO user access.
- Alternatively, scroll down to the User management tab and choose Configure SSO user access.

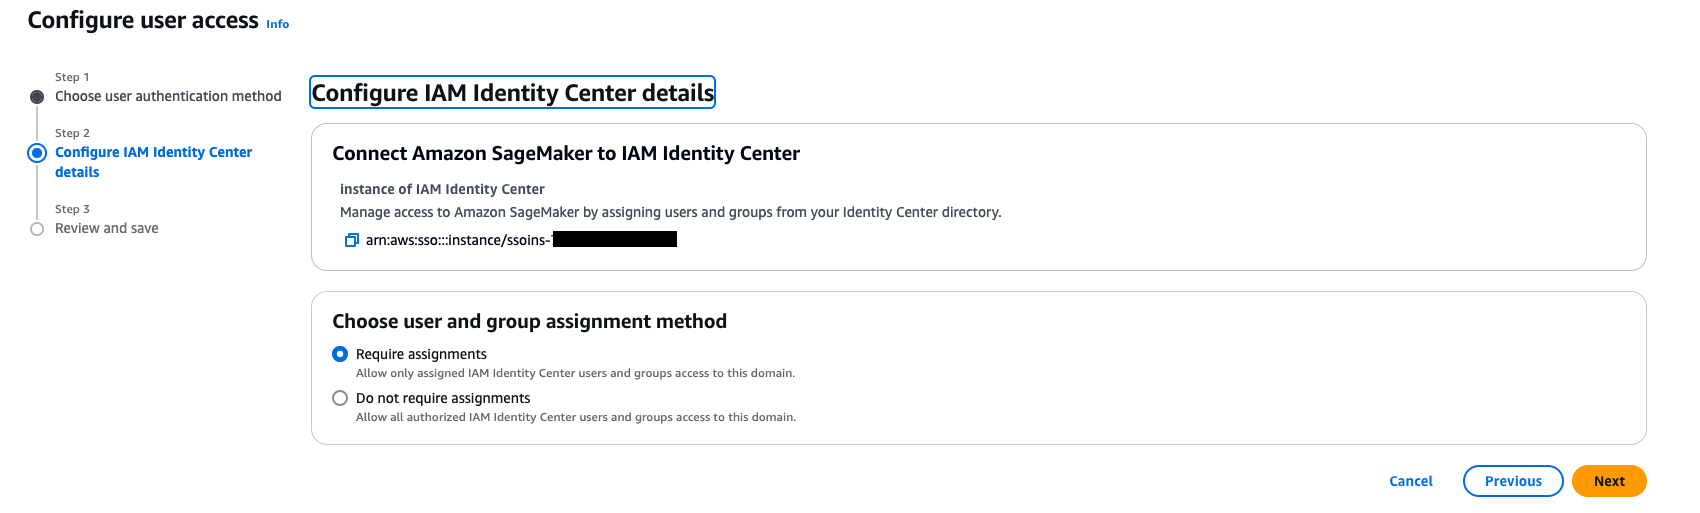
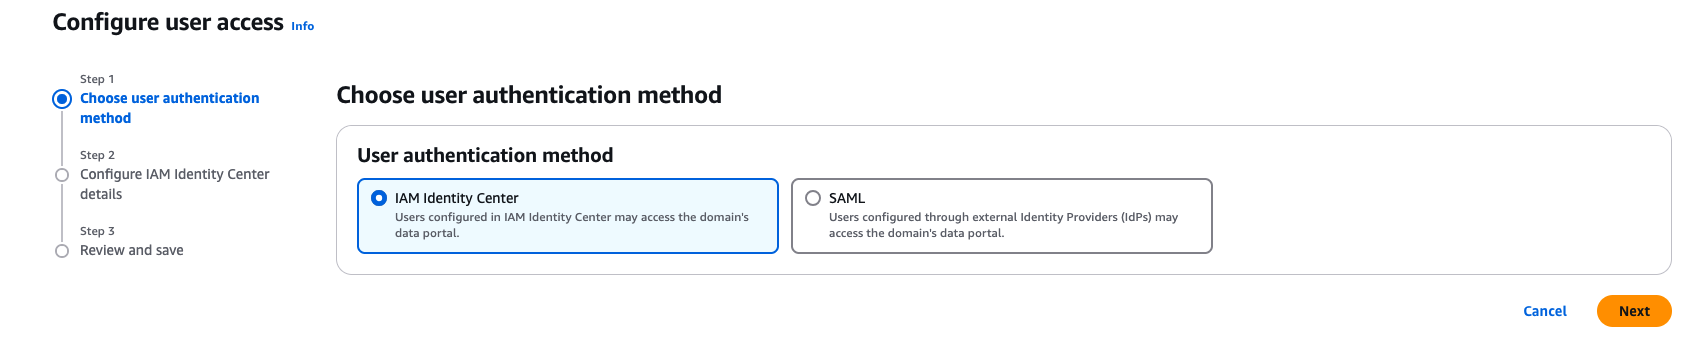
- On the Choose user authentication method page, select IAM Identity Center, then choose Next.

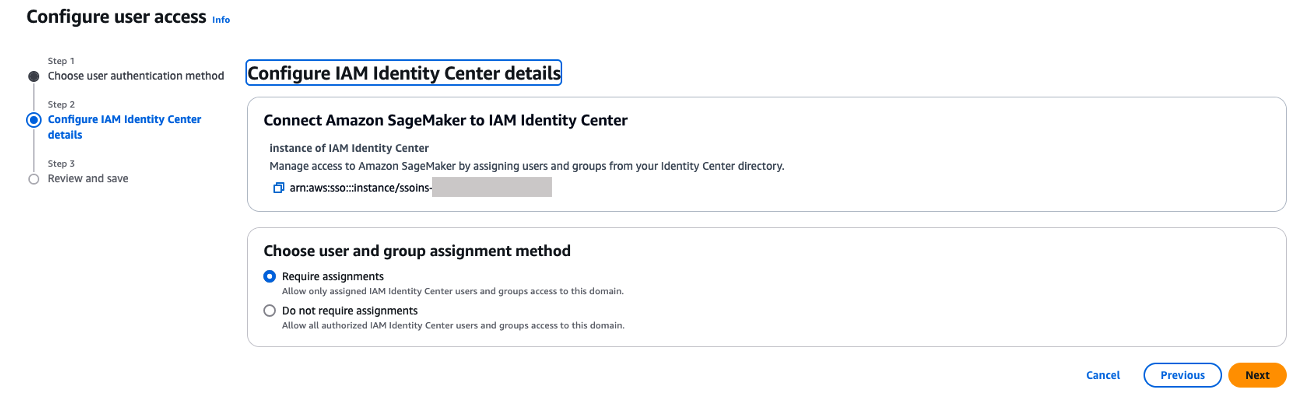
- For Choose user and group assignment method, choose from the following options, then choose Next:
- Require assignments: Users and groups must be explicitly added to the domain to gain access. This provides more granular control over who can access the domain.
- Do not require assignments: All authorized Ping Identity users and groups can access this domain if they have been assigned to the SAML application in Ping Identity.
For either option, users or groups must have access to the Ping Identity SAML application (
unifiedstudioin this example) to authenticate successfully.
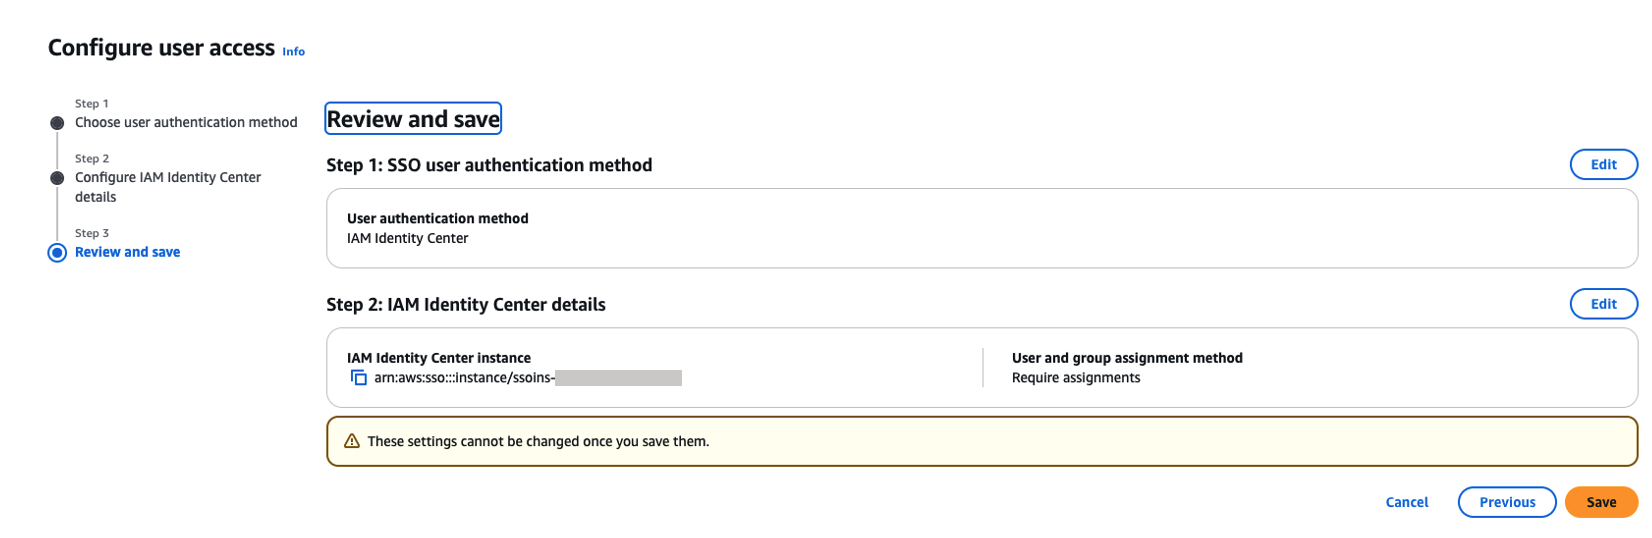
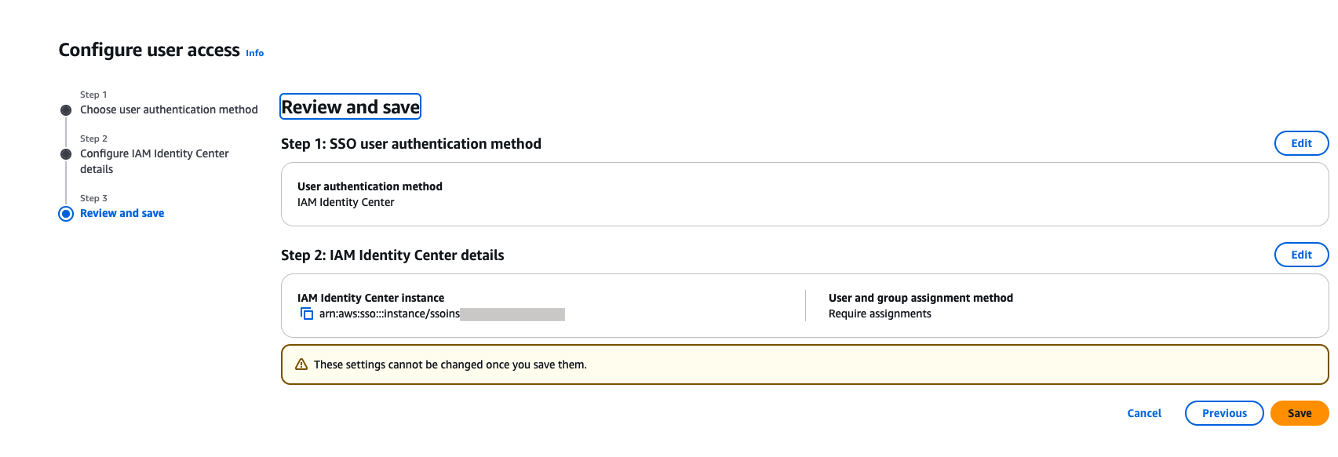
- On the Review and save page, review your choices and choose Save. These settings can’t be changed after you save them.

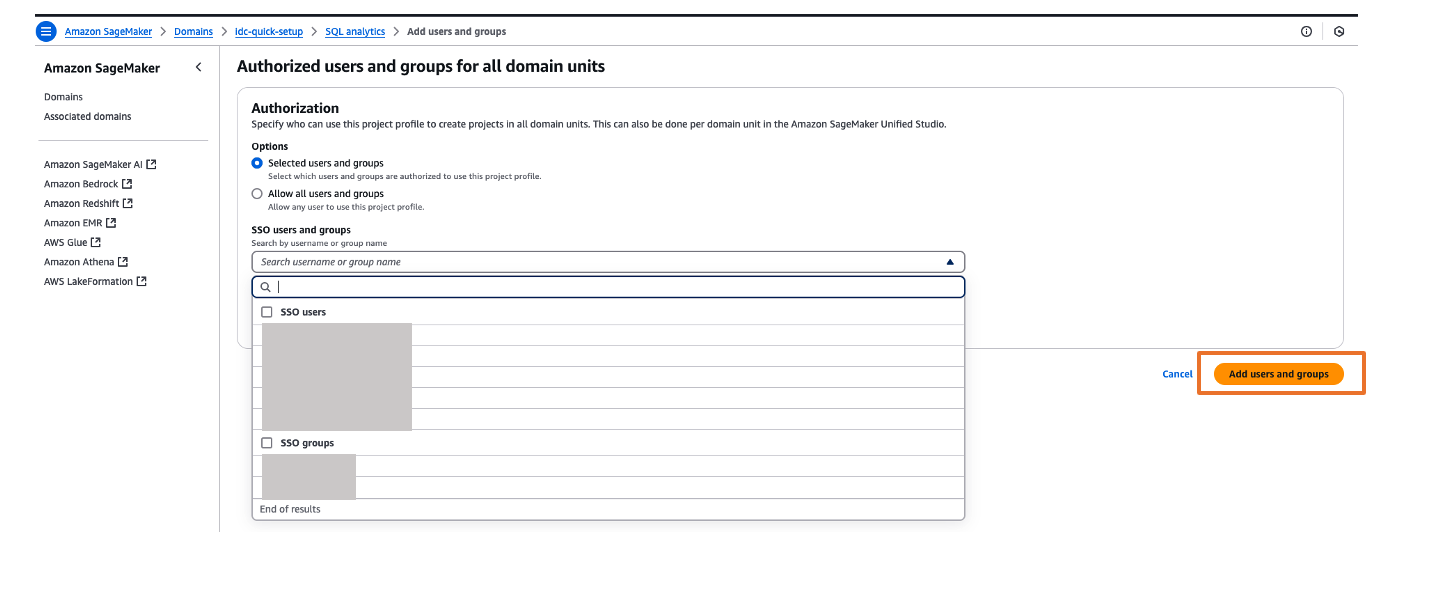
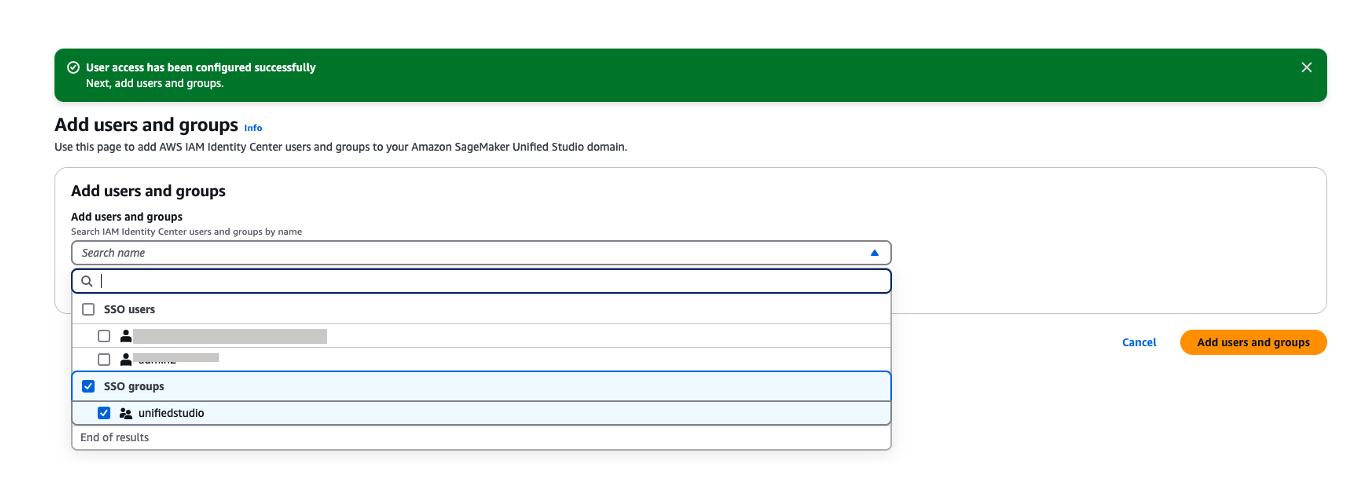
- If you’ve chosen to require assignments, use the Add users and groups section to add SAML users and groups to your domain.


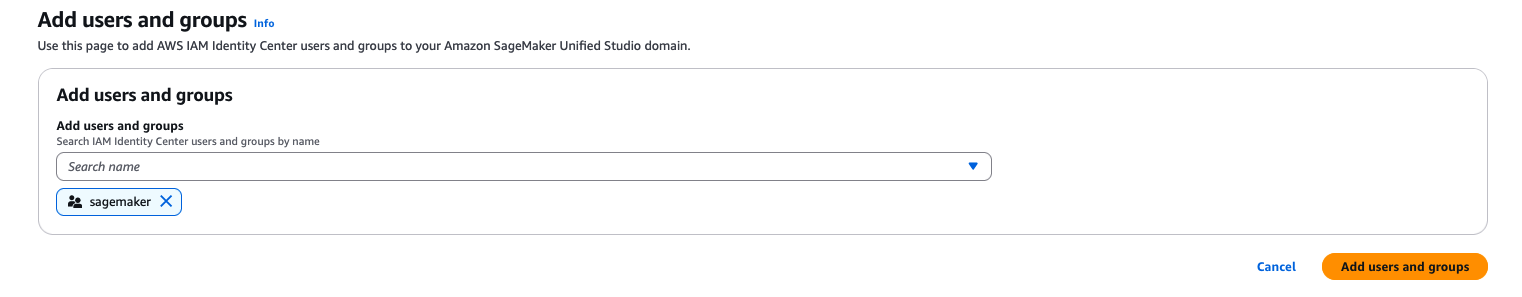
Now, users will be able to access SageMaker Unified Studio using the domain URL with their SSO credentials.
You can explore different projects for your users and assign those projects based on your IdP user groups for fine-grained access controls. For example, you can create different SAML user groups based on their job function in Ping Identity, then assign those Ping Identity groups to the unifiedstudio SAML application in Ping Identity, and then assign those Ping Identity SAML groups to their respective project profiles in SageMaker Unified Studio. To assign project profiles for their respective groups, choose the Project profiles tab and choose your project profile. On the Authorized users and groups page, choose Add, then choose SSO groups. Choose Add users and groups button to complete the project profile assignment.
Validate access with Ping Identity users
Complete the following steps to validate access:
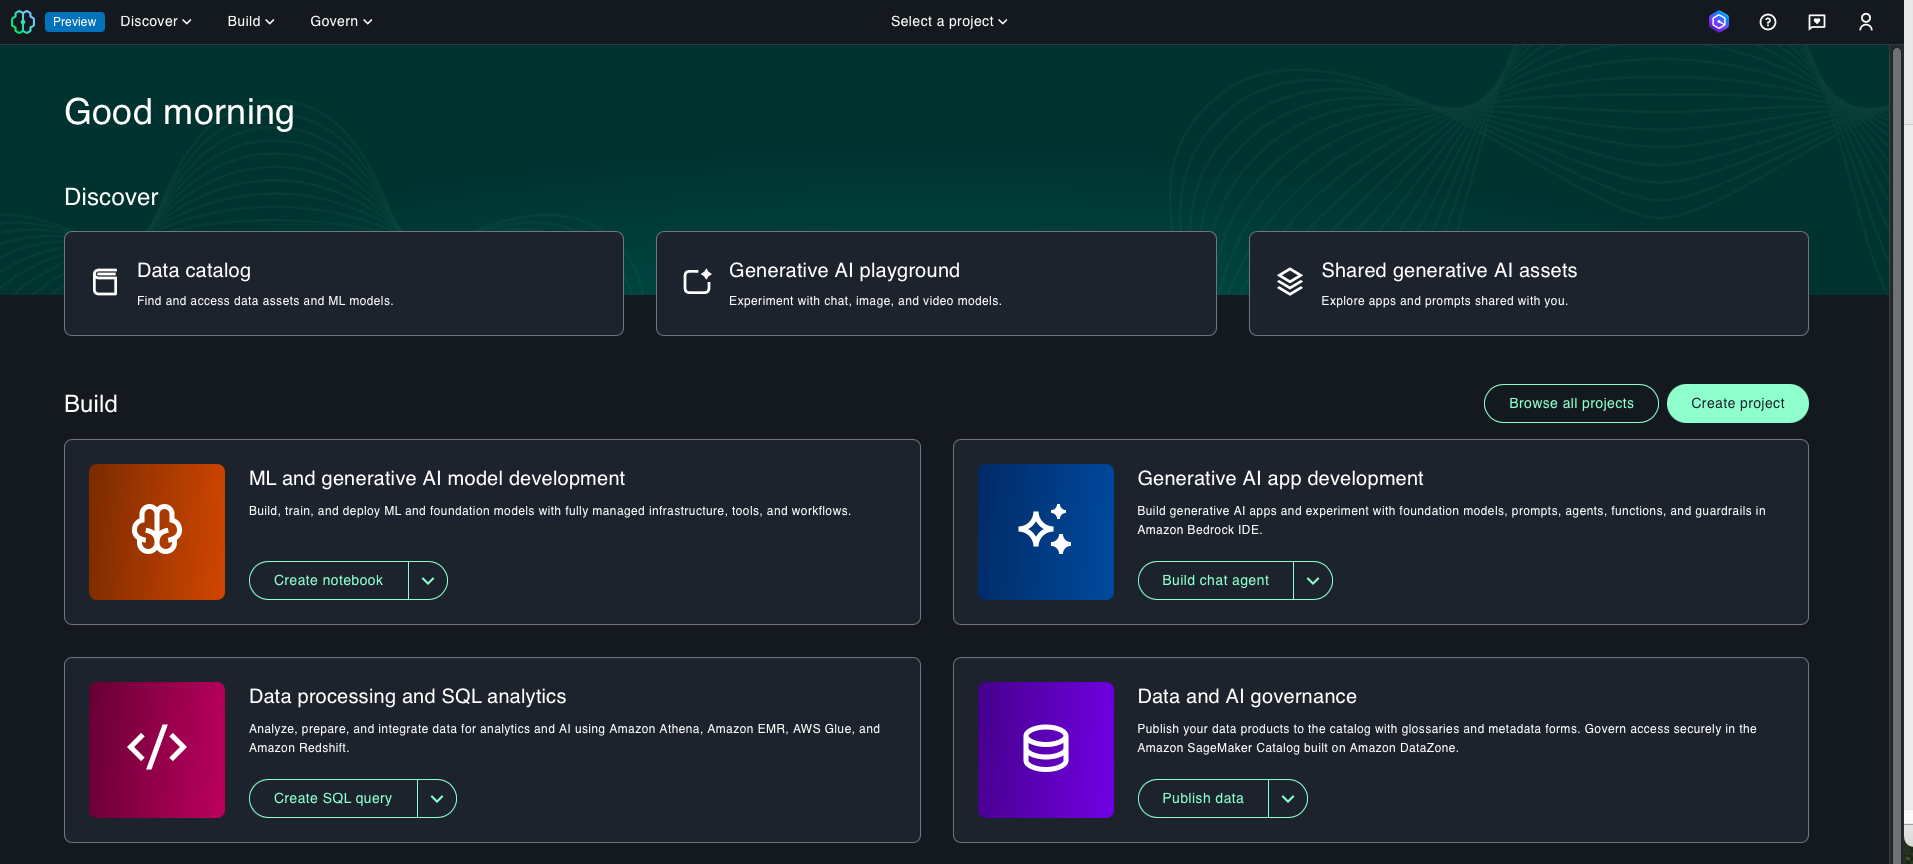
- On the SageMaker domain details page, choose the link for the SageMaker Unified Studio URL.

- Log in with your user credentials.
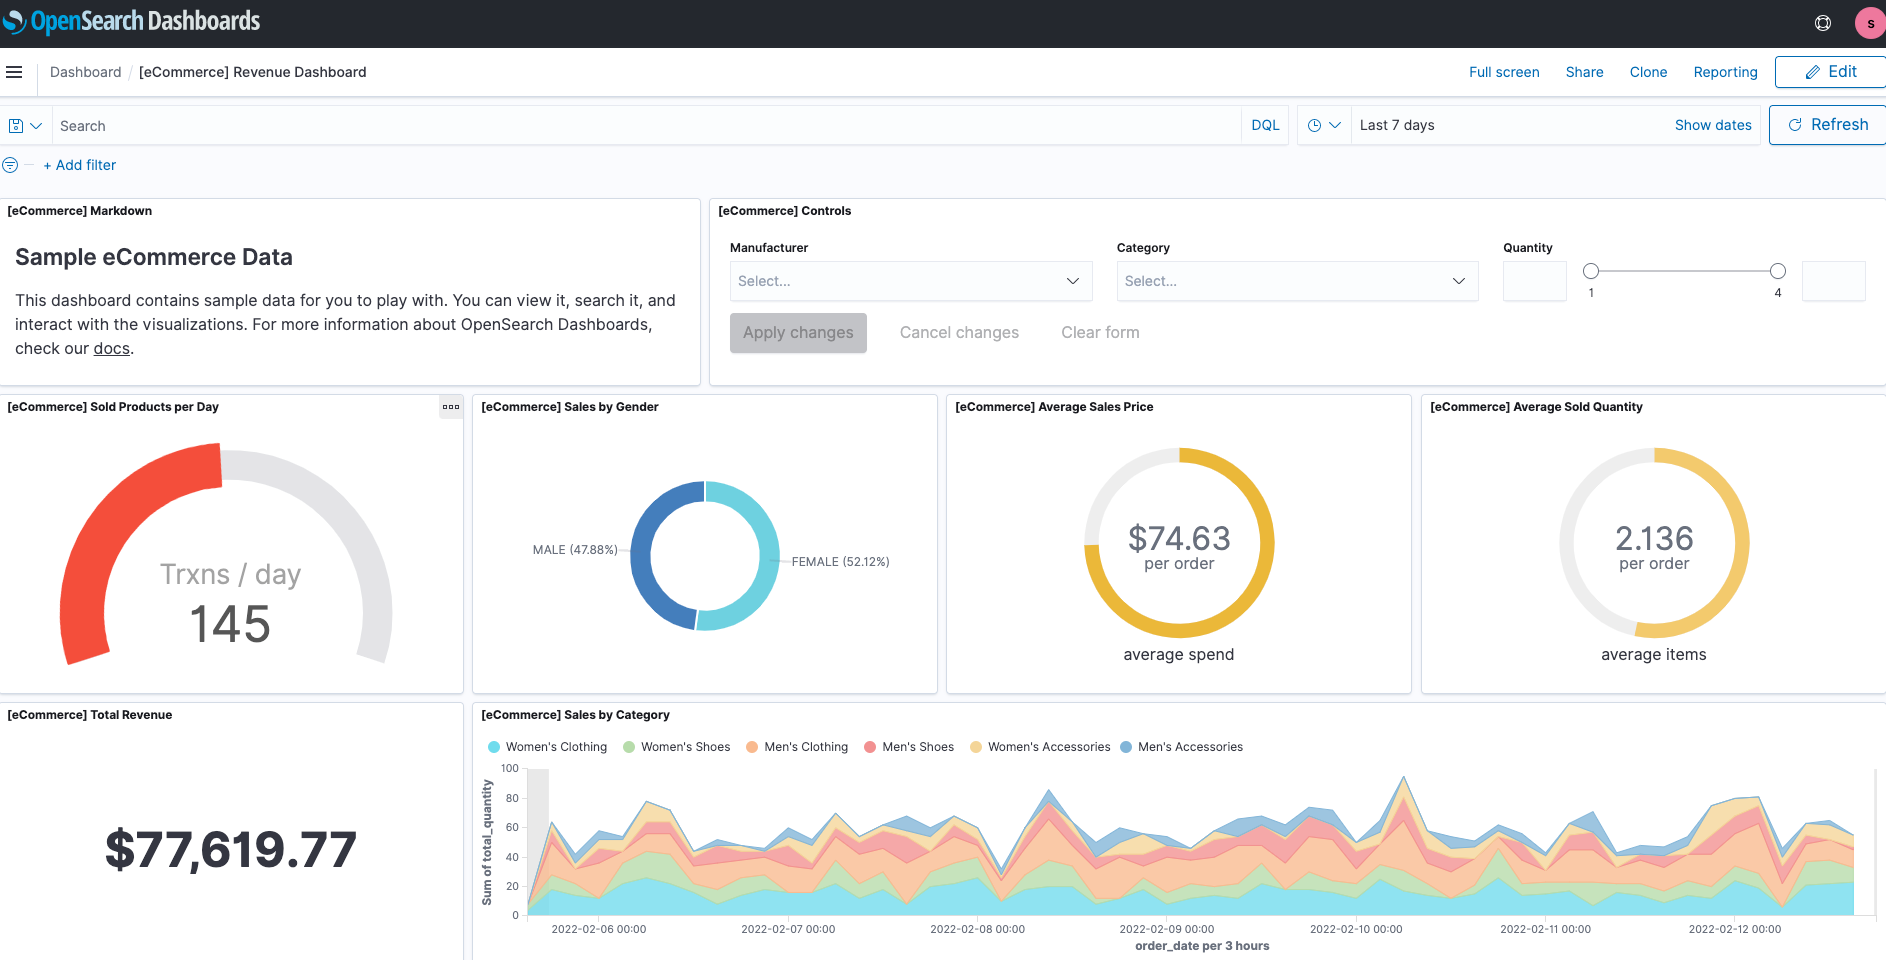
After successful login, you will be redirected to the SageMaker Unified Studio home page. Here, you can explore different projects to your users and assign those projects based on your SAML user groups for fine-grained access control.
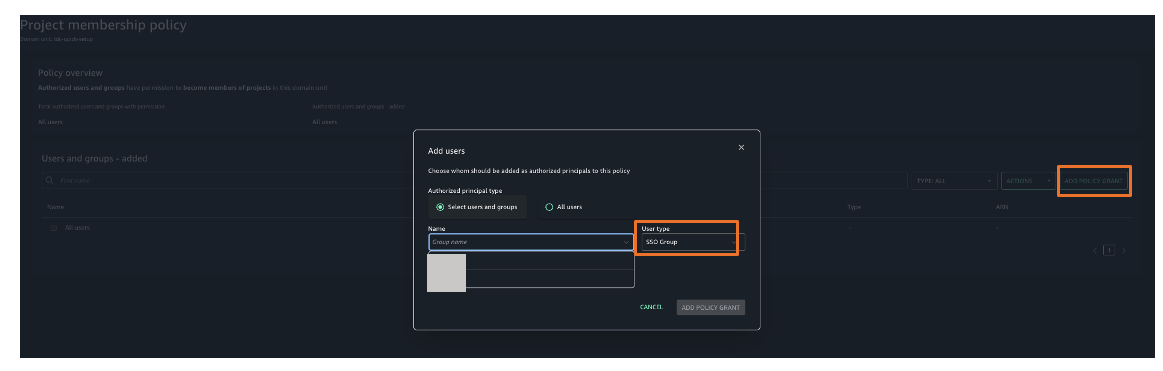
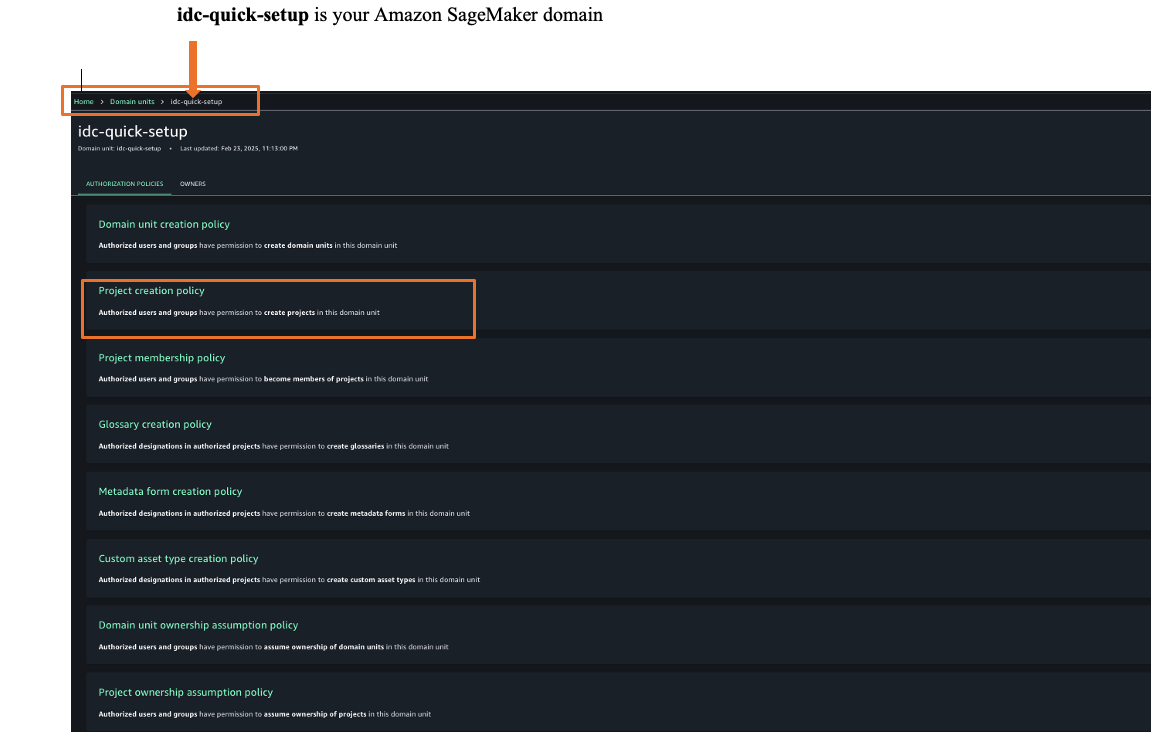
- To assign an authorization policy, those Govern and then Domain units.
- Choose your SageMaker domain, then choose a suitable authorization policy. For this example, we choose Project creation policy.

- Choose Add policy grant to assign user groups or users to their respective project profiles.


You have successfully federated SageMaker Unified Studio with Ping Identity as an IdP with IAM Identity Center. You can connect to SageMaker Unified Studio by using your Ping Identity credentials.
Clean up
After you test out this solution, remember to delete the resources you created to avoid incurring future charges. For instructions to delete your SageMaker Unified Studio domain, refer to Delete domains. If you want to delete your Ping Identity account, reach out to Ping Identity for assistance.
Conclusion
In this post, we demonstrated how to set up Ping Identity as an IdP over SAML authentication for SageMaker Unified Studio access through IAM Identity Center federation. To learn more, refer to the Amazon SageMaker Unified Studio User Guide, which provides guidance on how to build data and AI applications using SageMaker.
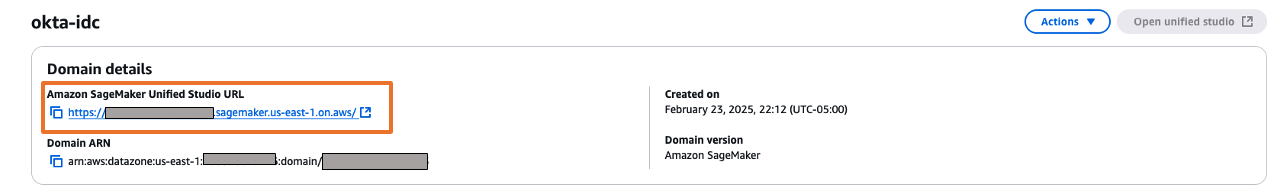
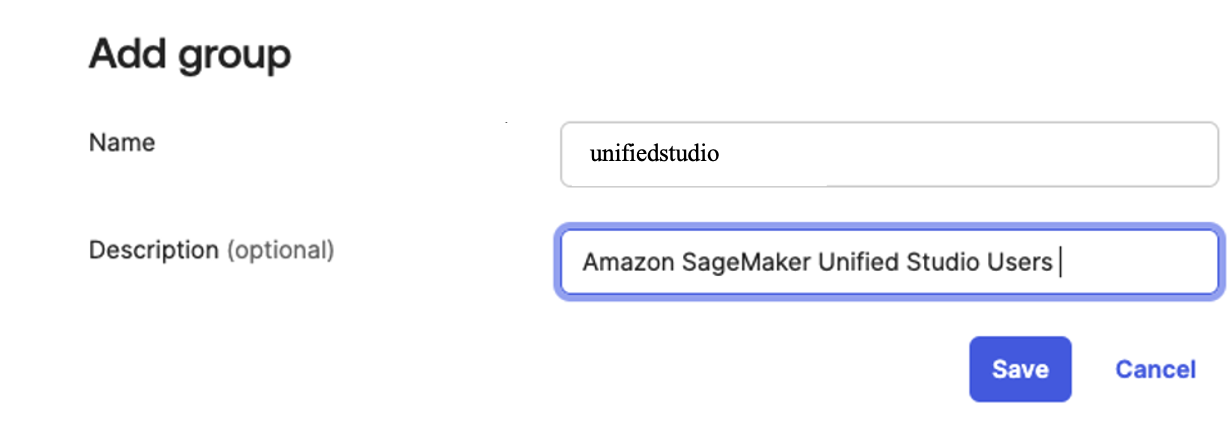
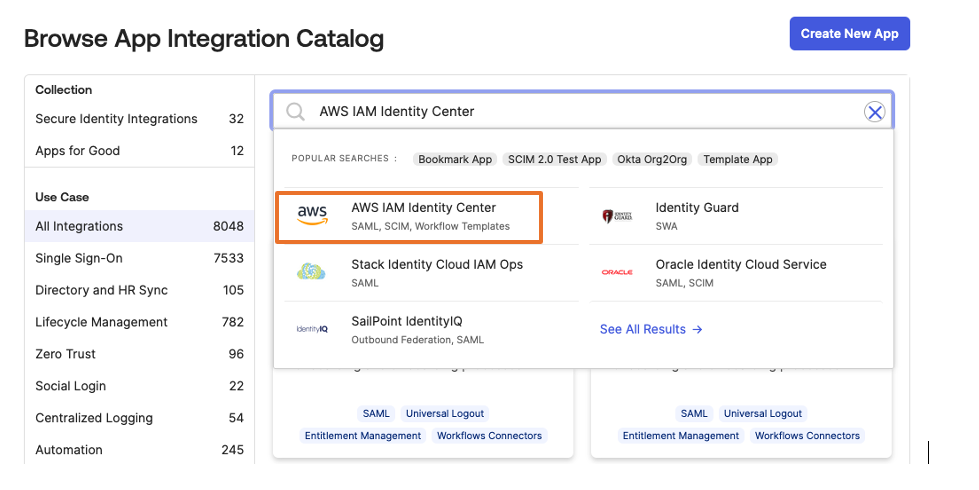
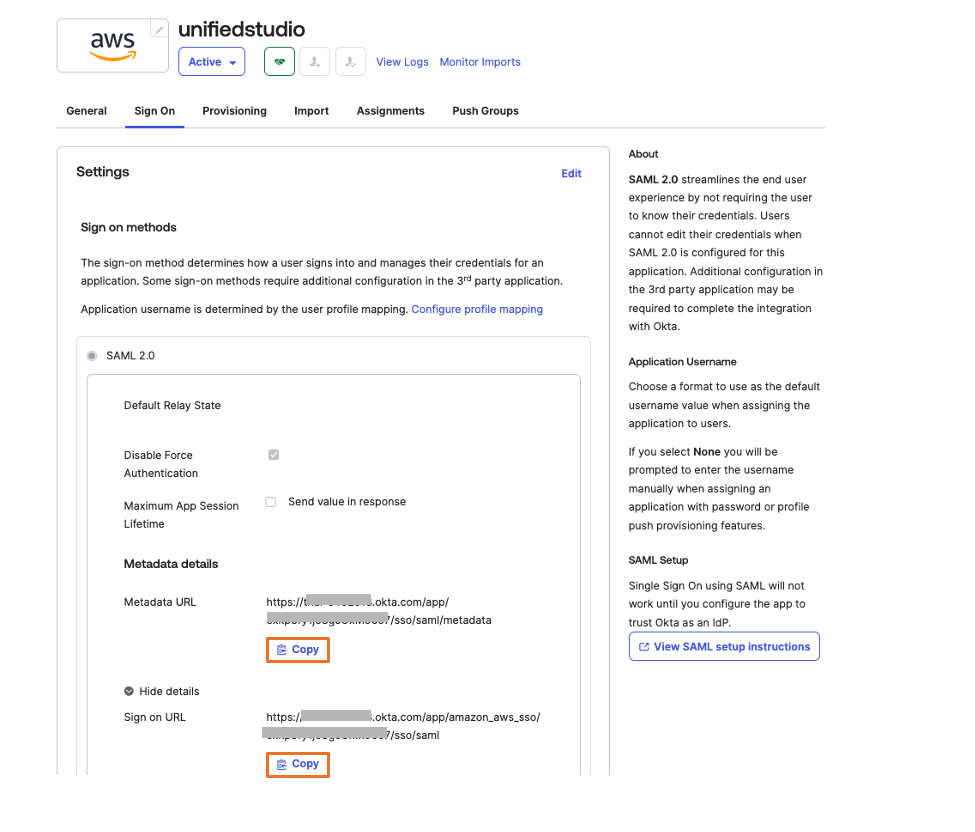
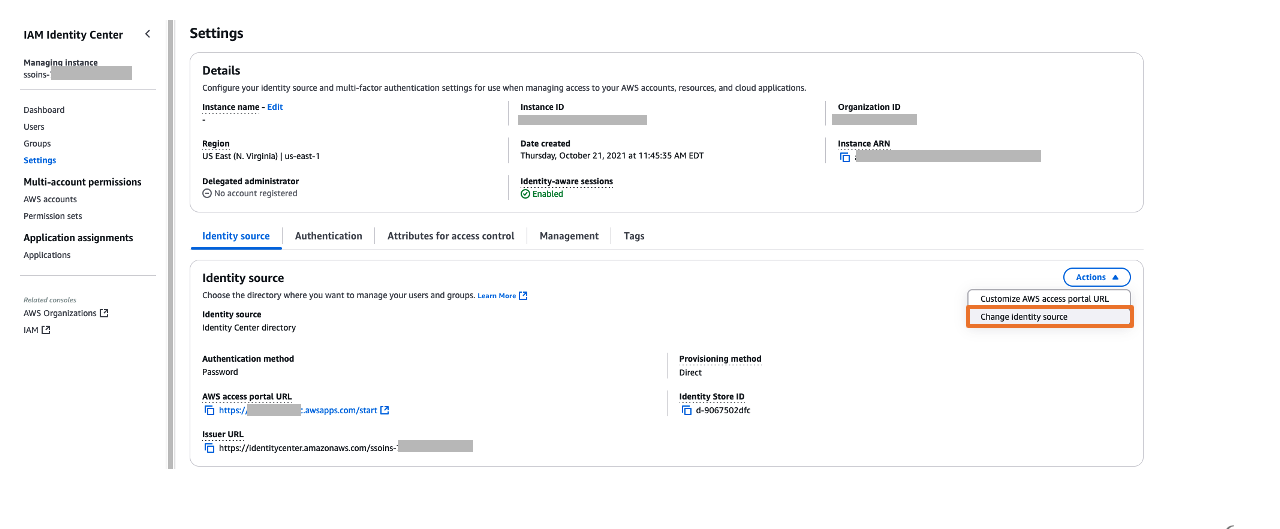 Figure 5: Selecting identity source in AWS IAM Identity Center
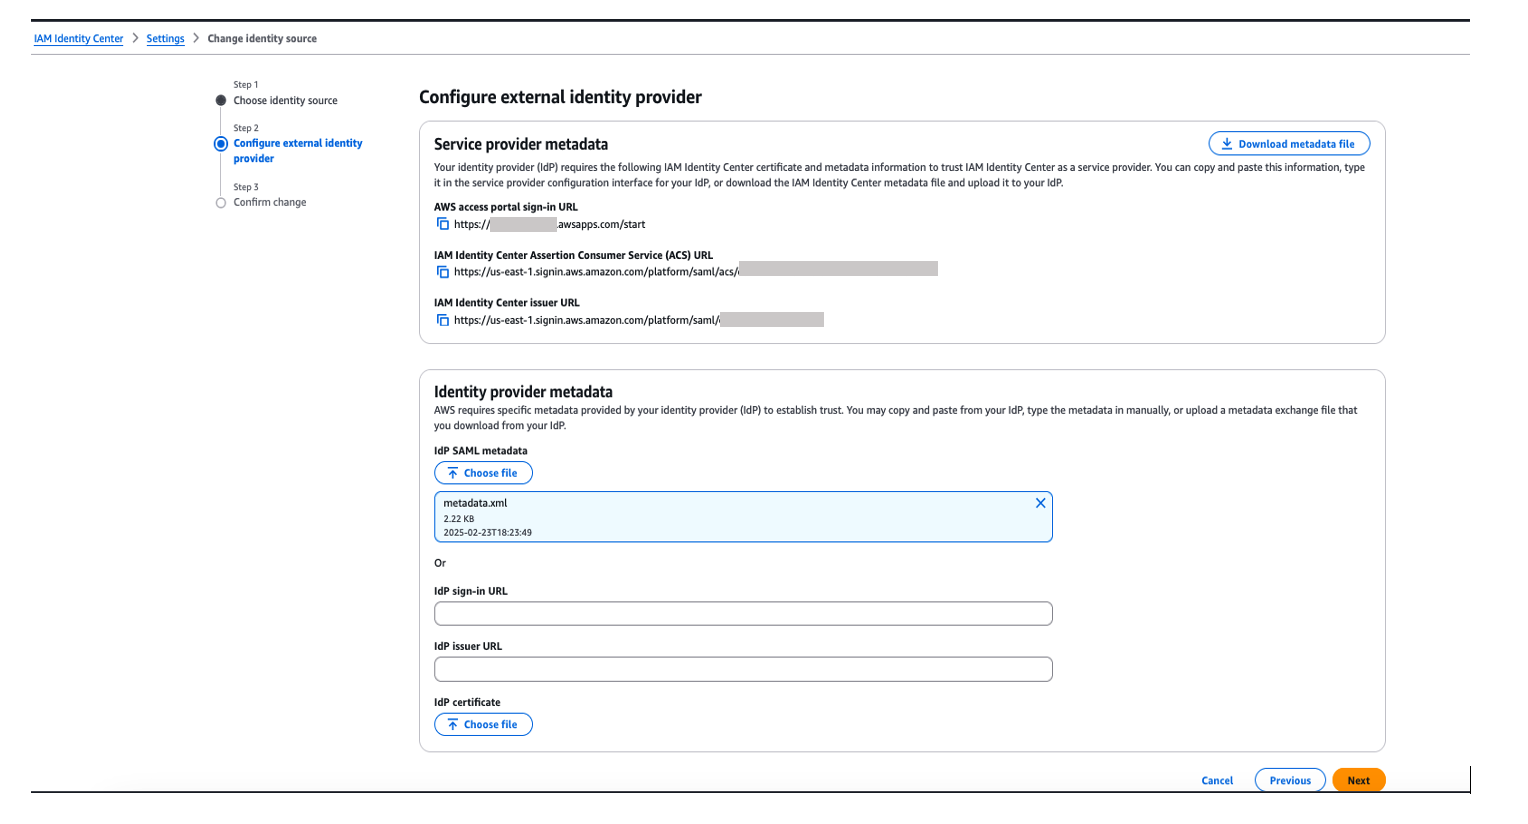
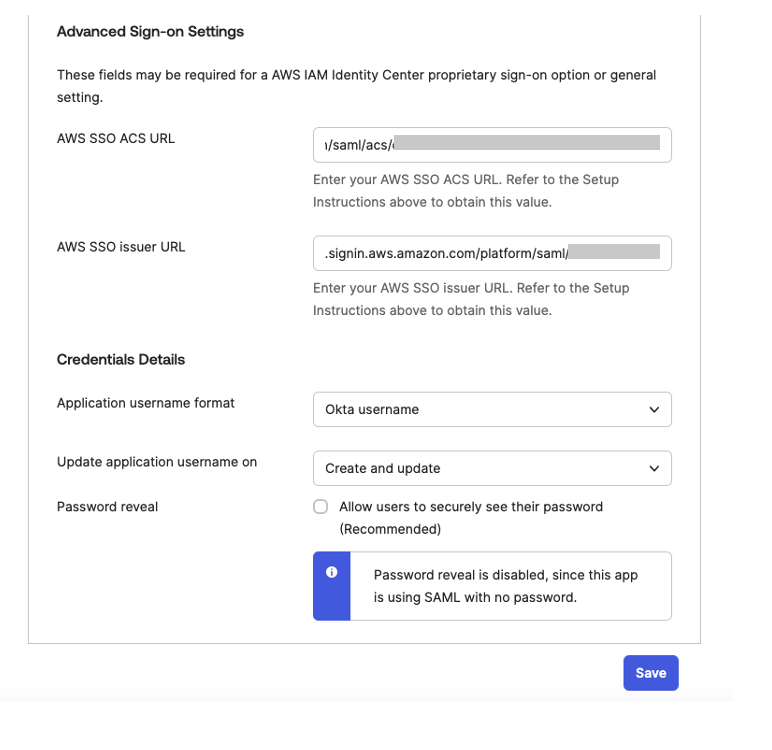 Figure 8. Configuring okta sign-on settings
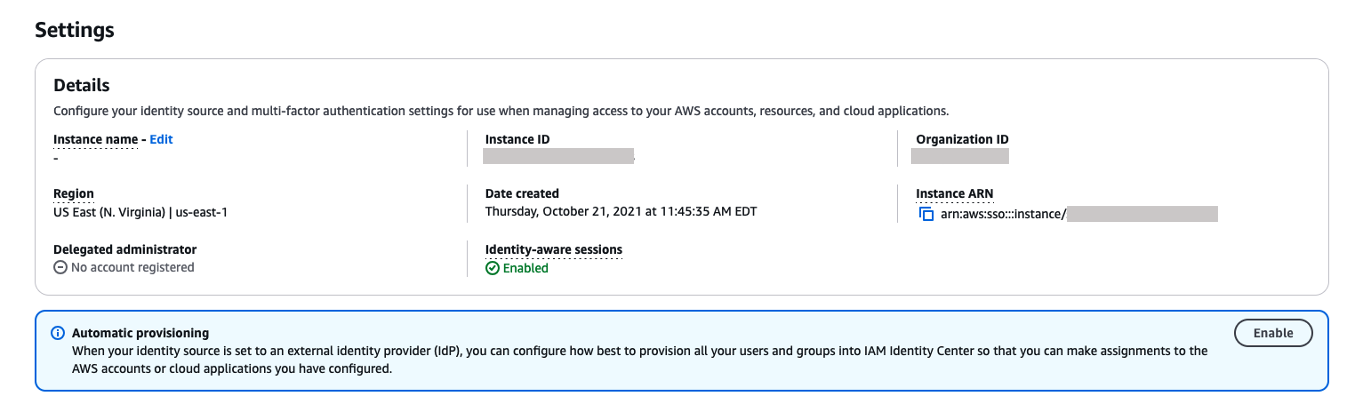
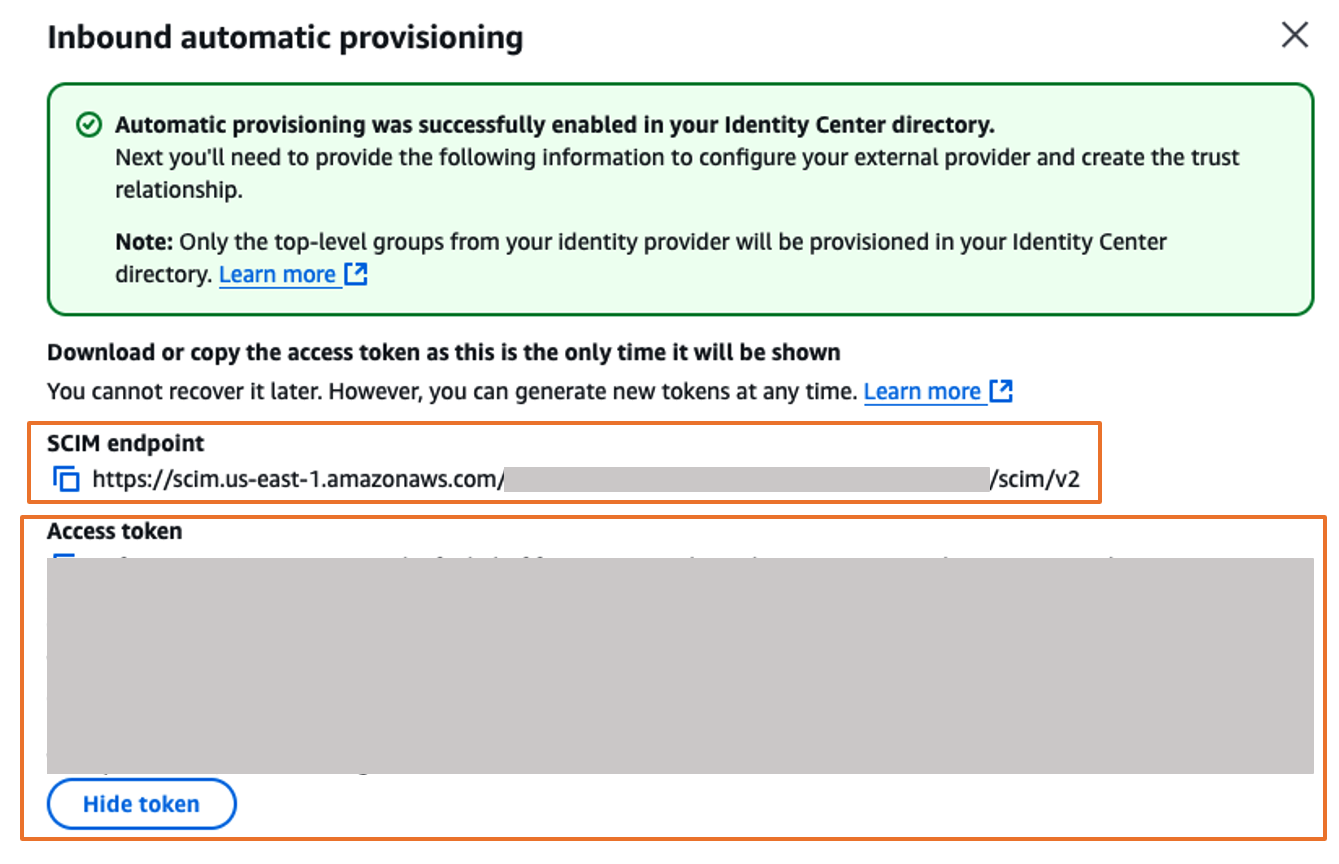 Figure 10. Automatic provisioning configuration parameters in AWS IAM Identity Center
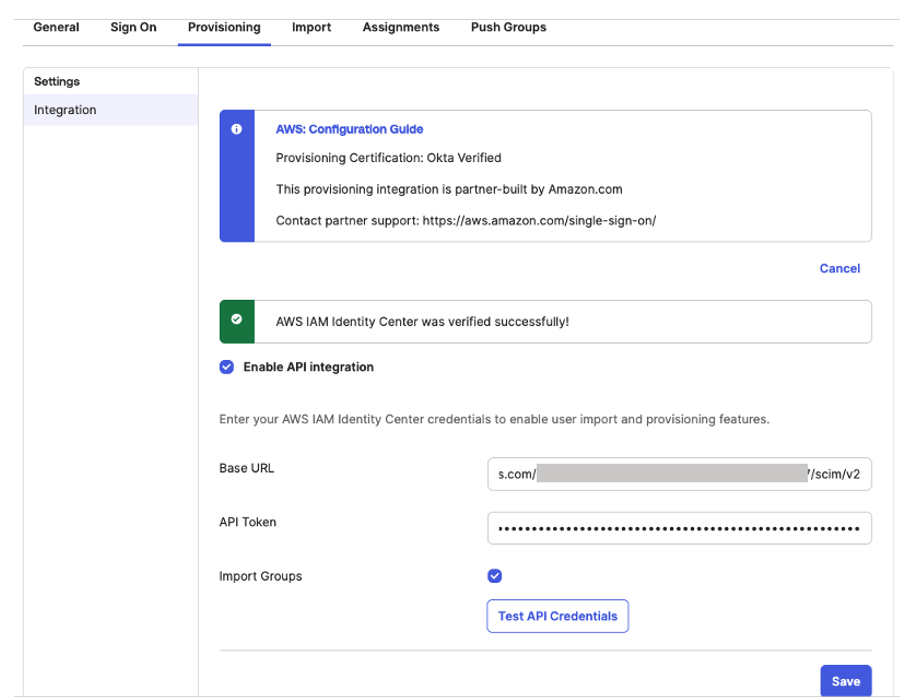
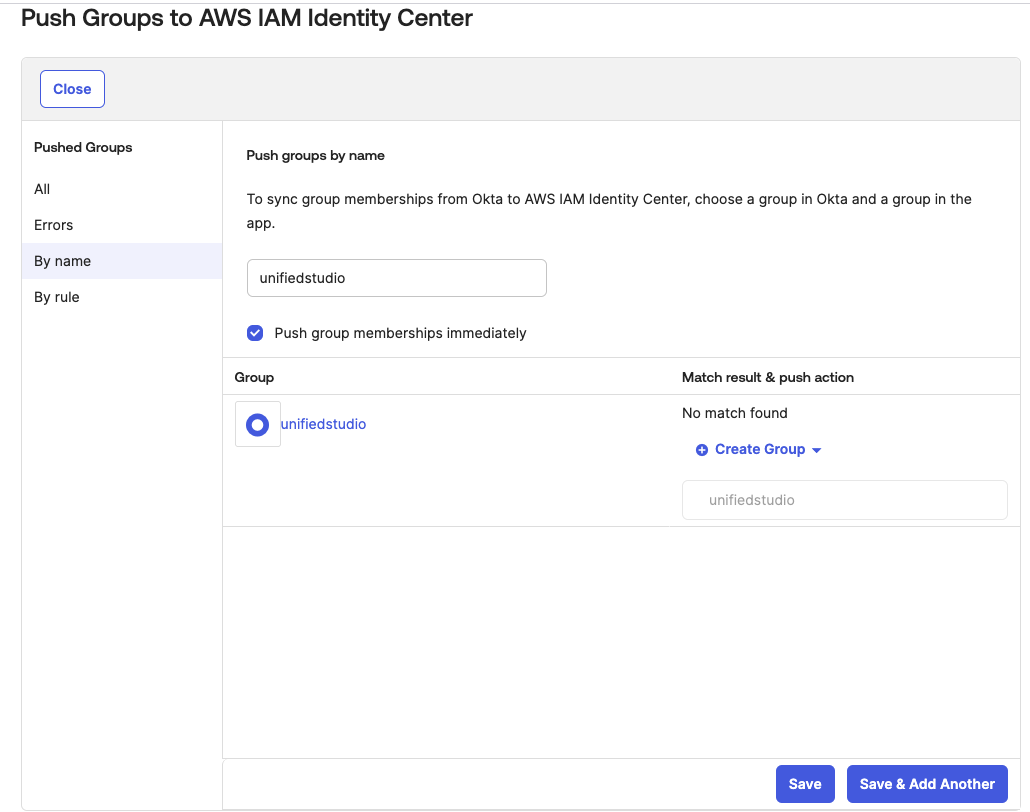
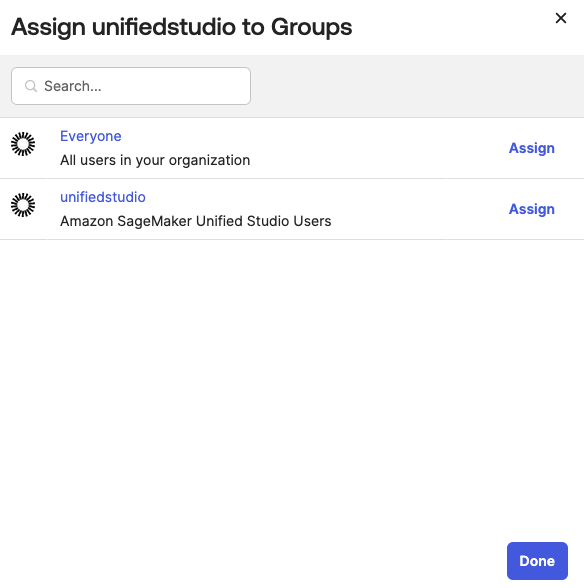 Figure 13: Assigning unifiedstudio group to SAML application called unifiedstudio
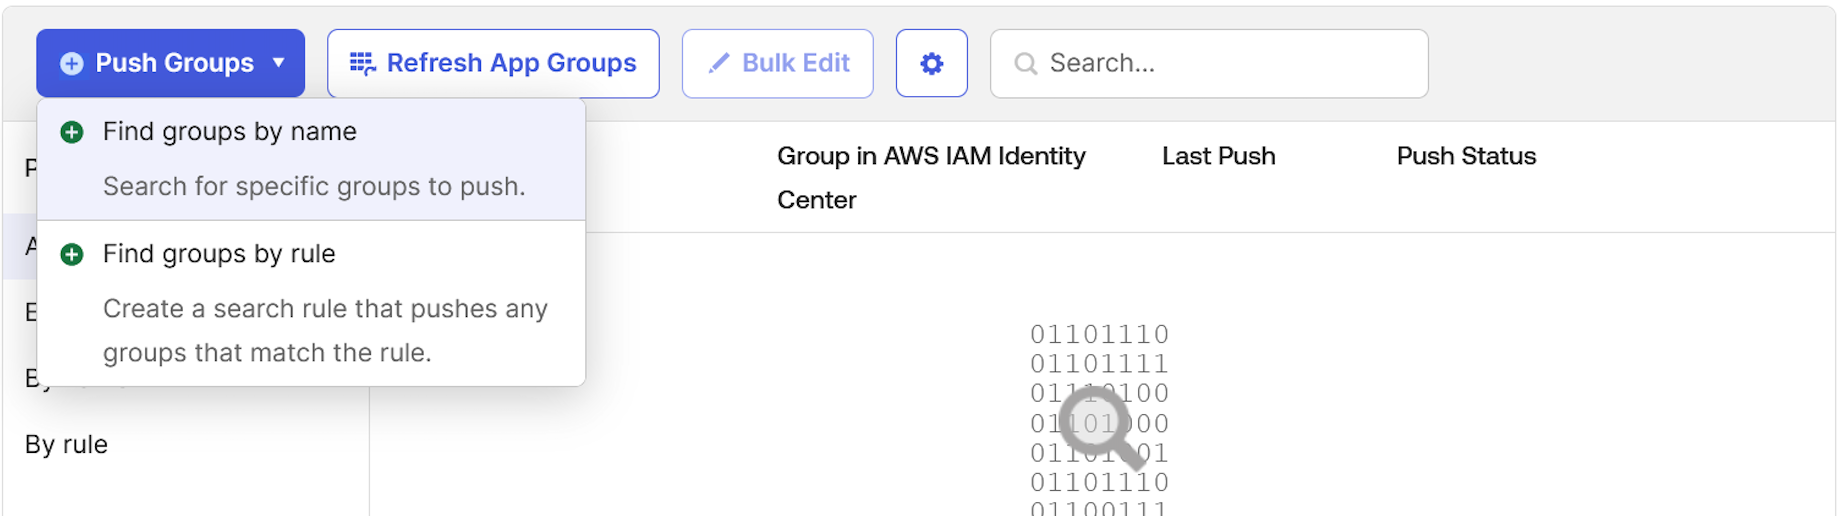


 Raghavarao Sodabathina is a Principal Solutions Architect at AWS, focusing on Data Analytics, AI/ML, and cloud security. He engages with customers to create innovative solutions that address customer business problems and to accelerate the adoption of AWS services. In his spare time, Raghavarao enjoys spending time with his family, reading books, and watching movies.
 Hang Zuo is a Senior Product Manager on the Amazon Kinesis Data Streams team at Amazon Web Services. He is passionate about developing intuitive product experiences that solve complex customer problems and enable customers to achieve their business goals.
 Shwetha Radhakrishnan is a Solutions Architect for AWS with a focus in Data Analytics. She has been building solutions that drive cloud adoption and help organizations make data-driven decisions within the public sector. Outside of work, she loves dancing, spending time with friends and family, and traveling.
 Brittany Ly is a Solutions Architect at AWS. She is focused on helping enterprise customers with their cloud adoption and modernization journey and has an interest in the security and analytics field. Outside of work, she loves to spend time with her dog and play pickleball.


 Raghavarao Sodabathina is an Enterprise Solutions Architect at AWS, focusing on Data Analytics, AI/ML, and Serverless Platform. He engages with customers to create innovative solutions that address customer business problems and accelerate the adoption of AWS services. In his spare time, Raghavarao enjoys spending time with his family, reading books, and watching movies.
 Siva Rajamani is a Boston-based Enterprise Solutions Architect for AWS. He enjoys working closely with customers, supporting their digital transformation and AWS adoption journey. His core areas of focus are Serverless, Application Integration, and Security. Outside of work, he enjoys outdoor activities and watching documentaries.