Tag Archives: code search

Don’t stop early: Case-folding source code at memory speed

Post Syndicated from Alexander Neubeck original https://github.blog/engineering/architecture-optimization/dont-stop-early-case-folding-source-code-at-memory-speed/


Suppose a user searches for café and your corpus contains CAFÉ, or they type straße and you’ve stored STRASSE. To make these count as matches, you need a canonical form that erases case distinctions, so that two strings which differ only in case compare equal. That form is case folding, and it shows up wherever text is matched rather than displayed: search engines, regex (?i) flags, case-insensitive usernames and hostnames.

It’s a basic operation, but at GitHub we run it a lot. Blackbird, GitHub’s code search engine, indexes over 180 million repositories—more than 480TB of source code. Every byte is case-folded before we extract ngrams and build the index, and for every potential query result, another (implicit or explicit) case folding operation is needed to locate matches. At that scale, the speed of even a basic operation starts to matter.

This post is about how we made it fast, and it starts somewhere counterintuitive: the biggest win in the ASCII fast path came from removing an optimization, not adding one. It turns out to be faster to sweep the whole buffer with no branches than to stop early at the first non-ASCII byte. We open-sourced the result as a Rust crate called casefold.

Folding is not lowercasing

It is tempting to reach for str::to_lowercase, but lowercasing and folding are different operations with different goals:

Lowercasing is for display, and it’s locale- and context-sensitive: Greek final sigma lowercases to ς at the end of a word and σ elsewhere, and Turkish I lowercases differently than English I. Case folding is for comparison, and it’s deliberately context-free and locale-independent. The point is a relation that stays stable and symmetric, so that if A folds to match B, B folds to match A in any locale. The Unicode Character Database ships an explicit CaseFolding.txt for exactly that.

The two operations diverge on real characters—ß, İ, final sigma—which is why lowercasing as a stand-in silently produces wrong matches. This crate implements only the simple (1-to-1) folds—statuses C and S in CaseFolding.txt—and not the multi-character “full” folds (ß → ss) or Turkic locale folds (the dotted İ). This isn’t an unusual choice: common tools and regex engines like ripgrep make the same restriction, and being consistent across tools is important.

The counterintuitive core: Don’t stop early

We deal mostly with source code, so the text we fold is overwhelmingly ASCII and making it run at memory speed is the single most important thing we can do. Everything else just has to keep the rare non-ASCII path from spoiling it.

The fold of an ASCII letter is trivial—A..=Z map to a..=z, everything else is unchanged—so the ASCII pass is really just “sweep the buffer, lowercase in place.” Ask any LLM for it and you might get something like this:

let bytes = s.as_bytes_mut(); 
for (i, b) in bytes.iter_mut().enumerate() { 
    if *b >= 0x80 { 
        break; // non-ASCII at index i: hand the rest to the Unicode path 
    } 
    if b.is_ascii_uppercase() { 
        *b += 32; // 'A'..='Z' → 'a'..='z' 
    } 
}

It looks ideal: do the cheap byte work, and the instant you hit a non-ASCII byte, break and let the “real” Unicode path take over: “only do the cheap work until you have to.” On an Apple M4 this runs at about 3 GiB/s. That sounds fine in isolation, but it is more than 15× short of “optimal” because of the if branches.

Let’s delete every branch, line by line:

  • if b >= 0x80 { break } → don’t stop at all. ORevery byte into an accumulator and test it once, after the loop: high_bit_acc |= *b. Same information (was there any non-ASCII byte?), zero branches in the body.
  • The A..=Z range test → make it arithmetic. b.wrapping_sub(b'A') < 26 is true exactly for A..=Z (any other byte wraps to ≥ 26), yielding a 0/1 mask with no branch.
  • The conditional write → fold the mask into the store.| (is_upper << 5)sets bit 5—turning an upper-case letter lower-case and being a no-op on everything else—the byte is always written, never branched on.

What’s left has no branch in its body and no early exit:

let mut high_bit_acc: u8 = 0; 
for b in &mut bytes { 
    high_bit_acc |= *b; // detect any non-ASCII byte 
    let is_upper = b.wrapping_sub(b'A') < 26; // branchless A..=Z test 
    *b |= u8::from(is_upper) << 5; // set bit 5 → lowercase, else no-op 
} 
if high_bit_acc & 0x80 == 0 { 
    return bytes; // pure ASCII: already folded in place, no second buffer 
}

A loop with no data-dependent control flow is trivially vectorizable: LLVM emits 16-byte-at-a-time NEON and the whole thing runs at > 45 GiB/s—essentially memory bandwidth. And we come out of the pass already knowing, from high_bit_acc, whether there’s any non-ASCII work left to do.

How much did each step matter? Measuring the cumulative ladder on pure ASCII (Apple M4, 5.7 KB buffer):

Version  Throughput  Vectorized? 
naive (break + branch test)  3.1 GiB/s  no (0 vector instrs) 
→ branchless test/write, keep break  2.6 GiB/s  no (0 vector instrs) 
→ drop the early-exit break  7.6 GiB/s  partially (25 vector instrs) 
→ branchless test + write (the loop)  >45 GiB/s  fully (41 vector instrs) 

The early-exit is what gates vectorization: keep the break but make the body perfectly branch-free and you still get zero vector instructions (~2.6 GiB/s); a data-dependent loop exit is enough on its own to keep the loop scalar. Only once the break is gone can the compiler vectorize. The final step—making the upper-case fold branchless—then turns a partially vectorized loop (which still compiles the conditional store to a compare-blend-masked-store, ~7.6 GiB/s) into the straight-line arithmetic that hits memory bandwidth.

Note: Branchless is a pessimization in scalar code. Look again at the table: making the body branchless while keeping the break (2.6 GiB/s) is actually slower than the naive branchy loop (3.1 GiB/s). The asm explains why. The branchy version only stores a byte when it actually changes one; its conditional strbis skipped for every lowercase letter, digit and space (the vast majority of real text), and the well-predicted branch that guards it is nearly free. The branchless version replaces that rarely taken store with an unconditional strbevery iteration, writing back all ~5,700 bytes instead of just the handful of upper-case ones. Extra write traffic for no benefit. Branchless-write only wins once the loop vectorizes, because then the store becomes a single 16-byte vector write regardless of content, and the per-byte cost disappears. The lesson: a branchless body is worth it only as the enabler for vectorization. On its own, in scalar code, it can cost you.

There’s also a middle ground, and it’s what standard libraries use. Instead of testing one byte at a time, [u8]::is_ascii scans a machine word at a time—on a 64-bit target it tests 16 bytes per iteration by OR-ing two u64 lanes and checking all their high bits with a single & 0x8080_8080_8080_8080 mask. You can build the ASCII fast path on top of that: chunk-scan to find the ASCII prefix, then run the branchless (vectorizable) convert over it. That keeps the early-exit ability—it still bails on the first non-ASCII block—while letting both halves go fast. The catch is that it reads the data twice (once to scan, once to convert), landing at about 23 GiB/s—roughly half of the single-pass branchless sweep, and ~7× the naive break loop. A solid, general-purpose default; just not the absolute ceiling when you control the whole loop and can fold detection and conversion into one branch-free pass.

Wouldn’t fusing the two passes be faster? It’s the obvious next thought: keep the chunked early-exit but convert each 16-byte block right after you’ve confirmed it’s ASCII, reading the data only once. Measured, it’s ~2.6× slower—8.7 GiB/s versus the two-pass 23. The inner block convert still vectorizes to a single 16-byte op, but now there’s a data-dependent early-exit branch every 16 bytes, and that branch pins the loop to one block at a time: the compiler doesn’t unroll or software-pipeline across blocks, and each iteration pays the full load→test→branch→convert→store latency with nothing to hide it behind. Split into two passes, each one is clean: the scan is a branch-light, store-free word scan that races through memory, and the convert is the fully-vectorized branch-free sweep at >45 GiB/s. Two fast, branch-free passes beat one branchy fused pass—even though the fused version touches the data half as many times. It’s the same lesson one more time: in the hot loop, the branch is the enemy.

Avoiding the heap

Forty-Five GiB/s also means doing zero unnecessary allocation. simple_fold takes the input String by value, owning the heap buffer it can mutate and return it. If the OR-accumulator’s high bit was clear, the input was pure ASCII already folded in place. We hand the same allocation straight back, no second buffer and no copy. Otherwise, we memchrto the first non-ASCII byte and scan the tail from there, leaving the output buffer unallocated (a null write cursor) until we hit a character that folds to different bytes. Text whose multibyte content never folds—CJK, Hangul, Kana, Arabic, Hebrew, symbols—also returns the original allocation untouched, never copying a byte.

Why a second buffer rather than rewriting in place like the ASCII pass? Because folding can make the string longer: almost every fold preserves the UTF-8 length or shrinks it, but two outliers grow—U+023A (Ⱥ) and U+023E (Ɀ) are 2 bytes each yet fold to 3-byte characters (ⱥ, ɀ). Once one appears, the output no longer fits in the input’s bytes, and we need somewhere new to write.

We allocate that buffer once, sized for the worst case, rather than growing it as more folds appear. Incremental reserve calls would mean re-checking capacity, occasionally reallocating, copying everything written so far, and juggling extra length/capacity bookkeeping; a single up-front allocation lets a raw write cursor run straight to the end with none of that. And since the cursor is nulluntil that first growing/changing fold, it doubles as the “have we allocated the extra buffer yet?” flag.

Sizing it needs a bound on growth, and those same two outliers give it: every 2 input bytes yield at most 3 output bytes, capping the output at 1.5× the input—exactly the capacity we reserve:

out = Vec::with_capacity(bytes.len() + bytes.len() / 2 + 4); 

After that the loop writes through a raw pointer with no capacity checks and calls set_len once at the end. Two more details keep it branch-light. The run of unchanged bytes between two folds is moved with a single copy_nonoverlapping rather than byte by byte. And each fold unconditionally writes all 4 bytes of a little-endian word before bumping the cursor by only the folded length (1–4)—dropping a branch on the output length from the hot path, with the + 4 in the reservation as the headroom that makes the final character’s over-store safe.

Making Unicode cheap too

When a character does fold, we still don’t want to fall off a cliff—decode UTF-8, hash lookup, re-encode. Unicode 16.0 has 1484 simple-fold mappings, but they’re a very sparse and very structured relation. Four observations shrink them to 1776 bytes and let the fold run without ever decoding a full character.

Even on the non-ASCII path, the overwhelming majority of characters do not fold. The hot operation isn’t really “fold this character,” it’s “does this character fold?” Almost always no. The table has to make that negative test as cheap as possible; the actual folding is the rare case on an already-rare path. That priority is what shapes the layout below—the page bitmap exists precisely so a non-folding character is rejected in a single bit test, straight from its leading UTF-8 bytes, without decoding or scanning anything.

This is exactly why a HashMap<u32, u32> is the wrong shape for the job, not just a bigger one. A hash map is optimized for the hit: it finds a present key in roughly one probe, and only spends extra work (more probes, full key comparison) when load factor or collisions bite. But our workload is dominated by misses—characters that aren’t in the table at all—and a miss is a hash map’s least favorite query: it still has to hash the key, jump to a bucket, and walk the probe sequence far enough to prove absence.

Foldable code points cluster into 64-code-point “pages”

Foldable code points bunch together. Slice the code space into 64-code-point “pages” and the ~1484 folds touch just 59 of ~1960 possible pages. A one-bit-per-page presence bitmap answers the negative test on its own: a clear bit is a definitive “no fold”—copy through, done—which is what makes fold-free scripts cheap. Only on a set bit do we consult a second structure, a cumulative-popcount side table that ranks the page (how many populated pages precede it) to find its slice of entries, storing nothing for the ~1900 empty pages.

let (word_idx, bit_idx, c_len) = if lead < 0xE0 { 
    (0usize, lead & 0x1F, 2usize) // 2-byte: word 0 
} else if lead < 0xF0 { 
    ((lead & 0x0F) as usize, bytes[read + 1] & 0x3F, 3) // 3-byte: word = nibble 
 
} else { 
    ( 
        (((lead & 0x07) as usize) << 6) | (bytes[read + 1] & 0x3F) as usize, 
        bytes[read + 2] & 0x3F, 
        4usize, 
    ) // 4-byte: merge 2 bytes 
}; 
// reject without decoding: clear bit ⇒ no fold 
if word_idx >= PAGE_BITMAP.len() || (PAGE_BITMAP[word_idx] >> bit_idx) & 1 == 0 { 
    read += c_len; 
    continue; 
} 

Because word_idxdepends only on the lead byte (and, for four-byte sequences, the first continuation byte), the bitmap load can be issued early.

Within a page, folds come in runs

A set page bit tells us something on this page folds, but not which code points or to what. The obvious encoding is one entry per foldable code point—but that is both bulky and slow to search: a page can hold dozens of folds, and we’d have to scan them all to find the one matching the current code point. The structure of the data rescues us again. Adjacent code points overwhelmingly share the same delta to their fold: A–Z all map +32, and Latin Extended is full of alternating runs like 0x0100, 0x0102, 0x0104, … where every second code point folds. Instead of per-code-point entries we store runs—start, end, stride, delta—and a 1-bit stride flag covers both the contiguous and the every-other case. This interval compression collapses the ~1484 individual folds into just 238 runs across the 59 pages (≈four per page), leaving the within-page search only a handful of entries to look at instead of dozens. This range-with-delta encoding (including the stride trick) is borrowed from Go’s unicode package, whose CaseRange records store a Lo/Hi range plus per-case deltas, with an UpperLower sentinel marking the alternating blocks. Runs are split at the page boundaries so a run never straddles two pages.

A run record is two clean bytes

With both endpoints inside one page they fit in 6 bits, split across two arrays: RUN_END_LOW[``i``] = end & 0x3F (the scan key) and RUN_START_STRIDE[``i``] = (start & 0x3F) | ((stride − 1) << 6) (read only on a hit). Because each key is one clean byte, the within-page search can go wide: rather than comparing cp & 0x3F against the runs one at a time, we load 8 end_low bytes into a single u64 and test all of them at once with one branchless SWAR step—(chunk | 0x80…80) − broadcast(low) & 0x80…80 sets the top bit of every lane whose key is ≥ cp & 0x3F. A single bit-scan of that mask (the keys are sorted, so the first set lane is the run we want) finds the slot. A page holds ~4 runs on average; that one 8-wide compare almost always resolves the entire search in a single step. One unlucky page does hold 30 runs, which puts the compare inside a short loop that strides eight keys at a time—but that loop trips at most a handful of times on exactly one page in all of Unicode, and never on the common ones. Either way: no per-run branch, and no code-point reconstruction anywhere.

/// Offset of the first run with `end_low >= low_v` in a page of `n` runs, 
/// or `n` if none. Scans 8 `end_low` bytes at a time via SWAR. 
#[inline] 
fn scan_end_low(lo: usize, n: usize, low_v: u8) -> usize { 
    const HIGH: u64 = 0x8080_8080_8080_8080; 
    const ONES: u64 = 0x0101_0101_0101_0101; 
    let bcast = (low_v as u64).wrapping_mul(ONES); 
    let mut base = 0; 
    while base < n { 
        // RUN_END_LOW is padded by 8 bytes so this read is always in bounds. 
        let chunk = u64::from_le_bytes( 
            RUN_END_LOW[lo + base..lo + base + 8] 
                .try_into() 
                .expect("8-byte slice"), 
        ); 
        // `(b | 0x80) - low_v` keeps its high bit iff `b >= low_v` (no 
        // cross-lane borrow). The first set lane is the first run `>= low_v`. 
        let ge = (chunk | HIGH).wrapping_sub(bcast) & HIGH; 
        if ge != 0 { 
            let j = base + (ge.trailing_zeros() / 8) as usize; 
            return if j < n { j } else { n }; 
        } 
        base += 8; 
    } 
    n 
} 

Folding is a little-endian byte addition

On a little-endian machine the folded character’s UTF-8 bytes, read as a u32, equal the source bytes (as a u32) plus a per-run constant. A parallel BYTE_DELTA[i] table then turns the whole fold into a masked load, one wrapping_add, and a 4-byte store:

let word = u32::from_le_bytes(next_four_bytes) & length_mask; // keep this char's bytes 
let folded = word.wrapping_add(BYTE_DELTA[i]); // the fold, as one byte add 
write_u32_le(dst, folded); // store all 4 bytes... 
dst += utf8_len(folded); // ...advance by the folded length

Both lengths in that snippet—the length_mask for the source character and the advance by the folded length for the destination—come from one more tiny trick. A UTF-8 sequence’s length is fixed by the top four bits of its lead byte, letting the 16 possible lengths pack one nibble each into a single 64-bit constant (0x4322_1111_1111_1111); the length is then a shift and a mask, (LEN_BITS >> (4 * (lead >> 4))) & 0xF—no if chain, no table memory, nothing for the predictor to get wrong. (A count leading ones(!lead).leading_zeros()—would also work, since a lead byte carries one leading 1-bit per byte of the sequence.)

/// Number of bytes in the UTF-8 sequence whose lead byte is `lead`. 
#[inline] 
pub fn utf8_len(lead: u8) -> usize { 
    const UTF8_LEN_BY_LEAD: u64 = 0x4322_1111_1111_1111; 
    ((UTF8_LEN_BY_LEAD >> (4 * (lead >> 4))) & 0xF) as usize 
}

Because we advance by the folded length, this even handles length-changing folds—U+212A KELVIN SIGN (3 bytes) → k (1 byte), or U+023A Ⱥ (2 bytes) → U+2C65 ⱥ (3 bytes)—by writing fewer or more bytes than were read. That’s the part we believe is genuinely new: every other folder we looked at—ICU, Go’s unicode, Rust’s regex, CPython, glibc—decodes UTF-8 to a code point, applies the fold there, and re-encodes (even SIMD folders decode first). Doing the arithmetic in byte space skips both the decode and the encode, which is exactly why this path can outrun a hash map that already has the answer tabulated—the hash map still has to decode its key and encode its result. The byte-space arithmetic assumes the input is well-formed, shortest-form UTF-8—every code point encoded with the minimal number of bytes. Reading the source bytes as a u32and adding a per-run delta only lands on the correct folded encoding when the source is in canonical form; an overlong encoding (a code point padded into more bytes than necessary, e.g. / as 0xC0 0xAF) has a different byte pattern and would break thelength_mask and the delta arithmetic. This is not a real restriction in Rust—&str/String are guaranteed to hold valid UTF-8, which by definition rejects overlong sequences—but a caller feeding raw bytes from elsewhere must validate (or otherwise normalize) them first.

The ASCII shortcut in the tail loop

One more shortcut rounds out the tail loop. Remember the first pass already lowercased every ASCII byte, so when the scan meets an ASCII byte in the tail it advances a single byte and moves on—no page probe, no table touch at all. And it doesn’t copy that byte either: unmodified bytes (ASCII and non-folding multibyte alike) aren’t moved one at a time. The scan just keeps walking until it reaches a character that actually folds, then flushes the whole unchanged run between the last fold and this one with a single copy_nonoverlapping. Mixed text—CJK with ASCII spaces and punctuation, or code with the occasional accented identifier—therefore races through the ASCII filler and only consults the bitmap for genuine multibyte characters, copying in bulk rather than byte by byte.

Putting it together: the whole table

Component  Bytes 
PAGE_BITMAP (1 bit per 64-cp page)  248 
POPCNT_SAMPLES (cumulative popcount)  32 
PAGE_OFFSET (per populated page)  60 
RUN_END_LOW (scan key, end & 0x3F, +8 pad)  246 
RUN_START_STRIDE (start & 0x3F | stride)  238 
BYTE_DELTA (little-endian fold delta per run)  952 
Total  1776 

That’s 9.6 bits per fold entry, over half of it the BYTE_DELTA side table we trade for the decode-free path; the index + run records alone are ~4.4 bits/entry.

Next to the obvious alternatives, that 1776 bytes is an order of magnitude or more smaller—and unlike most of them, it never decodes a character:

Representation  Size
Naïve [(u32, u32); 1484]  ~11.6 KB 
regex-syntax’s case_folding_simple table  ~70 KB 
Go’s unicode.SimpleFold (orbit + ASCII + ranges)  ~7.3 KB 
A runtime HashMap<u32, u32>  ~17 KB 
This crate (paged bitmap + packed runs)  1776 B 

Where it lands against the alternatives

On the common case, ASCII, folding runs at memory bandwidth (>45 GiB/s), more than an order of magnitude ahead of other real folders and more than 50% faster than the (non-equivalent) str::to_lowercase function. To get a rough “upper bound” for the non-ASCII case, we measured the optimized Utf8 decoding + encoding round trip without performing any actual case folding using the simdutf crate. This experiment achieves consistently about 2GB/sec and is only about twice as fast than our solution for the worst case all-folding input. A naive hash map trails everything on all workloads.

The three columns are real case folders that produce identical output: simple_fold (this crate), simd_normalizer (the simd-normalizer crate), and HashMap (naive CaseFolding.txt lookup). The workload rows are chosen to simulate different scenarios from typical to worst case:

Workload (input size)  simple_fold  simd_normalizer  HashMap (byte path) 
Pure ASCII (5.7 KB)  >45 GiB/s  1.21 GiB/s  213 MiB/s 
Chinese/Japanese/Korean, no folds (8.1 KB)  2.95 GiB/s  1.97 GiB/s  558 MiB/s 
Symbols / Myanmar, no folds (9.0 KB)  2.96 GiB/s  1.56 GiB/s  410 MiB/s 
Worst case: Latin/Greek/Cyrillic (Unicode U+0000–U+FFFF), all folding (8.8 KB)  869 MiB/s  922 MiB/s  334 MiB/s 
Length-changing folds (1.7 KB)  1.26 GiB/s  716 MiB/s  233 MiB/s 

Treat the absolute figures as illustrative, not portable: the whole design leans on auto-vectorization, SWAR, and little-endian byte arithmetic, so the numbers—and even the ratios between rows—can shift substantially on a different microarchitecture (a wider or narrower vector unit, different memory bandwidth, a big-endian target, x86 vs ARM).

More details can be found in the performance section of the README.

Take this with you

Case folding is about as basic as text operations get, which is exactly why it was worth the effort: we run it across every byte we index. The wins came from two ideas that both cut against instinct—sweep the whole buffer branch-free instead of stopping early, and do the fold as byte-space arithmetic instead of decoding to a code point. Together they let the common case run at memory bandwidth and the rare fold run without a decode, in a table small enough (1776 bytes) to stay resident. The decode-free byte-space fold is the piece we believe is genuinely new; it’s why this path can beat a hash map that already has the answer.

There’s surely more to find here, and we’d like to see it. The crate is casefold; the generated table and full design notes live alongside the source.

The post Don’t stop early: Case-folding source code at memory speed appeared first on The GitHub Blog.
Accessibility considerations behind code search and code view

Post Syndicated from milemons original https://github.blog/2023-07-06-accessibility-considerations-behind-code-search-and-code-view/

GitHub prides itself on being the home for all developers, including developers with disabilities. Accessibility is a core priority for all new projects at GitHub, so it was top of mind when we started our project to rework code search and the code view at GitHub. With the old code view, some developers preferred to look at raw code rather than code view due to accessibility barriers, and that’s what we set out to fix. This blog post will shed light on our process and three major tasks that required thoughtful design and implementation—code search and query builder, the file tree, and navigating code by keyboard.

Process

We worked with a team of experts at GitHub dedicated to accessibility, since while we are confident in our development skills, accessibility has many nuances and requires a large depth of knowledge to get right. This team helped us immensely in three main ways:

  1. External auditing
    In this project, we performed accessibility auditing on all of our features. This meant that another team of auditors reviewed our webpage with all the changes implemented to find accessibility errors. They used tools including screen readers, color contrast tools, and more, to identify areas that users with disabilities may find hard to use. Once those issues were identified, the accessibility team would take a look at those issues and suggest a proper solution to the problem. Then, it was up to us to implement the solution and collaborate with the team where we needed additional assistance.
  2. Design reviews
    The user interface for code search and code view were both entirely redesigned to support our new goals—to allow users to search, navigate, and understand code in a way they weren’t able to before. As a part of the design process, a team of accessibility designers reviewed the Figma mockups to determine proper HTML markup and tab order. Then, they included detailed explanations of what interactions should look like in order to meet our accessibility goals.
  3. Office hours
    The accessibility team at GitHub hosts weekly meetings where engineers can sign up and discuss how to solve problems with their features with the team and a consultant. The consultant is incredibly helpful and knowledgeable about how to properly address issues because he has lived experience with screen readers and accessibility.During these meetings, we were able to discuss complicated issues, such as the following: proper filtering for code search, making an accessible file tree, and navigating code on a keyboard, along with other issues like tab order, and focus management across the whole feature.

Implementation details

This has been written about frequently on our blog—from one post on the details of QueryBuilder, our implementation of an accessible finder component to details about what navigating code search accessibly looks like. Those two posts are great reads and I strongly recommend checking them out, but they’re not the only thing that we’ve worked on. Thanks to @lindseywild, @smockle, @kendallgassner, @owenniblock, and @khiga8 for their guidance and help resolving issues with code search. This is still a work in progress, especially in areas like the filtering behavior on the search pages.

Two areas that also required careful consideration were managing focus after changing the sort order of search results and how to announce the result of the search for screen reader users.

Changing sort—changing focus?

When we first implemented this sort dropdown for non-code search types, if you navigated to it with your keyboard and then selected a different sort option, the whole page would reload and your focus moved back to the header. Our preferred, accessible behavior is that, when a dropdown menu is closed, focus returns to the button that opened the menu. However, our problem was that the “Sort” dropdown didn’t merely perform client-side operations like most dropdowns where you select an option. In this case, once a user selects an option, we do a full page navigation to perform the new search with the sort order added. This meant that the focus was being placed back on the header by default after the page navigation, instead of returning to the sort dropdown. For sighted mouse users, this is a nonissue; for sighted keyboard users, it is unexpected and annoying; for blind users, this is confusing and makes the product hard to use. To fix this, we had to make sure we returned focus to the dropdown after reloading the page.

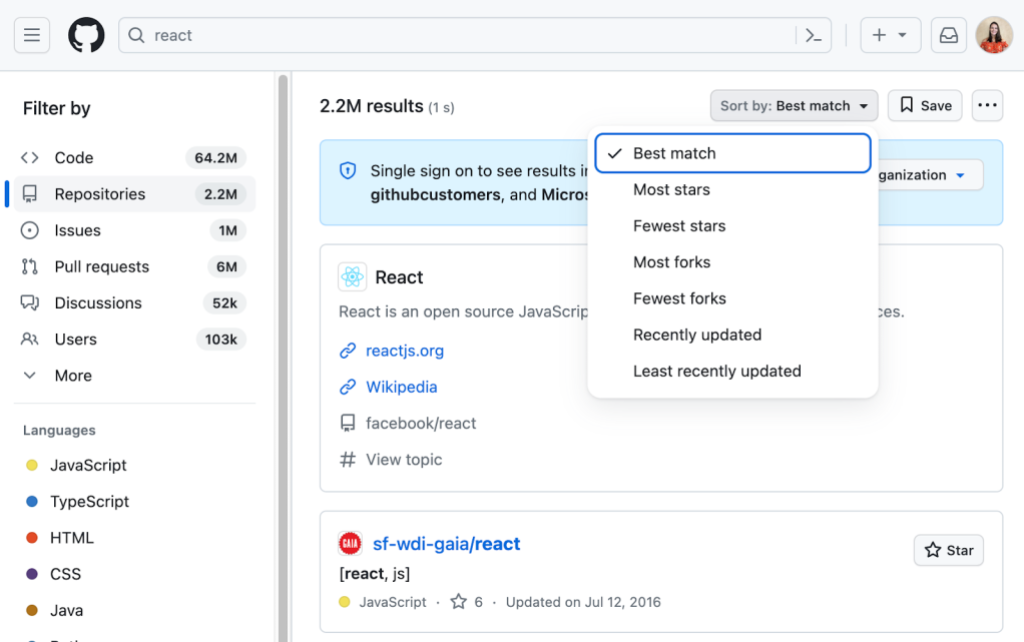
Screenshot of search results. I have searched “react” and the “Repositories” filter by item is selected. There are 2.2M results, found in 1 second. The "Sort By" dropdown is open with “Best match” selected. The other options are “Most stars”, “Fewest stars”, “Most forks”, “Fewest forks”, “Recently updated”, and “Least recently updated”.

Announcing search results

When a sighted user types in the search bar and presses ‘Enter’ they quickly receive feedback that the search has completed and whether or not they found any results by looking at the page. For screen reader users, though, how to give the feedback that there were results, how many, or if there was an error requires more thought. One solution could be to place focus on the first result. That has a number of problems though.

  1. The user will not receive feedback about the number of search results and may think there’s only one.
  2. The user may miss important context like the Single sign on banner.
  3. The user will have to tab through more elements if they want to get back.

Another solution could be to use aria-live announcements to read out the number of results and success. This has its own problems.

  1. We already have an announcement on page navigation to read out the new title and these two announcements would compete or cause a race condition.
  2. There isn’t a way to programmatically force announcements to be read in order on page load.
  3. Some screen reader users have aria-live announcements turned off since they can be annoying.

After some discussion, we decided to focus and read out the header with the number of search results after a search and allow users to explore for errors, banners, or results on their own once they know how many results they received.

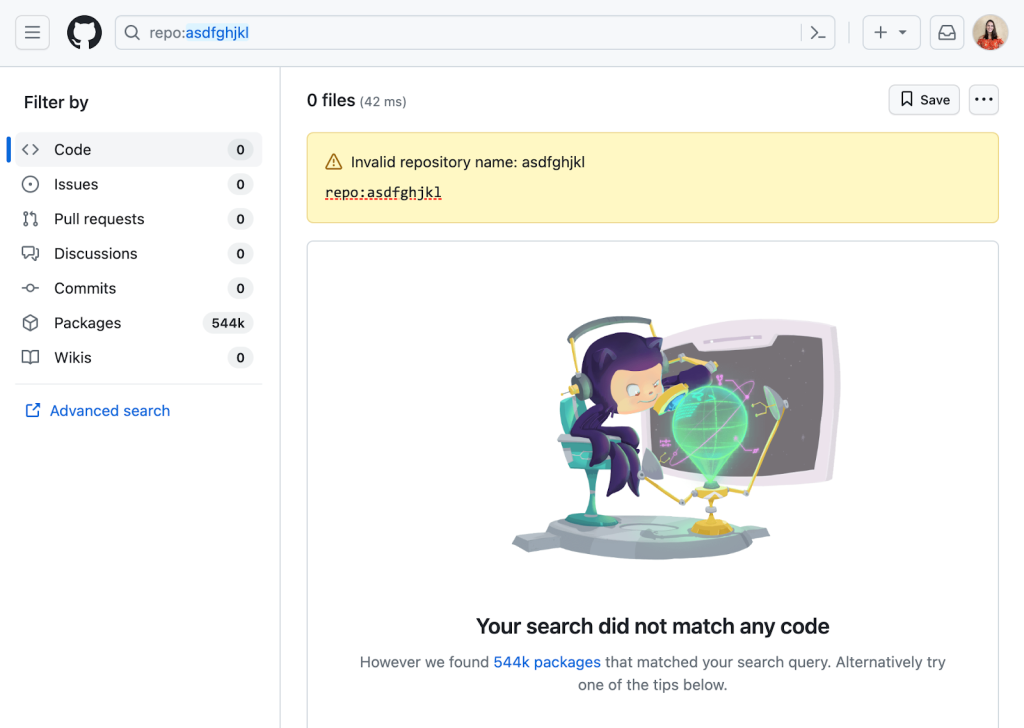
A screenshot of search results showing 0 results and an error message saying, “Invalid repository name.” I have searched “repo:asdfghijkl." The “Code” filter item is selected. There is also some help text on the page that says “Your search did not match any code. However, we found 544k packages that matched your search query. Alternatively, try one of the tips below.

Tree navigation

We knew when redesigning the code viewing experience that we wanted to include the tree panel to allow users to quickly switch between folders or files, because understanding code often requires looking in multiple places. We started the project by making our own tree to the aria spec, but it was too verbose. To fix this, our accessibility and design teams created the TreeView, which is open source. This was implemented to support various generic list elements and use proper HTML structure to make navigating through the tree a breeze, including typeahead (the ability to type a bit and have focus move to the first matching element), proper announcements for asynchronous loading of deeply nested items, and proper IDs for all elements that are guaranteed to be unique (that is, not constructed from their contents which may be the same). The valid markup for a tree view is very specific and developing it requires careful reviews for common issues, like invalid child item types under a role="group" element or using nested list elements without considering screen reader support, which is unlike most TreeView implementations on the internet. For more information about the design details for the tree view, check out the markdown documentation. Thanks to @colebemis, @mperrotti, and @ericwbailey for the work on this.

Reading and navigating code by keyboard

Before the new code view, reading code on GitHub wasn’t a great experience for screen reader users. The old experience presented code as a table—a hidden detail for sighted users but a major hurdle for screen readers, since code isn’t a table, and the semantics didn’t make sense in that context. For example, in code, whitespace has meaning. Whether stylistic or functional, that whitespace gets lost for screen reader users when the code is presented as a table. In addition, table semantics force users into line-by-line navigation, instead of character-by-character or word-by-word navigation. For many users, these hurdles meant that they mostly used GitHub just enough to be able to access the raw code or use a code editor for reading code. Since we want to support all our users, we knew we needed to totally rethink the way we structured code in the DOM.

This problem became even more complicated when we introduced symbols and the symbols panel. Mouse users are able to click on a “symbol” in the code—a special code element, like a function name—to see extra details about it, including references and definitions, in the symbol panel. They can then explore the code more deeply, navigating between lines of code where that symbol is found to investigate and understand the code better. This ability to dive deep has been game changing for many developers. However, for keyboard users, it doesn’t work. At best, a keyboard user can use the “Open symbols panel” button in the code header and then filter all symbol definitions for one they are interested in, but this doesn’t allow users to access symbol references when no definitions are found in a file. In addition, this flow really isn’t the same—if we want to support all developers, then we need to offer keyboard users a way to navigate through the code and select symbols they are interested in.

In addition, for many performance reasons mentioned in the post “Crafting a better, faster code view,” we introduced virtualization to the code viewer which created its own accessibility problems—not having all elements in the DOM can interfere with screen readers and overriding the cmd / ctrl + f shortcut is generally bad practice for screen readers as well. In addition, virtualization posed a problem for selecting text outside of the virtualization window.

This is when we came up with the solution of using a cursor from a <textarea> or a <div> that has the property contentEditable. This solution is modeled after Monaco, the text editor that powers VS Code. <textarea> elements, when not marked as readOnly, and contentEditiable<div> elements have a built in cursor that allows screen reader users to navigate code in their preferred manner using their built in screen reader settings. While a contentEditiable <div> would support syntax highlighting and the deep interactions we needed, screen readers don’t support them well1 which defeats the purpose of the cursor. As a result, we decided to go with the <textarea> However, <textarea> elements do not support syntax highlighting or deeper interactions like selecting symbols, which meant we needed to use both the <textarea> as a hidden element and syntax highlighted elements aligned perfectly above. Since we hide the text element, we need to add a visual “fake” cursor to show and keep it in sync with the “real” <textarea> cursor.

While the <textarea> and cursor help with our goals of allowing screen reader users and keyboard users to navigate code and symbols easily, they also ended up helping us with some of the problems we had run into with virtualization. One example of this was the cmd + f problem that we talk about more in depth in the blog post here. Another problem this solved was the drag and select behavior (or select all) for long files. Since the <textarea> is just one DOM node, we are able to load the whole file contents and select the contents directly from the <textarea> instead of the virtualized syntax highlighted version.

Unfortunately, while the <textarea> solved many problems we had, it also introduced a few other tricky ones. Since we have two layers of text, one hidden unless selected and one visual, we need to make sure that the scroll states are aligned. To do this, we have written observers to watch when one scrolls and mimic the scroll on the other. In addition, we often need to override the default <textarea> behaviors for some events—such as the middle click on mouse which was taking users all the way to the bottom of the code. Along with that issue, different browsers handle <textarea>s differently and making sure our solution behaves properly on all browsers has proven to be time intensive to say the least. In addition, we found that some browsers, like Firefox, allow users to customize their font size using Text zoom, which would apply to the formatted text but not the <textarea>. This led to “ghost text” issues with selection. We were able to resolve that by measuring the height of the text that is rendered and passing that to the <textarea>, though there are still some issues with certain plugins that modify text. We are still working to resolve these specific issues as well. In addition, the <textarea> currently does not work with our Wrap lines view option, which we are working to fix. Thanks especially to @joycezhu, @andrialexandrou, @adamshwert, and @jbrown1618 who put in a ton of work here.

Always iterating

We have taken huge strides to improve accessibility for all developers, but we recognize that we aren’t all the way there. It can be challenging to accommodate all developers, but we are committed to improving and iterating on what we have until we get it right. We want our tools to support everyone to access and explore code. We still have work—a lot of work—to do across GitHub, but we are excited for this journey.

To learn more about accessibility at GitHub, go to accessibility.github.com.


  1. For more information about contentEditable and screen readers, see this article written by @joycezhu from our Accessibility Engineering team. 

Crafting a better, faster code view

Post Syndicated from Joshua Brown original https://github.blog/2023-06-21-crafting-a-better-faster-code-view/

Reading code is not as simple as reading the text of a file end-to-end. It is a non-linear, sometimes chaotic process of jumping between files to follow a trail, building a mental picture of how code relates to its surrounding context. GitHub’s mission is to be the home for all developers, and reading code is one of the core experiences we offer. Every day, millions of users use GitHub to view and interact with code. So, about a year ago we set out to create a new code view that supports the entire code reading experience with features like a file tree, symbol navigation, code search integration, sticky lines, and code section folding. The new code view is powerful, intelligent, and interactive, but it is not an attempt to turn the repository browsing experience into an IDE.

While building the new code view, our team had a few guiding principles on which we refused to compromise:

  • It must add these powerful new features to transform how users read code on GitHub.
  • It must be intuitive and easy to use for all of GitHub’s millions of users.
  • It must be fast.

Initial efforts

The first step was to build out the features we wanted in a natural, straightforward way, taking the advice that “premature optimization is the root of all evil.”1 After all, if simple code satisfactorily solves our problems, then we should stop there. We knew we wanted to build a highly interactive and stateful code viewing experience, so we decided to use React to enable us to iterate more quickly on the user interface. Our initial implementation for the code blob was dead-simple: our syntax highlighting service converted the raw file contents to a list of HTML strings corresponding to the lines of the file, and each of these lines was added to the document.

There was one key problem: our performance scaled badly with the number of lines in the file. In particular, our LCP and TTI times measurably increased at around 500 lines, and this increase became noticeable at around 2,000 lines. Around those same thresholds, interactions like highlighting a line or collapsing a code section became similarly sluggish. We take these performance metrics seriously for a number of reasons. Most importantly, they are user-centric—that is, they are meant to measure aspects of the quality of a user’s experience on the page. On top of that, they are also part of how search engines like Google determine where to rank pages in their search results; fast pages get shown first, and the code view is one of the many ways GitHub’s users can show their work to the world.

As we dug in, we discovered that there were a few things at play:

  • When there are many DOM nodes on the page, style calculations and paints take longer.
  • When there are many DOM nodes on the page, DOM queries take longer, and the results can have a significant memory footprint.
  • When there are many React nodes on the page, renders and DOM reconciliation both take longer.

It’s worth noting that none of these are problems with React specifically; any page with a very large DOM would experience the first two problems, and any solution where a large DOM is created and managed by JavaScript would experience the third.

We mitigated these problems considerably by ensuring that we were not running these expensive operations more than necessary. Typical React optimization techniques like memoization and debouncing user input, as well as some less common solutions like pulling in an observer pattern went a long way toward ensuring that React state updates, and therefore DOM updates, only occurred as needed.

Mitigating the problem, however, is not solving the problem. Even with all of these optimizations in place, the initial render of the page remained a fundamentally expensive operation for large files. In the repository that builds GitHub.com, for example, we have a CODEOWNERS file that is about 18,000 lines long, and pushes the 2MB size limit for displaying files in the UI. With no optimizations besides the ones described above, React’s first pass at building the DOM for this page takes nearly 27 seconds.2 Considering more than half of users will abandon a page if it loads for more than three seconds, there was obviously lots of work left to do.

A promising but incomplete solution

Enter virtualization. Virtualization is a performance optimization technique that examines the scroll state of the page to determine what content to include in the DOM. For example, if we are viewing a 10,000 line file but only about 75 lines fit on the screen at a time, we can save lots of time by only rendering the lines that fit in the viewport. As the user scrolls, we add any lines that need to appear, and remove any lines that can disappear, as illustrated by this demo.3

This satisfies the most basic requirements of the page with flying colors. It loads on average more quickly than the existing experience, and the experience of scrolling through the file is nearly indistinguishable from the non-virtualized case. Remember that 27 second initial render? Virtualizing the file content gets that time down to under a second, and that number does not increase substantially even if we artificially remove our file size limit and pull in hundreds of megabytes of text.

Unfortunately, virtualization is not a cure-all. While our initial implementation added features to the page at the expense of performance, naïvely virtualizing the code lines delivers a fast experience at the expense of vital functionality. The biggest problem was that without the entire text of the file on the page at once, the browser’s built-in find-in-file only surfaced results that are visible in the viewport. Breaking users’ ability to find text on the page breaks our hard requirement that the page remain intuitive and easy to use. Before we could ship any of this to real users, we had to ensure that this use case would be covered.

The immediate solution was to implement our own version of find-in-file by implementing a custom handler for the Ctrl+F shortcut (⌘+F on Mac). We added a new piece of UI in the sidebar to show results as part of our integration with symbol navigation and code search.

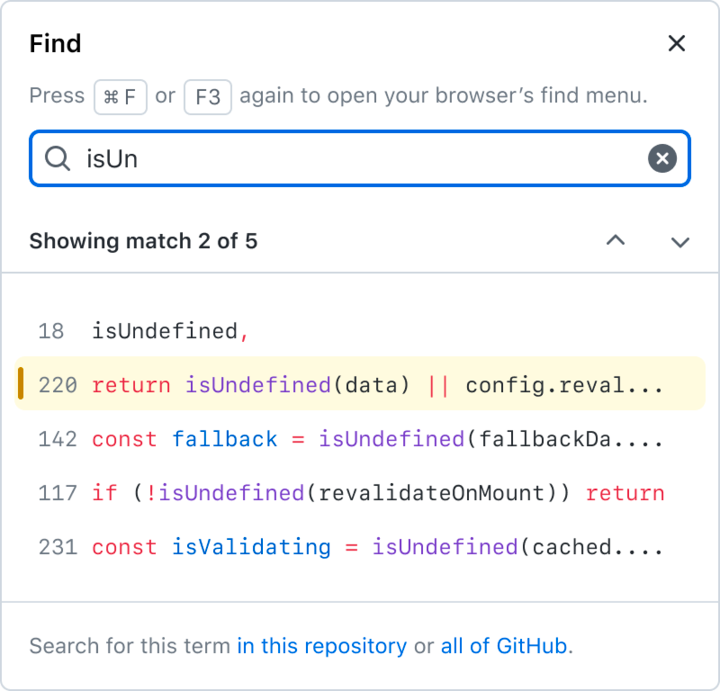
Screenshot of the "find" sidebar, showing a search bar with the term "isUn" and a list offive lines of code from the current file that contain that string, the second of which is highlighted as selected.

There is precedent for overriding this native browser feature to allow users to find text in virtualized code lines. Monaco, the text editor behind VS Code, does exactly this to solve the same problem, as do many other online code editors, including Repl.it and CodePen. Some other editors like the official Ruby playground ignore the problem altogether and accept that Ctrl+F will be partially broken within their virtualized editor.

At the time, we felt confident leaning on this precedent. These examples are applications that run in a browser window, and as users, we expect applications to implement their own controls. Writing our own way to find text on the page was a step toward making GitHub’s Code View less of a web page and more of a web application.

When we released the new code view experience as a private beta at GitHub Universe, we received clear feedback that our users think of GitHub as a page, not as an app. We tried to rework the experience to be as similar as possible to the native implementation, both in terms of user experience and performance. But ultimately, there are plenty of good reasons not to override this kind of native browser behavior.

  • Users of assistive technologies often use Ctrl+F to locate elements on a page, so restricting the scope to the contents of the file broke these workflows.
  • Users rely heavily on specific muscle memory for common actions, and we followed a deep rabbit hole to get the custom control to support all of the shortcuts used by various browsers.
  • Finally, the native browser implementation is simply faster.

Despite plenty of precedent for an overridden find experience, this user feedback drove us to dig deeper into how we could lean on the browser for something it already does well.

Virtualization has an important role to play in our final product, but it is only one piece of the puzzle.

How the pieces fit together

Our complete solution for the code view features two pieces:

  1. A textarea that contains the entire text of the raw file. The contents are accessible, keyboard-navigable, copyable, and findable, yet invisible.
  2. A virtualized, syntax-highlighted overlay. The contents are visible, yet hidden from both mouse events and the browser’s find.

Together, these pieces deliver a code view that supports the complete code reading experience with many new features. Despite the added complexity, this new experience is faster to render than the static HTML page that has displayed code on GitHub for more than a decade.

A textarea and a read-only cursor

The first half of this solution came to us from an unexpected angle.

Beyond adding functionality to the code view, we wanted to improve the code reading experience for users of assistive technologies like screen readers. The previous code view was minimally accessible; a code document was displayed as a table, which created a very surprising experience for screen reader users. A code document is not a table, but likewise it is not a paragraph of text. To support a familiar interface for interacting with the code on the page, we added an invisible textarea underneath the virtualized, syntax-highlighted code lines so that users can move through the code with the keyboard in a familiar way. And for the browser, rendering a textarea is much simpler than using JavaScript to insert syntax-highlighted HTML. Browsers can render megabytes of text in a textarea with ease.

Since this textarea contains the entire text of the raw file, it is not just an accessibility feature, but an opportunity to remove our custom implementation of Ctrl+F in favor of native browser implementations.

Hiding text from Ctrl+F

With the addition of the textarea, we now have two copies of every line that is visible in the viewport: one in the textarea, and another in the virtualized, syntax-highlighted overlay. In this state, searching for text yields duplicated results, which is more confusing than a slow or unfamiliar experience.

The question, then, is how to expose only one copy of the text to the browser’s native Ctrl+F. That brings us to the next key part of our solution: how we hid the syntax-highlighted overlay from find.

For a code snippet like this line of Python:

print("Hello!")

the old code view created a bit of HTML that looks like this:

<span class="pl-en">print</span>(<span class="pl-s">"Hello!"</span>)

But the text nodes containing print, (,"Hello!", and ) are all findable. It took two iterations to arrive at a format that looks identical but is consistently hidden fromCtrl+F on all major browsers. And as it turns out, this is not a question that is very easy to research!

The first approach we tried relied on the fact that :before pseudoelements are not part of the DOM, and therefore do not appear in find results. With a bit of a change to our HTML format that moves all text into a data- attribute, we can use CSS to inject the code text into the page without any findable text nodes.

HTML

<span class="pl-en" data-code-text="print"></span>
<span data-code-text="("></span>
<span class="pl-s" data-code-text=""Hello!""></span>
<span data-code-text=")"></span>

CSS

[data-code-text]:before {
   content: attr(data-code-text);
}

But that’s not the end of the story, because the major browsers do not agree on whether text in :before pseudoelements should be findable; Firefox in particular has a powerful Ctrl+F implementation that is not fooled by our first trick.

Our second attempt relied on a fact on which all browsers seem to agree: that text in adjacent pseudoelements is not treated as a contiguous block of text.4 So, even though Firefox would find print in the first example, it would not find print(. The solution, then, is to break up the text character-by-character:

<span class="pl-en">
   <span data-code-text="p"></span>
   <span data-code-text="r"></span>
   <span data-code-text="i"></span>
   <span data-code-text="n"></span>
   <span data-code-text="t"></span>
</span>
<span data-code-text="("></span>
<span class="pl-s">
   <span data-code-text="""></span>
   <span data-code-text="H"></span>
   <span data-code-text="e"></span>
   <span data-code-text="l"></span>
   <span data-code-text="l"></span>
   <span data-code-text="o"></span>
   <span data-code-text="!"></span>
   <span data-code-text="""></span>
</span>
<span data-code-text=")"></span>

At first glance, this might seem to complicate the DOM so much that it might outweigh the performance gains for which we worked so hard. But since these lines are virtualized, we create this overlay for at most a few hundred lines at a time.

Syntax highlighting in a compact format

The path we took to build a faster code view with more features was, like the path one might follow when reading code in a new repository, highly non-linear. Performance optimizations led us to fix behaviors which were not quite right, and those behavior fixes led us to need further performance optimizations. Knowing how we wanted the HTML for the syntax-highlighted overlay to look, we had a few options for how to make it happen. After a number of experiments, we completed our puzzle with a performance optimization that ended this cycle without causing any behavior changes.

Our syntax-highlighting service previously gave us a list of HTML strings, one for each line of code:

[
   "<span class=\"pl-en\">print</span>(<span class=\"pl-s\">"Hello!"</span>)"
]

In order to display code in a different format, we introduced a new format that simply gives the locations and css classes of highlighted segments:

[
   [
       {"start": 0, "end": 5, "cssClass": "pl-en"},
       {"start": 6, "end": 14, "cssClass": "pl-s"}
   ]
]

From here, we can easily generate whatever HTML we want. And that brings us to our final optimization:

within our syntax-highlighted overlay, we save React the trouble of managing the code lines by generating the HTML strings ourselves. This can deliver a surprisingly large performance boost in certain cases, like scrolling all the way through the 18,000-line CODEOWNERS file mentioned earlier. With React managing the entire DOM, we hit the “end” key to move all the way to the end of the file, and it takes the browser 870 milliseconds to finish handling the “keyup” event, followed by 3,700 milliseconds of JavaScript blocking the main thread. When we generate the code lines as HTML strings, handling the “keyup” event takes only 80 milliseconds, followed by about 700 milliseconds of blocking JavaScript.5

In summary

GitHub’s mission is to be the home for all developers. Developers spend a substantial amount of their time reading code, and reading code is hard! We spent the past year building a new code view that supports the entire code reading experience because we are passionate about bringing great tools to the developers of the world to make their lives a bit easier.

After a lot of difficult work, we have created a code view that introduces tons of new features for understanding code in context, and those features can be used by anyone. And we did it all while also making the page faster!

We’re proud of what we built, and we would love for everyone to try it out and send us feedback!

Notes


  1. This quote, popularized by and often attributed to Donald Knuth, was first said by Sir Tony Hoare, the developer of the quicksort algorithm. 
  2. All performance metrics generated for this post use a development build of React in order to better compare apples to apples. 
  3. Check out the source code for this virtualization demo here! 
  4. The fact that browsers do not treat adjacent :before elements as part of the same block of text also introduces another complication: it resets the tab stop location for each node, which means that tabs are not rendered with the correct width! We need the syntax-highlighted overlay to align exactly with the text content underneath because any discrepancy creates a highly confusing user experience. Luckily, since the overlay is neither findable nor copyable, we can modify it however we like. The tab width problem is solved neatly by converting tabs to the appropriate number of spaces in the overlay. 
  5. Although code on GitHub is often nested deeply, the syntax information for a line of code can still be described linearly much of the time—we have a keyword followed by some plain text and then a string literal, etc. But sometimes it is not so simple—we might have a Markdown document with a code section. That code section might be an HTML document with a script tag. That script tag might contain JavaScript. That JavaScript might contain doc comments on a function. Those doc comments might contain @param tags which are rendered as keywords. We can handle this kind of arbitrarily nested syntax tree with a recursive React component. But that means the shape of our tree of React nodes, and therefore the amount of time it takes to perform DOM reconciliation, is determined by the code our users have chosen to write. On top of that, React adds DOM nodes one-at-a-time, and our overlay uses one DOM node per character of code. These are the main reasons that sidestepping React for this part of the page gives us such a dramatic performance boost. 

The technology behind GitHub’s new code search

Post Syndicated from Timothy Clem original https://github.blog/2023-02-06-the-technology-behind-githubs-new-code-search/

From launching our technology preview of the new and improved code search experience a year ago, to the public beta we released at GitHub Universe last November, there’s been a flurry of innovation and dramatic changes to some of the core GitHub product experiences around how we, as developers, find, read, and navigate code.

One question we hear about the new code search experience is, “How does it work?” And to complement a talk I gave at GitHub Universe, this post gives a high-level answer to that question and provides a small window into the system architecture and technical underpinnings of the product.

So, how does it work? The short answer is that we built our own search engine from scratch, in Rust, specifically for the domain of code search. We call this search engine Blackbird, but before I explain how it works, I think it helps to understand our motivation a little bit. At first glance, building a search engine from scratch seems like a questionable decision. Why would you do that? Aren’t there plenty of existing, open source solutions out there already? Why build something new?

To be fair, we’ve tried and have been trying, for almost the entire history of GitHub, to use existing solutions for this problem. You can read a bit more about our journey in Pavel Avgustinov’s post, A brief history of code search at GitHub, but one thing sticks out: we haven’t had a lot of luck using general text search products to power code search. The user experience is poor, indexing is slow, and it’s expensive to host. There are some newer, code-specific open source projects out there, but they definitely don’t work at GitHub’s scale. So, knowing all that, we were motivated to create our own solution by three things:

  1. We’ve got a vision for an entirely new user experience that’s about being able to ask questions of code and get answers through iteratively searching, browsing, navigating, and reading code.
  2. We understand that code search is uniquely different from general text search. Code is already designed to be understood by machines and we should be able to take advantage of that structure and relevance. Searching code also has unique requirements: we want to search for punctuation (for example, a period or open parenthesis); we don’t want stemming; we don’t want stop words to be stripped from queries; and, we want to search with regular expressions.
  3. GitHub’s scale is truly a unique challenge. When we first deployed Elasticsearch, it took months to index all of the code on GitHub (about 8 million repositories at the time). Today, that number is north of 200 million, and that code isn’t static: it’s constantly changing and that’s quite challenging for search engines to handle. For the beta, you can currently search almost 45 million repositories, representing 115 TB of code and 15.5 billion documents.

At the end of the day, nothing off the shelf met our needs, so we built something from scratch.

Just use grep?

First though, let’s explore the brute force approach to the problem. We get this question a lot: “Why don’t you just use grep?” To answer that, let’s do a little napkin math using ripgrep on that 115 TB of content. On a machine with an eight core Intel CPU, ripgrep can run an exhaustive regular expression query on a 13 GB file cached in memory in 2.769 seconds, or about 0.6 GB/sec/core.

We can see pretty quickly that this really isn’t going to work for the larger amount of data we have. Code search runs on 64 core, 32 machine clusters. Even if we managed to put 115 TB of code in memory and assume we can perfectly parallelize the work, we’re going to saturate 2,048 CPU cores for 96 seconds to serve a single query! Only that one query can run. Everybody else has to get in line. This comes out to a whopping 0.01 queries per second (QPS) and good luck doubling your QPS—that’s going to be a fun conversation with leadership about your infrastructure bill.

There’s just no cost-effective way to scale this approach to all of GitHub’s code and all of GitHub’s users. Even if we threw a ton of money at the problem, it still wouldn’t meet our user experience goals.

You can see where this is going: we need to build an index.

A search index primer

We can only make queries fast if we pre-compute a bunch of information in the form of indices, which you can think of as maps from keys to sorted lists of document IDs (called “posting lists”) where that key appears. As an example, here’s a small index for programming languages. We scan each document to detect what programming language it’s written in, assign a document ID, and then create an inverted index where language is the key and the value is a posting list of document IDs.

Forward index

Doc ID Content
1 def lim
puts “mit”
end
2 fn limits() {
3 function mits() {

Inverted index

Language Doc IDs (postings)
JavaScript 3, 8, 12, …
Ruby 1, 10, 13, …
Rust 2, 5, 11, …

For code search, we need a special type of inverted index called an ngram index, which is useful for looking up substrings of content. An ngram is a sequence of characters of length n. For example, if we choose n=3 (trigrams), the ngrams that make up the content “limits” are lim, imi, mit, its. With our documents above, the index for those trigrams would look like this:

ngram Doc IDs (postings)
lim 1, 2, …
imi 2, …
mit 1, 2, 3, …
its 2, 3, …

To perform a search, we intersect the results of multiple lookups to give us the list of documents where the string appears. With a trigram index you need four lookups: lim, imi, mit, and its in order to fulfill the query for limits.

Unlike a hashmap though, these indices are too big to fit in memory, so instead, we build iterators for each index we need to access. These lazily return sorted document IDs (the IDs are assigned based on the ranking of each document) and we intersect and union the iterators (as demanded by the specific query) and only read far enough to fetch the requested number of results. That way we never have to keep entire posting lists in memory.

Indexing 45 million repositories

The next problem we have is how to build this index in a reasonable amount of time (remember, this took months in our first iteration). As is often the case, the trick here is to identify some insight into the specific data we’re working with to guide our approach. In our case it’s two things: Git’s use of content addressable hashing and the fact that there’s actually quite a lot of duplicate content on GitHub. Those two insights lead us the the following decisions:

  1. Shard by Git blob object ID which gives us a nice way of evenly distributing documents between the shards while avoiding any duplication. There won’t be any hot servers due to special repositories and we can easily scale the number of shards as necessary.
  2. Model the index as a tree and use delta encoding to reduce the amount of crawling and to optimize the metadata in our index. For us, metadata are things like the list of locations where a document appears (which path, branch, and repository) and information about those objects (repository name, owner, visibility, etc.). This data can be quite large for popular content.

We also designed the system so that query results are consistent on a commit-level basis. If you search a repository while your teammate is pushing code, your results shouldn’t include documents from the new commit until it has been fully processed by the system. In fact, while you’re getting back results from a repository-scoped query, someone else could be paging through global results and looking at a different, prior, but still consistent state of the index. This is tricky to do with other search engines. Blackbird provides this level of query consistency as a core part of its design.

Let’s build an index

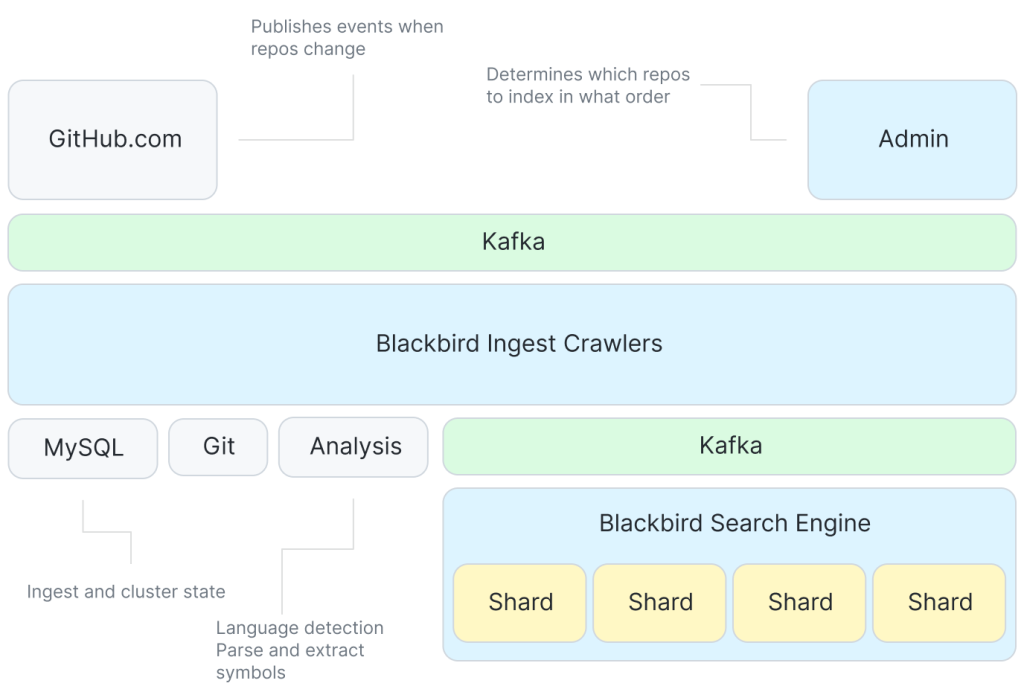
Armed with those insights, let’s turn our attention to building an index with Blackbird. This diagram represents a high level overview of the ingest and indexing side of the system.

a high level overview of the ingest and indexing side of the system

Kafka provides events that tell us to go index something. There are a bunch of crawlers that interact with Git and a service for extracting symbols from code, and then we use Kafka, again, to allow each shard to consume documents for indexing at its own pace.

Though the system generally just responds to events like git push to crawl changed content, we have some work to do to ingest all the repositories for the first time. One key property of the system is that we optimize the order in which we do this initial ingest to make the most of our delta encoding. We do this with a novel probabilistic data structure representing repository similarity and by driving ingest order from a level order traversal of a minimum spanning tree of a graph of repository similarity1.

Using our optimized ingest order, each repository is then crawled by diffing it against its parent in the delta tree we’ve constructed. This means we only need to crawl the blobs unique to that repository (not the entire repository). Crawling involves fetching blob content from Git, analyzing it to extract symbols, and creating documents that will be the input to indexing.

These documents are then published to another Kafka topic. This is where we partition2 the data between shards. Each shard consumes a single Kafka partition in the topic. Indexing is decoupled from crawling through the use of Kafka and the ordering of the messages in Kafka is how we gain query consistency.

The indexer shards then take these documents and build their indices: tokenizing to construct ngram indices3 (for content, symbols, and paths) and other useful indices (languages, owners, repositories, etc) before serializing and flushing to disk when enough work has accumulated.

Finally, the shards run compaction to collapse up smaller indices into larger ones that are more efficient to query and easier to move around (for example, to a read replica or for backups). Compaction also k-merges the posting lists by score so relevant documents have lower IDs and will be returned first by the lazy iterators. During the initial ingest, we delay compaction and do one big run at the end, but then as the index keeps up with incremental changes, we run compaction on a shorter interval as this is where we handle things like document deletions.

Life of a query

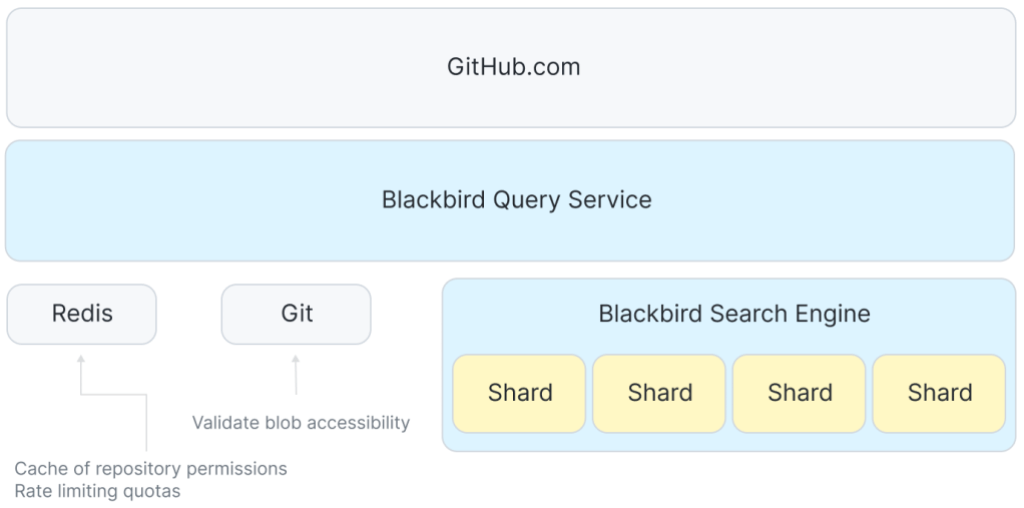
Now that we have an index, it’s interesting to trace a query through the system. The query we’re going to follow is a regular expression qualified to the Rails organization looking for code written in the Ruby programming language: /arguments?/ org:rails lang:Ruby. The high level architecture of the query path looks a little bit like this:

Architecture diagram of a query path.

In between GitHub.com and the shards is a service that coordinates taking user queries and fanning out requests to each host in the search cluster. We use Redis to manage quotas and cache some access control data.

The front end accepts the user query and passes it along to the Blackbird query service where we parse the query into an abstract syntax tree and then rewrite it, resolving things like languages to their canonical Linguist language ID and tagging on extra clauses for permissions and scopes. In this case, you can see how rewriting ensures that I’ll get results from public repositories or any private repositories that I have access to.

And(
    Owner("rails"),
    LanguageID(326),
    Regex("arguments?"),
    Or(
        RepoIDs(...),
        PublicRepo(),
    ),
)

Next, we fan out and send n concurrent requests: one to each shard in the search cluster. Due to our sharding strategy, a query request must be sent to each shard in the cluster.

On each individual shard, we then do some further conversion of the query in order to lookup information in the indices. Here, you can see that the regex gets translated into a series of substring queries on the ngram indices.

and(
  owners_iter("rails"),
  languages_iter(326),
  or(
    and(
      content_grams_iter("arg"),
      content_grams_iter("rgu"),
      content_grams_iter("gum"),
      or(
        and(
         content_grams_iter("ume"),
         content_grams_iter("ment")
        )
        content_grams_iter("uments"),
      )
    ),
    or(paths_grams_iter…)
    or(symbols_grams_iter…)
  ), 
  …
)

If you want to learn more about a method to turn regular expressions into substring queries, see Russ Cox’s article on Regular Expression Matching with a Trigram Index. We use a different algorithm and dynamic gram sizes instead of trigrams (see below3). In this case the engine uses the following grams: arg,rgu, gum, and then either ume and ment, or the 6 gram uments.

The iterators from each clause are run: and means intersect, or means union. The result is a list of documents. We still have to double check each document (to validate matches and detect ranges for them) before scoring, sorting, and returning the requested number of results.

Back in the query service, we aggregate the results from all shards, re-sort by score, filter (to double-check permissions), and return the top 100. The GitHub.com front end then still has to do syntax highlighting, term highlighting, pagination, and finally we can render the results to the page.

Our p99 response times from individual shards are on the order of 100 ms, but total response times are a bit longer due to aggregating responses, checking permissions, and things like syntax highlighting. A query ties up a single CPU core on the index server for that 100 ms, so our 64 core hosts have an upper bound of something like 640 queries per second. Compared to the grep approach (0.01 QPS), that’s screaming fast with plenty of room for simultaneous user queries and future growth.

In summary

Now that we’ve seen the full system, let’s revisit the scale of the problem. Our ingest pipeline can publish around 120,000 documents per second, so working through those 15.5 billion documents should take about 36 hours. But delta indexing reduces the number of documents we have to crawl by over 50%, which allows us to re-index the entire corpus in about 18 hours.

There are some big wins on the size of the index as well. Remember that we started with 115 TB of content that we want to search. Content deduplication and delta indexing brings that down to around 28 TB of unique content. And the index itself clocks in at just 25 TB, which includes not only all the indices (including the ngrams), but also a compressed copy of all unique content. This means our total index size including the content is roughly a quarter the size of the original data!

If you haven’t signed up already, we’d love for you to join our beta and try out the new code search experience. Let us know what you think! We’re actively adding more repositories and fixing up the rough edges based on feedback from people just like you.

Notes


  1. To determine the optimal ingest order, we need a way to tell how similar one repository is to another (similar in terms of their content), so we invented a new probabilistic data structure to do this in the same class of data structures as MinHash and HyperLogLog. This data structure, which we call a geometric filter, allows computing set similarity and the symmetric difference between sets with logarithmic space. In this case, the sets we’re comparing are the contents of each repository as represented by (path, blob_sha) tuples. Armed with that knowledge, we can construct a graph where the vertices are repositories and edges are weighted with this similarity metric. Calculating a minimum spanning tree of this graph (with similarity as cost) and then doing a level order traversal of the tree gives us an ingest order where we can make best use of delta encoding. Really though, this graph is enormous (millions of nodes, trillions of edges), so our MST algorithm computes an approximation that only takes a few minutes to calculate and provides 90% of the delta compression benefits we’re going for. 
  2. The index is sharded by Git blob SHA. Sharding means spreading the indexed data out across multiple servers, which we need to do in order to easily scale horizontally for reads (where we are concerned about QPS), for storage (where disk space is the primary concern), and for indexing time (which is constrained by CPU and memory on the individual hosts). 
  3. The ngram indices we use are especially interesting. While trigrams are a known sweet spot in the design space (as Russ Cox and others have noted: bigrams aren’t selective enough and quadgrams take up too much space), they cause some problems at our scale.

    For common grams like for trigrams aren’t selective enough. We get way too many false positives and that means slow queries. An example of a false positive is something like finding a document that has each individual trigram, but not next to each other. You can’t tell until you fetch the content for that document and double check at which point you’ve done a lot of work that has to be discarded. We tried a number of strategies to fix this like adding follow masks, which use bitmasks for the character following the trigram (basically halfway to quad grams), but they saturate too quickly to be useful.

    We call the solution “sparse grams,” and it works like this. Assume you have some function that given a bigram gives a weight. As an example, consider the string chester. We give each bigram a weight: 9 for “ch”, 6 for “he”, 3 for “es”, and so on.

    Click to view slideshow.

    Using those weights, we tokenize by selecting intervals where the inner weights are strictly smaller than the weights at the borders. The inclusive characters of that interval make up the ngram and we apply this algorithm recursively until its natural end at trigrams. At query time, we use the exact same algorithm, but keep only the covering ngrams, as the others are redundant. 

A brief history of code search at GitHub

Post Syndicated from Pavel Avgustinov original https://github.blog/2021-12-15-a-brief-history-of-code-search-at-github/

We recently launched a technology preview for the next-generation code search we have been building. If you haven’t signed up already, go ahead and do it now!

We want to share more about our work on code exploration, navigation, search, and developer productivity. Recently, we substantially improved the precision of our code navigation for Python, and open-sourced the tools we developed for this. The stack graph formalism we developed will form the basis for precise code navigation support for more languages, and will even allow us to empower language communities to build and improve support for their own languages, similarly to how we accept contributions to github/linguist to expand GitHub’s syntax highlighting capabilities.

This blog post is part of the same series, and tells the story of why we built a new search engine optimized for code over the past 18 months. What challenges did we set ourselves? What is the historical context, and why could we not continue to build on off-the-shelf solutions? Read on to find out.

What’s our goal?

We set out to provide an experience that could become an integral part of every developer’s workflow. This has imposed hard constraints on the features, performance, and scalability of the system we’re building. In particular:

  • Searching code is different: many standard techniques (like stemming and tokenization) are at odds with the kind of searches we want to support for source code. Identifier names and punctuation matter. We need to be able to match substrings, not just whole “words”. Specialized queries can require wildcards or even regular expressions. In addition, scoring heuristics tuned for natural language and web pages do not work well for source code.
  • The scale of the corpus size: GitHub hosts over 200 million repositories, with over 61 million repositories created in the past year. We aim to support global queries across all of them, now and in the foreseeable future.
  • The rate of change: over 170 million pull requests were merged in the past year, and this does not even account for code pushed directly to a branch. We would like our index to reflect the updated state of a repository within a few minutes of a push event.
  • Search performance and latency: developers want their tools to be blazingly fast, and if we want to become part of every developer’s workflow we have to satisfy that expectation. Despite the scale of our index, we want p95 query times to be (well) under a second. Most user queries, or queries scoped to a set of repositories or organizations, should be much faster than that.

Over the years, GitHub has leveraged several off-the-shelf solutions, but as the requirements evolved over time, and the scale problem became ever more daunting, we became convinced that we had to build a bespoke search engine for code to achieve our objectives.

The early years

In the beginning, GitHub announced support for code search, as you might expect from a website with the tagline of “Social Code Hosting.” And all was well.

Screenshot of GitHub public code search

Except… you might note the disclaimer “GitHub Public Code Search.” This first iteration of global search worked by indexing all public documents into a Solr instance, which determined the results you got. While this nicely side-steps visibility and authorization concerns (everything is public!), not allowing private repositories to be searched would be a major functionality gap. The solution?

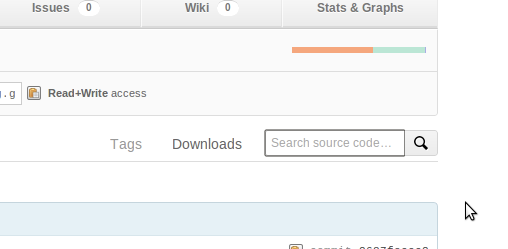
Screenshot of Solr-backed "Search source code"

Image credit: Patrick Linskey on Stack Overflow

The repository page showed a “Search source code” field. For public repos, this was still backed by the Solr index, scoped to the active repository. For private repos, it shelled out to git grep.

Quite soon after shipping this, the then-in-beta Google Code Search began crawling public repositories on GitHub too, thus giving developers an alternative way of searching them. (Ultimately, Google Code Search was discontinued a few years later, though Russ Cox’s excellent blog post on how it worked remains a great source of inspiration for successor projects.)

Unfortunately, the different search experience for public and private repositories proved pretty confusing in practice. In addition, while git grep is a widely understood gold standard for how to search the contents of a Git repository, it operates without a dedicated index and hence works by scanning each document—taking time proportional to the size of the repository. This could lead to resource exhaustion on the Git hosts, and to an unresponsive web page, making it necessary to introduce timeouts. Large private repositories remained unsearchable.

Scaling with Elasticsearch

By 2010, the search landscape was seeing considerable upheaval. Solr joined Lucene as a subproject, and Elasticsearch sprang up as a great way of building and scaling on top of Lucene. While Elasticsearch wouldn’t hit a 1.0.0 release until February 2014, GitHub started experimenting with adopting it in 2011. An initial tentative experiment that indexed gists into Elasticsearch to make them searchable showed great promise, and before long it was clear that this was the future for all search on GitHub, including code search.

Indeed in early 2013, just as Google Code Search was winding down, GitHub launched a whole new code search backed by an Elasticsearch cluster, consolidating the search experience for public and private repositories and updating the design. The search index covered almost five million repositories at launch.

Screenshot of Elasticsearch-backed code search UI

The scale of operations was definitely challenging, and within days or weeks of the launch GitHub experienced its first code search outages. The postmortem blog post is quite interesting on several levels, and it gives a glimpse of the cluster size (26 storage nodes with 2 TB of SSD storage each), utilization (67% of storage used), environment (Elasticsearch 0.19.9 and 0.20.2, Java 6 and 7), and indexing complexity (several months to backfill all repository data). Several bugs in Elasticsearch were identified and fixed, allowing GitHub to resume operations on the code search service.

In November 2013, Elasticsearch published a case study on GitHub’s code search cluster, again including some interesting data on scale. By that point, GitHub was indexing eight million repositories and responding to 5 search requests per second on average.

In general, our experience working with Elasticsearch has been truly excellent. It powers all kinds of search on GitHub.com, doing an excellent job throughout. The code search index is by far the largest cluster we operate , and it has grown in scale by another 20-40x since the case study (to 162 nodes, comprising 5184 vCPUs, 40TB of RAM, and 1.25PB of backing storage, supporting a query load of 200 requests per second on average and indexing over 53 billion source files). It is a testament to the capabilities of Elasticsearch that we have got this far with essentially an off-the-shelf search engine.

My code is not a novel

Elasticsearch excelled at most search workloads, but almost immediately some wrinkles and friction started cropping up in connection with code search. Perhaps the most widely observed is this comment from the code search documentation:

You can’t use the following wildcard characters as part of your search query: . , : ; / \ ` ' " = * ! ? # $ & + ^ | ~ < > ( ) { } [ ] @. The search will simply ignore these symbols.

Source code is not like normal text, and those “punctuation” characters actually matter. So why are they ignored by GitHub’s production code search? It comes down to how our ingest pipeline for Elasticsearch is configured.

Click here to read the full details

 
When documents are added to an Elasticsearch index, they are passed through a process called text analysis, which converts unstructured text into a structured format optimized for search. Commonly, text analysis is configured to normalize away details that don’t matter to search (for example, case folding the document to provide case-insensitive matches, or compressing runs of whitespace into one, or stemming words so that searching for “ingestion” also finds “ingest pipeline”). Ultimately, it performs tokenization, splitting the normalized input document into a list of tokens whose occurrence should be indexed.

Many features and defaults available to text analysis are geared towards indexing natural-language text. To create an index for source code, we defined a custom text analyzer, applying a carefully selected set of normalizations (for example, case-folding and compressing whitespace make sense, but stemming does not). Then, we configured a custom pattern tokenizer, splitting the document using the following regular expression: %q_[.,:;/\\\\`'"=*!@?#$&+^|~<>(){}\[\]\s]_. If you look closely, you’ll recognise the list of characters that are ignored in your query string!

The tokens resulting from this split then undergo a final round of splitting, extracting word parts delimited in CamelCase and snake_case as additional tokens to make them searchable. To illustrate, suppose we are ingesting a document containing this declaration: pub fn pthread_getname_np(tid: ::pthread_t, name: *mut ::c_char, len: ::size_t) -> ::c_int;. Our text analysis phase would pass the following list of tokens to Elasticsearch to index: pub fn pthread_getname_np pthread getname np tid pthread_t pthread t name mut c_char c char len size_t size t c_int c int. The special characters simply do not figure in the index; instead, the focus is on words recovered from identifiers and keywords.

Designing a text analyzer is tricky, and involves hard trade-offs between index size and performance on the one hand, and the types of queries that can be answered on the other. The approach described above was the result of careful experimentation with different strategies, and represented a good compromise that has allowed us to launch and evolve code search for almost a decade.

 
Another consideration for source code is substring matching. Suppose that I want to find out how to get the name of a thread in Rust, and I vaguely remember the function is called something like thread_getname. Searching for thread_getname org:rust-lang will give no results on our Elasticsearch index; meanwhile, if I cloned rust-lang/libc locally and used git grep, I would instantly find pthread_getname_np. More generally, power users reach for regular expression searches almost immediately.

The earliest internal discussions of this that I can find date to October 2012, more than a year before the public release of Elasticsearch-based code search. We considered various ways of refining the Elasticsearch tokenization (in fact, we turn pthread_getname_np into the tokens pthread, getname, np, and pthread_getname_np—if I had searched for pthread getname rather than thread_getname, I would have found the definition of pthread_getname_np). We also evaluated trigram tokenization as described by Russ Cox. Our conclusion was summarized by a GitHub employee as follows:

The trigram tokenization strategy is very powerful. It will yield wonderful search results at the cost of search time and index size. This is the approach I would like to take, but there is work to be done to ensure we can scale the ElasticSearch cluster to meet the needs of this strategy.

Given the initial scale of the Elasticsearch cluster mentioned above, it wasn’t viable to substantially increase storage and CPU requirements at the time, and so we launched with a best-effort tokenization tuned for code identifiers.

Over the years, we kept coming back to this discussion. One promising idea for supporting special characters, inspired by some conversations with Elasticsearch experts at Elasticon 2016, was to use a Lucene tokenizer pattern that split code on runs of whitespace, but also on transitions from word characters to non-word characters (crucially, using lookahead/lookbehind assertions, without consuming any characters in this case; this would create a token for each special character). This would allow a search for ”answer >= 42” to find the source text answer >= 42 (disregarding whitespace, but including the comparison). Experiments showed this approach took 43-100% longer to index code, and produced an index that was 18-28% larger than the baseline. Query performance also suffered: at best, it was as fast as the baseline, but some queries (especially those that used special characters, or otherwise split into many tokens) were up to 4x slower. In the end, a typical query slowdown of 2.1x seemed like too high a price to pay.

By 2019, we had made significant investments in scaling our Elasticsearch cluster simply to keep up with the organic growth of the underlying code corpus. This gave us some performance headroom, and at GitHub Universe 2019 we felt confident enough to announce an “exact-match search” beta, which essentially followed the ideas above and was available for allow-listed repositories and organizations. We projected around a 1.3x increase in Elasticsearch resource usage for this index. The experience from the limited beta was very illuminating, but it proved too difficult to balance the additional resource requirements with ongoing growth of the index. In addition, even after the tokenization improvements, there were still numerous unsupported use cases (like substring searches and regular expressions) that we saw no path towards. Ultimately, exact-match search was sunset in just over half a year.

Project Blackbird

Actually, a major factor in pausing investment in exact-match search was a very promising research prototype search engine, internally code-named Blackbird. The project had been kicked off in early 2020, with the goal of determining which technologies would enable us to offer code search features at GitHub scale, and it showed a path forward that has led to the technology preview we launched last week.

Let’s recall our ambitious objectives: comprehensively index all source code on GitHub, support incremental indexing and document deletion, and provide lightning-fast exact-match and regex searches (specifically, a p95 of under a second for global queries, with correspondingly lower targets for org-scoped and repo-scoped searches). Do all this without using substantially more resources than the existing Elasticsearch cluster. Integrate other sources of rich code intelligence information available on GitHub. Easy, right?

We found that no off-the-shelf code indexing solution could satisfy those requirements. Russ Cox’s trigram index for code search only stores document IDs rather than positions in the posting lists; while that makes it very space-efficient, performance degrades rapidly with a large corpus size. Several successor projects augment the posting lists with position information or other data; this comes at a large storage and RAM cost (Zoekt reports a typical index size of 3.5x corpus size) that makes it too expensive at our scale. The sharding strategy is also crucial, as it determines how evenly distributed the load is. And any significant per-repo overhead becomes prohibitive when considering scaling the index to all repositories on GitHub.

In the end, Blackbird convinced us to go all-in on building a custom search engine for code. Written in Rust, it creates and incrementally maintains a code search index sharded by Git blob object ID; this gives us substantial storage savings via deduplication and guarantees a uniform load distribution across shards (something that classic approaches sharding by repo or org, like our existing Elasticsearch cluster, lack). It supports regular expression searches over document content and can capture additional metadata—for example, it also maintains an index of symbol definitions. It meets our performance goals: while it’s always possible to come up with a pathological search that misses the index, it’s exceptionally fast for “real” searches. The index is also extremely compact, weighing in at about ⅔ of the (deduplicated) corpus size.

One crucial realization was that if we want to index all code on GitHub into a single index, result scoring and ranking are absolutely critical; you really need to find useful documents first. Blackbird implements a number of heuristics, some code-specific (ranking up definitions and penalizing test code), and others general-purpose (ranking up complete matches and penalizing partial matches, so that when searching for thread an identifier called thread will rank above thread_id, which will rank above pthread_getname_np). Of course, the repository in which a match occurs also influences ranking. We want to show results from popular open-source repositories before a random match in a long-forgotten repository created as a test.

All of this is very much a work in progress. We are continuously tuning our scoring and ranking heuristics, optimizing the index and query process, and iterating on the query language. We have a long list of features to add. But we want to get what we have today into the hands of users, so that your feedback can shape our priorities.

We have more to share about the work we’re doing to enhance developer productivity at GitHub, so stay tuned.

The shoulders of giants

Modern software development is about collaboration and about leveraging the power of open source. Our new code search is no different. We wouldn’t have gotten anywhere close to its current state without the excellent work of tens of thousands of open source contributors and maintainers who built the tools we use, the libraries we depend on, and whose insightful ideas we could adopt and develop. A small selection of shout-outs and thank-yous:

  • The communities of the languages and frameworks we build on: Rust, Go, and React. Thanks for enabling us to move fast.
  • @BurntSushi: we are inspired by Andrew’s prolific output, and his work on the regex and aho-corasick crates in particular has been invaluable to us.
  • @lemire’s work on fast bit packing is integral to our design, and we drew a lot of inspiration from his optimization work more broadly (especially regarding the use of SIMD). Check out his blog for more.
  • Enry and Tree-sitter, which power Blackbird’s language detection and symbol extraction, respectively.

Improving GitHub code search

Post Syndicated from Pavel Avgustinov original https://github.blog/2021-12-08-improving-github-code-search/

Today, we are rolling out a technology preview for substantial improvements to searching code on GitHub. We want to give you an early look at our efforts and get your feedback as we iterate on helping you explore and discover code—all while saving you time and keeping you focused. Sign up for the waitlist now, and give us your feedback!

Getting started

Once the technology preview is enabled for your account, you can try it out at https://cs.github.com. Initially, we’re creating a separate interface for the new code search as we build it out, but once we’re happy with the feedback and are ready for wider adoption, we will integrate it into the main github.com experience.

At the moment, the search index covers more than five million of the most popular public repositories; in addition, you can search private repositories you have access to. Here are some things to look out for:

  • Easily find what you’re looking for among the top results, with smart ranking and an index that is optimized for code.
  • Search for an exact string, with support for substring matches and special characters, or use regular expressions (enclosed in / separators).
  • Scope your searches with org: or repo: qualifiers, with auto-completion suggestions in the search box.
  • Refine your results using filters like language:, path:, extension:, and Boolean operators (OR, NOT). Search for definitions of a symbol with symbol:.
  • Get your bearings quickly with additional features, like a directory tree view, symbol information for the active scope, jump-to-definition, select-to-search, and more!

The syntax is documented here, and you can press ? on any page to view available keyboard shortcuts. You can also check out the FAQs.

What’s next?

We’re excited to share our work with you as a technology preview while we iterate, and to work with you to find unique, novel use cases and workflows. What radical new idea have you always wanted to try? What feature would make you most productive? Is support for your favorite language missing? Let us know, and let’s make it happen together.

We have no shortage of ideas for what to focus on next. We’ll be growing the index until it covers every repository you can access on GitHub. We’ll experiment with scoring and ranking heuristics to see what works best, and we’ll explore what APIs and integrations would be most impactful. We’ll keep adding support for more languages to the language-specific features. But most of all, we want to listen to your feedback and build the tools you didn’t even know you needed.

The bigger picture: developer productivity at GitHub

As a developer, staying in a flow state is hard. Whenever you look up how to use a library, or have a test fail because your developer environment has diverged from CI, or need to know how an error message can arise, you are interrupted. The longer it takes to resolve the interruption, the more context you lose.

Earlier this year, we launched GitHub Copilot as a technical preview, leveraging the power of AI to let you code confidently even in unfamiliar territory. We also released Codespaces and shared how adopting them internally boosted GitHub’s own productivity. We see our improvements to code search and navigation in the context of these broader initiatives around developer productivity, as part of a unified solution.

For code search, our vision is to help every developer search, discover, navigate, and understand code quickly and intuitively. GitHub code search puts the world’s code at your fingertips: everything is just a search away. It helps you maintain a flow state by showing you the most relevant results first and helping you with auto-completion at every step. And once you get to a result page, the rich browsing experience is optimized for reading and understanding code, allowing you to make sense of unfamiliar logic quickly, even for code outside your IDE.

We plan to share more updates on our progress soon, including deep-dives on the engineering work behind code search and the developers, open source projects, and communities we rely on (special shout-out to @BurntSushi and @lemire, whose work has been fundamental to ours). In the meantime, the number of spots for the technology preview is limited, so sign up today!