Picture the scene: you have a Raspberry Pi configured to run on your network, you power it up headless (without a monitor), and now you need to know which IP address it was assigned.
Matthias came up with this solution, which makes your Raspberry Pi blink its IP address, because he used a Raspberry Pi Zero W headless for most of his projects and got bored with having to look it up with his DHCP server or hunt for it by pinging different IP addresses.
How does it work?
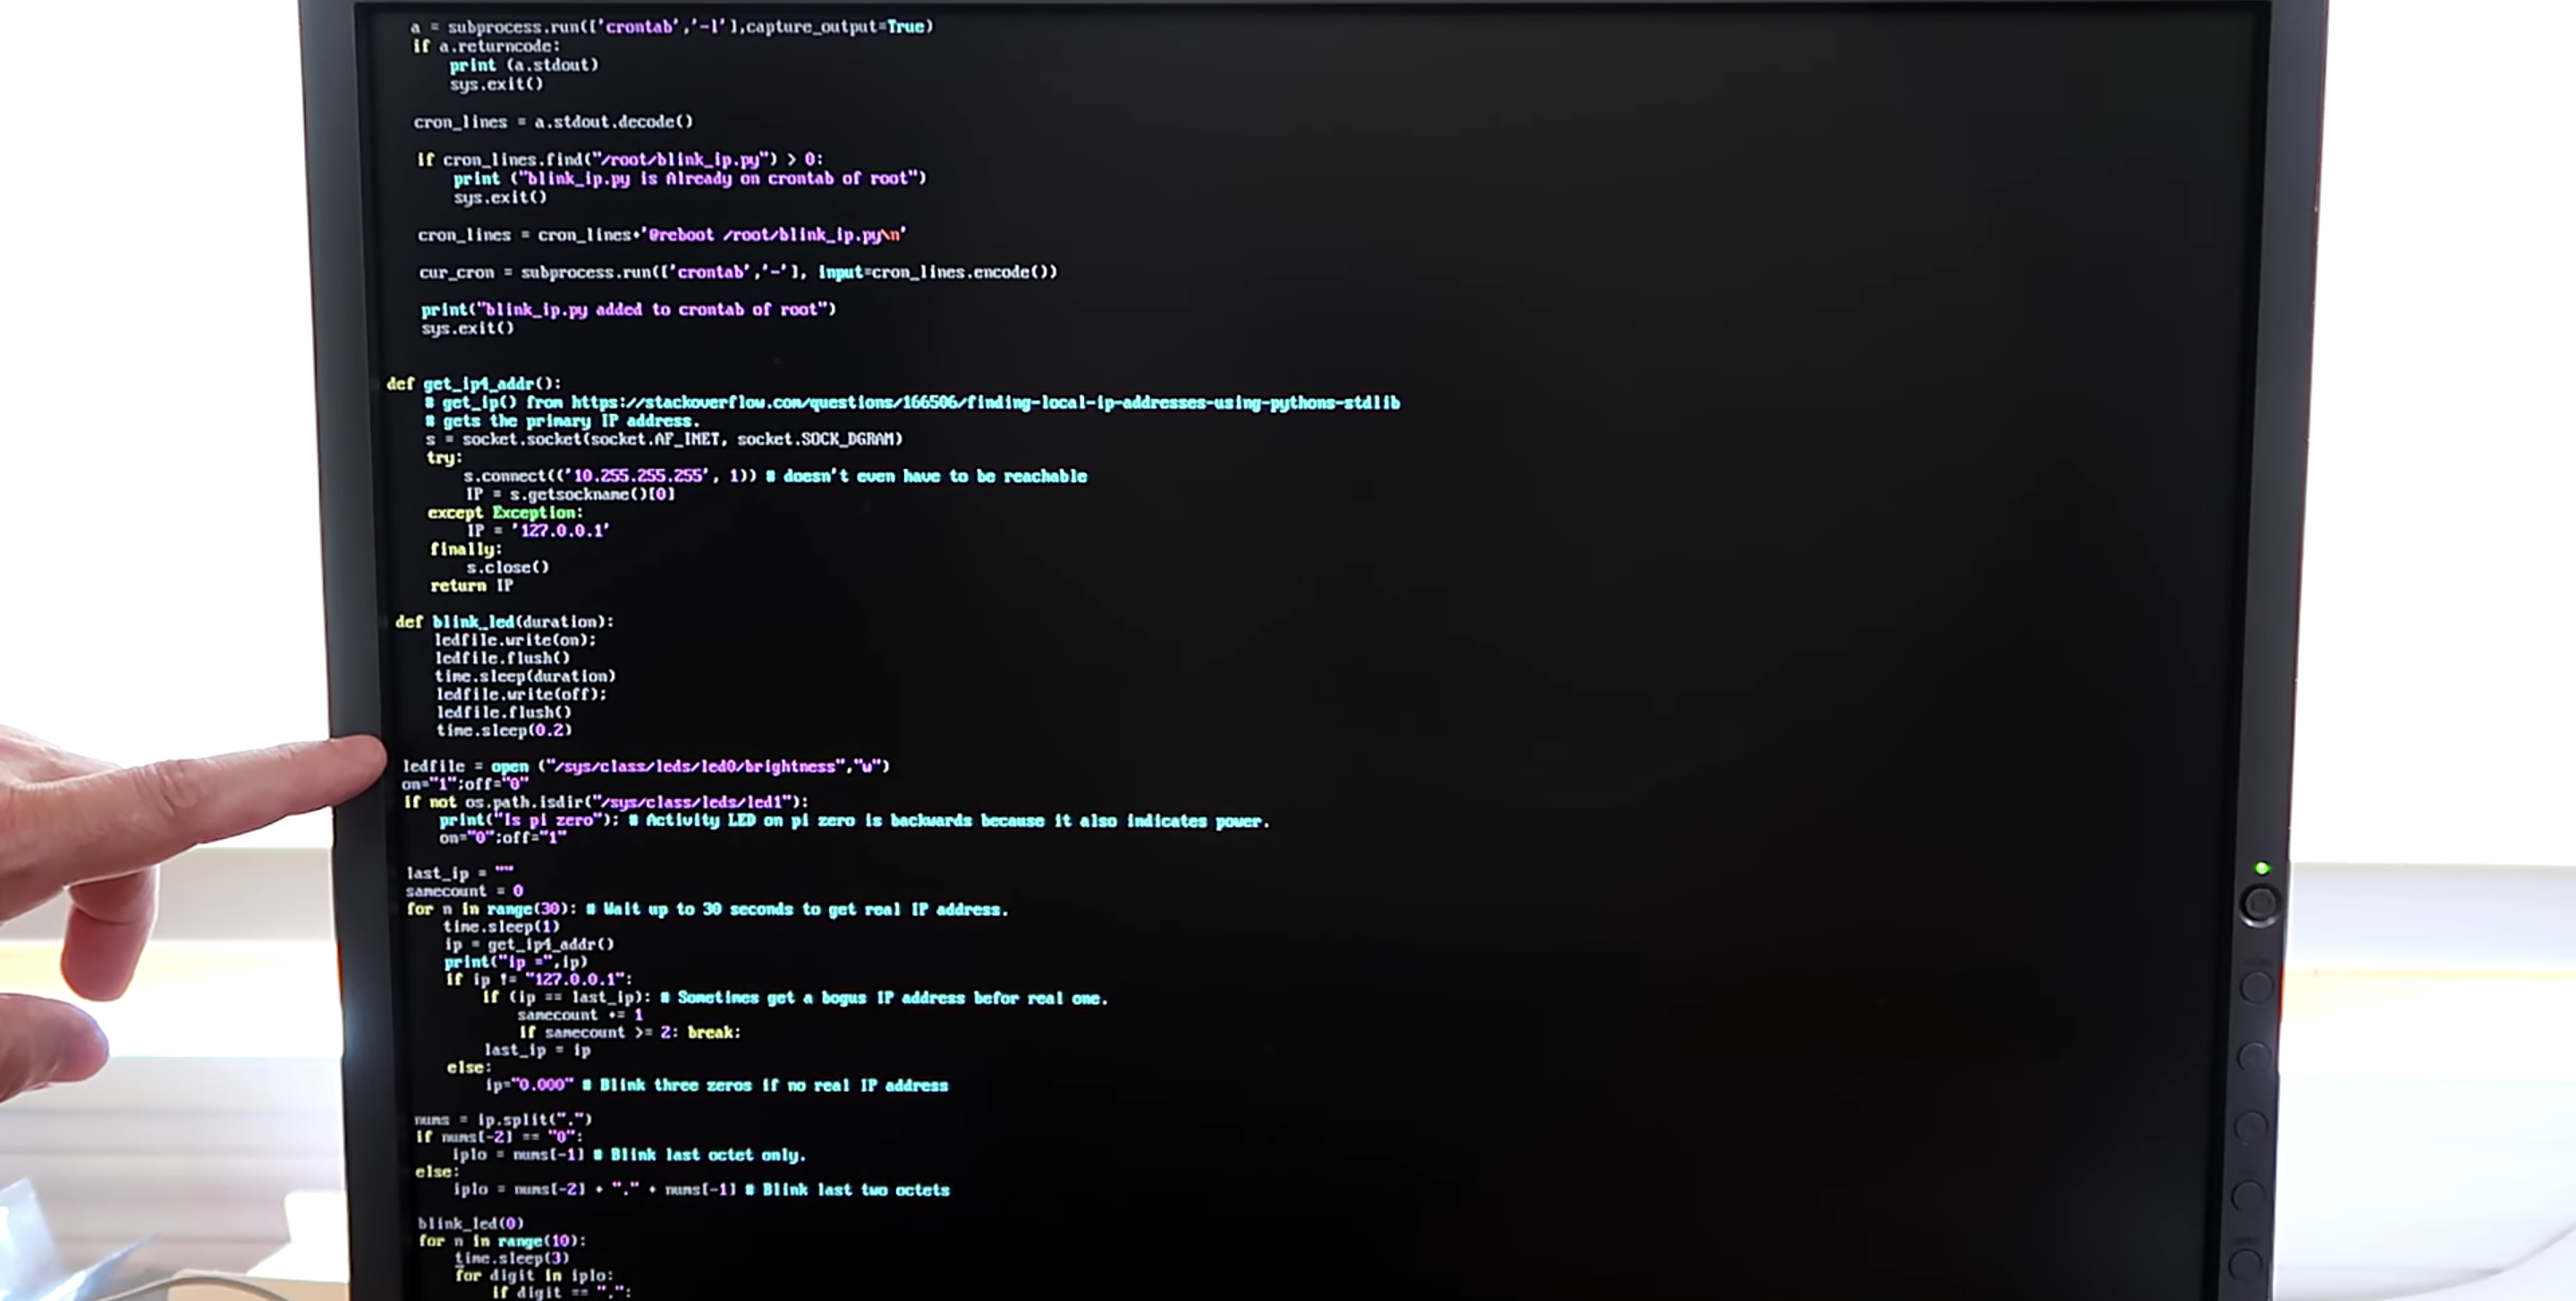
A script runs when you start your Raspberry Pi and indicates which IP address is assigned to it by blinking it out on the device’s LED. The script comprises about 100 lines of Python, and you can get it on GitHub.
Easy peasy GitHub breezy
The power/status LED on the edge of the Raspberry Pi blinks numbers in a Roman numeral-like scheme. You can tell which number it’s blinking based on the length of the blink and the gaps between each blink, rather than, for example, having to count nine blinks for a number nine.
Blinking in Roman numerals
Short, fast blinks represent the numbers one to four, depending on how many short, fast blinks you see. A gap between short, fast blinks means the LED is about to blink the next digit of the IP address, and a longer blink represents the number five. So reading the combination of short and long blinks will give you your device’s IP address.
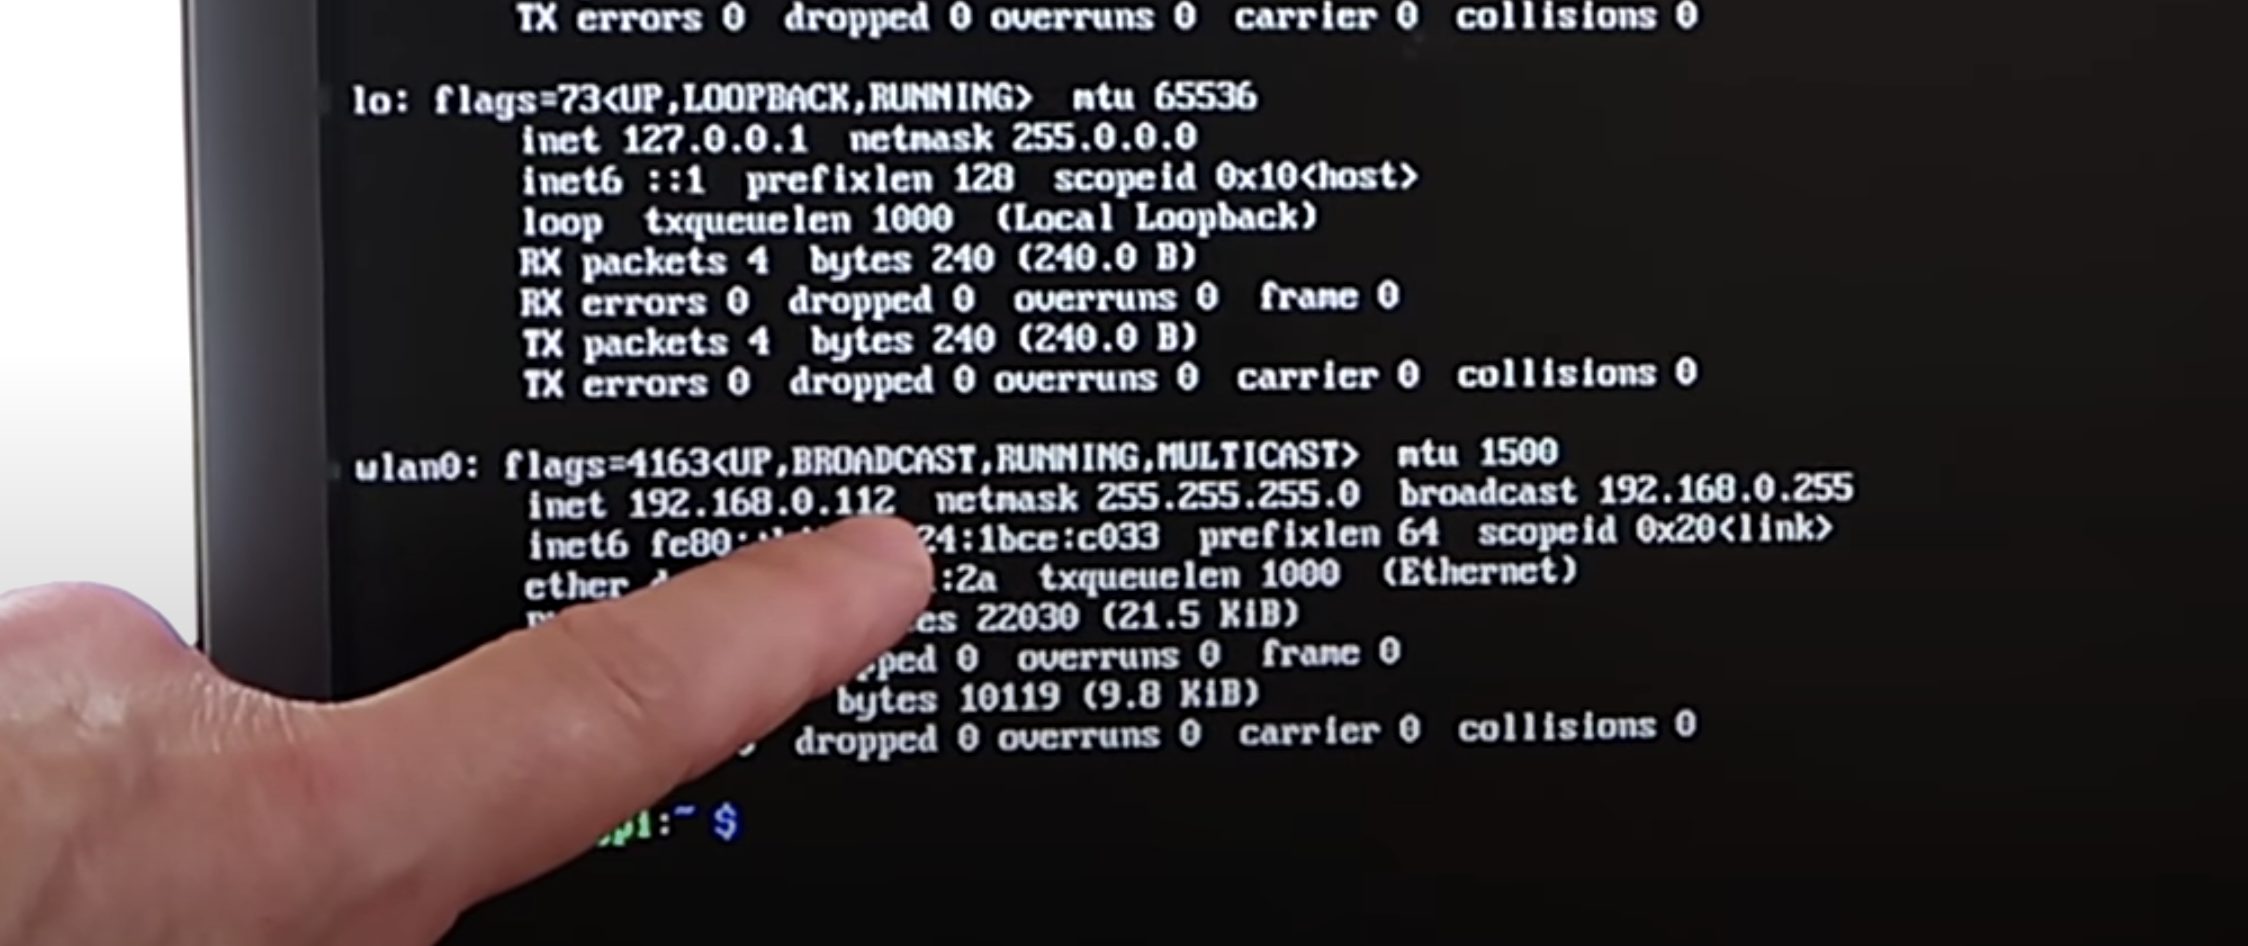
You can see this in action at this exact point in the video. You’ll see the LED blink fast once, then leave a gap, blink fast once again, then leave a gap, then blink fast twice. That means the device’s IP address ends in 112.
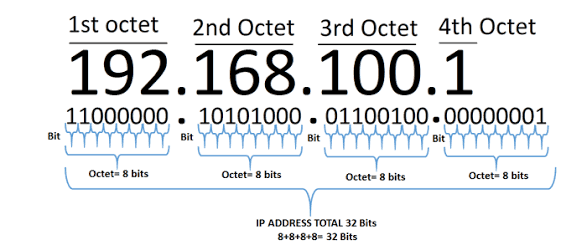
What are octets?
Luckily, you usually only need to know the last three numbers of the IP address (the last octet), as the previous octets will almost always be the same for all other computers on the LAN.
The script blinks out the last octet ten times, to give you plenty of chances to read it. Then it returns the LED to its default functionality.
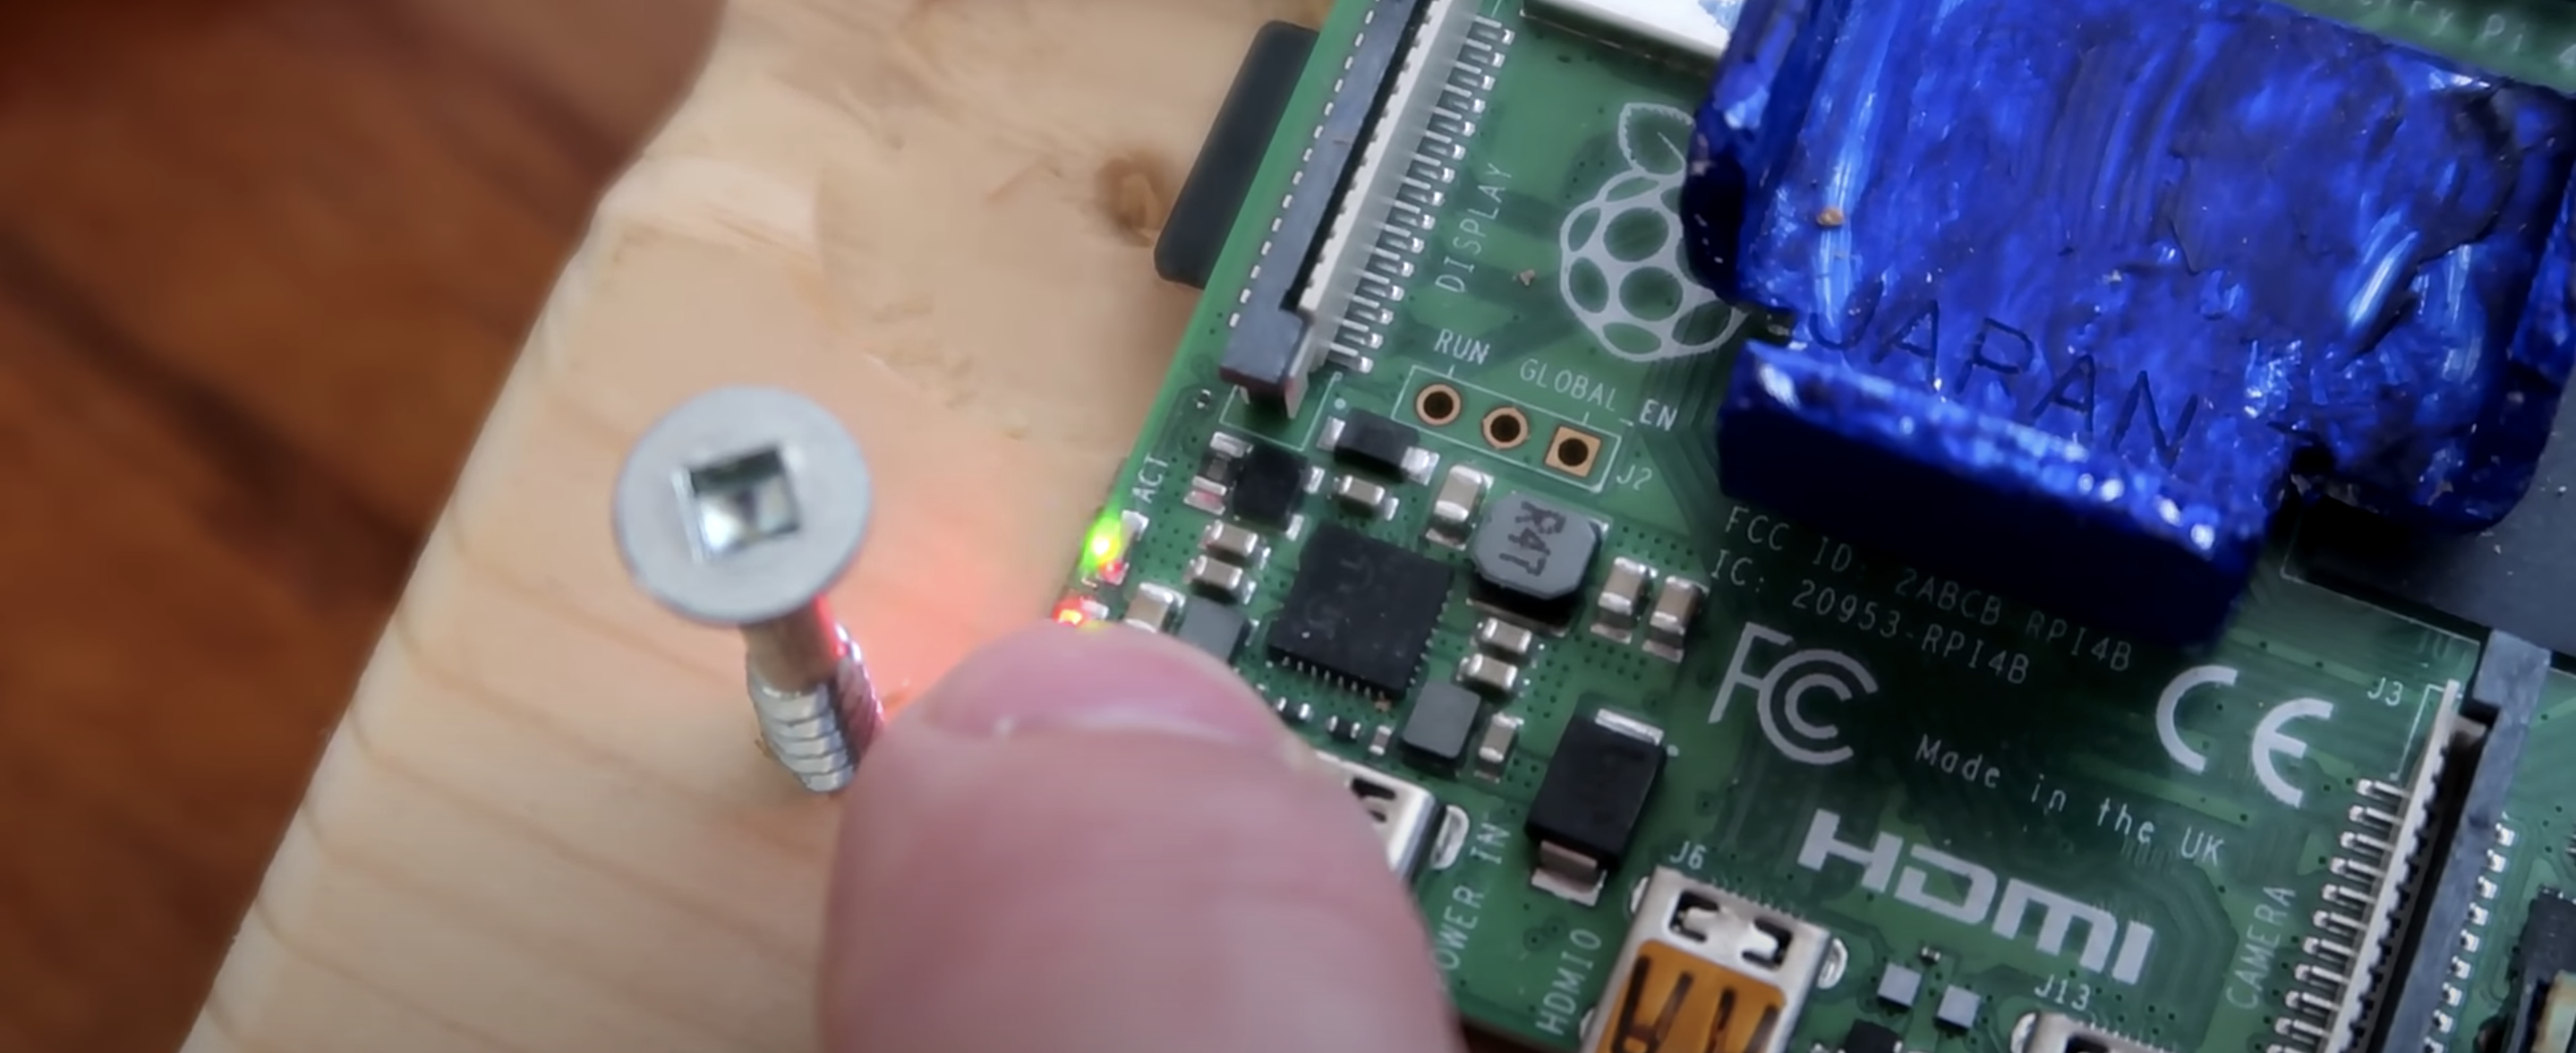
Which LED on which Raspberry Pi?
On a Raspberry Pi Zero W, the script uses the green status/power LED, and on other Raspberry Pis it uses the green LED next to the red power LED.
The green LED blinking the IP address (the red power LED is slightly hidden by Matthias’ thumb)
Once you get the hang of the Morse code-like blinking style, this is a really nice quick solution to find your device’s IP address and get on with your project.
Jennifer Fox is back, this time with a Raspberry Pi Zero–controlled impact force monitor that will notify you if your collision is a worth a trip to the doctor.
Check out my latest Hacker in Residence project for SparkFun Electronics: the Helmet Guardian! It’s a Pi Zero powered impact force monitor that turns on an LED if your head/body experiences a potentially dangerous impact. Install in your sports helmets, bicycle, or car to keep track of impact and inform you when it’s time to visit the doctor.
Concussion
We’ve all knocked our heads at least once in our lives, maybe due to tripping over a loose paving slab, or to falling off a bike, or to walking into the corner of the overhead cupboard door for the third time this week — will I ever learn?! More often than not, even when we’re seeing stars, we brush off the accident and continue with our day, oblivious to the long-term damage we may be doing.
Force of impact
After some thorough research, Jennifer Fox, founder of FoxBot Industries, concluded that forces of 4 to 6 G sustained for more than a few seconds are dangerous to the human body. With this in mind, she decided to use a Raspberry Pi Zero W and an accelerometer to create helmet with an impact force monitor that notifies its wearer if this level of G-force has been met.
Obviously, if you do have a serious fall, you should always seek medical advice. This project is an example of how affordable technology can be used to create medical and citizen science builds, and not a replacement for professional medical services.
Setting up the impact monitor
Jennifer’s monitor requires only a few pieces of tech: a Zero W, an accelerometer and breakout board, a rechargeable USB battery, and an LED, plus the standard wires and resistors for these components.
After installing Raspbian, Jennifer enabled SSH and I2C on the Zero W to make it run headlessly, and then accessed it from a laptop. This allows her to control the Pi without physically connecting to it, and it makes for a wireless finished project.
Jen wired the Pi to the accelerometer breakout board and LED as shown in the schematic below.
The LED acts as a signal of significant impacts, turning on when the G-force threshold is reached, and not turning off again until the program is reset.
Jason Barnett used the pots feature of the Monzo banking API to create a simple e-paper display so that his kids can keep track of their pocket money.
Monzo
For those outside the UK: Monzo is a smartphone-based bank that allows costumers to manage their money and payment cards via an app, removing the bank clerk middleman.
In the Monzo banking app, users can set up pots, which allow them to organise their money into various, you guessed it, pots. You want to put aside holiday funds, budget your food shopping, or, like Jason, manage your kids’ pocket money? Using pots is an easy way to do it.
Jason’s Monzo Pot ePaper tracker
After failed attempts at keeping track of his sons’ pocket money via a scrap of paper stuck to the fridge, Jason decided to try a new approach.
He started his build by installing Stretch Lite to the SD card of his Raspberry Pi Zero W. “The Pi will be running headless (without screen, mouse or keyboard)”, he explains on his blog, “so there is no need for a full-fat Raspbian image.” While Stretch Lite was downloading, he set up the Waveshare ePaper HAT on his Zero W. He notes that Pimoroni’s “Inky pHAT would be easiest,” but his tutorial is specific to the Waveshare device.
Before ejecting the SD card, Jason updated the boot partition to allow him to access the Pi via SSH. He talks makers through that process here.
Among the libraries he installed for the project is pyMonzo, a Python wrapper for the Monzo API created by Paweł Adamczak. Monzo is still in its infancy, and the API is partly under construction. Until it’s completed, Paweł’s wrapper offers a more stable way to use it.
After installing the software, it was time to set up the e-paper screen for the tracker. Jason adjusted the code for the API so that the screen reloads information every 15 minutes, displaying the up-to-date amount of pocket money in both kids’ pots.
Here is how Jason describes going to the supermarket with his sons, now that he has completed the tracker:
“Daddy, I want (insert first thing picked up here), I’ve always wanted one of these my whole life!” […] Even though you have never seen that (insert thing here) before, I can quickly open my Monzo app, flick to Account, and say “You have £3.50 in your money box”. If my boy wants it, a 2-second withdrawal is made whilst queueing, and done — he walks away with a new (again, insert whatever he wanted his whole life here) and is happy!
Jason’s blog offers a full breakdown of his project, including all necessary code and the specs for the physical build. Be sure to head over and check it out.
Have you used an API in your projects? What would you build with one?
This is a guest blog post by Wes Couch and Kurt Waechter from the Blackboard Internal Product Development team about their experience using AWS Lambda.
One year ago, one of our UI test suites took hours to run. Last month, it took 16 minutes. Today, it takes 39 seconds. Here’s how we did it.
The backstory:
Blackboard is a global leader in delivering robust and innovative education software and services to clients in higher education, government, K12, and corporate training. We have a large product development team working across the globe in at least 10 different time zones, with an internal tools team providing support for quality and workflows. We have been using Selenium Webdriver to perform automated cross-browser UI testing since 2007. Because we are now practicing continuous delivery, the automated UI testing challenge has grown due to the faster release schedule. On top of that, every commit made to each branch triggers an execution of our automated UI test suite. If you have ever implemented an automated UI testing infrastructure, you know that it can be very challenging to scale and maintain. Although there are services that are useful for testing different browser/OS combinations, they don’t meet our scale needs.
It used to take three hours to synchronously run our functional UI suite, which revealed the obvious need for parallel execution. Previously, we used Mesos to orchestrate a Selenium Grid Docker container for each test run. This way, we were able to run eight concurrent threads for test execution, which took an average of 16 minutes. Although this setup is fine for a single workflow, the cracks started to show when we reached the scale required for Blackboard’s mature product lines. Going beyond eight concurrent sessions on a single container introduced performance problems that impact the reliability of tests (for example, issues in Webdriver or the browser popping up frequently). We tried Mesos and considered Kubernetes for Selenium Grid orchestration, but the answer to scaling a Selenium Grid was to think smaller, not larger. This led to our breakthrough with AWS Lambda.
The solution:
We started using AWS Lambda for UI testing because it doesn’t require costly infrastructure or countless man hours to maintain. The steps we outline in this blog post took one work day, from inception to implementation. By simply packaging the UI test suite into a Lambda function, we can execute these tests in parallel on a massive scale. We use a custom JUnit test runner that invokes the Lambda function with a request to run each test from the suite. The runner then aggregates the results returned from each Lambda test execution.
Selenium is the industry standard for testing UI at scale. Although there are other options to achieve the same thing in Lambda, we chose this mature suite of tools. Selenium is backed by Google, Firefox, and others to help the industry drive their browsers with code. This makes Lambda and Selenium a compelling stack for achieving UI testing at scale.
Making Chrome Run in Lambda
Currently, Chrome for Linux will not run in Lambda due to an absent mount point. By rebuilding Chrome with a slight modification, as Marco Lüthy originally demonstrated, you can run it inside Lambda anyway! It took about two hours to build the current master branch of Chromium to build on a c4.4xlarge. Unfortunately, the current version of ChromeDriver, 2.33, does not support any version of Chrome above 62, so we’ll be using Marco’s modified version of version 60 for the near future.
Required System Libraries
The Lambda runtime environment comes with a subset of common shared libraries. This means we need to include some extra libraries to get Chrome and ChromeDriver to work. Anything that exists in the java resources folder during compile time is included in the base directory of the compiled jar file. When this jar file is deployed to Lambda, it is placed in the /var/task/ directory. This allows us to simply place the libraries in the java resources folder under a folder named lib/ so they are right where they need to be when the Lambda function is invoked.
To get these libraries, create an EC2 instance and choose the Amazon Linux AMI.
Next, use ssh to connect to the server. After you connect to the new instance, search for the libraries to find their locations.
Now that you have the locations of the libraries, copy these files from the EC2 instance and place them in the java resources folder under lib/.
Packaging the Tests
To deploy the test suite to Lambda, we used a simple Gradle tool called ShadowJar, which is similar to the Maven Shade Plugin. It packages the libraries and dependencies inside the jar that is built. Usually test dependencies and sources aren’t included in a jar, but for this instance we want to include them. To include the test dependencies, add this section to the build.gradle file.
shadowJar {
from sourceSets.test.output
configurations = [project.configurations.testRuntime]
}
Deploying the Test Suite
Now that our tests are packaged with the dependencies in a jar, we need to get them into a running Lambda function. We use simple SAM templates to upload the packaged jar into S3, and then deploy it to Lambda with our settings.
We use the maximum timeout available to ensure our tests have plenty of time to run. We also use the maximum memory size because this ensures our Lambda function can support Chrome and other resources required to run a UI test.
Specifying the handler is important because this class executes the desired test. The test handler should be able to receive a test class and method. With this information it will then execute the test and respond with the results.
public LambdaTestResult handleRequest(TestRequest testRequest, Context context) {
LoggerContainer.LOGGER = new Logger(context.getLogger());
BlockJUnit4ClassRunner runner = getRunnerForSingleTest(testRequest);
Result result = new JUnitCore().run(runner);
return new LambdaTestResult(result);
}
Creating a Lambda-Compatible ChromeDriver
We provide developers with an easily accessible ChromeDriver for local test writing and debugging. When we are running tests on AWS, we have configured ChromeDriver to run them in Lambda.
To configure ChromeDriver, we first need to tell ChromeDriver where to find the Chrome binary. Because we know that ChromeDriver is going to be unzipped into the root task directory, we should point the ChromeDriver configuration at that location.
The settings for getting ChromeDriver running are mostly related to Chrome, which must have its working directories pointed at the tmp/ folder.
Start with the default DesiredCapabilities for ChromeDriver, and then add the following settings to enable your ChromeDriver to start in Lambda.
public ChromeDriver createLambdaChromeDriver() {
ChromeOptions options = new ChromeOptions();
// Set the location of the chrome binary from the resources folder
options.setBinary("/var/task/chrome");
// Include these settings to allow Chrome to run in Lambda
options.addArguments("--disable-gpu");
options.addArguments("--headless");
options.addArguments("--window-size=1366,768");
options.addArguments("--single-process");
options.addArguments("--no-sandbox");
options.addArguments("--user-data-dir=/tmp/user-data");
options.addArguments("--data-path=/tmp/data-path");
options.addArguments("--homedir=/tmp");
options.addArguments("--disk-cache-dir=/tmp/cache-dir");
DesiredCapabilities desiredCapabilities = DesiredCapabilities.chrome();
desiredCapabilities.setCapability(ChromeOptions.CAPABILITY, options);
return new ChromeDriver(desiredCapabilities);
}
Executing Tests in Parallel
You can approach parallel test execution in Lambda in many different ways. Your approach depends on the structure and design of your test suite. For our solution, we implemented a custom test runner that uses reflection and JUnit libraries to create a list of test cases we want run. When we have the list, we create a TestRequest object to pass into the Lambda function that we have deployed. In this TestRequest, we place the class name, test method, and the test run identifier. When the Lambda function receives this TestRequest, our LambdaTestHandler generates and runs the JUnit test. After the test is complete, the test result is sent to the test runner. The test runner compiles a result after all of the tests are complete. By executing the same Lambda function multiple times with different test requests, we can effectively run the entire test suite in parallel.
To get screenshots and other test data, we pipe those files during test execution to an S3 bucket under the test run identifier prefix. When the tests are complete, we link the files to each test execution in the report generated from the test run. This lets us easily investigate test executions.
Pro Tip: Dynamically Loading Binaries
AWS Lambda has a limit of 250 MB of uncompressed space for packaged Lambda functions. Because we have libraries and other dependencies to our test suite, we hit this limit when we tried to upload a function that contained Chrome and ChromeDriver (~140 MB). This test suite was not originally intended to be used with Lambda. Otherwise, we would have scrutinized some of the included libraries. To get around this limit, we used the Lambda functions temporary directory, which allows up to 500 MB of space at runtime. Downloading these binaries at runtime moves some of that space requirement into the temporary directory. This allows more room for libraries and dependencies. You can do this by grabbing Chrome and ChromeDriver from an S3 bucket and marking them as executable using built-in Java libraries. If you take this route, be sure to point to the new location for these executables in order to create a ChromeDriver.
One year ago, one of our UI test suites took hours to run. Last month, it took 16 minutes. Today, it takes 39 seconds. Thanks to AWS Lambda, we can reduce our build times and perform automated UI testing at scale!
Testing the user interface of a web application is an important part of the development lifecycle. In this post, I’ll explain how to automate UI testing using serverless technologies, including AWS CodePipeline, AWS CodeBuild, and AWS Lambda.
I built a website for UI testing that is hosted in S3. I used Selenium to perform cross-browser UI testing on Chrome, Firefox, and PhantomJS, a headless WebKit browser with Ghost Driver, an implementation of the WebDriver Wire Protocol. I used Python to create test cases for ChromeDriver, FirefoxDriver, or PhatomJSDriver based the browser against which the test is being executed.
Resources referred to in this post, including the AWS CloudFormation template, test and status websites hosted in S3, AWS CodeBuild build specification files, AWS Lambda function, and the Python script that performs the test are available in the serverless-automated-ui-testing GitHub repository.
S3 Hosted Test Website:
AWS CodeBuild supports custom containers so we can use the Selenium/standalone-Firefox and Selenium/standalone-Chrome containers, which include prebuild Firefox and Chrome browsers, respectively. Xvfb performs the graphical operation in virtual memory without any display hardware. It will be installed in the CodeBuild containers during the install phase.
Build Spec for Chrome and Firefox
The build specification for Chrome and Firefox testing includes multiple phases:
The environment variables section contains a set of default variables that are overridden while creating the build project or triggering the build.
As part of install phase, required packages like Xvfb and Selenium are installed using yum.
During the pre_build phase, the test bed is prepared for test execution.
During the build phase, the appropriate DISPLAY is set and the tests are executed.
Because Ghost Driver runs headless, it can be executed on AWS Lambda. In keeping with a fire-and-forget model, I used CodeBuild to create the PhantomJS Lambda function and trigger the test invocations on Lambda in parallel. This is powerful because many tests can be executed in parallel on Lambda.
Build Spec for PhantomJS
The build specification for PhantomJS testing also includes multiple phases. It is a little different from the preceding example because we are using AWS Lambda for the test execution.
The environment variables section contains a set of default variables that are overridden while creating the build project or triggering the build.
As part of install phase, the required packages like Selenium and the AWS CLI are installed using yum.
During the pre_build phase, the test bed is prepared for test execution.
During the build phase, a zip file that will be used to create the PhantomJS Lambda function is created and tests are executed on the Lambda function.
The list of test cases and the test modules that belong to each case are stored in an Amazon DynamoDB table. Based on the list of modules passed as an argument to the CodeBuild project, CodeBuild gets the test cases from that table and executes them. The test execution status and results are stored in another Amazon DynamoDB table. It will read the test status from the status table in DynamoDB and display it.
AWS CodeBuild and AWS Lambda perform the test execution as individual tasks. AWS CodePipeline plays an important role here by enabling continuous delivery and parallel execution of tests for optimized testing.
Here’s how to do it:
In AWS CodePipeline, create a pipeline with four stages:
Source (AWS CodeCommit)
UI testing (AWS Lambda and AWS CodeBuild)
Approval (manual approval)
Production (AWS Lambda)
Pipeline stages, the actions in each stage, and transitions between stages are shown in the following diagram.
This design implemented in AWS CodePipeline looks like this:
CodePipeline automatically detects a change in the source repository and triggers the execution of the pipeline.
In the UITest stage, there are two parallel actions:
DeployTestWebsite invokes a Lambda function to deploy the test website in S3 as an S3 website.
DeployStatusPage invokes another Lambda function to deploy in parallel the status website in S3 as an S3 website.
Next, there are three parallel actions that trigger the CodeBuild project:
TestOnChrome launches a container to perform the Selenium tests on Chrome.
TestOnFirefox launches another container to perform the Selenium tests on Firefox.
TestOnPhantomJS creates a Lambda function and invokes individual Lambda functions per test case to execute the test cases in parallel.
You can monitor the status of the test execution on the status website, as shown here:
When the UI testing is completed successfully, the pipeline continues to an Approval stage in which a notification is sent to the configured SNS topic. The designated team member reviews the test status and approves or rejects the deployment. Upon approval, the pipeline continues to the Production stage, where it invokes a Lambda function and deploys the website to a production S3 bucket.
I used a CloudFormation template to set up my continuous delivery pipeline. The automated-ui-testing.yaml template, available from GitHub, sets up a full-featured pipeline.
When I use the template to create my pipeline, I specify the following:
AWS CodeCommit repository.
SNS topic to send approval notification.
S3 bucket name where the artifacts will be stored.
The stack name should follow the rules for S3 bucket naming because it will be part of the S3 bucket name.
When the stack is created successfully, the URLs for the test website and status website appear in the Outputs section, as shown here:
Conclusion
In this post, I showed how you can use AWS CodePipeline, AWS CodeBuild, AWS Lambda, and a manual approval process to create a continuous delivery pipeline for serverless automated UI testing. Websites running on Amazon EC2 instances or AWS Elastic Beanstalk can also be tested using similar approach.
About the author
Prakash Palanisamy is a Solutions Architect for Amazon Web Services. When he is not working on Serverless, DevOps or Alexa, he will be solving problems in Project Euler. He also enjoys watching educational documentaries.
Just as a herd can move only as fast as its slowest member, companies must increase the speed of all parts of their release process, especially the database change process, which is often manual. One bad database change can bring down an app or compromise data security.
We need to make database code deployment as fast and easy as application release automation, while eliminating risks that cause application downtime and data security vulnerabilities. Let’s take a page from the application development playbook and bring a continuous deployment approach to the database.
By creating a continuous deployment database, you can:
Discover mistakes more quickly.
Deliver updates faster and frequently.
Help developers write better code.
Automate the database release management process.
The database deployment package can be promoted automatically with application code changes. With database continuous deployment, application development teams can deliver smaller, less risky deployments, making it possible to respond more quickly to business or customer needs.
In this post, we walk through steps for building a continuous deployment workflow for databases using AWS CodePipeline (a fully managed continuous delivery service) and Datical DB (a database release automation application). We use AWS CodeCommit for source code control and Amazon RDS for database hosting to demonstrate end-to-end database change management — from check-in to final deployment.
As part of this example, we will show how a database change that does not meet standards is rejected automatically and actionable feedback is provided to the developer. Just like a code unit test, Datical DB evaluates changes and enforces your organization’s standards. In the sample use case, database table indexes of more than three columns are disallowed. In some cases, this type of index can slow performance.
From Datical DB, you’ll need access to software.datical.com portal, your license key, a database, and JDBC drivers. You can request a free trial of Datical here.
Overview
Here are the steps:
Install and configure Datical DB.
Create an RDS database instance running the Oracle database engine.
Configure Datical DB to manage database changes across your software development life cycle (SDLC).
Set up database version control using AWS CodeCommit.
Set up a continuous integration server to stage database changes.
Integrate the continuous integration server with Datical DB.
Set up automated release management for your database through AWS CodePipeline.
Enforce security governance and standards with the Datical DB Rules Engine.
1. Install and configure Datical DB
Navigate to https://software.datical.com and sign in with your credentials. From the left navigation menu, expand the Common folder, and then open the Datical_DB_Folder. Choose the latest version of the application by reviewing the date suffix in the name of the folder. Download the installer for your platform — Windows (32-bit or 64-bit) or Linux (32-bit or 64-bit).
Verify the JDK Version
In a terminal window, run the following command to ensure you’re running JDK version 1.7.x or later.
# java –version
java version "1.7.0_75"
Java(TM) SE Runtime Environment (build 1.7.0_75-b13)
Java HotSpot(TM) Client VM (build 24.75-b04, mixed mode, sharing)
The Datical DB installer contains a graphical (GUI) and command line (CLI) interface that can be installed on Windows and Linux operating systems.
Install Datical DB (GUI)
Double-click on the installer
Follow the prompts to install the application.
When prompted, type the path to a valid license.
Install JDBC drivers
Open the Datical DB application.
From the menu, choose Help, and then choose Install New Software.
2. Create an RDS instance running the Oracle database engine
Datical DB supports database engines like Oracle, MySQL, Microsoft SQL Server, PostgreSQL, and IBM DB2. The example in this post uses a DB instance running Oracle. To create a DB instance running Oracle, follow these steps. Make sure that you can access the Oracle port (1521) from the location where you will be using Datical DB. Just like SQLPlus or other database management tools, Datical DB must be able to connect to the Oracle port. When you configure the security group for your RDS instance, make sure you can access port 1521 from your location.
3. Manage database changes across the SDLC
This one-time process is required to ensure databases are in sync so that you can manage database changes across the SDLC:
Create a Datical DB deployment plan with connections to the databases to be managed.
Baseline the first database (DEV/CI). This must be the original or best configured database – your reference database.
For each additional database (TEST and PROD): a. Compare databases to ensure the application schema are in sync. b. Resolve any differences. c. Perform a change log sync to get each setup for Datical DB management.
Datical DB creates an initial model change log from one of the databases. It also creates in each database a metadata table named DATABASECHANGELOG that will be used to track the state. Now the databases look like this:
Note: In the preceding figure, the Datical DB model and metadata table are a representation of the actual model.
Create a deployment plan
In Datical DB, right-click Deployment Plans, and choose New.
On the New Deployment Plan page, type a name for your project (for example, AWS-Sample-Project), and then choose Next.
Select Oracle 11g Instant Client, type a name for the database (for example, DevDatabase), and then choose Next.
On the following page, provide the database connection information.
For Hostname, enter the RDS endpoint..
Select SID, and then type ORCL.
Type the user name and password used to connect to the RDS instance running Oracle.
Before you choose Finish, choose the Test Connection button.
When Datical DB creates the project, it also creates a baseline snapshot that captures the current state of the database schema. Datical DB stores the snapshot in Datical change sets for future forecasting and modification.
Create a database change set
A change set describes the change/refactoring to apply to the database. From the AWS-Sample-Project project in the left pane, right-click Change Log, select New, and then select Change Set. Choose the type of change to make, and then choose Next. In this example, we’re creating a table. For Table Name, type a name. Choose Add Column, and then provide information to add one or more columns to the new table. Follow the prompts, and then choose Finish.
The new change set will be added at the end of your current change log. You can tag change sets with a sprint label. Depending on the environment, changes can be deployed based on individual labels or by the higher-level grouping construct. Datical DB also provides an option to load SQL scripts into a database, where the change sets are labeled and captured as objects. This makes them ready for deployment in other environments.
Best practices for continuous delivery
Change sets are stored in an XML file inside the Datical DB project. The file, changelog.xml, is stored inside the Changelog folder. (In the Datical DB UI, it is called Change Log.)
Just like any other files stored in your source code repository, the Datical DB change log can be branched and merged to support agile software development, where individual work spaces are isolated until changes are merged into the parent branch.
To implement this best practice, your Datical DB project should be checked into the same location as your application source code. That way, branches and merges will be applied to your Datical DB project automatically. Use unique change set IDs to avoid collisions with other scrum teams.
4. Set up database version control using AWS CodeCommit
Note: On some versions of Windows and Linux, you might see a pop-up dialog box asking for your user name and password. This is the built-in credential management system, but it is not compatible with the credential helper for AWS CodeCommit. Choose Cancel.
Commit the contents located in the Datical working directory (for example, ~/datical/AWS-Sample-Project) to the AWS CodeCommit repository.
5. Set up a continuous integration server to stage database changes
In this example, Jenkins is the continuous integration server. To create a Jenkins server, follow these steps. Be sure your instance security group allows port 8080 access.
To configure Jenkins with Datical DB, navigate to Jenkins, choose Manage Jenkins, and then choose Configure System. In the Datical DB section, provide the requested directory information.
For example:
Add a build step:
Go to your newly created Jenkins project and choose Configure. On the Build tab, under Build, choose Add build step, and choose Datical DB.
In Project Dir, enter the Datical DB project directory (in this example, /var/lib/jenkins/workspace/demo/MyProject). You can use Jenkins environment variables like $WORKSPACE. The first build action is Check Drivers. This allow you to verify that Datical DB and Jenkins are configured correctly.
Choose Save. Choose Build Now to test the configuration.
After you’ve verified the drivers are installed, add forecast and deploy steps.
Add forecast and deploy steps:
Choose Save. Then choose Build Now to test the configuration.
6. Configure the continuous integration server to publish Datical DB reports
In this step, we will configure Jenkins to publish Datical DB forecast and HTML reports. In your Jenkins project, select Delete workspace before build starts.
Add post-build steps
1. Archive the Datical DB reports, logs, and snapshots
To expose Datical DB reports in Jenkins, you must create a post-build task step to copy the forecast and deployment HTML reports to a location easily published, and then publish the HTML reports.
On the introductory page, choose Get started. If you see the All pipelines page, choose Create pipeline.
In Step 1: Name, in Pipeline name, type DatabasePipeline, and then choose Next step.
In Step 2: Source, in Source provider, choose AWS CodeCommit. In Repository name, choose the name of the AWS CodeCommit repository you created earlier. In Branch name, choose the name of the branch that contains your latest code update. Choose Next step.
8. Enforce database standards and compliance with the Datical DB Rules Engine
The Datical DB Dynamic Rules Engine automatically inspects the Virtual Database Model to make sure that proposed database code changes are safe and in compliance with your organization’s database standards. The Rules Engine also makes it easy to identify complex changes that warrant further review and empowers DBAs to efficiently focus only on the changes that require their attention. It also provides application developers with a self-service validation capability that uses the same automated build process established for the application. The consistent evaluation provided by the Dynamic Rules Engine removes uncertainty about what is acceptable and empowers application developers to write safe, compliant changes every time.
Earlier, you created a Datical DB project with no changes. To demonstrate rules, you will now create changes that violate a rule.
First, create a table with four columns. Then try to create an index on the table that comprises all four columns. For some databases, having more than three columns in an index can cause performance issues. For this reason, create a rule that will prevent the creation of an index on more than three columns, long before the change is proposed for production. Like a unit test that will fail the build, the Datical DB Rules Engine fails the build at the forecast step and provides feedback to the development team about the rule and the change to fix.
Create a Datical DB rule
To create a Datical DB rule, open the Datical DB UI and navigate to your project. Expand the Rules folder. In this example, you will create a rule in the Forecast folder.
Right-click the Forecast folder, and then select Create Rules File. In the dialog box, type a unique file name for your rule. Use a .drl extension.
.
In the editor window that opens, type the following:
package com.datical.hammer.core.forecast
import java.util.Collection;
import java.util.List;
import java.util.Arrays;
import java.util.ArrayList;
import org.apache.commons.lang.StringUtils;
import org.apache.commons.collections.ListUtils;
import com.datical.db.project.Project;
import com.datical.hammer.core.rules.Response;
import com.datical.hammer.core.rules.Response.ResponseType;
// ************************************* Models *************************************
// Database Models
import com.datical.dbsim.model.DbModel;
import com.datical.dbsim.model.Schema;
import com.datical.dbsim.model.Table;
import com.datical.dbsim.model.Index;
import com.datical.dbsim.model.Column;
import org.liquibase.xml.ns.dbchangelog.CreateIndexType;
import org.liquibase.xml.ns.dbchangelog.ColumnType;
/* @return false if validation fails; true otherwise */
function boolean validate(List columns)
{
// FAIL If more than 3 columns are included in new index
if (columns.size() > 3)
return false;
else
return true;
}
rule "Index Too Many Columns Error"
salience 1
when
$createIndex : CreateIndexType($indexName: indexName, $columns: columns, $tableName: tableName, $schemaName: schemaName)
eval(!validate($columns))
then
String errorMessage = "The new index [" + $indexName + "] contains more than 3 columns.";
insert(new Response(ResponseType.FAIL, errorMessage, drools.getRule().getName()));
end
Save the new rule file, and then right-click the Forecast folder, and select Check Rules. You should see “Rule Validation returned no errors.”
Now check your rule into source code control and request a new build. The build will fail, which is expected. Go back to Datical DB, and change the index to comprise only three columns. After your check-in, you will see a successful deployment to your RDS instance.
The following forecast report shows the Datical DB rule violation:
To implement database continuous delivery into your existing continuous delivery process, consider creating a separate project for your database changes that use the Datical DB forecast functionality at the same time unit tests are run on your code. This will catch database changes that violate standards before deployment.
Summary:
In this post, you learned how to build a modern database continuous integration and automated release management workflow on AWS. You also saw how Datical DB can be seamlessly integrated with AWS services to enable database release automation, while eliminating risks that cause application downtime and data security vulnerabilities. This fully automated delivery mechanism for databases can accelerate every organization’s ability to deploy software rapidly and reliably while improving productivity, performance, compliance, and auditability, and increasing data security. These methodologies simplify process-related overhead and make it possible for organizations to serve their customers efficiently and compete more effectively in the market.
I hope you enjoyed this post. If you have any feedback, please leave a comment below.
About the Authors
Balaji Iyer is an Enterprise Consultant for the Professional Services Team at Amazon Web Services. In this role, he has helped several Fortune 500 customers successfully navigate their journey to AWS. His specialties include architecting and implementing highly scalable distributed systems, serverless architectures, large scale migrations, operational security, and leading strategic AWS initiatives. Before he joined Amazon, Balaji spent more than a decade building operating systems, big data analytics solutions, mobile services, and web applications. In his spare time, he enjoys experiencing the great outdoors and spending time with his family.
Robert Reeves is a Chief Technology Officer at Datical. In this role, he advocates for Datical’s customers and provides technical architecture leadership. Prior to cofounding Datical, Robert was a Director at the Austin Technology Incubator. At ATI, he provided real-world entrepreneurial expertise to ATI member companies to aid in market validation, product development, and fundraising efforts. Robert cofounded Phurnace Software in 2005. He invented and created the flagship product, Phurnace Deliver, which provides middleware infrastructure management to multiple Fortune 500 companies. As Chief Technology Officer for Phurnace, he led technical evangelism efforts, product vision, and large account technical sales efforts. After BMC Software acquired Phurnace in 2009, Robert served as Chief Architect and lead worldwide technology evangelism.
The more observant among you may have spotted that we’ve recently updated the Raspbian-with-PIXEL image available from Downloads. With any major release of the OS, we usually find a few small bugs and other issues as soon as the wider community start using it, and so we gather up the fixes and produce a 1.1 release a few weeks later. We don’t make a fuss about these bug fix releases, as there’s no new functionality; these are just fixes to make things work as originally intended.
However, in this case, we’ve made a couple of important changes. They won’t be noticed by many users, but to those who do notice them and who will be affected by them, we should explain ourselves!
Why have we changed things?
Anyone following tech media over the last few months will have seen the stories about botnets running on Internet of Things devices. Hackers are using the default passwords on webcams and the like to create a network capable of sending enough requests to a website to cause it to grind to a halt.
With the Pi, we’ve always tried to keep it as open as possible. We provide a default user account with a default password, and this account can use sudo to control or modify anything without a password; this makes life much easier for beginners. We also have an open SSH port by default, so that people who are using a Pi remotely can just install the latest Raspbian image, plug it in, and control their Pi with no configuration required; again, this makes life easier.
Unfortunately, hackers are increasingly exploiting loopholes such as these in other products to enable them to invisibly take control of devices. In general, this has not been a problem for Pis. If a Pi is on a private network in your home, it’s unlikely that an attacker can reach it; if you’re putting a Pi on a public network, we’ve hoped that you know enough about the issues involved to change the default password or turn off SSH.
But the threat of hacking has now got to the point where we can see that we need to change our approach. Much as we hate to impose restrictions on users, we would also hate for our relatively relaxed approach to security to cause far worse problems. With this release, therefore, we’ve made a couple of small changes to improve security, which should be enough to make it extremely hard to hijack a Pi, while not making life too difficult for users.
What has changed?
First, from now on SSH will be disabled by default on our images. SSH (Secure SHell) is a networking protocol which allows you to remotely log into a Linux computer and control it from a remote command line. As mentioned above, many Pi owners use it to install a Pi headless (without screen or keyboard) and control it from another PC.
In the past, SSH was enabled by default, so people using their Pi headless could easily update their SD card to a new image. Switching SSH on or off has always required the use of raspi-config or the Raspberry Pi Configuration application, but to access those, you need a screen and keyboard connected to the Pi itself, which is not the case in headless applications. So we’ve provided a simple mechanism for enabling SSH before an image is booted.
The boot partition on a Pi should be accessible from any machine with an SD card reader, on Windows, Mac, or Linux. If you want to enable SSH, all you need to do is to put a file called ssh in the /boot/ directory. The contents of the file don’t matter: it can contain any text you like, or even nothing at all. When the Pi boots, it looks for this file; if it finds it, it enables SSH and then deletes the file. SSH can still be turned on or off from the Raspberry Pi Configuration application or raspi-config; this is simply an additional way to turn it on if you can’t easily run either of those applications.
The risk with an open SSH port is that someone can access it and log in; to do this, they need a user account and a password. Out of the box, all Raspbian installs have the default user account ‘pi’ with the password ‘raspberry’. If you’re enabling SSH, you should really change the password for the ‘pi’ user to prevent a hacker using the defaults. To encourage this, we’ve added warnings to the boot process. If SSH is enabled, and the password for the ‘pi’ user is still ‘raspberry’, you’ll see a warning message whenever you boot the Pi, whether to the desktop or the command line. We’re not enforcing password changes, but you’ll be warned whenever you boot if your Pi is potentially at risk.
Our hope is that these (relatively minor) changes will not cause too much inconvenience, but they will make it much harder for hackers to attack the Pi.
Is there anything I need to do to protect my Pi?
We should stress at this point that there’s no need to panic! We are not aware of Pis being used in botnets or being taken over in large numbers; your own Pi is almost certainly not currently hacked.
It’s still good practice to protect yourself to avoid problems in future. We therefore suggest that you use the Raspberry Pi Configuration application or raspi-config to disable SSH if you’re not using it, and also change the password for the ‘pi’ user if it’s still ‘raspberry’.
To change the password, you can either press the ‘Change Password’ button in Raspberry Pi Configuration, or type passwd at the command line, and follow the prompts.
This issue has caused quite a lot of discussion at Pi Towers. The relaxed approach we’ve taken thus far has been for very good reasons, and we’re reluctant to change it. However, we feel that these changes are necessary to protect our users from potential threats now and in the future, and we hope you can understand our reasoning.
How do I get the updates?
The latest Raspbian with PIXEL image is available from the Downloads page on our website now. Note that the uncompressed image is over 4GB in size, and some older unzippers will fail to decompress it properly. If you have problems, use 7-Zip on Windows and The Unarchiver on Mac; both are free applications which have been tested and will decompress the file correctly.
To update your existing Jessie image with all the bug fixes and these new security changes, type the following at the command line:
Yesterday, we introduced the first of two new boot modes which have now been added to the Raspberry Pi 3. Today, we introduce an even more exciting addition: network booting a Raspberry Pi with no SD card.
Again, rather than go through a description of the boot mode here, we’ve written a fairly comprehensive guide on the Raspberry Pi documentation pages, and you can find a tutorial to get you started here. Below are answers to what we think will be common questions, and a look at some limitations of the boot mode.
Note: this is still in beta testing and uses the “next” branch of the firmware. If you’re unsure about using the new boot modes, it’s probably best to wait until we release it fully.
What is network booting?
Network booting is a computer’s ability to load all its software over a network. This is useful in a number of cases, such as remotely operated systems or those in data centres; network booting means they can be updated, upgraded, and completely re-imaged, without anyone having to touch the device!
The main advantages when it comes to the Raspberry Pi are:
SD cards are difficult to make reliable unless they are treated well; they must be powered down correctly, for example. A Network File System (NFS) is much better in this respect, and is easy to fix remotely.
NFS file systems can be shared between multiple Raspberry Pis, meaning that you only have to update and upgrade a single Pi, and are then able to share users in a single file system.
Network booting allows for completely headless Pis with no external access required. The only desirable addition would be an externally controlled power supply.
I’ve tried doing things like this before and it’s really hard editing DHCP configurations!
It can be quite difficult to edit DHCP configurations to allow your Raspberry Pi to boot, while not breaking the whole network in the process. Because of this, and thanks to input from Andrew Mulholland, I added the support of proxy DHCP as used with PXE booting computers.
What’s proxy DHCP and why does it make it easier?
Standard DHCP is the protocol that gives a system an IP address when it powers up. It’s one of the most important protocols, because it allows all the different systems to coexist. The problem is that if you edit the DHCP configuration, you can easily break your network.
So proxy DHCP is a special protocol: instead of handing out IP addresses, it only hands out the TFTP server address. This means it will only reply to devices trying to do netboot. This is much easier to enable and manage, because we’ve given you a tutorial!
Are there any bugs?
At the moment we know of three problems which need to be worked around:
When the boot ROM enables the Ethernet link, it first waits for the link to come up, then sends its first DHCP request packet. This is sometimes too quick for the switch to which the Raspberry Pi is connected: we believe that the switch may throw away packets it receives very soon after the link first comes up.
The second bug is in the retransmission of the DHCP packet: the retransmission loop is not timing out correctly, so the DHCP packet will not be retransmitted.
The solution to both these problems is to find a suitable switch which works with the Raspberry Pi boot system. We have been using a Netgear GS108 without a problem.
Finally, the failing timeout has a knock-on effect. This means it can require the occasional random packet to wake it up again, so having the Raspberry Pi network wired up to a general network with lots of other computers actually helps!
Can I use network boot with Raspberry Pi / Pi 2?
Unfortunately, because the code is actually in the boot ROM, this won’t work with Pi 1, Pi B+, Pi 2, and Pi Zero. But as with the MSD instructions, there’s a special mode in which you can copy the ‘next’ firmware bootcode.bin to an SD card on its own, and then it will try and boot from the network.
This is also useful if you’re having trouble with the bugs above, since I’ve fixed them in the bootcode.bin implementation.
Finally, I would like to thank my Slack beta testing team who provided a great testing resource for this work. It’s been a fun few weeks! Thanks in particular to Rolf Bakker for this current handy status reference…
Here’s a really neat solution from the inestimable Dan “PiGlove, mind where you put the capitals” Aldred. If you’re not able to get to another screen or monitor, or if you’re on the move, this is a very tidy way to get set up.
A comprehensive video covering how to set up your Raspberry Pi Zero so that you can access it via the USB port. Yes, plug it in to a USB port and you can use the command line or with a few tweaks a full graphical desktop.
This is a really comprehensive guide, taking you all the way from flashing an SD card, accessing your Pi Zero via Putty, installing VNC and setting up a graphical user interface, to running Minecraft. Dan’s a teacher, and this video is perfect for beginners; if you find it helpful, please let us know in the comments!
By continuing to use the site, you agree to the use of cookies. more information
The cookie settings on this website are set to "allow cookies" to give you the best browsing experience possible. If you continue to use this website without changing your cookie settings or you click "Accept" below then you are consenting to this.