Tag Archives: python

Introducing AWS Transform custom: Crush tech debt with AI-powered code modernization

Post Syndicated from Matheus Guimaraes original https://aws.amazon.com/blogs/aws/introducing-aws-transform-custom-crush-tech-debt-with-ai-powered-code-modernization/

Technical debt is one of the most persistent challenges facing enterprise development teams today. Studies show that organizations spend 20% of their IT budget on technical debt instead of advancing new capabilities. Whether it’s upgrading legacy frameworks, migrating to newer runtime versions, or refactoring outdated code patterns, these essential but repetitive tasks consume valuable developer time that could be spent on innovation.

Today, we’re excited to announce AWS Transform custom, a new agent that fundamentally changes how organizations approach modernization at scale. This intelligent agent combines pre-built transformations for Java, Node.js, and Python upgrades with the ability to define custom transformations. By learning specific transformation patterns and automating them across entire codebases, customers using AWS Transform custom have achieved up to 80% reduction in execution time in many cases, freeing developers to focus on innovation.

You can define transformations using your documentation, natural language descriptions, and code samples. The service then applies these specific patterns consistently across hundreds or thousands of repositories, improving its effectiveness through both explicit feedback and implicit signals like developers’ manual fixes within your transformation projects.

AWS Transform custom offers both CLI and web interfaces to suit different modernization needs. You can use the CLI to define transformations through natural language interactions and execute them on local codebases, either interactively or autonomously. You can also integrate it into code modernization pipelines or workflows, making it ideal for machine-driven automation. Meanwhile, the web interface provides comprehensive campaign management capabilities, helping teams track and coordinate transformation progress across multiple repositories at scale.

Language and framework modernization
AWS Transform supports runtime upgrades without the need to provide additional information, understanding not only the syntax changes required but also the subtle behavioral differences and optimization opportunities that come with newer versions. The same intelligent approach applies to Node.js, Python and Java runtime upgrades, and even extends to infrastructure-level transitions, such as migrating workloads from x86 processors to AWS Graviton.

It also navigates framework modernization with sophistication. When organizations need to update their Spring Boot applications to take advantage of newer features and security patches, AWS Transform custom doesn’t merely update version numbers but understands the cascading effects of dependency changes, configuration updates, and API modifications.

For teams facing more dramatic shifts, such as migrating from Angular to React, AWS Transform custom can learn the patterns of component translation, state management conversion, and routing logic transformation that make such migrations successful.

Infrastructure and enterprise-scale transformations
The challenge of keeping up with evolving APIs and SDKs becomes particularly acute in cloud-based environments where services are continuously improving. AWS Transform custom supports AWS SDK updates across a broad spectrum of programming languages that enterprises use including Java, Python, and JavaScript. The service understands not only the mechanical aspects of API changes, but also recognizes best practices and optimization opportunities available in newer SDK versions.

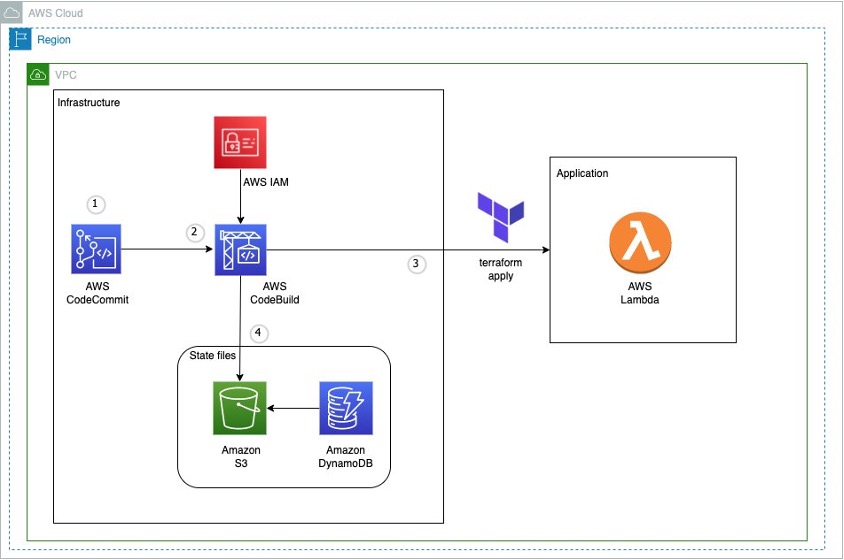
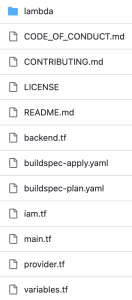
Infrastructure as Code transformations represent another critical capability, especially as organizations evaluate different tooling strategies. Whether you’re converting AWS Cloud Development Kit (AWS CDK) templates to Terraform for standardization purposes, or updating AWS CloudFormation configurations to access new service features, AWS Transform custom understands the declarative nature of these tools and can maintain the intent and structure of your infrastructure definitions.

Beyond these common scenarios, AWS Transform custom excels at addressing the unique, organization-specific code patterns that accumulate over years of development. Every enterprise has its own architectural conventions, utility libraries, and coding standards that need to evolve over time. It can learn these custom patterns and help refactor them systematically so that institutional knowledge and best practices are applied consistently across the entire application portfolio.

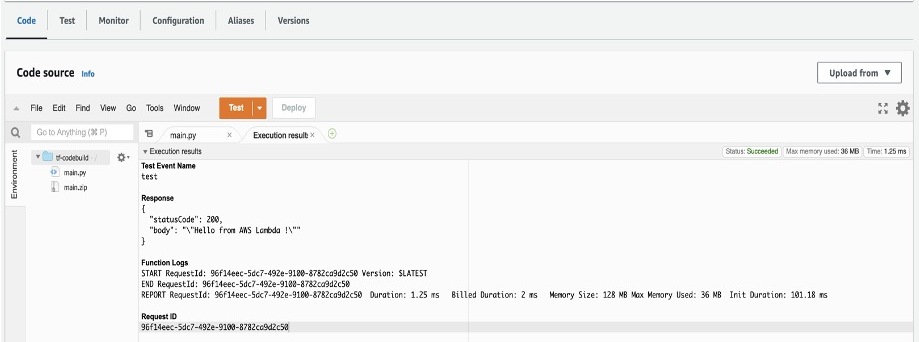
AWS Transform custom is designed with enterprise development workflows in mind, enabling center of excellence teams and system integrators to define and execute organization-wide transformations while application developers focus on reviewing and integrating the transformed code. DevOps engineers can then configure integrations with existing continuous integration and continuous delivery (CI/CD) pipelines and source control systems. It also includes pre-built transformations for Java, Node.js and Python runtime updates which can be particularly useful for AWS Lambda functions, along with transformations for AWS SDK modernization to help teams get started immediately.

Getting started
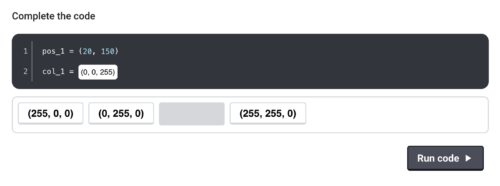
AWS Transform makes complex code transformations manageable through both pre-built and custom transformation capabilities. Let’s start by exploring how to use an existing transformation to address a common modernization challenge: upgrading AWS Lambda functions due to end-of-life (EOL) runtime support.

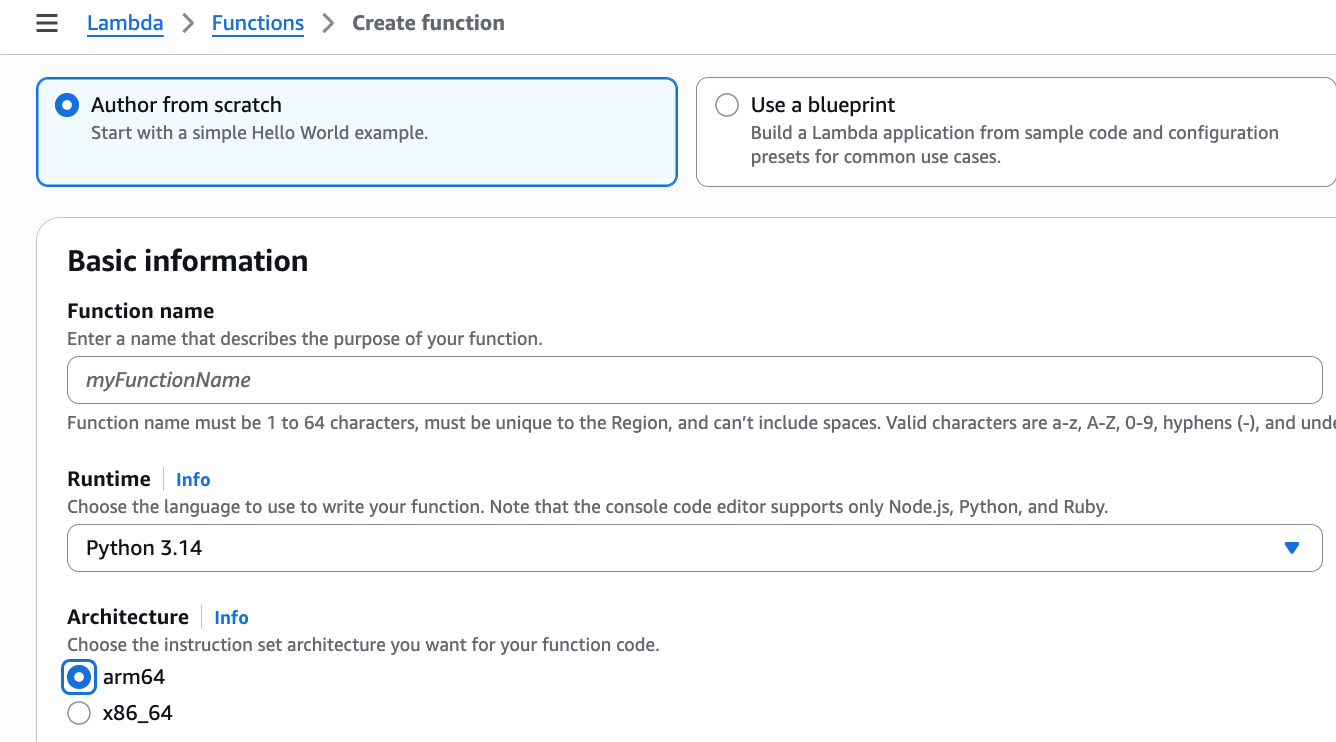
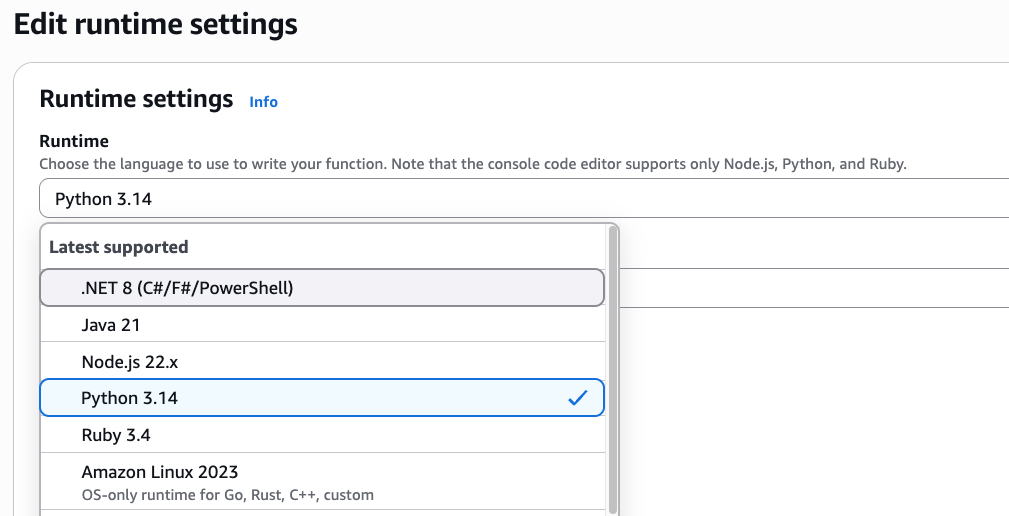
For this example, I’ll demonstrate migrating a Python 3.8 Lambda function to Python 3.13, as Python 3.8 reached EOL and is no longer receiving security updates. I’ll use the CLI for this demo, but I encourage you to also explore the web interface’s powerful campaign management capabilities.

First, I use the command atx custom def list to explore the available transformation definitions. You can also access this functionality through a conversational interface by typing only atx instead of issuing the command directly, if you prefer.

This command displays all available transformations, including both AWS-managed defaults and any existing custom transformations created by users in my organization. AWS-managed transformations are identified by the AWS/ prefix, indicating they’re maintained and updated by AWS. In the results, I can see several options such as AWS/java-version-upgrade for Java runtime modernization, AWS/python-boto2-to-boto3-migration for updating Python AWS SDK usage, AWS/nodejs-version-upgrade for Node.js runtime updates.

For my Python 3.8 to 3.13 migration, I’ll use the AWS/python-version-upgrade transformation.

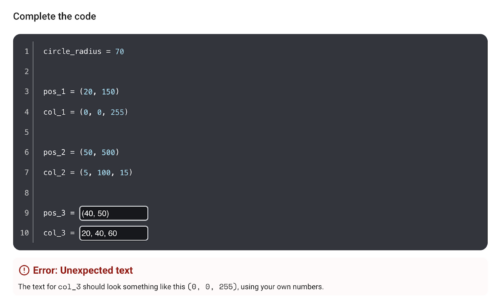
You run a migration by using the atx custom def exec command.  Please consult the documentation for more details about the command and all its options. Here, I run it against my project repository specifying the transformation name. I also add pytest to run unit tests for validation. More importantly, I use the additionalPlanContext section in the  --configuration input to specify which Python version I want to upgrade to. For reference, here’s the command I have for my demo (I’ve used multiple lines and indented it here for clarity):

atx custom def exec 
-p /mnt/c/Users/vasudeve/Documents/Work/Projects/ATX/lambda/todoapilambda 
-n AWS/python-version-upgrade
-C "pytest" 
--configuration 
    "additionalPlanContext= The target Python version to upgrade to is Python 3.13" 
-x -t

AWS Transform then starts the migration process. It analyzes my Lambda function code, identifies Python 3.8-specific patterns, and automatically applies the necessary changes for Python 3.13 compatibility. This includes updating syntax for deprecated features, modifying import statements, and adjusting any version-specific behaviors.

After execution, it provides a comprehensive summary including a report on dependencies updated in requirements.txt with Python 3.13-compatible package versions, instances of deprecated syntax replaced with current equivalents, updated runtime configuration notes for AWS Lambda deployment, suggested test cases to validate the migration, and more. It also provides a body of evidence that serve as proof of success.

The migrated code lives in a local branch so you can review and merge when satisfied. Alternatively, you can keep providing feedback and reiterating until yo’re happy that the migration is fully complete and meets your expectations.

This automated process changes what would typically require hours of manual work into a streamlined, consistent upgrade that maintains code quality while maintaining compatibility with the newer Python runtime.

Creating a new custom transformation
While AWS-managed transformations handle common scenarios effectively, you can also create custom transformations tailored to your organization’s specific needs. Let’s explore how to create a custom transformation to see how AWS Transform learns from your specific requirements.

I type atx to initialize the atx cli and start the process.

The first thing it asks me is if I want to use one of the existing transformations or create a new one. I choose to create a new one. Notice that from here on the whole conversation takes place using natural language, not commands. I typed new one but I could have typed I want to create a new one and it would’ve understood it exactly the same.

It then prompts me to provide more information about the kind of transformation I’d like to perform. For this demo, I’m going to migrate an Angular application, so I type angular 16 to 19 application migration which prompts the CLI to search for all transformations available for this type of migration. In my case, my team has already created and made available a few Angular migrations, so it shows me those. However, it warns me that none of them is an exact match to my specific request for migrating from Angular 16 to 19. It then asks if I’d like to select from one of the existing transformations listed or create a custom one.

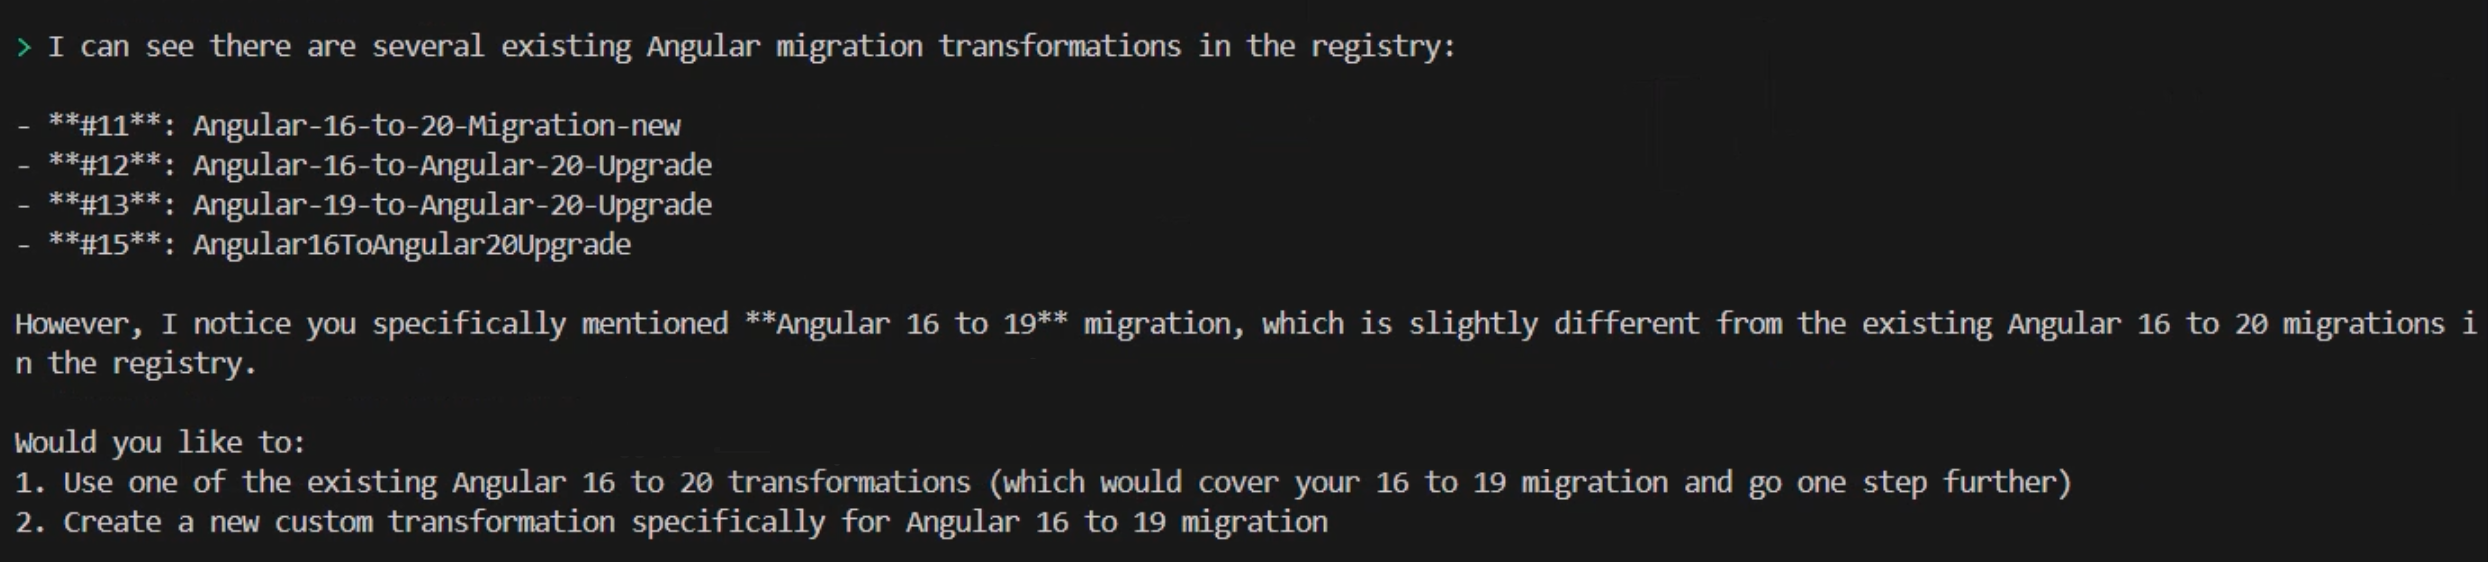
I choose to create a custom one by continuing to use natural language and typing create a new one as a command. Again, this could be any variation of that statement provided that you indicate your intentions clearly. It follows by asking me a few questions including whether I have any useful documentation, example code or migration guides that I can provide to help customize the transformation plan.

For this demo, I’m only going to rely on AWS Transform to provide me with good defaults. I type I don't have these details. Follow best practices. and the CLI responds by telling me that it will create a comprehensive transformation definition for migrating Angular 16 to Angular 19.  Of course, I relied on the pre-trained data to generate results based on best practices. As usual, the recommendation is to provide as much information and relevant data as possible at this stage of the process for better results. However, you don’t need to have all the data upfront. You can keep on providing data at any time› as you iterate through the process of creating the custom transformation definition.

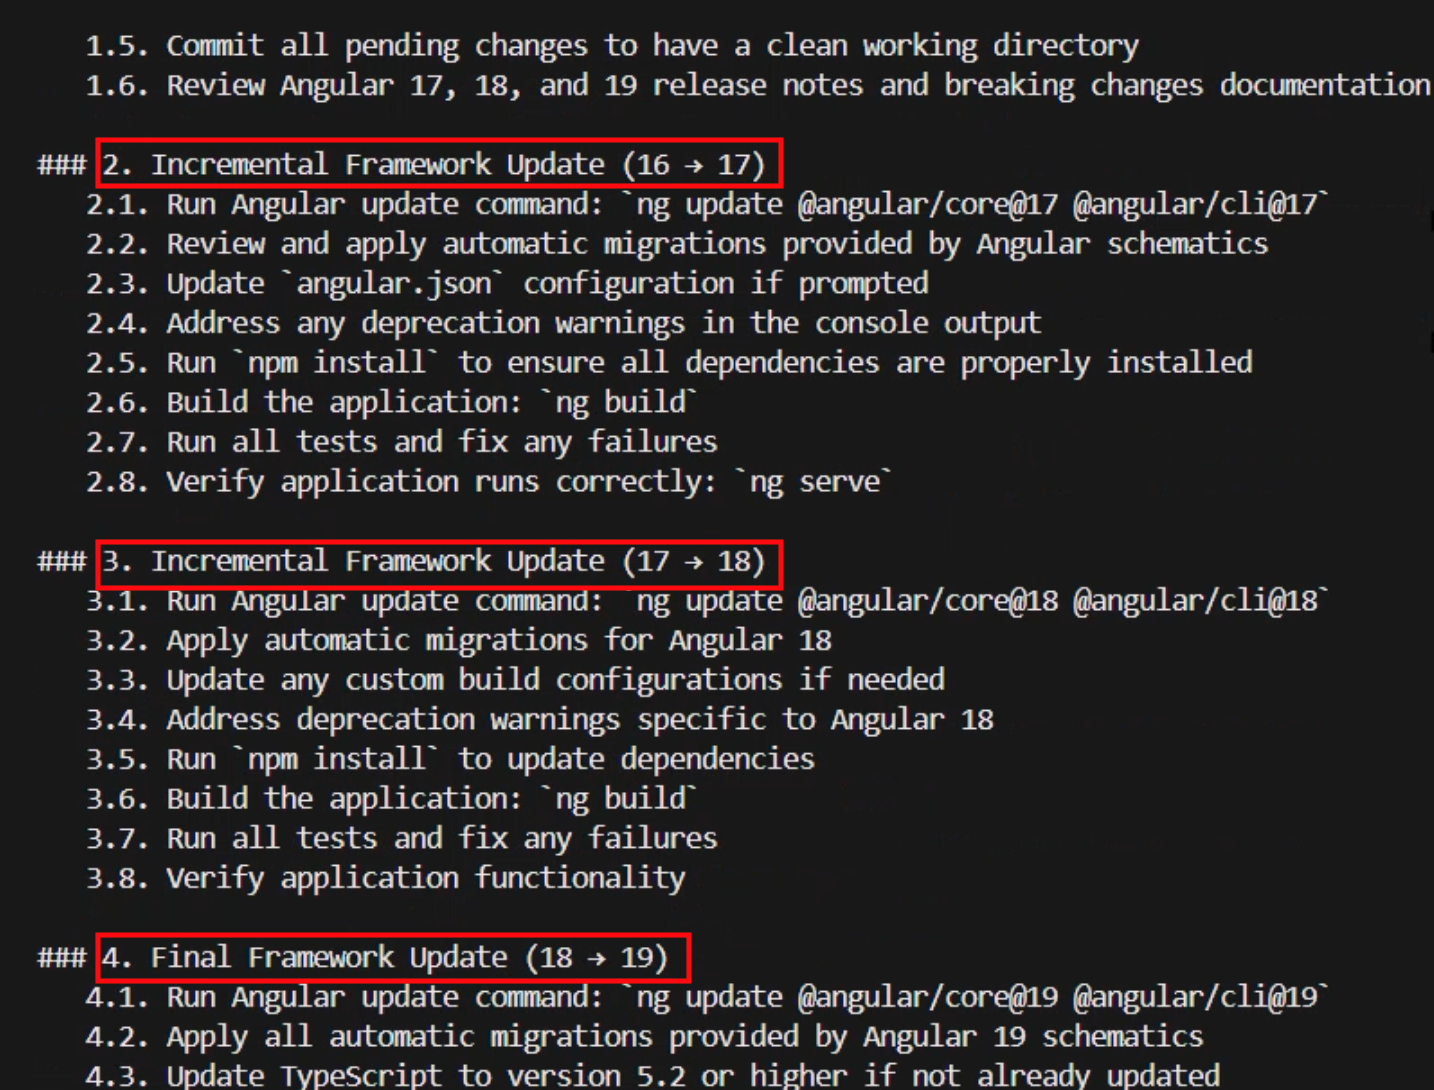
The transformation definition is generated as a markup file containing a summary and a comprehensive sequence of implementation steps grouped logically into phases such as premigration preparation, processing and partitioning, static dependency analysis, searching and applying specific transformation rules, and step-by-step migration and iterative validation.

It’s interesting to see that AWS Transform opted for the best practice of doing incremental framework updates creating steps for migrating the application first to 17 then 18 then 19 instead of trying to go directly from 16 to 19 to minimize issues.

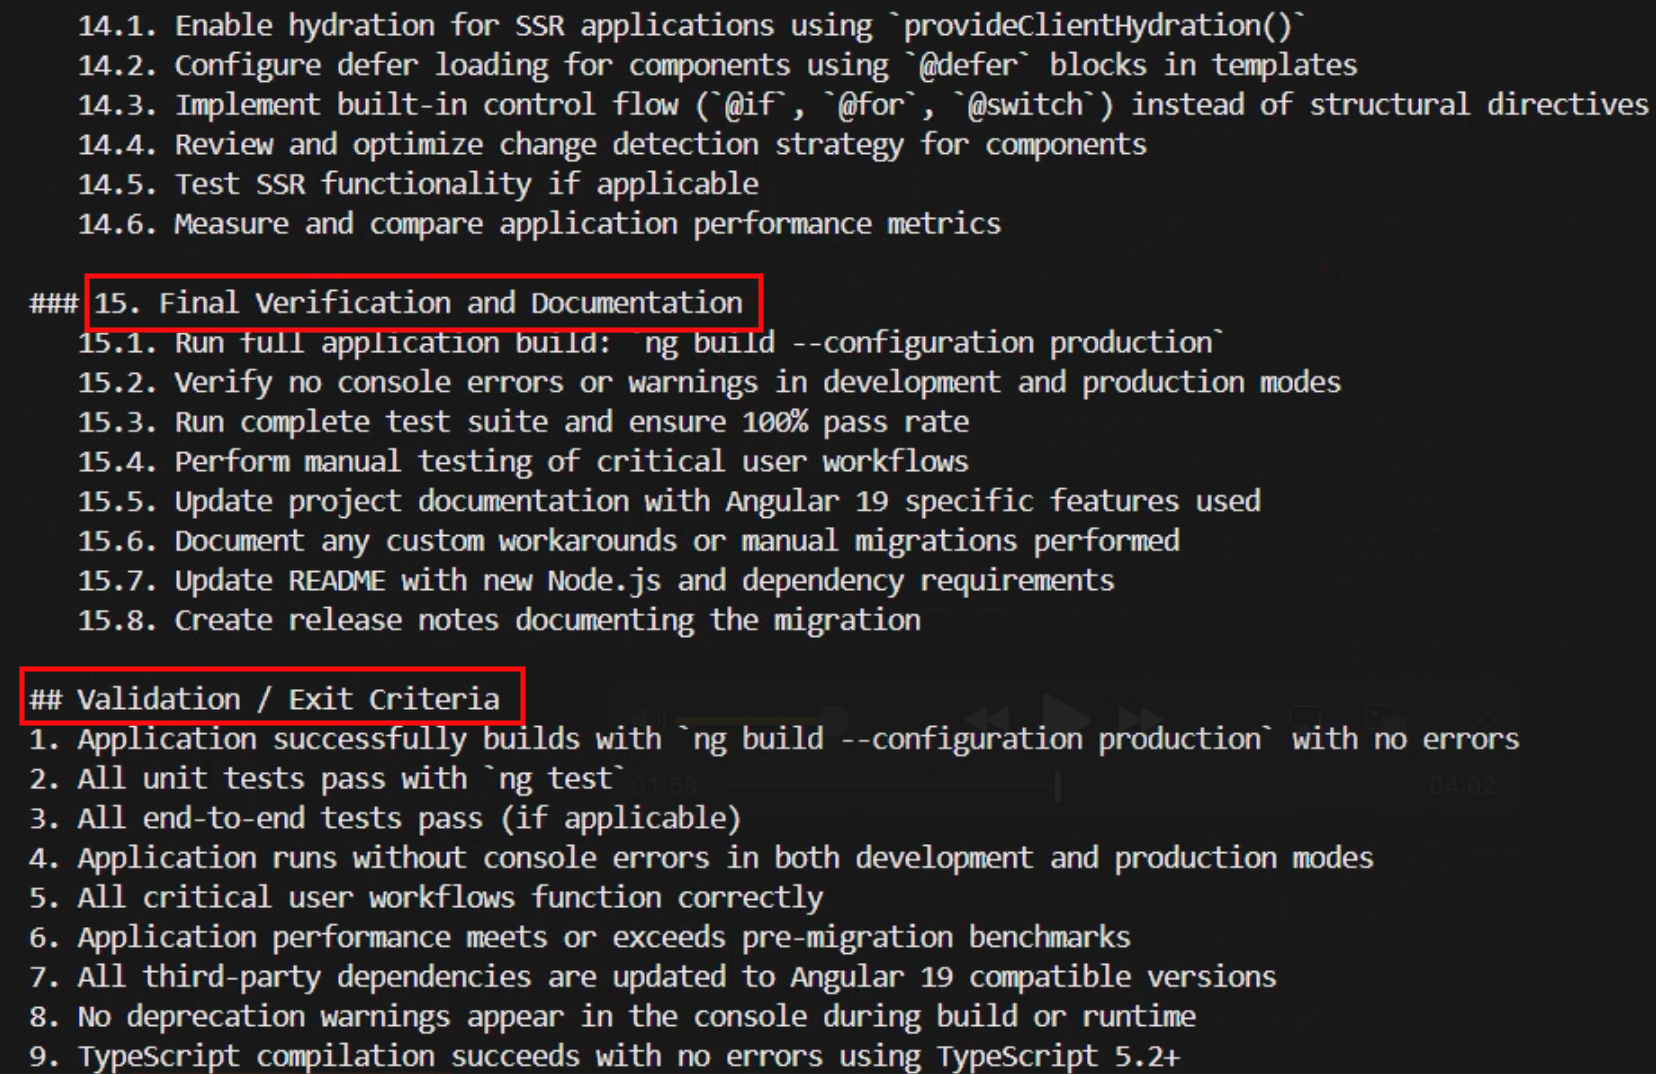
Note that the plan includes various stages of testing and verification to confirm that the various phases can be concluded with confidence. At the very end, it also includes a final validation stage listing exit criteria that performs a comprehensive set of tests against all aspects of the application that will be used to accept the migration as successfully complete.

After the transformation definition is created, AWS Transform asks me about what I would like to do next. I can choose to review or modify the transformation definition and I can reiterate through this process as much as I need until I arrive at one that I’m satisfied with. I can also choose to already apply this transformation definition to an Angular codebase. However, first I want to make this transformation available to my team members as well as myself so we can all use it again in the future. So, I choose option 4 to publish this transformation to the registry.

This custom transformation needs a name and a description of its objective which is displayed when users browse the registry. AWS Transforms automatically extracts those from context for me and asks me if I would like to modify them before going ahead. I like the sensible default of “Angular-16-to-19-Migration”, and the objective is clearly stated, so I choose to accept the suggestions and publish it by answering with yes, looks good.

Now that the transformation definition is created and published, I can use it and run it multiple times against any code repository. Let’s apply the transformation to a code repository with a project written in Angular 16. I now choose option 1 from the follow-up prompt and the CLI asks me for the path in my file system to the application that I want to migrate and, optionally, the build command that it should use.

After I provide that information, AWS Transform proceeds to analyze the code base and formulate a thorough step-by-step transformation plan based on the definition created earlier. After it’s done, it creates a JSON file containing the detailed migration plan specifically designed for applying our transformation definition to this code base. Similar to the process of creating the transformation definition, you can review and iterate through this plan as much as you need, providing it with feedback and adjusting it to any specific requirements you might have.

When I’m ready to accept the plan, I can use natural language to tell AWS Transform that we can start the migration process. I type looks good, proceed and watch the progress in my shell as it starts executing the plan and making the changes to my code base one step at a time.

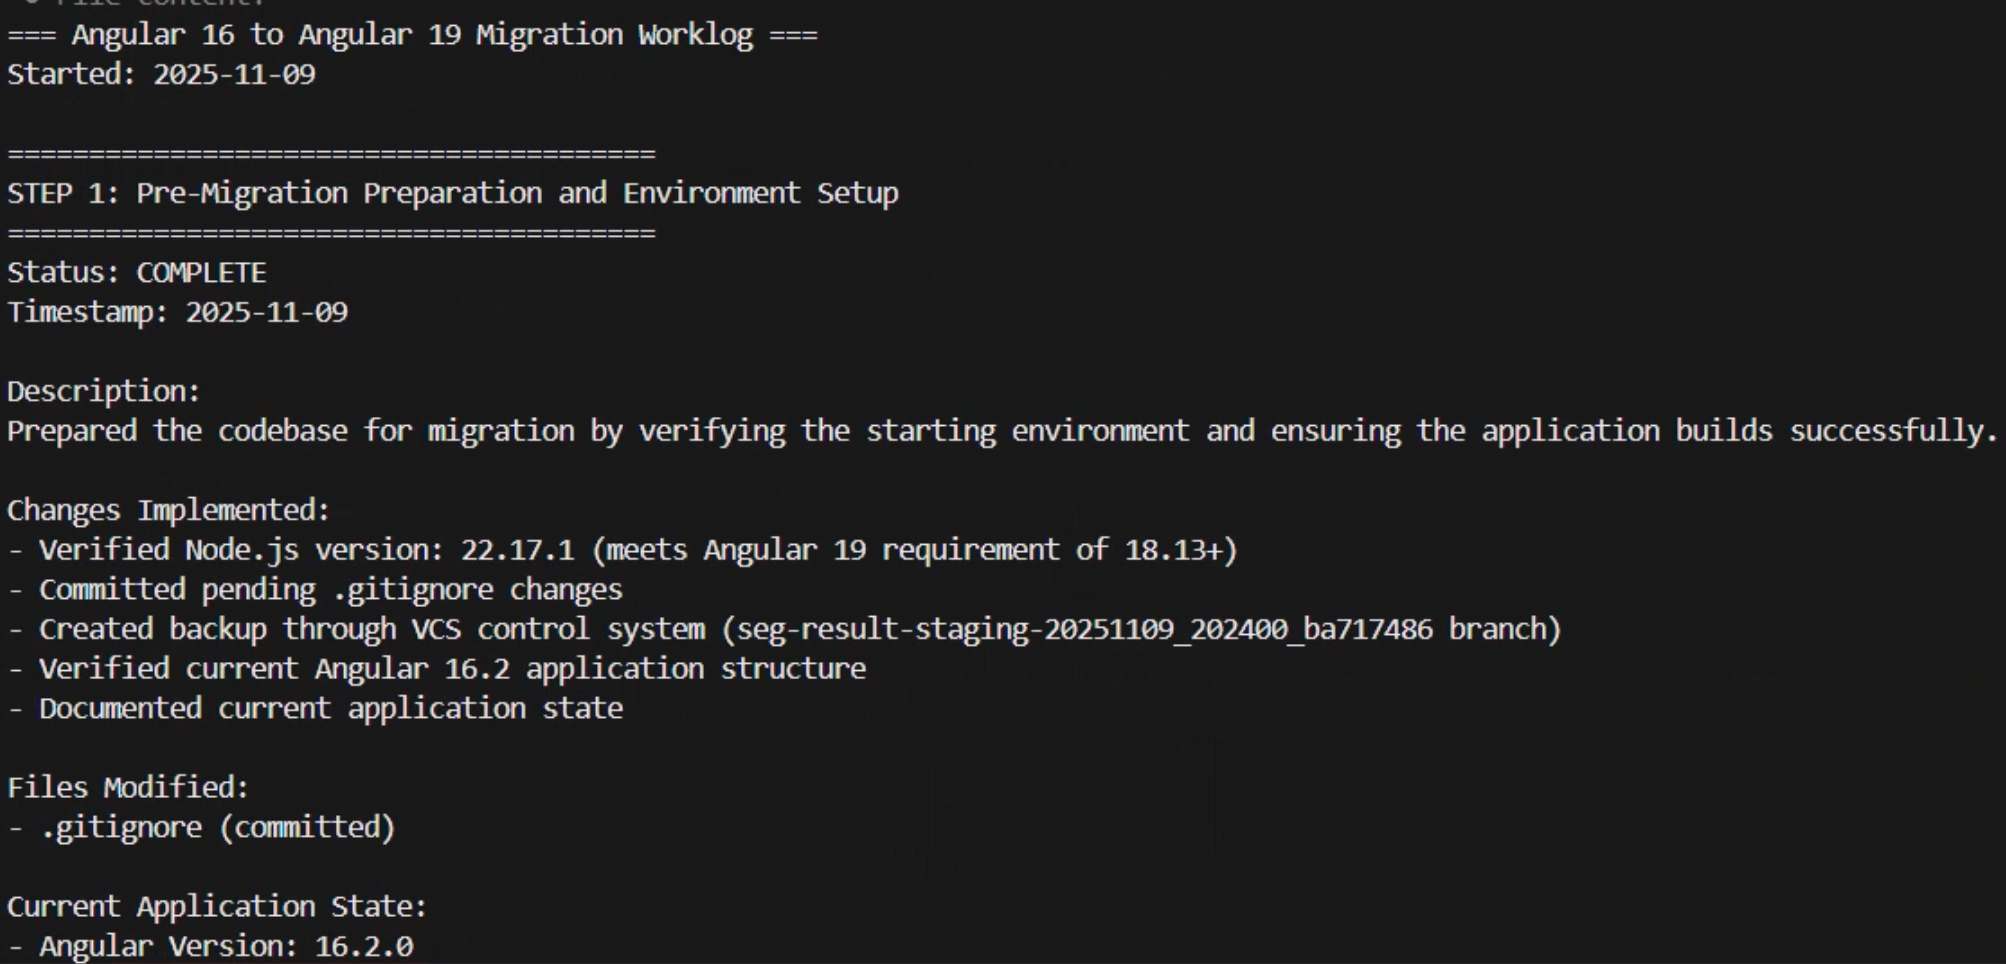
The time it takes will vary depending on the complexity of the application. In my case, it took a few minutes to complete. After it has finished, it provides me with a transformation summary and the status of each one of the exit criteria that were included in the final verification phase of the plan alongside all the evidence to support the reported status. For example, the Application Build – Production criteria was listed as passed and some of the evidence provided included the incremental Git commits, the time that it took to complete the production build, the bundle size, the build output message, and the details about all the output files created.

Conclusion
AWS Transform represents a fundamental shift in how organizations approach code modernization and technical debt. The service helps to transform what was at one time a fragmented, team-by-team effort into a unified, intelligent capability that eliminates knowledge silos, keeping your best practices and institutional knowledge available as scalable assets across the entire organization. This helps to accelerate modernization initiatives while freeing developers to spend more time on innovation and driving business value instead of focusing on repetitive maintenance and modernization tasks.

Things to know

AWS Transform custom is now generally available. Visit the get started guide to start your first transformation campaign or check out the documentation to learn more about setting up custom transformation definitions.

Python 3.14 runtime now available in AWS Lambda

Post Syndicated from Leandro Cavalcante Damascena original https://aws.amazon.com/blogs/compute/python-3-14-runtime-now-available-in-aws-lambda/

AWS Lambda now supports Python 3.14 as both a managed runtime and container base image. Python is a popular language for building serverless applications. Developers can now take advantage of new features and enhancements when creating serverless applications on Lambda.

You can develop Lambda functions in Python 3.14 using the AWS Management ConsoleAWS Command Line Interface (AWS CLI)AWS SDK for Python (Boto3)AWS Serverless Application Model (AWS SAM)AWS Cloud Development Kit (AWS CDK), and other infrastructure as code tools.

The Python 3.14 runtime supports Powertools for AWS Lambda (Python), a developer toolkit that helps you to implement serverless best practices. Powertools includes observability, batch processing, AWS Systems Manager Parameter Store integration, idempotency, feature flags, Amazon CloudWatch metrics, structured logging, and more.

Lambda@Edge allows you to use Python 3.14 to customize low-latency content delivered through Amazon CloudFront.

This blog post highlights notable Python language updates, Python Lambda runtime features and support, and how you can use the new Python 3.14 runtime in your serverless applications.

New Python features

Python 3.14 contains the following notable updates.

Template strings literal

Template strings introduce a new mechanism for custom string processing using the t prefix instead of f for f-strings. Unlike f-strings that return a simple string, t-strings return an object representing both static and interpolated parts.

Evaluation of type annotations

With the implementation of PEP 649, Python 3.14 defers type annotation evaluation until required. This reduces import time overhead and resolves forward reference issues.

Improved Error Messages

The interpreter now provides helpful suggestions when it detects typos in Python keywords. These include incorrect control flow structures, misused conditional expressions, string syntax errors, incompatible type usage in dicts/sets, and context manager protocol mismatches.

whille :

Traceback (most recent call last):
  File "<stdin>", line 1
    whille :
    ^^^^^^
SyntaxError: invalid syntax. Did you mean 'while'?

Standard library

The standard library includes a new compression.zstd module that provides native support for zstandard compression, offering better compression ratios and faster decompression compared to existing algorithms.

Python 3.14 also includes improved error messages and enhanced asyncio introspection capabilities.

Lambda runtime changes

The Lambda Python runtime contains the following changes.

Python 3.14 features that are not available

Python 3.14 includes some features that are not enabled for the Lambda managed runtime or base images. These features must be enabled when the Python runtime is compiled and cannot be enabled via an execution-time flag. The just-in-time (JIT) compiler is not available in the Lambda runtime because it’s still in an experimental phase. Free-threaded mode, running Python without the global interpreter lock, is supported in Python 3.14, but it is not enabled in the Lambda runtime due to potential performance impact. To use these features in Lambda, you can deploy your own Python runtime build with these features enabled, using a container image or custom runtime.

Amazon Linux 2023

As with the Python 3.12 and Python 3.13 runtimes, the Python 3.14 runtime is based on the provided.al2023 runtime, which is based on the Amazon Linux 2023 minimal container image. The Amazon Linux 2023 minimal image uses microdnf as a package manager, symlinked as dnf. This replaces the yum package manager used in Python 3.11 and earlier AL2-based images. If you deploy your Lambda functions as container images, you must update your Dockerfiles to use dnf instead of yum when upgrading to the Python 3.14 base image from Python 3.11 or earlier base images.

Learn more about the provided.al2023 runtime in the blog post Introducing the Amazon Linux 2023 runtime for AWS Lambda and the Amazon Linux 2023 launch blog post.

Using Python 3.14 in Lambda

You can use Python 3.14 for your Lambda functions in the AWS Management Console, an AWS Lambda container image, or the AWS Cloud Development Kit (AWS CDK).

AWS Management Console

To use the Python 3.14 runtime to develop your Lambda functions, specify a runtime parameter value of Python 3.14 when creating or updating a function. On the Create Function page of the AWS Lambda console, Python 3.14 is available in the Runtime dropdown menu.

Create function page of the AWS Lambda console

To update an existing Lambda function to Python 3.14, navigate to the function in the Lambda console and choose Edit in the Runtime settings panel. The new version of Python is available in the Runtime dropdown menu.

The runtime dropdown menu

Upgrading a function to Python 3.14

To upgrade a function to Python 3.14, check your code and dependencies for compatibility with Python 3.14, run tests, and update as necessary. Consider using generative AI coding assistants like Amazon Q Developer, Amazon Q Developer for CLI, or Kiro to help with upgrades.

AWS Lambda container image

Change the Python base image version by modifying the FROM statement in your Dockerfile:

FROM public.ecr.aws/lambda/python:3.14
# Copy function code
COPY lambda_handler.py ${LAMBDA_TASK_ROOT}

AWS Serverless Application Model (AWS SAM)

In AWS SAM set the Runtime attribute to python3.14 to use this version.

AWSTemplateFormatVersion: '2010-09-09'
Transform: AWS::Serverless-2016-10-31
Description: Simple Lambda Function
  MyFunction:
    Type: AWS::Serverless::Function
    Properties:
      Description: My Python Lambda Function
      CodeUri: my_function/
      Handler: lambda_function.lambda_handler
      Runtime: python3.14

AWS SAM supports generating this template with Python 3.14 for new serverless applications using the sam init command. Refer to the AWS SAM documentation.

AWS Cloud Development Kit

In the AWS CDK, set the runtime attribute to lambda.Runtime.PYTHON_3_14 to use this version.

In Python CDK:

from constructs import Construct
from aws_cdk import ( App, Stack, aws_lambda as _lambda )
class SampleLambdaStack(Stack):
    def __init__(self, scope: Construct, id: str, **kwargs) -> None:
        super().__init__(scope, id, **kwargs)

        base_lambda = _lambda.Function(self, 'python314LambdaFunction',
                                       handler='lambda_handler.handler',
                                    runtime=_lambda.Runtime.PYTHON_3_14,
                                 code=_lambda.Code.from_asset('lambda'))

In TypeScript CDK:

import * as cdk from 'aws-cdk-lib';
import * as lambda from 'aws-cdk-lib/aws-lambda'
import * as path from 'path';
import { Construct } from 'constructs';
export class SampleLambdaStack extends cdk.Stack {
  constructor(scope: Construct, id: string, props?: cdk.StackProps) {
    super(scope, id, props);
    // The code that defines your stack goes here
    // The python3.14 enabled Lambda Function
    const lambdaFunction = new lambda.Function(this, 'python314LambdaFunction', {
      runtime: lambda.Runtime.PYTHON_3_14,
      memorySize: 512,
      code: lambda.Code.fromAsset(path.join(__dirname, '/../lambda')),
      handler: 'lambda_handler.handler'
    })
  }
}

Serverless Land Patterns AWS Top Picks for Python, now use Python 3.14.

Performance considerations

At launch, new Lambda runtimes receive less usage than existing established runtimes. This can result in longer cold start times due to reduced cache residency within internal Lambda sub-systems. Cold start times typically improve in the weeks following launch as usage increases. As a result, AWS recommends not drawing conclusions from side-by-side performance comparisons with other Lambda runtimes until the performance has stabilized. Since performance is highly dependent on workload, customers with performance-sensitive workloads should conduct their own testing instead of relying on generic test benchmarks.

Conclusion

Lambda now supports Python 3.14 as a managed language runtime to help developers build more efficient, powerful, and scalable serverless applications. Python 3.14 language additions include data model improvements, typing changes, and updates to the standard library. The Lambda managed runtime does not include the option to disable the global interpreter lock (GIL) or use the experimental JIT compiler.

You can build and deploy functions using Python 3.14 using the AWS Management Console, AWS CLI, AWS SDK, AWS SAM, AWS CDK, or your choice of infrastructure as code tool. You can also use the Python 3.14 container base image if you prefer to build and deploy your functions using container images.

Try the Python 3.14 runtime in Lambda today and experience the benefits of this updated language version.

To find more Python examples, use the Serverless Patterns Collection. For more serverless learning resources, visit Serverless Land.

A closer look at Python Workflows, now in beta

Post Syndicated from Caio Nogueira original https://blog.cloudflare.com/python-workflows/

Developers can already use Cloudflare Workflows to build long-running, multi-step applications on Workers. Now, Python Workflows are here, meaning you can use your language of choice to orchestrate multi-step applications.

With Workflows, you can automate a sequence of idempotent steps in your application with built-in error handling and retry behavior. But Workflows were originally supported only in TypeScript. Since Python is the de facto language of choice for data pipelines, artificial intelligence/machine learning, and task automation – all of which heavily rely on orchestration – this created friction for many developers.

Over the years, we’ve been giving developers the tools to build these applications in Python, on Cloudflare. In 2020, we brought Python to Workers via Transcrypt before directly integrating Python into workerd in 2024. Earlier this year, we built support for CPython along with any packages built in Pyodide, like matplotlib and pandas, in Workers. Now, Python Workflows are supported as well, so developers can create robust applications using the language they know best.

Why Python for Workflows?

Imagine you’re training an LLM. You need to label the dataset, feed data, wait for the model to run, evaluate the loss, adjust the model, and repeat. Without automation, you’d need to start each step, monitor manually until completion, and then start the next one. Instead, you could use a workflow to orchestrate the training of the model, triggering each step pending the completion of its predecessor. For any manual adjustments needed, like evaluating the loss and adjusting the model accordingly, you can implement a step that notifies you and waits for the necessary input.

Consider data pipelines, which are a top Python use case for ingesting and processing data. By automating the data pipeline through a defined set of idempotent steps, developers can deploy a workflow that handles the entire data pipeline for them.

Take another example: building AI agents, such as an agent to manage your groceries. Each week, you input your list of recipes, and the agent (1) compiles the list of necessary ingredients, (2) checks what ingredients you have left over from previous weeks, and (3) orders the differential for pickup from your local grocery store. Using a Workflow, this could look like:

  1. await step.wait_for_event() the user inputs the grocery list

  2. step.do() compile list of necessary ingredients

  3. step.do() check list of necessary ingredients against left over ingredients

  4. step.do() make an API call to place the order

  5. step.do() proceed with payment

Using workflows as a tool to build agents on Cloudflare can simplify agents’ architecture and improve their odds for reaching completion through individual step retries and state persistence. Support for Python Workflows means building agents with Python is easier than ever.

How Python Workflows work

Cloudflare Workflows uses the underlying infrastructure that we created for durable execution, while providing an idiomatic way for Python users to write their workflows. In addition, we aimed for complete feature parity between the Javascript and the Python SDK. This is possible because Cloudflare Workers support Python directly in the runtime itself. 

Creating a Python Workflow

Cloudflare Workflows are fully built on top of Workers and Durable Objects. Each element plays a part in storing Workflow metadata, and instance level information. For more detail on how the Workflows platform works, check out this blog post.

At the very bottom of the Workflows control plane sits the user Worker, which is the WorkflowEntrypoint. When the Workflow instance is ready to run, the Workflow engine will call into the run method of the user worker via RPC, which in this case will be a Python Worker.

This is an example skeleton for a Workflow declaration, provided by the official documentation:

export class MyWorkflow extends WorkflowEntrypoint<Env, Params> {
  async run(event: WorkflowEvent<Params>, step: WorkflowStep) {
    // Steps here
  }
}

The run method, as illustrated above, provides a WorkflowStep parameter that implements the durable execution APIs. This is what users rely on for at-most-once execution. These APIs are implemented in JavaScript and need to be accessed in the context of the Python Worker.

A WorkflowStep must cross the RPC barrier, meaning the engine (caller) exposes it as an RpcTarget. This setup allows the user’s Workflow (callee) to substitute the parameter with a stub. This stub then enables the use of durable execution APIs for Workflows by RPCing back to the engine. To read more about RPC serialization and how functions can be passed from caller and callee, read the Remote-Procedure call documentation.

All of this is true for both Python and JavaScript Workflows, since we don’t really change how the user Worker is called from the Workflows side. However, in the Python case, there is another barrier – language bridging between Python and the JavaScript module. When an RPC request targets a Python Worker, there is a Javascript entrypoint module responsible for proxying the request to be handled by the Python script, and then returned to the caller. This process typically involves type translation before and after handling the request.

Overcoming the language barrier

Python workers rely on Pyodide, which is a port of CPython to WebAssembly. Pyodide provides a foreign function interface (FFI) to JavaScript which allows for calling into JavaScript methods from Python. This is the mechanism that allows other bindings and Python packages to work within the Workers platform. Therefore, we use this FFI layer not only to allow using the Workflow binding directly, but also to provide WorkflowStep methods in Python. In other words, by considering that WorkflowEntrypoint is a special class for the runtime, the run method is manually wrapped so that WorkflowStep is exposed as a JsProxy instead of being type translated like other JavaScript objects. Moreover, by wrapping the APIs from the perspective of the user Worker, we allow ourselves to make some adjustments to the overall development experience, instead of simply exposing a JavaScript SDK to a different language with different semantics. 

Making the Python Workflows SDK Pythonic

A big part of porting Workflows to Python includes exposing an interface that Python users will be familiar with and have no problems using, similarly to what happens with our JavaScript APIs. Let’s take a step back and look at a snippet for a Workflow (written in Typescript) definition.

import { WorkflowEntrypoint, WorkflowStep, WorkflowEvent} from 'cloudflare:workers';
 
export class MyWorkflow extends WorkflowEntrypoint {
    async run(event: WorkflowEvent<YourEventType>, step: WorkflowStep) {
        let state = step.do("my first step", async () => {
          // Access your properties via event.payload
          let userEmail = event.payload.userEmail
          let createdTimestamp = event.payload.createdTimestamp
          return {"userEmail": userEmail, "createdTimestamp": createdTimestamp}
	    })
 
        step.sleep("my first sleep", "30 minutes");
 
        await step.waitForEvent<EventType>("receive example event", { type: "simple-event", timeout: "1 hour" })
 
   	 const developerWeek = Date.parse("22 Sept 2025 13:00:00 UTC");
        await step.sleepUntil("sleep until X times out", developerWeek)
    }
}

The Python implementation of the workflows API requires modification of the do method. Unlike other languages, Python does not easily support anonymous callbacks. This behavior is typically achieved through the use of decorators, which in this case allow us to intercept the method and expose it idiomatically. In other words, all parameters maintain their original order, with the decorated method serving as the callback.

The methods waitForEvent, sleep, and sleepUntil can retain their original signatures, as long as their names are converted to snake case.

Here’s the corresponding Python version for the same workflow, achieving similar behavior:

from workers import WorkflowEntrypoint
 
class MyWorkflow(WorkflowEntrypoint):
    async def run(self, event, step):
        @step.do("my first step")
        async def my_first_step():
            user_email = event["payload"]["userEmail"]
            created_timestamp = event["payload"]["createdTimestamp"]
            return {
                "userEmail": user_email,
                "createdTimestamp": created_timestamp,
            }
 
        await my_first_step()
 
        step.sleep("my first sleep", "30 minutes")
 
         await step.wait_for_event(
            "receive example event",
            "simple-event",
            timeout="1 hour",
        )
 
        developer_week = datetime(2024, 10, 24, 13, 0, 0, tzinfo=timezone.utc)
        await step.sleep_until("sleep until X times out", developer_week)

DAG Workflows

When designing Workflows, we’re often managing dependencies between steps even when some of these tasks can be handled concurrently. Even though we’re not thinking about it, many Workflows have a directed acyclic graph (DAG) execution flow. Concurrency is achievable in the first iteration of Python Workflows (i.e.: minimal port to Python Workers) because Pyodide captures Javascript thenables and proxies them into Python awaitables.

Consequently, asyncio.gather works as a counterpart to Promise.all. Although this is perfectly fine and ready to be used in the SDK, we also support a declarative approach.

One of the advantages of decorating the do method is that we can essentially provide further abstractions on the original API, and have them work on the entrypoint wrapper. Here’s an example of a Python API making use of the DAG capabilities introduced:

from workers import Response, WorkflowEntrypoint

class PythonWorkflowDAG(WorkflowEntrypoint):
    async def run(self, event, step):

        @step.do('dependency 1')
        async def dep_1():
            # does stuff
            print('executing dep1')

        @step.do('dependency 2')
        async def dep_2():
            # does stuff
            print('executing dep2')

        @step.do('demo do', depends=[dep_1, dep_2], concurrent=True)
        async def final_step(res1=None, res2=None):
            # does stuff
            print('something')

        await final_step()

This kind of approach makes the Workflow declaration much cleaner, leaving state management to the Workflows engine data plane, as well as the Python workers Workflow wrapper. Note that even though multiple steps can run with the same name, the engine will slightly modify the name of each step to ensure uniqueness. In Python Workflows, a dependency is considered resolved once the initial step involving it has been successfully completed.

Try it out

Check out writing Workers in Python and create your first Python Workflow today! If you have any feature requests or notice any bugs, share your feedback directly with the Cloudflare team by joining the Cloudflare Developers community on Discord.

DispatchGym: Grab’s reinforcement learning research framework

Post Syndicated from Grab Tech original https://engineering.grab.com/techblog_-dispatchgym

Introduction

DispatchGym is a research framework designed to facilitate Reinforcement Learning (RL) studies and applications for the dispatch system, which matches bookings with drivers. The primary goal is to empower data scientists with a tool that allows them to independently develop and test RL-related concepts for dispatching systems. It accelerates research by providing a suite of modules that include a reinforcement learning algorithm, a dispatching process simulation, and an interface connecting the two through the Gymnasium API.

To ensure efficient and cost-effective RL research without compromising on quality, DispatchGym aims to be both comprehensive and accessible. Anyone with basic RL knowledge and Python programming skills can use it to explore new ideas in RL and dispatch system logic.

This article walks you through the principles behind DispatchGym, how these principles effectively and efficiently empower impactful research, and how it can be applied to solve real world problems.

The challenge with RL

Although RL methods can be applied to a wide variety of problems that can be formulated as a Markov Decision Process (MDP), designing an effective RL-based solution is not a trivial task. The primary challenges stem from two key components: the reward function and the lever.

In RL, the reward function represents the objective we aim to maximize. At first glance, it might seem straightforward to plug in any metric, such as the company’s profit or the number of completed bookings per day. However, these metrics are not always sensitive to the lever that RL can manipulate, or the lever itself may not significantly influence the objective. For example, consider a setup where we aim to maximize the daily number of completed bookings by adjusting the maximum number of candidate drivers considered to each booking. Beyond a minimal threshold (e.g., one driver), further increasing this limit provides negligible benefits. As a result, RL struggles to determine whether setting this limit to 11 or 15 would result in higher rewards.

In summary, when a lever exerts weak influence on a reward function, the RL setup becomes ineffective. Therefore, we should strive to select a lever that strongly influences the reward function and define a reward function that is both sensitive to manipulations of that lever and aligned with our overall goal. Note that the reward function does not have to be identical to our ultimate objective; it merely needs to be highly correlated with it.

Figure 1. Illustration of weak lever influence on a reward function.

Empowering research with DispatchGym

The primary application of DispatchGym is to accelerate and broaden cost-effective research and impactful RL applications for Grab’s dispatching system. A system which is responsible for assigning a driver to each booking. To achieve this, DispatchGym must have the following characteristics:

  • Reliable
    The simulation component should be accurate enough to capture essential behaviors strongly linked to the metrics of interest, without necessarily modeling everything else. While it’s beneficial if the simulation can do more than the specific use case (e.g., simulating both batching and allocation when only allocation is needed), it is not strictly required.

  • Cost-effective
    Updating all of DispatchGym’s components should require minimal monetary and labor costs to enable rapid iteration. This includes keeping the simulation component aligned with real system behaviors, incorporating the latest technologies in the optimization component, and maintaining seamless integration between the simulation and optimization components.

  • Empowering
    It should be as easy as possible for data scientists and engineers to modify any DispatchGym component and then run experiments. This flexibility is crucial because new research typically requires adjustments to both the simulation and optimization components. By granting users the freedom to adapt DispatchGym, the framework fosters continuous innovation.

Research-friendly simulated environment

The simulation component of DispatchGym, or the “simulated environment,” is designed with reliability, cost-effectiveness, and user empowerment in mind. It models the full dispatching process, from booking creation and driver dispatch to driver movement and booking completion. While this environment may not be perfectly accurate in absolute terms (there can be differences between real and simulated metric values), it emphasizes directional accuracy. This means that the metric trends (up or down) in the simulation closely match real-world behavior. This focus on directional accuracy is crucial because most research involves sim-to-sim comparisons, where shifts in metrics are the most important. Verifying directional accuracy is also simpler and more practical for evaluating simulation performance. For instance, we can test various supply-demand imbalance scenarios and check whether a supply-rich situation indeed fulfills more bookings, and vice versa.

Figure 2. Simulated processes.

The simulated environment’s cost-effectiveness and empowerment features come from a modular architecture and Python, a research-friendly programming language. The modular design offers a gentle learning curve, allowing users to easily navigate and make necessary changes in the codebase. Meanwhile, Python is selected to lower the entry barrier for adopting DispatchGym. To mitigate Python’s runtime overhead, DispatchGym leverages Numba to significantly speed up simulation execution.

DispatchGym in action

Data scientists use DispatchGym by modifying a local copy of the codebase to implement their ideas. They then upload the updated codebase to an internal infrastructure using a single CLI command, which spawns a Spark job to run the DispatchGym program. This setup grants complete flexibility over the simulation and optimization components without requiring users to manage the underlying infrastructure.

Figure 3. Data scientist interactions with DispatchGym.

Applying RL approach for dispatch

Amongst its many uses, DispatchGym was applied in building an effective contextual bandit strategy for the auto-adaptive tuning of dispatch-related hyperparameters. Its flexibility allowed us to experiment with various contextual bandit model variants, including linear bandits, neural-linear bandits, and Gaussian-process bandits, as well as multiple action sampling strategies, such as epsilon-greedy, Thompson sampling, SquareCB, and FastCB. These capabilities accelerated our progress in determining the best combination of levers, reward functions, and contextual bandits for improved fulfilment efficiency and reliability.

Conclusion

DispatchGym provides us a framework that equips data scientists with everything they need to develop and test RL solutions for dispatch systems. By integrating an RL optimization approach and a realistic dispatch simulation using a Gymnasium API, it enables rapid exploration and iteration of RL applications with just basic RL knowledge and Python programming language.

A major hurdle in applying RL to dispatch problems modeled as MDP is ensuring that the reward function aligns with ultimate business goals and is sensitive to the lever under control. If the lever (e.g., tweaking driver count) does not meaningfully influence the reward, the RL approach falters. DispatchGym addresses this by making it easy for data scientists to determine the most effective combinations of levers, reward functions, and RL approaches, ultimately driving positive business impact.

DispatchGym’s architecture focuses on reliability, cost-effectiveness, and user empowerment. Its simulation is designed to capture critical metrics and reflect real-world trends (directional accuracy), while its Python-based modular design enhanced by Numba enables easy prototyping. Researchers can adjust the environment locally before deploying changes seamlessly via a command-line interface, avoiding infrastructure overhead. These design decisions and capabilities empower data scientists to refine contextual bandit approaches for optimizing dispatch hyperparameters and explore innovative RL applications in the dispatch process.

We would like to thank Chongyu Zhou, Guowei Wong, and Roman Kotelnikov for their collaboration in developing the RL-based optimizer.

Join us

Grab is a leading superapp in Southeast Asia, operating across the deliveries, mobility and digital financial services sectors. Serving over 800 cities in eight Southeast Asian countries, Grab enables millions of people everyday to order food or groceries, send packages, hail a ride or taxi, pay for online purchases or access services such as lending and insurance, all through a single app. Grab was founded in 2012 with the mission to drive Southeast Asia forward by creating economic empowerment for everyone. Grab strives to serve a triple bottom line – we aim to simultaneously deliver financial performance for our shareholders and have a positive social impact, which includes economic empowerment for millions of people in the region, while mitigating our environmental footprint.

Powered by technology and driven by heart, our mission is to drive Southeast Asia forward by creating economic empowerment for everyone. If this mission speaks to you, join our team today!

The forecast is clear: clouds on e-paper, powered by the cloud

Post Syndicated from Marek Majkowski original https://blog.cloudflare.com/the-forecast-is-clear-clouds-on-e-paper-powered-by-the-cloud/

I’ve noticed that many shops are increasingly using e-paper displays. They’re impressive: high contrast, no backlight, and no visible cables. Unlike most electronics, these displays are seamlessly integrated and feel very natural. This got me wondering: is it possible to use such a display for a pet project? I want to experiment with this technology myself.


(source)

My main goal in this project is to understand the hardware and its capabilities. Here, I’ll be using an e-paper display to show the current weather, but at its core, I’m simply feeding data from a website to the display. While it sounds straightforward, it actually requires three layers of software to pull off. Still, it’s a fun challenge and a great opportunity to work with both embedded hardware and Cloudflare Workers.

Sourcing the hardware

For this project, I’m using components from Waveshare. They offer a variety of e-paper displays, ranging from credit card-sized to A4-sized models. I chose the 7.5-inch, two-color “e-Paper (G)” display. For the controller, I’m using a Waveshare ESP32-based universal board. With just these two components — a display and a controller — I was ready to get started.


When the components arrived, I carefully connected the display’s ribbon cable to the ESP32 board. Even though this step isn’t documented anywhere, it was simple and almost impossible to get wrong. Best of all, no soldering was needed!

That’s pretty much it for the hardware setup! I’m keeping the device powered with a 5V supply through a micro-USB connection.

One layer of hardware 


(source)

This was my first time working with the ESP32 CPU family, and I’m really impressed. It’s a system-on-chip controller with built-in Bluetooth and Wi-Fi. It’s relatively fast, very power-efficient, and quite popular in DSP (digital signal processing) applications. For example, your audio device might be powered by a CPU like this. Interestingly, the newer models have switched to the RISC-V instruction set.

For our purposes, we’ll only scratch the surface of what the ESP32 is capable of. The chip is straightforward to work with, thanks to the familiar Arduino environment. A great starting point is the demo provided by Waveshare. It sets up a web page where you can easily upload a custom image to the display.

To run the demo you need to:

  • Install the Arduino IDE.

  • Fix permissions of the /dev/ACM0 device.

  • Install “Additional Boards Manager URL” as per the instructions, and install the “esp32 by expressif” bundle.

  • Open the “Loader_esp32wf” example downloaded from waveshare.

  • Change the Wi-Fi name, password and IP address in the Arduino IDE srvr.h tab.

Once everything is set up, you should be able to connect to the ESP32’s IP address and use the simple web interface to upload an image to the display.


With a simple click of the “Upload Image” button, the magic happens: the e-paper display comes to life, showcasing the uploaded image.


With the demo up and running, we can move on to the next step: figuring out how to render a web page on the e-paper display.

Three layers of software

The ESP32 comes with some limitations. It has 520 KiB of RAM, 4 MiB of flash, and a 240 MHz clock speed. While this is fine for tasks like connecting to Wi-Fi or fetching a simple URL, it’s not powerful enough for more demanding tasks, such as parsing JSON or rendering an entire web page.

There are basic Arduino libraries for handling bitmaps, which can draw rectangles and render simple fonts, but manually managing layout doesn’t sound appealing to me. A better approach is to play to the ESP32’s strengths — fetching and displaying bitmaps — and delegate the more complex task of HTML rendering to a more powerful server. 

Let’s break the problem into three layers:

  1. ESP32 (Display Layer): The ESP32 will periodically, say every minute, fetch a pre-rendered bitmap from the server and display it on the e-paper screen. This keeps the ESP32’s tasks lightweight and manageable.

  2. Server A (Rendering Layer): This server will fetch the desired website, render it, and rasterize it into a bitmap format. Its job is to prepare a bitmap that the ESP32 can handle without additional processing.

  3. Server B (Content Layer): This server hosts the actual website with the HTML and CSS content. In this case, it will provide the local weather data in a styled format, ready to be fetched and rendered by Server A.


ESP32 (Display Layer)

The ESP32 provides some great higher-level libraries to simplify development. For this project, we’ll need three key components:

  1. Wi-Fi Arduino Library: To connect the ESP32 to a Wi-Fi network.

  2. HTTP Arduino Library: To handle HTTP requests and fetch the rendered bitmap from the server.

  3. EPD (e-Paper Display) Driver: To control the e-paper display and render the fetched bitmap.

These libraries make it much easier to implement the required functionality without dealing with low-level details.

Here’s my ESP32 Arduino project code. It’s actually pretty straightforward:

  • First, it connects to Wi-Fi

  • Then, it fetches a rendered bitmap from an HTTP endpoint

  • Then it pushes it to the e-paper display if needed

  • Waits a minute

  • And repeats the whole process forever

E-paper displays typically start to degrade after about one million refresh cycles. To preserve the display’s lifespan, I’m being extra careful to avoid unnecessary refreshes.

Server A (Rendering Layer)

Now for the exciting part! We need an online service that can fetch a website, render it, rasterize it to fit our small monochromatic display, and return it as a display-sized binary blob. Initially, I considered using headless Chrome paired with an ImageMagick script, but then I discovered Cloudflare’s Browser Rendering API, which fits our needs perfectly.

This API can be used quite trivially and nicely fits our needs. Here’s the typescript worker code, and there are two particularly interesting parts: handling a remote browser and dithering.

Remote Browser API

First, see how easy it is to render a website as a PNG using Browser Rendering:

if (!browser) {
browser = await puppeteer.launch(env.MYBROWSER, { keep_alive: 600000 });
launched = true;
}
sessionId = browser.sessionId();

const page = await browser.newPage();
await page.setViewport({
width: 480,
height: 800,
deviceScaleFactor: 1,
})

await page.goto(url);
img = (await page.screenshot()) as Buffer;

I’m genuinely surprised at how practical and effective this approach is. While the remote browser startup isn’t exactly fast — it can take a few seconds to generate the screenshot — it’s not an issue for my use case. The delay is perfectly acceptable, especially considering how much work is offloaded to the cloud.

Dithering

To prepare the bitmap for the ESP32, we need to decode the PNG, reduce the color palette to monochromatic, and apply dithering. Here’s the dithering code:

function ditherTwoBits(px: Buffer,
                       width: number,
                       height: number
                      ): Buffer {
    px = new Float32Array(px);

    for (let y = 0; y < height; y++) {
        for (let x = 0; x < width; x++) {
            const old_pixel = px[y * width + x];
            const new_pixel = old_pixel > 128 ? 0xff : 0x00;

            const quant_error = (old_pixel - new_pixel) / 16.0;
            px[(y + 0) * width + (x + 0)] = new_pixel;
            px[(y + 0) * width + (x + 1)] += quant_error * 7.;
            px[(y + 1) * width + (x - 1)] += quant_error * 3.;
            px[(y + 1) * width + (x + 0)] += quant_error * 5.;
            px[(y + 1) * width + (x + 1)] += quant_error * 1.;
        }
    }

    return Buffer.from(Uint8ClampedArray.from(px));
}

This was my first time experimenting with dithering, and it’s been a lot of fun! I was surprised by how straightforward the process is and that it’s fully deterministic. Now that I understand the details of the algorithm, I can’t help but notice its subtle side effects everywhere — in printed materials, on screens, and even in design choices around me. It’s fascinating how something so simple has such a broad impact!

To deploy this code as a Cloudflare Worker, you only need to install the required dependencies, configure the wrangler.toml file, and publish the code. Here’s a step-by-step guide:

sudo apt install npm
cd worker-render-raster
npm install wrangler
npm install @cloudflare/puppeteer --save-dev
npm install fast-png --save-dev
npx wrangler kv:namespace create KV
npx wrangler kv:namespace create KV --preview

With this out of the way, you can run the code:

2025-01-e-paper/worker-render-raster$ npx wrangler dev --remote

 ⛅️ wrangler 3.99.0
-------------------

Your worker has access to the following bindings:
- KV Namespaces:
  - KV: XXX
- Browser:
  - Name: BROWSER
[wrangler:inf] Ready on http://localhost:46131
⎔ Starting remote preview...
Total Upload: 755.39 KiB / gzip: 149.05 KiB
╭─────────────────────────────────────────────────────────────────────────────────────────────────╮
│  [b] open a browser, [d] open devtools, [l] turn on local mode, [c] clear console, [x] to exit  │
╰─────────────────────────────────────────────────────────────────────────────────────────────────╯

With everything set up, you can now open a browser and see a rendered and rasterized version of a website, processed through your Cloudflare Worker! For example, here’s how the 1.1.1.1 page looks in a 800×480 monochromatic resolution, complete with dithering:


This demonstrates how effectively the Worker can handle rendering, rasterizing, and adapting web content for an e-paper display. It’s quite satisfying to see the pipeline in action.

Server B (Content Layer)

To create the weather panel, I designed a simple HTML and CSS page and published it as another Cloudflare Worker. This time, I used Python in Cloudflare Workers because it felt more straightforward, especially since the site needs to query an external weather API. The simplicity of the code was surprising and made the process smooth.

async def on_fetch(request, env):
    cached = await env.KV.get("weather")
    if cached:
        cached = json.loads(cached)
    else:
        u = "https://api.open-meteo.com/..."
        a = await fetch(u)
        result = await a.text()
        cached = json.loads(result)
        await env.KV.put("weather", json.dumps(cached))
    return Response.new(render(...), headers=[('content-type', 'text/html')])

Here’s how it appears in a normal browser compared to the rendered and rasterized version by our worker:


Summary

Finally, the display deserves a proper frame. Here’s the finished version:


I started this project wanting to experiment with an e-paper display hardware, but I ended up spending most of my time writing software—and it turned out to be surprisingly enjoyable across all layers:

  • ESP32: The CPU is fantastic. Programming it is straightforward, thanks to powerful built-in libraries that simplify development.

  • Cloudflare Worker Browser Rendering: This is an underrated but incredibly powerful technology. It made implementing features like the Floyd–Steinberg dithering algorithm surprisingly easy.

  • Cloudflare Worker Python: Although still in beta, it worked flawlessly for my needs and was a great fit for handling API requests and serving dynamic content.

It’s remarkable how much you can achieve with relatively inexpensive hardware and free Cloudflare services.

How SmugMug Increased Data Modeling Productivity with Amazon Q Developer

Post Syndicated from Will Matos original https://aws.amazon.com/blogs/devops/how-smugmug-increased-data-modeling-productivity-with-amazon-q-developer/

This post is co-written with Dr. Geoff Ryder, Manager, at SmugMug.

Introduction

SmugMug operates two very large online photo platforms: SmugMug and Flickr. These platforms enable more than 100 million customers to safely store, search, share, and sell tens of billions of photos every day. However, the data science and engineering team at SmugMug and Flickr often faces complex data modeling challenges that require significant time to resolve.

These challenges arise due to several factors. First, the team has to contend with diverse datasets from different sources. Additionally, the database schema and tables are highly complex, and the team needs to quickly understand application (PHP) code and database table structures in order to generate the necessary complex database queries. Specifically, SmugMug uses Amazon Redshift as its cloud data warehouse to analyze patterns in petabyte-scale data stored in Amazon S3, as well as transactional data in Amazon Aurora and Amazon DynamoDB. This allows them to generate dozens of business reports daily.

However, the complexity increases further as many database tables also need to be imported from third-party organizations into Amazon Redshift, where they are joined with SmugMug and Flickr’s internal tables. In extreme cases, properly modeling all these database tables and handling issues like granularity, cardinality, timestamps and missing data could take years – an impractical timeline for the business. We are excited to walk through SmugMug’s data modeling use cases and how SmugMug uses Amazon Q Developer to improve the data science and engineering team’s productivity.

Discovering Amazon Q Developer

SmugMug was one of the first customers to pilot Amazon Q Developer (previously Amazon CodeWhisperer), the most capable AI-powered assistant for software development that re-imagines the experience across the entire software development lifecycle, making it easier and faster to build, secure, manage, optimize, operate, and transform applications on AWS. There are multiple Amazon Q Developer use cases at SmugMug and Flickr, such as using Amazon Q Developer agent (/dev) for software development (i.e. generating implementation plans and the accompanying code), generating inline code suggestions, asking Amazon Q Developer in chat about AWS services and best practices, and analyzing AWS usage and costs for Cloud Financial Management (CFM) needs. For the data science and engineering team specifically, the key feature is chatting with Amazon Q Developer in integrated development environments (IDEs) like Intellij DataGrip. The data analysts and data scientists at SmugMug and Flickr ask questions in Amazon Q Developer chat to analyze database schemas, generate data model diagrams from DDL (Data Definition Language) statements, convert queries between languages, automatically generate complex database queries for data analysis, generate code to validate table contents, and predict trends using ML (Machine Learning).

Implementing Amazon Q Developer

To solve the data modeling challenges SmugMug faced, the team collaborated closely with their AWS Account Team, AWS Professional Services, and the Amazon Q Developer service team to create and test a data modeling assistant solution using Amazon Q Developer.

As a first step, the data modeler needs to bring the right metadata to bear. For simpler cases, the commands “show view myschema.v” or “show table myschema.t“ retrieve DDL schema information about the specified view or table from Amazon Redshift into the IDE console.

Here’s an example using simulated data for a hypothetical company. For this typical company that handles orders for products, the result of typing “show table sample.orderinfo” and “show table sample.skuinfo”might be:

Image of SQL statement generated by the show table statement. "CREATE TABLE sample.skuinfo ( sku_id bigint ENCODE raw, sku_vendor bigint ENCODE az64, sku_category character varying(18) ENCODE lzo, sku_description character varying(255) ENCODE lzo, date_sku_created timestamp without time zone ENCODE az64, date_sku_updated timestamp without time zone ENCODE az64, pipeline_inserted_at timestamp without time zone ENCODE az64 ) DISTSTYLE KEY SORTKEY ( sku_id );"

Image of SQL statement generated by the show table statement. "CREATE TABLE sample.orderinfo ( order_id bigint ENCODE raw, shipper_id bigint ENCODE az64 distkey, product_id bigint ENCODE az64, quantity_ordered integer ENCODE az64, date_order_placed timestamp without time zone ENCODE az64 ) DISTSTYLE KEY SORTKEY ( order_id );"

This DDL text is now in the open tab. By selecting the text to highlight it, that DDL text becomes part of the context that Amazon Q Developer sees. The modeler can start asking questions about them in the Amazon Q Developer chat window in the IDE.

Diagram showing what is considered part of the context included in a request including the RAG query result, related documents when using the at-workspace key word, the highlighted text in the IDE open tab,the chat history, and the prompt.

In complex scenarios, establishing the correct modeling context requires a combination of schema information, legacy SQL, application source code in various programming languages, sample values, and natural language documentation. Amazon Q Developer addresses this by creating a local index of relevant files and content. When a question is asked using @workspace, this index is consulted to identify and include pertinent sections of code and information in the request. (See this article for additional details on workspace). The prompt plays a crucial role in measuring similarity, so providing comprehensive context within it is essential. To optimize this process, the IDE settings feature a tunable workspace index function, allowing for enhanced performance in identifying and incorporating relevant context.

Image showing the Amazon Q Settings window where you enable the Workspace feature by checking the "Workspace index" box. You can also change the number of worker threads used, and the maximum workspace index size in MB.

Workspace Index Settings

By adopting Amazon Q Developer as a team, we are able to jointly develop and share proprietary prompt text to address the four steps in our modeling process, as follows.

Step 1. Define the goal for the data modeling project

From prior knowledge, sketch a high-level goal for a data model. Gather the data for it manually, or by e.g. querying a vector database and adding its documents to the project.

For this example, we choose as the goal to compute aggregated metrics from a new table or view composed of two existing tables, sample.orderinfo and sample.skuinfo. These contain simulated data about product sales that are common to many companies. The order table is in the style of a fact table that logs customer orders, and the stock keeping unit (SKU) table is a dimension table that provides additional data points of interest about each order. The order and SKU information need to be combined by a join operation before we can compute the metrics. We would like Amazon Q Developer to tell us how to write that SQL join statement.

Step 2. Conduct an exploratory analysis and generate candidates

Next, prompt Amazon Q Developer for candidate foreign keys to join the tables, and for SQL code to execute those joins. Generate an entity-relationship diagram (ERD) as a visual aid. Prompts do not have to be complicated. For example:

@workspace What columns of database tables sample.orderinfo and sample.skuinfo 
would be best to join the two tables? Provide SQL code for the join. Draw an 
entity relationship diagram that shows the joins between the two tables, and 
includes only the fields involved in the join. Add a crow's foot cardinality 
marker to indicate a 1:many relationship, and add it next to the high 
cardinality table.

Image with the first part of the response to the prompt with the following text: "Based on the table schemas, sku_id is the appropriate column to join these tables. The relationship is likely one-to-many (1:M) where one SKU can appear in multiple orders. Here's the SQL join: SELECT o.order_id, o.sku_id, s.sku_description FROM sample.orderinfo o JOIN sample.skuinfo s ON o.sku_id = s.sku_id;

Image with the second part of the response to the prompt with the ASCII relationship diagram showing the join relationship.

Each time tables are joined together, new aggregated metrics become available to drive business insights. Now, for instance, we can find the top selling SKUs in October thanks to our results:

Image shows the top 5 results from the prior query showing the top skus in October.

Sometimes we need to look at code written in languages other than SQL to complete the data model. For example, the names of some vendors this company works with happen to appear in application PHP code as human readable strings, but are saved in the application database as numbers. The analytics data staged in Redshift only contain the numbers. So, we pull a copy of the PHP text file into @workspace, and ask Amazon Q Developer to translate the relevant string-integer mappings into a SQL case statement.

Image shows the selected PHP code with a switch statement mapping Vendor Ids to Vendor Names.

PHP Switch statement showing the mapping of Vendor Ids to String Names.

I am a Redshift database administrator and I am working on a data modeling 
problem. I would like to write SQL statements to join tables sample.orderinfo 
and sample.skuinfo. Please write that SQL to join the two tables. Also, I 
would like to write a SQL case statement to recover all string values defined 
in PHP that are represented as integer values in the database table.

The output of that prompt is shown below.

Image showing the updated SQL query that maps the Vendor Id to the Vendor Name.

Amazon Q Developer automatically detected the PHP switch case statement, converted to SQL, and added it to the final query. Many other programming languages are supported, and modelers should try this technique with other kinds of source code. Note that data scientists and analysts may not know where to look in complex application code for these details, so this discovery-plus-code translation step is a net new benefit to our company that is only possible thanks to Amazon Q Developer.

Step 3. Create code to test the analysis

Now we request SQL source code for a battery of small test queries. These can return cardinality, grain, arithmetic, and null count results.

Please write a short SQL test to compute counts of the key fields that are used 
in the joins, which will verify the cardinality assignments indicated in the 
entity relationship diagram above. The SQL test should compare distinct counts 
to total counts and null counts when it verifies the cardinality.

Image of resulting SQL queries to check cardinality.

Step 4. Validate the results of the analysis

Run the test queries to see if the candidate solution from step 2 meets our goals. The “Insert at cursor” button at the bottom of the response is handy for this. The data modeler can easily spot an error in the join logic and ERD from inspecting the output of the test query. (Or, if it’s hard to interpret the results, keep making the test queries simpler.) If errors arise from the AI misinterpreting or miscalculating a result, or from a vaguely worded prompt, simply adjust the prompt in step 2 to fix the known errors, and repeat steps 2 – 4.

Image showing the query results from the cardinality query.

After a few iterations, taking from seconds to at most tens of minutes each, the modeling errors have been worked out and we arrive at a valid production query.

Key Benefits and Results

With this Amazon Q Developer powered solution and iterative approach, SmugMug has achieved highly accurate data modeling results across numerous database tables. Once the correct modeling configuration is established, various useful outputs may become available.

We already described production SQL, unit tests, and ERDs for documentation. By the end of the process, because Amazon Q Developer has a good understanding of the data it just modeled in its chat history, it will also generate useful Python machine learning programs to predict business trends. Here is a prompt for that, and a partial screenshot of the Python output:

Please write Python code to implement a linear regression that predicts the 
quantity_ordered value based on other fields in the data set. Choose predictor 
variables that are less likely to cause multi-collinearity problems.

Image showing the python code generated to predict quantity_ordered value.

This only shows the model training step, but the full response included all library imports, a Redshift query, feature engineering steps, ML performance metrics, and code for plotting the metrics. And the AI can produce other types of predictive models. For example, you can try:

Please write Python code to implement an XGBoost model that predicts the 
quantity_ordered value based on other fields in the data set.

Ultimately, the solution has improved team productivity for both existing and new team members, while maintaining legacy knowledge needed to onboard new team members more efficiently. Key benefits include:

  1. Reducing SmugMug data analyst and scientist’s time spent on data modeling tasks from days to hours, allowing them to reallocate this time to other high-priority projects.
  2. Automating the generation of BI documentation and predictive ML, also saving crucial time.
  3. Providing net new value by translating application code constant definitions into SQL. Due to organizational boundaries, we would not have achieved this without an assist from the AI.

Future Plans and Expansion

SmugMug conducted the initial data modeling use case testing with over a dozen data science team members and analysts. We are moving on to analyze more complex tables and data schemas, and generating Python code in Amazon SageMaker for ML tasks like data preparation, training, inference, and MLOps. From our experience, Amazon Q Developer has become a preferred internal tool for development that has a data modeling component, and its use continues to expand to different groups around the company.

For SmugMug’s data modeling projects, we continue to enhance the four-step process described above. In order to gather the most relevant context to solve a problem, we build vector database collections to pull from schemas, older SQL code, application source code, BI tool content, and curated documentation. The vector search operation surfaces the right content, and spares data modelers from manually searching in different code archives. We use ChromaDB to do the searches, and bring the results from ChromaDB into the workspace as additional files.

Conclusion

Using Amazon Q Developer for data modeling use cases, SmugMug has managed to increase data science and engineering team productivity by up to 100% when compared to prior workflows. To explore how Amazon Q Developer can benefit your organization, get started here. If you have questions or suggestions, please leave a comment below.

About the Authors

Image of Dr. Geoffrey Ryder

Dr. Geoffrey Ryder

Dr. Geoff Ryder serves as the Manager of Data Science and Engineering at SmugMug, where he leads Team Prophecy in managing the company’s cloud-based data warehouse and analytics platforms. With a focus on leveraging the best AI tools, his team empowers photography clients to enhance their sales of both physical and digital photographic products. Geoff brings over two decades of experience in technical and business roles across Silicon Valley companies, and holds a PhD in Computer Engineering from UC-Santa Cruz.

Will Matos

Will Matos is a Principal Specialist Solutions Architect at AWS, revolutionizing developer productivity through Generative AI, AI-powered chat interfaces, and code generation. With 25 years of tech experience, and over 9 years with AWS, he collaborates with product teams to create intelligent solutions that streamline workflows and accelerate software development cycles. A thought leader engaging early adopters, Will bridges innovation and real-world needs.

Sreenivas Adiki

Sreenivas Adiki is a Sr. Customer Delivery Architect in ProServe, with a focus on data and analytics. He ensures success in designing, building, optimizing, and transforming in the area of Big Data/Analytics. Ensuring solutions are well-designed for successful deployment, Sreenivas participates in deep architectural discussions and design exercises. He has also published several AWS assets, such as whitepapers and proof-of-concept papers.

Kevin Bell

Kevin Bell is a Sr. Solutions Architect at AWS based in Seattle. He has been building things in the cloud for about 10 years. You can find him online as @bellkev on GitHub.

Corey Keane

Corey Keane is a Media and Entertainment (M&E) Sr. Account Manager at AWS. Corey has held a number of positions at Amazon and AWS throughout his 8 years with the company across M&E—including technical business development for strategic partnerships with international game developers, in addition to his current role managing AWS customers in the Media vertical. He leans on his pan-Amazon experience from working on other teams to identify new partnerships between our customers and other Amazon businesses to bring disruptive products to market.

Python 3.13 runtime now available in AWS Lambda

Post Syndicated from Julian Wood original https://aws.amazon.com/blogs/compute/python-3-13-runtime-now-available-in-aws-lambda/

This post is written by Julian Wood, Principal Developer Advocate, and Leandro Cavalcante Damascena, Senior Solutions Architect Engineer.

AWS Lambda now supports Python 3.13 as both a managed runtime and container base image. Python is a popular language for building serverless applications. The Python 3.13 release includes a number of changes to the language, the implementation, and the standard library. With this release, Python developers can now take advantage of these new features and enhancements when creating serverless applications on Lambda. Python 3.13 also includes experimental support for a number of features, which are not available in Lambda.

You can develop Lambda functions in Python 3.13 using the AWS Management ConsoleAWS Command Line Interface (AWS CLI)AWS SDK for Python (Boto3)AWS Serverless Application Model (AWS SAM)AWS Cloud Development Kit (AWS CDK), and other infrastructure as code tools.

The Python 3.13 runtime allows you to implement serverless best practices using Powertools for AWS Lambda (Python). This is a developer toolkit that includes observability, batch processing, AWS Systems Manager Parameter Store integration, idempotency, feature flags, Amazon CloudWatch Metrics, structured logging, and more.

Lambda@Edge allows you to use Python 3.13 to customize low-latency content delivered through Amazon CloudFront.

Lambda runtime changes

Amazon Linux 2023

As with the Python 3.12 runtime, the Python 3.13 runtime is based on the provided.al2023 runtime, which is based on the Amazon Linux 2023 minimal container image. The Amazon Linux 2023 minimal image uses microdnf as a package manager, symlinked as dnf. This replaces the yum package manager used in Python 3.11 and earlier AL2-based images. If you deploy your Lambda functions as container images, you must update your Dockerfiles to use dnf instead of yum when upgrading to the Python 3.13 base image from Python 3.11 or earlier base images.

Learn more about the provided.al2023 runtime in the blog post Introducing the Amazon Linux 2023 runtime for AWS Lambda and the Amazon Linux 2023 launch blog post.

New Python features

Data model improvements

There are improvements to the Python data model. __static_attributes__ stores the names of attributes accessed through self.X in any function in a class body.

Typing changes

With the implementation of PEP 702, you can now use the new warnings.deprecated() decorator to mark deprecations in the type system and at runtime.

Python 3.13 also adds PEP 696, which introduces default values for type parameters. This enhancement allows developers to specify default types for TypeVar, ParamSpec, and TypeVarTuple when omitting type arguments.

Standard library

The standard library includes improvements for a new PythonFinalizationError exception, raised when an operation is blocked during finalization.

The new functions base64.z85encode() and base64.z85decode() support encoding and decoding Z85 data.

The copy module now has a copy.replace() function, with support for many built-in types and any class defining the __replace__() method.

The os module has a suite of new functions for working with Linux’s timer notification file descriptors.

There is a change to the defined mutation semantics for locals().

Experimental features that are unavailable

Python 3.13 includes a number of experimental features which are not enabled for the Lambda managed runtime or base images. These features must be enabled when the Python runtime is compiled. Since the Lambda-provided Python 3.13 runtime is intended for production workloads, these features are not enabled in the Lambda build of Python 3.13 and cannot be enabled via an execution-time flag. To use these features in Lambda, you can deploy your own Python runtime using a custom runtime or container image with these features enabled.

Free-threaded CPython

You can not enable the experimental support for running Python in a free-threaded mode, with the global interpreter lock (GIL) disabled.

Just-in-time (JIT) compiler

You can also not enable the experimental JIT compiler within the Lambda managed runtime or base image.

Performance considerations

At launch, new Lambda runtimes receive less usage than existing established runtimes. This can result in longer cold start times due to reduced cache residency within internal Lambda sub-systems. Cold start times typically improve in the weeks following launch as usage increases. As a result, AWS recommends not drawing conclusions from side-by-side performance comparisons with other Lambda runtimes until the performance has stabilized. Since performance is highly dependent on workload, customers with performance-sensitive workloads should conduct their own testing, instead of relying on generic test benchmarks.

Using Python 3.13 in Lambda

AWS Management Console

To use the Python 3.13 runtime to develop your Lambda functions, specify a runtime parameter value Python 3.13 when creating or updating a function. The Python 3.13 version is available in the Runtime dropdown in the Create Function page:

Creating Python function in AWS Management Console

Creating Python function in AWS Management Console

To update an existing Lambda function to Python 3.13, navigate to the function in the Lambda console and choose Edit in the Runtime settings panel. The new version of Python is available in the Runtime dropdown.

Changing a function to Python 3.13

Changing a function to Python 3.13

You may need to check your code and dependencies for compatibility with Python 3.13, and update as necessary.

AWS Lambda container image

Change the Python base image version by modifying the FROM statement in your Dockerfile

FROM public.ecr.aws/lambda/python:3.13
# Copy function code
COPY lambda_handler.py ${LAMBDA_TASK_ROOT}

AWS Serverless Application Model (AWS SAM)

In AWS SAM set the Runtime attribute to python3.13 to use this version.

AWSTemplateFormatVersion: '2010-09-09'
Transform: AWS::Serverless-2016-10-31
Description: Simple Lambda Function
  MyFunction:
    Type: AWS::Serverless::Function
    Properties:
      Description: My Python Lambda Function
      CodeUri: my_function/
      Handler: lambda_function.lambda_handler
      Runtime: python3.13

AWS SAM supports generating this template with Python 3.13 for new serverless applications using the sam init command. Refer to the AWS SAM documentation.

AWS Cloud Development Kit (AWS CDK)

In AWS CDK, set the runtime attribute to Runtime.PYTHON_3_13 to use this version. In Python CDK:

from constructs import Construct 
from aws_cdk import ( App, Stack, aws_lambda as _lambda )

class SampleLambdaStack(Stack):
    def __init__(self, scope: Construct, id: str, **kwargs) -> None:
        super().__init__(scope, id, **kwargs)
        
        base_lambda = _lambda.Function(self, 'python313LambdaFunction', 
                                       handler='lambda_handler.handler', 
                                    runtime=_lambda.Runtime.PYTHON_3_13, 
                                 code=_lambda.Code.from_asset('lambda'))

In TypeScript CDK:

import * as cdk from 'aws-cdk-lib';
import * as lambda from 'aws-cdk-lib/aws-lambda'
import * as path from 'path';
import { Construct } from 'constructs';

export class SampleLambdaStack extends cdk.Stack {
  constructor(scope: Construct, id: string, props?: cdk.StackProps) {
    super(scope, id, props);

    // The code that defines your stack goes here

    // The python3.13 enabled Lambda Function
    const lambdaFunction = new lambda.Function(this, 'python313LambdaFunction', {
      runtime: lambda.Runtime.PYTHON_3_13,
      memorySize: 512,
      code: lambda.Code.fromAsset(path.join(__dirname, '/../lambda')),
      handler: 'lambda_handler.handler'
    })
  }
}

Conclusion

Lambda now supports Python 3.13 as a managed language runtime. This release uses the Amazon Linux 2023 OS and includes Python 3.13 language additions including data model improvements, typing changes, and updates to the standard library. This release does not support the experimental option to disable the global interpreter lock or the experimental JIT compiler.

You can build and deploy functions using Python 3.13 using the AWS Management Console, AWS CLI, AWS SDK, AWS SAM, AWS CDK, or your choice of infrastructure as code tool. You can also use the Python 3.13 container base image if you prefer to build and deploy your functions using container images.

Python 3.13 runtime support helps developers to build more efficient, powerful, and scalable serverless applications. Try the Python 3.13 runtime in Lambda today and experience the benefits of this updated language version.

For more serverless learning resources, visit Serverless Land.

Using the zabbix_utils Library for Tool Development

Post Syndicated from Aleksandr Iantsen original https://blog.zabbix.com/python-zabbix-utils-alert-tracker-tool/29010/

In this article, we will explore a practical example of using the zabbix_utils library to solve a non-trivial task – obtaining a list of alert recipients for triggers associated with a specific Zabbix host. You will learn how to easily automate the process of collecting this information, and see examples of real code that can be adapted to your needs.

Over the last year, the zabbix_utils library has become one of the most popular tools for working with the Zabbix API. It is a convenient tool that simplifies interacting with the Zabbix server, proxy, or agent, especially for those who automate monitoring and management tasks.

Due to its ease of use and extensive functionality, zabbix_utils has found a following among system administrators, monitoring, and DevOps engineers. According to data from PyPI, the library has already been downloaded over 140,000 times since its release, confirming its demand within the community. It’s all thanks to you and your attention to zabbix_utils!

Task Description

Administrators often need to check which Zabbix users receive alerts for specific triggers in the Zabbix monitoring system. This can be useful for auditing, configuring new notifications, or simply for a quick diagnosis of issues. The task becomes especially relevant when you have plenty of hosts containing numerous triggers, and manually checking the recipients for each trigger through the Zabbix interface becomes very time-consuming. 

In such cases, it is advisable to use a custom solution based on the Zabbix API. You can directly access all the required data using the API, and then use additional logic to determine the final alert recipients. The zabbix_utils library makes working with the Zabbix API more convenient and allows you to automate this process. In this project, we use the zabbix_utils library to write a Python script that collects a list of alert recipients for the triggers of the selected Zabbix host. This will allow you to obtain the necessary information faster and with minimal effort.

Environment Setup and Installation

To get started with zabbix_utils, you need to install the library and configure the connection to the Zabbix API. This article provides more details and examples on getting started with the library. However, it would be better if I describe the basic steps to prepare the environment here. 

The library supports several installation methods described in the official README, making it convenient for use in different environments.

1. Installation via pip

The simplest and most common installation method is using the pip package manager. To do this, execute the command:

~$ pip install zabbix_utils

To install all necessary dependencies for asynchronous work, you can use the command:

~$ pip install zabbix_utils[async]

This method is suitable for most users, as pip automatically installs all required dependencies.

2. Installation from Zabbix Repository

Since writing the previous articles, we have added one more installation method – from the official Zabbix repository. First and foremost, you need to add the repository to your system if it has not been installed yet. Official Zabbix packages for Red Hat Enterprise Linux and Debian-based distributions are available on the Zabbix website.

For Red Hat Enterprise Linux and derivatives:

~# dnf install python3-zabbix-utils

For Debian / Ubuntu and derivatives:

~# apt install python3-zabbix-utils

3. Installation from Source Code

If you require the latest version of the library that has not yet been published on PyPI, or you want to customize the code, you can install the library directly from GitHub:

1. Clone the repository from GitHub:

~$ git clone https://github.com/zabbix/python-zabbix-utils

2. Navigate to the project folder:

~$ cd python-zabbix-utils/

3. Install the library by executing the command:

~$ python3 setup.py install

4. Testing the Connection to Zabbix API

After installing zabbix_utils, it is a good idea to check the connection to your Zabbix server via the API. To do this, use the URL to the Zabbix server, the token, or the username and password of the user who has permission to access the Zabbix API.

Example code for checking the connection:

from zabbix_utils import ZabbixAPI ZABBIX_AUTH = {     "url": "your_zabbix_server",     "user": "your_username",     "password": "your_password" } api = ZabbixAPI(**ZABBIX_AUTH) hosts = api.host.get(     output=['hostid', 'name'] ) print(hosts) api.logout()

Main Steps of the Task Solution

Now that the environment is set up, let’s look at the main steps for solving the task of retrieving the list of alert recipients for triggers associated with a specific Zabbix host in Zabbix.

In zabbix_utils, asynchronous API interaction support is built in through the AsyncZabbixAPI class. This allows multiple requests to be sent simultaneously and their results to be handled as they become ready, significantly reducing latencies when making multiple API calls. Therefore, we will use the AsyncZabbixAPI class and the asynchronous approach in this project.

Below are the main steps for solving the task, and code examples for each step. Please note that the code in this project is for demonstration purposes, may not be optimal, or could contain errors. Use it as an example or a base for your project, but not as a complete tool.

Step 1. Obtain Host ID

The first step is to identify the host for which we will retrieve information about triggers and alerts. We need to find the hostid using its name/host to do this. The Zabbix API provides a method to obtain this information, and using zabbix_utils makes this process much simpler.

Example of obtaining the host ID by its name:

host = api.host.get(     output=["hostid"],     filter={"name": "your_host_name"} )

This method returns a unique identifier for the host, which can be used further. However, for our test project, we will use a manually specified host identifier.

Step 2. Retrieve Host Triggers

With the hostid in hand, the next step is to retrieve all triggers associated with this host. Triggers contain the conditions that trigger the alerts. We need to collect information about all triggers so that we can then use it to select actions that match all the conditions.

Example of retrieving node triggers:

triggers = api.trigger.get(     hostids=[hostid],     selectTags="extend",     selectHosts=["hostid"],     selectHostGroups=["groupid"],     selectDiscoveryRule=["templateid"],     output="extend", )

This request returns complete information about the triggers for the host. We get not only the triggers but also their tags, associated host and host groups, and discovery rule information. All this information will be necessary to check the conditions of the actions.

Step 3. Initialize Trigger Metadata

At this stage, objects for each trigger are created to store their metadata. This is done using the Trigger class, which includes information about the trigger such as its name, ID, associated host groups, hosts, tags, templates, and operations.

Here’s the code defining the Trigger class:

class Trigger:     def __init__(self, trigger):         self.name = trigger["description"]         self.triggerid = trigger["triggerid"]         self.hostgroups = [g["groupid"] for g in trigger["hostgroups"]]         self.hosts = [h["hostid"] for h in trigger["hosts"]]         self.tags = {t["tag"]: t["value"] for t in trigger["tags"]}         self.tmpl_triggerid = self.triggerid         self.lld_rule = trigger["discoveryRule"] or {}         if trigger["templateid"] != "0":             self.tmpl_triggerid = trigger["templateid"]         self.templates = []         self.messages = []         self._conditions = {             "0": self.hostgroups,             "1": self.hosts,             "2": [self.triggerid],             "3": trigger["event_name"] or trigger["description"],             "4": trigger["priority"],             "13": self.templates,             "25": self.tags.keys(),             "26": self.tags,         }     def eval_condition(self, operator, value, trigger_data):         # equals or does not equal         if operator in ["0", "1"]:             equals = operator == "0"             if isinstance(value, dict) and isinstance(                 trigger_data, dict):                 if value["tag"] in trigger_data:                     if value["value"] == trigger_data[                         value["tag"]]:                         return equals             elif value in trigger_data and isinstance(                 trigger_data, list):                 return equals             elif value == trigger_data:                 return equals             return not equals         # contains or does not contain         if operator in ["2", "3"]:             contains = operator == "2"             if isinstance(value, dict) and isinstance(                 trigger_data, dict):                 if value["tag"] in trigger_data:                     if value["value"] in trigger_data[                         value["tag"]]:                         return contains             elif value in trigger_data:                 return contains             return not contains           # is greater/less than or equals         if operator in ["5", "6"]:             greater = operator != "5"             try:                 if int(value) < int(trigger_data):                     return not greater                 if int(value) == int(trigger_data):                     return True                 if int(value) > int(trigger_data):                     return greater             except:                 raise ValueError(                     "Values must be numbers to compare them"                 )       def select_templates(self, templates):         for template in templates:             if self.tmpl_triggerid in [                 t["triggerid"] for t in template["triggers"]]:                 self.templates.append(template["templateid"])             if self.lld_rule.get("templateid") in [                 d["itemid"] for d in template["discoveries"]             ]:                 self.templates.append(template["templateid"])     def select_actions(self, actions):         selected_actions = []         for action in actions:             conditions = []             if "filter" in action:                 conditions = action["filter"]["conditions"]                 eval_formula = action["filter"]["eval_formula"]             # Add actions without conditions directly             if not conditions:                 selected_actions.append(action)                 continue             condition_check = {}             for condition in conditions:                 if (                     condition["conditiontype"] != "6"                     and condition["conditiontype"] != "16"                 ):                     if (                         condition["conditiontype"] == "26"                         and isinstance(condition["value"], str)                     ):                         condition["value"] = {                             "tag": condition["value2"],                             "value": condition["value"],                         }                     if condition["conditiontype"] in self._conditions:                         condition_check[                             condition["formulaid"]                         ] = self.eval_condition(                             condition["operator"],                             condition["value"],                             self._conditions[                                 condition["conditiontype"]                             ],                         )                 else:                     condition_check[                         condition["formulaid"]                     ] = True             for formulaid, bool_result in condition_check.items():                 eval_formula = eval_formula.replace(                     formulaid, str(bool_result))
            # Evaluate the final condition formula             if eval(eval_formula):                 selected_actions.append(action)         return selected_actions       def select_operations(self, actions, mediatypes):         messages_metadata = []         for action in self.select_actions(actions):             messages_metadata += self.check_operations(                 "operations", action, mediatypes             )             messages_metadata += self.check_operations(                 "update_operations", action, mediatypes             )             messages_metadata += self.check_operations(                 "recovery_operations", action, mediatypes             )         return messages_metadata
    def check_operations(self, optype, action, mediatypes):         messages_metadata = []         optype_mapping = {             "operations": "0",  # Problem event             "recovery_operations": "1",  # Recovery event             "update_operations": "2",  # Update event         }         operations = copy.deepcopy(action[optype])         # Processing "notify all involved" scenarios         for idx, _ in enumerate(operations):             if operations[idx]["operationtype"] not in ["11", "12"]:                 continue             # Copy operation as a template for reuse             op_template = copy.deepcopy(operations[idx])             del operations[idx]             # Checking for message sending operations             for key in [                 k for k in ["operations", "update_operations"] if k != optype             ]:                 if not action[key]:                     continue                 # Checking for message sending type operations                 for op in [                     o for o in action[key] if o["operationtype"] == "0"                 ]:                     # Copy template for the current operation                     operation = copy.deepcopy(op_template)                     operation.update(                         {                             "operationtype": "0",                             "opmessage_usr": op["opmessage_usr"],                             "opmessage_grp": op["opmessage_grp"],                         }                     )                     operation["opmessage"]["mediatypeid"] = op[                         "opmessage"                     ]["mediatypeid"]                     operations.append(operation)         for operation in operations:             if operation["operationtype"] != "0":                 continue             # Processing "all mediatypes" scenario             if operation["opmessage"]["mediatypeid"] == "0":                 for mediatype in mediatypes:                     operation["opmessage"]["mediatypeid"] = mediatype[                         "mediatypeid"                     ]                     messages_metadata.append(                         self.create_messages(                             optype_mapping[optype], action, operation, [                                 mediatype                             ]                         )                     )             else:                 messages_metadata.append(                     self.create_messages(                         optype_mapping[optype],                         action,                         operation,                         mediatypes                     )                 )         return messages_metadata       def create_messages(self, optype, action, operation, mediatypes):         message = Message(optype, action, operation)         message.select_mediatypes(mediatypes)         self.messages.append(message)         return message

The code for creating Trigger class objects for each of the retrieved triggers:

for trigger in triggers:     triggers_metadata[trigger["triggerid"]] = Trigger(trigger)

This loop iterates through all triggers and saves them in a dictionary called triggers_metadata, where the key is the triggerid and the value is the trigger object.

Step 4. Retrieve Template Information

The next step is to obtain data about the templates associated with all the triggers:

templates = api.template.get(     triggerids=list(set([t.tmpl_triggerid for t in triggers_metadata.values()])),     selectTriggers=["triggerid"],     selectDiscoveries=["itemid"],     output=["templateid"], )

This request returns information about all templates linked to the host’s triggers being examined. Executing a single query for all triggers is a more optimal solution than making individual requests for each trigger. This information will be needed for evaluating the “Template” condition in actions.

Step 5. Get Actions and Media Types

Next, we obtain the list of actions and media types configured in the system:

actions = api.action.get(     selectFilter="extend",     selectOperations="extend",     selectRecoveryOperations="extend",     selectUpdateOperations="extend",     filter={"eventsource": 0, "status": 0},     output=["actionid", "esc_period", "eval_formula", "name"], )
mediatypes = api.mediatype.get(     selectUsers="extend",     selectActions="extend",     selectMessageTemplates="extend",     filter={"status": 0},     output=["mediatypeid", "name"], )

Here we retrieve actions that define how and to whom alerts are sent, and mediatypes through which users can receive notifications (for example, email or SMS).

Step 6. Match Triggers with Templates and Actions

At this stage, each trigger is associated with the corresponding templates and actions:

for trigger in triggers_metadata.values():     trigger.select_templates(templates)     messages += trigger.select_operations(actions, mediatypes)

Here, for each trigger, we update information about its templates and configured actions for sending notifications. The list of associated actions is determined by checking the conditions specified in them against the accumulated data for each trigger.

For each operation of the corresponding trigger action, a Message class object is created:

class Message:     def __init__(self, optype, action, operation):         self.optype = optype         self.mediatypename = ""         self.actionid = action["actionid"]         self.actionname = action["name"]         self.operationid = operation["operationid"]         self.mediatypeid = operation["opmessage"]["mediatypeid"]         self.subject = operation["opmessage"]["subject"]         self.message = operation["opmessage"]["message"]         self.default_msg = operation["opmessage"]["default_msg"]         self.users = [u["userid"] for u in operation["opmessage_usr"]]         self.groups = [g["usrgrpid"] for g in operation["opmessage_grp"]]         self.recipients = []         # Escalation period set to action's period if not specified         self.esc_period = operation.get("esc_period", "0")         if self.esc_period == "0":             self.esc_period = action["esc_period"]         # Use action's escalation period if unset         self.esc_step_from = self.multiply_time(             self.esc_period, int(operation.get("esc_step_from", "1")) - 1         )         if operation.get("esc_step_to", "0") != "0":             self.repeat_count = str(                 int(operation["esc_step_to"]) - int(operation["esc_step_from"]) + 1             )         # If not a problem event, set repeat count to 1         elif self.optype != "0":             self.repeat_count = "1"         # Infinite repeat count if esc_step_to is 0         else:             self.repeat_count = “&infin;”       def multiply_time(self, time_str, multiplier):         # Multiply numbers within the time string         result = re.sub(             r"(\d+)",             lambda m: str(int(m.group(1)) * multiplier),             time_str         )         if result[0] == "0":             return "0"         return result       def select_mediatypes(self, mediatypes):         for mediatype in mediatypes:             if mediatype["mediatypeid"] == self.mediatypeid:                 self.mediatypename = mediatype["name"]                 # Select message templates related to operation type                 msg_template = [                     m                     for m in mediatype["message_templates"]                     if (                         m["recovery"] == self.optype                         and m["eventsource"] == "0"                     )                 ]                 # Use default message if applicable                 if msg_template and self.default_msg == "1":                     self.subject = msg_template[0]["subject"]                     self.message = msg_template[0]["message"]       def select_recipients(self, user_groups, recipients):         for groupid in self.groups:             if groupid in user_groups:                 self.users += user_groups[groupid]         for userid in self.users:             if userid in recipients:                 recipient = copy.deepcopy(recipients[userid])                 if self.mediatypeid in recipient.sendto:                     recipient.mediatype = True                 self.recipients.append(recipient)

Each such object represents a separate message sent to users (recipients) and will contain all message information – its subject, text, recipients, and escalation parameters.

Step 7. Collect User and Group Identifiers

After matching the triggers with actions, the process of collecting unique identifiers for users and groups starts:

userids = set() groupids = set() for message in messages:     userids.update(message.users)     groupids.update(message.groups)

This code snippet collects the IDs of all users and groups involved in the operations for each trigger. This is necessary to perform only one request to the Zabbix API for all involved users and their groups, rather than making separate requests for each trigger.

Step 8. Obtain User and Group Information

The next step is to collect detailed information about users and user groups:

usergroups = {     group["usrgrpid"]: group     for group in api.usergroup.get(         selectUsers=["userid"],         selectHostGroupRights="extend",         output=["usrgrpid", "role"],     ) }   users = {     user["userid"]: user     for user in api.user.get(         selectUsrgrps=["usrgrpid"],         selectMedias=["mediatypeid", "active", "sendto"],         selectRole=["roleid", "type"],         filter={"status": 0},         output=["userid", "username", "name", "surname"],     ) }

Here we gather data about users, including their role and media types through which they receive notifications, as well as data about user groups, including access rights to host groups and the list of users in each group. All this information will be needed to check access to the host with the triggers we are working with.

Step 9. Match Users and Groups with Triggers

After obtaining user information, we match users and groups with their respective rights to receive notifications. Here we also link users with groups, updating the information regarding rights and groups for each user.

for userid in userids:     if userid in users:         user = users[userid]         recipients[userid] = Recipient(user)         for group in user["usrgrps"]:             if group["usrgrpid"] in usergroups:                 recipients[userid].permissions.update([                     h["id"]                     for h in usergroups[group["usrgrpid"]]["hostgroup_rights"]                     if int(h["permission"]) > 1                 ])   for groupid in groupids:     if groupid in usergroups:         group = usergroups[groupid]         user_groups[group["usrgrpid"]] = []         for user in group["users"]:             user_groups[group["usrgrpid"]].append(user["userid"])             if user["userid"] in recipients:                 recipients[user["userid"]].groups.update(group["usrgrpid"])             elif user["userid"] in users:                 recipients[user["userid"]] = Recipient(users[user["userid"]])             recipients[user["userid"]].permissions.update([                 h["id"]                 for h in group["hostgroup_rights"]                 if int(h["permission"]) > 1             ])

This code fragment connects each user with their groups and vice versa, creating a complete list of users with their access rights to the host, and thus their eligibility to receive notifications about events for this host.

For each recipient, a Recipient class object is created containing data about the recipient, such as the notification address, access rights to hosts, configured mediatypes, etc.

Here’s the code that describes the Recipient class:

class Recipient:     def __init__(self, user):         self.userid = user["userid"]         self.username = user["username"]         self.fullname = "{name} {surname}".format(**user).strip()         self.type = user["role"]["type"]         self.groups = set([g["usrgrpid"] for g in user["usrgrps"]])         self.has_right = False         self.permissions = set()         self.sendto = {             m["mediatypeid"]: m["sendto"] for m in user["medias"] if m["active"] == "0"         }         # Check if the user is a super admin (type 3)         if self.type == "3":             self.has_right = True

Step 10. Match Messages with Recipients

Finally, we match recipients with specific messages from Step 6:

for message in messages:     message.select_recipients(user_groups, recipients)

This step completes the main process – each message is assigned to the relevant recipients.

Step 11. Check Recipient Access Rights and Output the Result

Before the actual output of the result with the list of recipients, we can perform a check of the recipients’ message rights and filter only those who have the corresponding rights to receive notifications for the events related to the trigger, or those who have all configured media types specified and active. After these actions, the information can be output in any convenient way – whether it be exporting to a file or displaying it on the screen:

for trigger in triggers_metadata.values():     for message in trigger.messages:         for recipient in message.recipients:             recipient.show = True             if not recipient.has_right:                 recipient.has_right = (len([gid                     for gid in trigger.hostgroups                     if gid in recipient.permissions                 ]) > 0)             if not recipient.has_right and not show_unavail:                 recipient.show = False

Example Implementation

All the examples and code snippets described above have been compiled to create a solution demonstrating the algorithm for obtaining notification recipients for triggers associated with the selected host. We have implemented this algorithm as a simple web interface to make the result more illustrative and convenient for familiarization.

This interface allows users to enter the host’s ID. The script then processes the data and provides a list of notification recipients associated with the triggers on that host. The web interface uses asynchronous requests to the Zabbix API and the zabbix_utils library to ensure fast data processing and ease of use with many triggers and users.

This lets you familiarize yourself with the theoretical steps and code examples and also try to put this solution into action.

Please note once again that the code in this project is for demonstration purposes, may not be optimal, or could contain errors. Use it as an example or a base for your project, but not as a complete tool.

The web interface’s complete source code and installation instructions can be found on GitHub.

Conclusion

In this article, we explored a practical example of using the zabbix_utils library to solve the task of obtaining alert recipients for triggers associated with a selected Zabbix host using the Zabbix API. We detailed the key steps, from setting up the environment and initializing trigger metadata to working with notification recipients and optimizing performance with asynchronous requests.

Using zabbix_utils allowed us to optimize and accelerate interaction with the Zabbix API, expanding the capabilities of the  Zabbix web interface and increasing efficiency when working with large volumes of data. Thanks to support for asynchronous processing and selective API requests, it is possible to significantly reduce the load on the server and improve system performance when working with Zabbix, which is especially important in large infrastructures.

We hope this example will assist you in implementing your own solutions based on the Zabbix API and zabbix_utils, and demonstrate the possibilities for optimizing your interaction with the Zabbix API.

The post Using the zabbix_utils Library for Tool Development appeared first on Zabbix Blog.

Modernize your legacy databases with AWS data lakes, Part 2: Build a data lake using AWS DMS data on Apache Iceberg

Post Syndicated from Shaheer Mansoor original https://aws.amazon.com/blogs/big-data/modernize-your-legacy-databases-with-aws-data-lakes-part-2-build-a-data-lake-using-aws-dms-data-on-apache-iceberg/

This is part two of a three-part series where we show how to build a data lake on AWS using a modern data architecture. This post shows how to load data from a legacy database (SQL Server) into a transactional data lake (Apache Iceberg) using AWS Glue. We show how to build data pipelines using AWS Glue jobs, optimize them for both cost and performance, and implement schema evolution to automate manual tasks. To review the first part of the series, where we load SQL Server data into Amazon Simple Storage Service (Amazon S3) using AWS Database Migration Service (AWS DMS), see Modernize your legacy databases with AWS data lakes, Part 1: Migrate SQL Server using AWS DMS.

Solution overview

In this post, we go over the process of building a data lake, providing the rationale behind the different decisions, and share best practices when building such a solution.

The following diagram illustrates the different layers of the data lake.

Overall Architecture

To load data into the data lake, AWS Step Functions can define a workflow, Amazon Simple Queue Service (Amazon SQS) can track the order of incoming files, and AWS Glue jobs and the Data Catalog can be used create the data lake silver layer. AWS DMS produces files and writes these files to the bronze bucket (as we explained in Part 1).

We can turn on Amazon S3 notifications and push the new arriving file names to an SQS first-in-first-out (FIFO) queue. A Step Functions state machine can consume messages from this queue to process the files in the order they arrive.

For processing the files, we need to create two types of AWS Glue jobs:

  • Full load – This job loads the entire table data dump into an Iceberg table. Data types from the source are mapped to an Iceberg data type. After the data is loaded, the job updates the Data Catalog with the table schemas.
  • CDC – This job loads the change data capture (CDC) files into the respective Iceberg tables. The AWS Glue job implements the schema evolution feature of Iceberg to handle schema changes such as addition or deletion of columns.

As in Part 1, the AWS DMS jobs will place the full load and CDC data from the source database (SQL Server) in the raw S3 bucket. Now we process this data using AWS Glue and save it to the silver bucket in Iceberg format. AWS Glue has a plugin for Iceberg; for details, see Using the Iceberg framework in AWS Glue.

Along with moving data from the bronze to the silver bucket, we also create and update the Data Catalog for further processing the data for the gold bucket.

The following diagram illustrates how the full load and CDC jobs are defined inside the Step Functions workflow.

Step Functions for loading data into the lake

In this post, we discuss the AWS Glue jobs for defining the workflow. We recommend using AWS Step Functions Workflow Studio, and setting up Amazon S3 event notifications and an SNS FIFO queue to receive the filename as messages.

Prerequisites

To follow the solution, you need the following prerequisites set up as well as certain access rights and AWS Identity and Access Management (IAM) privileges:

  • An IAM role to run Glue jobs
  • IAM privileges to create AWS DMS resources (this role was created in Part 1 of this series; you can use the same role here)
  • The AWS DMS job from Part 1 working and producing files for the source database on Amazon S3.

Create an AWS Glue connection for the source database

We need to create a connection between AWS Glue and the source SQL Server database so the AWS Glue job can query the source for the latest schema while loading the data files. To create the connection, follow these steps:

  1. On the AWS Glue console, choose Connections in the navigation pane.
  2. Choose Create custom connector.
  3. Give the connection a name and choose JDBC as the connection type.
  4. In the JDBC URL section, enter the following string and replace the name of your source database endpoint and database that was set up in Part 1: jdbc:sqlserver://{Your RDS End Point Name}:1433/{Your Database Name}.
  5. Select Require SSL connection, then choose Create connector.

Clue Connections

Create and configure the full load AWS Glue job

Complete the following steps to create the full load job:

  1. On the AWS Glue console, choose ETL jobs in the navigation pane.
  2. Choose Script editor and select Spark.
  3. Choose Start fresh and select Create script.
  4. Enter a name for the full load job and choose the IAM role (mentioned in the prerequisites) for running the job.
  5. Finish creating the job.
  6. On the Job details tab, expand Advanced properties.
  7. In the Connections section, add the connection you created.
  8. Under Job parameters, pass the following arguments to the job:
    1. target_s3_bucket – The silver S3 bucket name.
    2. source_s3_bucket – The raw S3 bucket name.
    3. secret_id – The ID of the AWS Secrets Manager secret for the source database credentials.
    4. dbname – The source database name.
    5. datalake-formats – This sets the data format to iceberg.

Glue Job Parameters

The full load AWS Glue job starts after the AWS DMS task reaches 100%. The job loops over the files located in the raw S3 bucket and processes them one at time. For each file, the job infers the table name from the file name and gets the source table schema, including column names and primary keys.

If the table has one or more primary keys, the job creates an equivalent Iceberg table. If the job has no primary key, the file is not processed. In our use case, all the tables have primary keys, so we enforce this check. Depending on your data, you might need to handle this scenario differently.

You can use the following code to process the full load files. To start the job, choose Run.

import sys, boto3, json
import boto3
import json
from awsglue.utils import getResolvedOptions
from pyspark.context import SparkContext
from awsglue.context import GlueContext
from awsglue.job import Job
from pyspark.sql import SparkSession

#Get the arguments passed to the script
args = getResolvedOptions(sys.argv, ['JOB_NAME',
                           'target_s3_bucket',
                           'secret_id',
                           'source_s3_bucket'])
dbname = "AdventureWorks"
schema = "HumanResources"

#Initialize parameters
target_s3_bucket = args['target_s3_bucket']
source_s3_bucket = args['source_s3_bucket']
secret_id = args['secret_id']
unprocessed_tables = []
drop_column_list = ['db', 'table_name', 'schema_name', 'Op', 'last_update_time']  # DMS added columns

#Helper Function: Get Credentials from Secrets Manager
def get_db_credentials(secret_id):
    secretsmanager = boto3.client('secretsmanager')
    response = secretsmanager.get_secret_value(SecretId=secret_id)
    secrets = json.loads(response['SecretString'])
    return secrets['host'], int(secrets['port']), secrets['username'], secrets['password']

#Helper Function: Load Iceberg table with Primary key(s)
def load_table(full_load_data_df, dbname, table_name):

    try:
        full_load_data_df = full_load_data_df.drop(*drop_column_list)
        full_load_data_df.createOrReplaceTempView('full_data')

        query = """
        CREATE TABLE IF NOT EXISTS glue_catalog.{0}.{1}
        USING iceberg
        LOCATION "s3://{2}/{0}/{1}"
        AS SELECT * FROM full_data
        """.format(dbname, table_name, target_s3_bucket)
        spark.sql(query)
        
        #Update Table property to accept Schema Changes
        spark.sql("""ALTER TABLE glue_catalog.{0}.{1} SET TBLPROPERTIES (
                      'write.spark.accept-any-schema'='true'
                    )""".format(dbname, table_name))
        
    except Exception as ex:
        print(ex)
        failed_table = {"table_name": table_name, "Reason": ex}
        unprocessed_tables.append(failed_table)
        
def get_table_key(host, port, username, password, dbname):
    
    jdbc_url = "jdbc:sqlserver://{0}:{1};databaseName={2}".format(host, port, dbname)
    
    connectionProperties = {
      "user" : username,
      "password" : password
    }
    
    spark.read.jdbc(url=jdbc_url, table='INFORMATION_SCHEMA.TABLE_CONSTRAINTS', properties=connectionProperties).createOrReplaceTempView("TABLE_CONSTRAINTS")
    spark.read.jdbc(url=jdbc_url, table='INFORMATION_SCHEMA.CONSTRAINT_COLUMN_USAGE', properties=connectionProperties).createOrReplaceTempView("CONSTRAINT_COLUMN_USAGE")
    df_table_pkeys = spark.sql("select c.TABLE_NAME, C.COLUMN_NAME as primary_key FROM TABLE_CONSTRAINTS T JOIN CONSTRAINT_COLUMN_USAGE C ON C.CONSTRAINT_NAME=T.CONSTRAINT_NAME WHERE T.CONSTRAINT_TYPE='PRIMARY KEY'")
    return df_table_pkeys


#Setup Spark configuration for reading and writing Iceberg tables
spark = (
    SparkSession.builder
    .config("spark.sql.extensions", "org.apache.iceberg.spark.extensions.IcebergSparkSessionExtensions")
    .config("spark.sql.catalog.glue_catalog", "org.apache.iceberg.spark.SparkCatalog")
    .config("spark.sql.catalog.glue_catalog.warehouse", "s3://{0}".format(dbname))
    .config("spark.sql.catalog.glue_catalog.catalog-impl", "org.apache.iceberg.aws.glue.GlueCatalog")
    .config("spark.sql.catalog.glue_catalog.io-impl", "org.apache.iceberg.aws.s3.S3FileIO")
    .getOrCreate()
)


#Initialize MSSQL credentials
host, port, username, password = get_db_credentials(secret_id)

#Initialize primary keys for all tables
df_table_pkeys = get_table_key(host, port, username, password, dbname)

#Read Full load csv files from s3
s3 = boto3.client('s3')
full_load_tables = s3.list_objects_v2(Bucket=source_s3_bucket, Prefix="raw/{0}/{1}".format(args['dbname'], args['schema']))

#Loop over files
for item in full_load_tables['Contents']:
    pkey_list = []
    table_name = item["Key"].split("/")[3].lower()
    print("Table name {0}".format(table_name))
    current_table_df = df_table_pkeys.where(df_table_pkeys.TABLE_NAME == table_name)

    # Only Process tables with at least 1 Primary key
    if not current_table_df.isEmpty():
        for i in current_table_df.collect():
            pkey_list.append(i["primary_key"])
    else:
        failed_table = {"table_name": table_name, "Reason": "No primary key"}
        unprocessed_tables.append(failed_table)
        # ToDo Handle these cases

    full_data_path = "s3://{0}/{1}".format(source_s3_bucket, item['Key'])
    full_load_data_df = (spark
                        .read
                        .option("header", True)
                        .option("inferSchema", True)
                        .option("recursiveFileLookup", "true")
                        .csv(full_data_path)
                        )

    primary_key = ",".join(pkey_list)

    if table_name not in unprocessed_tables:
        load_table(full_load_data_df, dbname, table_name)

When the job is complete, it creates the database and tables in the Data Catalog, as shown in the following screenshot.

Data lake silver layer data

Create and configure the CDC AWS Glue job

The CDC AWS Glue job is created similar to the full load job. As with the full load AWS Glue job, you need to use the source database connection and pass the job parameters with one additional parameter, cdc_file, which contains the location of the CDC file to be processed. Because a CDC file can contain data for multiple tables, the job loops over the tables in a file and loads the table metadata from the source table ( RDS column names).

If the CDC operation is DELETE, the job deletes the records from the Iceberg table. If the CDC operation is INSERT or UPDATE, the job merges the data into the Iceberg table.

You can use the following code to process the CDC files. To start the job, choose Run

import sys
import boto3
import json
from awsglue.utils import getResolvedOptions
from pyspark.context import SparkContext
from awsglue.context import GlueContext
from awsglue.job import Job
from pyspark.sql import SparkSession

# Get the arguments passed to the script
args = getResolvedOptions(sys.argv, ['JOB_NAME',
                           'target_s3_bucket',
                           'secret_id',
                           'source_s3_bucket',
                           'cdc_file'])
dbname = "AdventureWorks"
schema = "HumanResources"
target_s3_bucket = args['target_s3_bucket']
source_s3_bucket = args['source_s3_bucket']
secret_id = args['secret_id']
cdc_file = args['cdc_file']
unprocessed_tables = []
drop_column_list = ['db', 'table_name', 'schema_name', 'Op', 'last_update_time']  # DMS added columns
source_s3_cdc_file_key = "raw/AdventureWorks/cdc/" + cdc_file


# Helper Function: Get Credentials from Secrets Manager
def get_db_credentials(secret_id):
    secretsmanager = boto3.client('secretsmanager')
    response = secretsmanager.get_secret_value(SecretId=secret_id)
    secrets = json.loads(response['SecretString'])
    return secrets['host'], int(secrets['port']), secrets['username'], secrets['password']

# Helper Function: Column names from RDS
def get_table_colums(table, host, port, username, password, dbname):

    jdbc_url = "jdbc:sqlserver://{0}:{1};databaseName={2}".format(host, port, dbname)
    
    connectionProperties = {
      "user" : username,
      "password" : password
    }
    
    spark.read.jdbc(url=jdbc_url, table='INFORMATION_SCHEMA.COLUMNS', properties= connectionProperties).createOrReplaceTempView("TABLE_COLUMNS")
    columns = list((row.COLUMN_NAME) for (index, row) in spark.sql("select TABLE_NAME, TABLE_CATALOG, COLUMN_NAME from TABLE_COLUMNS where TABLE_NAME = '{0}' and TABLE_CATALOG = '{1}'".format(table, dbname)).select("COLUMN_NAME").toPandas().iterrows())
    return columns

# Helper Function: Get Colum names and datatypes from RDS
def get_table_colum_datatypes(table, host, port, username, password, dbname):

    jdbc_url = "jdbc:sqlserver://{0}:{1};databaseName={2}".format(host, port, dbname)
    
    connectionProperties = {
      "user" : username,
      "password" : password
    }
    
    spark.read.jdbc(url=jdbc_url, table='INFORMATION_SCHEMA.COLUMNS', properties= connectionProperties).createOrReplaceTempView("TABLE_COLUMNS")
    return spark.sql("select TABLE_NAME, COLUMN_NAME, DATA_TYPE from TABLE_COLUMNS WHERE TABLE_NAME ='{0}'".format(table))

# Helper Function: Setup the primary key condition
def get_iceberg_table_condition(database, tablename):
    
    jdbc_url = "jdbc:sqlserver://{0}:{1};databaseName={2}".format(host, port, database)
    
    connectionProperties = {
      "user" : username,
      "password" : password
    }
    
    spark.read.jdbc(url=jdbc_url, table='INFORMATION_SCHEMA.TABLE_CONSTRAINTS', properties=connectionProperties).createOrReplaceTempView("TABLE_CONSTRAINTS")
    spark.read.jdbc(url=jdbc_url, table='INFORMATION_SCHEMA.CONSTRAINT_COLUMN_USAGE', properties=connectionProperties).createOrReplaceTempView("CONSTRAINT_COLUMN_USAGE")
    
    condition = ''
    
    for key in spark.sql("select C.COLUMN_NAME FROM TABLE_CONSTRAINTS T JOIN CONSTRAINT_COLUMN_USAGE C ON C.CONSTRAINT_NAME=T.CONSTRAINT_NAME WHERE T.CONSTRAINT_TYPE='PRIMARY KEY' AND c.TABLE_NAME = '{0}'".format(table)).collect():
        condition += "target.{0} = source.{0} and".format(key.COLUMN_NAME)
    return condition[:-4]

    
# Read incoming data from Amazon S3
def read_cdc_S3(source_s3_bucket, source_s3_cdc_file_key):
    
    inputDf = (spark
                    .read
                    .option("header", False)
                    .option("inferSchema", True)
                    .option("recursiveFileLookup", "true")
                    .csv("s3://" + source_s3_bucket + "/" + source_s3_cdc_file_key)
                    )
    return inputDf

# Setup Spark configuration for reading and writing Iceberg tables
spark = (
    SparkSession.builder
    .config("spark.sql.extensions", "org.apache.iceberg.spark.extensions.IcebergSparkSessionExtensions")
    .config("spark.sql.catalog.glue_catalog", "org.apache.iceberg.spark.SparkCatalog")
    .config("spark.sql.catalog.glue_catalog.warehouse", "s3://{0}".format(target_s3_bucket))
    .config("spark.sql.catalog.glue_catalog.catalog-impl", "org.apache.iceberg.aws.glue.GlueCatalog")
    .config("spark.sql.catalog.glue_catalog.io-impl", "org.apache.iceberg.aws.s3.S3FileIO")
    .getOrCreate()
)

#Initialize MSSQL credentials
host, port, username, password = get_db_credentials(secret_id)

#Read the cdc file 
cdc_df = read_cdc_S3(source_s3_bucket, source_s3_cdc_file_key)

tables = cdc_df.toPandas()._c1.unique().tolist()

#Loop over tables in the cdc file
for table in tables:
    #Create dataframes for delets and for inserts and updates
    table_df_deletes = cdc_df.where((cdc_df._c1 == table) & (cdc_df._c0 == "D")).drop(cdc_df.columns[0], cdc_df.columns[1], cdc_df.columns[2], cdc_df.columns[3])
    table_df_upserts = cdc_df.where((cdc_df._c1 == table) & ((cdc_df._c0 == "I") | (cdc_df._c0 == "U"))).drop(cdc_df.columns[0], cdc_df.columns[1], cdc_df.columns[2], cdc_df.columns[3])
    
    #Update column names for the dataframes
    columns = get_table_colums(table, host, port, username, password, dbname) 
    selectExpr = [] 

    for column in columns: 
        selectExpr.append(cdc_df.where((cdc_df._c1 == table)).drop(cdc_df.columns[0], cdc_df.columns[1], cdc_df.columns[2], cdc_df.columns[3]).columns[columns.index(column)] + " as " + column)

    table_df_deletes = table_df_deletes.selectExpr(selectExpr) 
    table_df_upserts = table_df_upserts.selectExpr(selectExpr)
    
    #Process Deletes
    if table_df_deletes.count() > 0:
        
        print("Delete Triggered")
        table_df_deletes.createOrReplaceTempView('deleted_rows')
        
        sql_string = """MERGE INTO glue_catalog.{0}.{1} target
                        USING (SELECT * FROM deleted_rows) source
                        ON {2}
                        WHEN MATCHED 
                        THEN DELETE""".format(database, table.lower(), get_iceberg_table_condition(database, table.lower()))
        spark.sql(sql_string)
    
    if table_df_upserts.count() > 0:
        print("Upsert triggered")

        #Upsert Records when there are Schema Changes
        if len(table_df_upserts.columns) != len(columns):

            #Handle column deletes
            if len(table_df_upserts.columns) < len(columns):

                drop_columns = list(set(columns) - set(table_df_upserts.columns))

                for drop_column in drop_columns:
                    sql_string = """
                                    ALTER TABLE glue_catalog.{0}.{1}
                                    DROP COLUMN {2}""".format(dbname.lower(), table.lower(), drop_column)
                    spark.sql(sql_string)

            #Handle column additions
            elif len(table_df_upserts.columns) > len(columns):

                column_datatype_df = get_table_colum_datatypes(table, host, port, username, password, dbname)
                add_columns = list(set(table_df_upserts.columns) - set(columns))

                for add_column in add_columns:

                    #Set Iceberg data type
                    data_type = list((row.DATA_TYPE) for (index, row) in column_datatype_df.filter("COLUMN_NAME='{0}'".format(add_column)).select("DATA_TYPE").toPandas().iterrows())[0]

                    # Convert MSSQL Datatypes to Iceberg supported datatypes
                    if data_type.lower() in ["varchar", "char"]:
                        data_type = "string"

                    if data_type.lower() in ["bigint"]:
                        data_type = "long"

                    if data_type.lower() in ["array"]:
                        data_type = "list"

                    sql_string = """
                                    ALTER TABLE glue_catalog.{0}.{1}
                                    ADD COLUMN {2} {3}""".format(dbname.lower(), table.lower(), add_column, data_type)
                    spark.sql(sql_string)
                    
            #Create statement to update columns
            update_table_column_list = ""
            insert_column_list = ""
            columns = get_table_colums(table, host, port, username, password, dbname)             

            for column in columns:

                update_table_column_list+="""target.{0}=source.{0},""".format(column)
                insert_column_list+="""source.{0},""".format(column)

            table_df_upserts.createOrReplaceTempView('updated_rows')

            sql_string = """MERGE INTO glue_catalog.{0}.{1} target
                            USING (SELECT * FROM updated_rows) source
                            ON {2}
                            WHEN MATCHED 
                            THEN UPDATE SET {3} 
                            WHEN NOT MATCHED THEN INSERT ({4}) VALUES ({5})""".format(dbname.lower(), 
                                                                                      table.lower(), 
                                                                                      get_iceberg_table_condition(dbname.lower(), table.lower()), 
                                                                                      update_table_column_list.rstrip(","), 
                                                                                      ",".join(columns), 
                                                                                      insert_column_list.rstrip(","))

            spark.sql(sql_string)

    
print("CDC job complete")

The Iceberg MERGE INTO syntax can handle cases where a new column is added. For more details on this feature, see the Iceberg MERGE INTO syntax documentation. If the CDC job needs to process many tables in the CDC file, the job can be multi-threaded to process the file in parallel.


Configure EventBridge notifications, SQS queue, and Step Functions state machine

You can use EventBridge notifications to send notifications to EventBridge when certain events occur on S3 buckets, such as when new objects are created and deleted. For this post, we’re interested in the events when new CDC files from AWS DMS arrive in the bronze S3 bucket. You can create event notifications for new objects and insert the file names into an SQS queue. A Lambda function within Step Functions would consume from the queue, extract the file name, start a CDC Glue job, and pass the file name as a parameter to the job.

AWS DMS CDC files contain database insert, update, and delete statements. We need to process these in order, so we use an SQS FIFO queue, which preserves the order of messages in which they arrive. You can also configure Amazon SQS to set a time to live (TTL); this parameter defines how long a message stays in the queue before it expires.

Another important parameter to consider when configuring an SQS queue is the message visibility timeout value. While a message is being processed, it disappears from the queue to make sure that the message isn’t consumed by multiple consumers (AWS Glue jobs in our case). If the message is consumed successfully, it should be deleted from the queue before the visibility timeout. However, if the visibility timeout expires and the message isn’t deleted, the message reappears in the queue. In our solution, this timeout must be greater than the time it takes for the CDC job to process a file.

Lastly, we recommend using Step Functions to define a workflow for handling the full load and CDC files. Step Functions has built-in integrations to other AWS services like Amazon SQS, AWS Glue, and Lambda, which makes it a good candidate for this use case.

The Step Functions state machine starts with checking the status of the AWS DMS task. The AWS DMS tasks can be queried to check the status of the full load, and we check the value of the parameter FullLoadProgressPercent. When this value gets to 100%, we can start processing the full load files. After the AWS Glue job processes the full load files, we start polling the SQS queue to check the size of the queue. If the queue size is greater than 0, this means new CDC files have arrived and we can start the AWS Glue CDC job to process these files. The AWS Glue jobs processes the CDC files and deletes the messages from the queue. When the queue size reaches 0, the AWS Glue job exits and we loop in the Step Functions workflow to check the SQS queue size.

Because the Step Functions state machine is supposed to run indefinitely, it’s good to keep in mind that there will be service limits you need to adhere to. Namely, the maximum runtime, which is 1 year, and maximum run history size, i.e., state transitions or events for a state machine which is 25,000. We recommend adding an additional step at the end to check if either of these conditions are being met to stop the current state machine run and start a new one.

The following diagram illustrates how you can use Step Functions state machine history size to monitor and start a new Step Functions state machine run.

Step Functions Workflow

Configure the pipeline

The pipeline needs to be configured to address cost, performance, and resilience goals. You might want a pipeline that can load fresh data into the data lake and make it available quickly, and you might also want to optimize costs by loading large chunks of data into the data lake. At the same time, you should make the pipeline resilient and be able to recover in case of failures. In this section, we cover the different parameters and recommended settings to achieve these goals.

Step Functions is designed to process incoming AWS DMS CDC files by running AWS Glue jobs. AWS Glue jobs can take a couple of minutes to boot up, and when they’re running, it’s efficient to process large chunks of data. You can configure AWS DMS to write CSV files to Amazon S3 by configuring the following AWS DMS task parameters:

  • CdcMaxBatchInterval – Defines the maximum time limit AWS DMS will wait before writing a batch to Amazon S3
  • CdcMinFileSize – Defines the minimum file size AWS DMS will write to Amazon S3

Whichever condition is met first will invoke the write operation. If you want to prioritize data freshness, you should have a short CdcMaxBatchInterval value (10 seconds) and a small CdcMinFileSize value (1–5 MB). This will result in many small CSV files being written to Amazon S3 and will invoke a lot of AWS Glue jobs to process the data, making the extract, transform, and load (ETL) process faster. If you want to optimize costs, you should have a moderate CdcMaxBatchInterval (minutes) and a large CdcMinFileSize value (100–500 MB). In this scenario, we start a few AWS Glue jobs that will process large chunks of data, making the ETL flow more efficient. In a real-world use case, the required values for these parameters might fall somewhere that’s a good compromise between throughput and cost. You can configure these parameters when creating a target endpoint using the AWS DMS console, or by using the create-endpoint command in the AWS Command Line Interface (AWS CLI).

For the full list of parameters, see Using Amazon S3 as a target for AWS Database Migration Service.

Choosing the right AWS Glue worker types for the full load and CDC jobs is also crucial for performance and cost optimization. The AWS Glue (Spark) workers range from G1X to G8X, which have an increasing number of data processing units (DPUs). Full load files are usually much larger in size compared to CDC files, and therefore it’s more cost- and performance-effective to select a larger worker. For CDC files, it would be more cost-effective to select a smaller worker because files sizes are smaller.

You should design the Step Functions state machine in such a way that if anything fails, the pipeline can be redeployed after repair and resume processing from where it left off. One important parameter here is TTL for the messages in the SQS queue. This parameter defines how long a message stays in the queue before expiring. In case of failures, we want this parameter to be long enough for us to deploy a fix. Amazon SQS has a maximum of 14 days for a message’s TTL. We recommend setting this to a large enough value to minimize messages being expired in case of pipeline failures.

Clean up

Complete the following steps to clean up the resources you created in this post:

  1. Delete the AWS Glue jobs:
    1. On the AWS Glue console, choose ETL jobs in the navigation pane.
    2. Select the full load and CDC jobs and on the Actions menu, choose Delete.
    3. Choose Delete to confirm.
  2. Delete the Iceberg tables:
    1. On the AWS Glue console, under Data Catalog in the navigation pane, choose Databases.
    2. Choose the database in which the Iceberg tables reside.
    3. Select the tables to delete, choose Delete, and confirm the deletion.
  3. Delete the S3 bucket:
    1. On the Amazon S3 console, choose Buckets in the navigation pane.
    2. Choose the silver bucket and empty the files in the bucket.
    3. Delete the bucket.

Conclusion

In this post, we showed how to use AWS Glue jobs to load AWS DMS files into a transactional data lake framework such as Iceberg. In our setup, AWS Glue provided highly scalable and simple-to-maintain ETL jobs. Furthermore, we share a proposed solution using Step Functions to create an ETL pipeline workflow, with Amazon S3 notifications and an SQS queue to capture newly arriving files. We shared how to design this system to be resilient towards failures and to automate one of the most time-consuming tasks in maintaining a data lake: schema evolution.

In Part 3, we will share how to process the data lake to create data marts.


About the Authors

Shaheer Mansoor is a Senior Machine Learning Engineer at AWS, where he specializes in developing cutting-edge machine learning platforms. His expertise lies in creating scalable infrastructure to support advanced AI solutions. His focus areas are MLOps, feature stores, data lakes, model hosting, and generative AI.

Anoop Kumar K M is a Data Architect at AWS with focus in the data and analytics area. He helps customers in building scalable data platforms and in their enterprise data strategy. His areas of interest are data platforms, data analytics, security, file systems and operating systems. Anoop loves to travel and enjoys reading books in the crime fiction and financial domains.

Sreenivas Nettem is a Lead Database Consultant at AWS Professional Services. He has experience working with Microsoft technologies with a specialization in SQL Server. He works closely with customers to help migrate and modernize their databases to AWS.

Diving Deeper into Projen: Exploring Advanced Features

Post Syndicated from Michael Tran original https://aws.amazon.com/blogs/devops/diving-deeper-into-projen-exploring-advanced-features/

We will be highlighting Projen’s powerful features that cater to various aspects of project management and development. We’ll examine how Projen enhances polyglot programming within Amazon Web Services (AWS) Cloud Development Kit constructs. We’ll also touch on its built-in support for common development tools and practices.

In our previous blog, we introduced you to the basics of getting started with Projen. Projen is a powerful project generator that simplifies the management of complex software configurations. In our prior blog, we discussed developing a new AWS cloud development kit (CDK) construct library project. For consistency, we will continue using this construct library project as our example while exploring linting, dependency management, and test coverage. It’s important to note that these practices are equally applicable to CDK applications and other project types.

AWS CDK Polyglot Construct Library

The AWS Cloud Development Kit (AWS CDK) is an open-source software development framework that allows developers to define cloud infrastructure using familiar programming languages. In a CDK application, constructs serve as the foundational elements, allowing developers to represent either a single AWS resource or a complex combination of resources. These constructs are not only reusable but can be incorporated into other AWS CDK projects, promoting efficient and scalable development practices.

Projen and Polyglot Programming

Projen leverages the power of the JSII library, enabling developers to write constructs once and generate equivalent constructs across multiple programming languages. This feature streamlines the development process, especially when working with teams that have expertise in different languages.

Automated Publishing with Projen

With its publisher module, Projen automates the distribution of c
ructs to various package managers. This process can be integrated into a GitHub workflow, such as a build job, which triggers the publication of the library to the designated package managers.

Starting with Projen

Initiating an AWS CDK construct library project is straightforward through the Projen command npx projen new <project_type>. By executing the command npx projen new awscdk-construct, you initialize a new project complete with a projenrc file. This file contains the essential configuration for a CDK construct library, setting the stage for further customization and development.

import { awscdk } from 'projen';
const project = new awscdk.AwsCdkConstructLibrary({
  author: 'github username',
  authorAddress: 'github email',
  cdkVersion: '2.1.0',
  defaultReleaseBranch: 'main',
  jsiiVersion: '~5.0.0',
  name: 'cdkconstruct',
  projenrcTs: true,
  repositoryUrl: 'https://github.com/*****/cdkconstruct.git',

  // deps: [],                /* Runtime dependencies of this module. */
  // description: undefined,  /* The description is just a string that helps people understand the purpose of the package. */
  // devDeps: [],             /* Build dependencies for this module. */
  // packageName: undefined,  /* The "name" in package.json. */
});
project.synth();

A release.yml file is generated by projen under the github>workflow directory. This file has the details of the public registry where the construct needs to be published. By default, it will add the details for npm.

release_npm:
    name: Publish to npm

The construct can be developed in typescript under src/main.ts, our previous blog shows how to create one. If the construct needs to be published to other public registries (such as Maven for java, Pypi for python), then a projenrc file can be updated to synthesize a new release.yml file.

For example, to publish a construct developed in typescript to Maven (so that it can be used in a java application) add publishToMaven API to the projenrc file.

const project = new awscdk.AwsCdkConstructLibrary({
  author: 'github username',
  authorAddress: 'github email',
  cdkVersion: '2.1.0',
  defaultReleaseBranch: 'main',
  jsiiVersion: '~5.0.0',
  name: 'cdkconstruct',
  projenrcTs: true,
  repositoryUrl: 'https://github.com/*****/cdkconstruct.git',
  publishToMaven: {
    javaPackage: 'com.cdk.hello',
    mavenArtifactId: 'cdk-construct-jsii',
    mavenGroupId: 'com.cdk.hello',
    mavenServerId: 'github',
    mavenRepositoryUrl: 'https://maven.pkg.github.com/example/hello-jsii',
  },
});

Run npx projen and the release.yml will be updated with Maven central details.

release_maven:
    name: Publish to Maven Central
    needs: release
    ....

Similarly, it can be published to other registries.

publishToPypi: 
publishToMaven:
publishToNuGet:
publishToGo:

This way the construct is built once and published to multiple registries with different programming languages.

Running Projen build runs a variety of processes.

Figure 1: High-level Architecture showing publication to multiple public registries

Linting, Dependency Management & Test Coverage

Projen streamlines the setup process by generating a comprehensive package.json file. This file includes pre-configured dependencies for ESLint and Jest, enabling developers to maintain coding standards and ensure robust test coverage right from the start. ESLint, a widely adopted static code analysis utility, empowers developers to enforce consistent coding practices by analyzing the source code and identifying potential errors, bugs, and stylistic issues. Additionally, Jest equips developers with a comprehensive suite of tools for writing and executing unit tests, facilitating comprehensive test coverage for their codebase. While Projen provides Jest as the default testing framework, it offers developers the flexibility to incorporate alternative testing frameworks based on their project requirements.

Following with the awscdk-construct from the previous section, under test>main.test.ts a default test file is created, which can be updated for writing test cases. A default package.json is generated in the root directory.

{
  "name": "projen_hello",
  "scripts": {
    "build": "npx projen build",
    "bundle": "npx projen bundle",
    "clobber": "npx projen clobber",
    "compile": "npx projen compile",
    "default": "npx projen default",
    "deploy": "npx projen deploy",
    "destroy": "npx projen destroy",
    "diff": "npx projen diff",
    "eject": "npx projen eject",
    "eslint": "npx projen eslint",
    "package": "npx projen package",
    "post-compile": "npx projen post-compile",
    "post-upgrade": "npx projen post-upgrade",
    "pre-compile": "npx projen pre-compile",
    "synth": "npx projen synth",
    "synth:silent": "npx projen synth:silent",
    "test": "npx projen test",
    "test:watch": "npx projen test:watch",
    "upgrade": "npx projen upgrade",
    "watch": "npx projen watch",
    "projen": "npx projen"
  },
  "devDependencies": {
    "@types/jest": "^29.5.4",
    "@types/node": "^16",
    "@typescript-eslint/eslint-plugin": "^6",
    "@typescript-eslint/parser": "^6",
    "aws-cdk": "^2.1.0",
    "esbuild": "^0.19.2",
    "eslint": "^8",
    "eslint-import-resolver-node": "^0.3.9",
    "eslint-import-resolver-typescript": "^3.6.0",
    "eslint-plugin-import": "^2.28.1",
    "jest": "^29.7.0",
    "jest-junit": "^15",
    "npm-check-updates": "^16",
    "projen": "^0.73.17",
    "ts-jest": "^29.1.1",
    "ts-node": "^10.9.1",
    "typescript": "^5.2.2",
    "webpack": "5.88.2"
  },
  "dependencies": {
    "aws-cdk-lib": "^2.1.0",
    "constructs": "^10.0.5"
  },
  "license": "Apache-2.0",
  "version": "0.0.0",
  "jest": {
    "testMatch": [
      "<rootDir>/src/**/__tests__/**/*.ts?(x)",
      "<rootDir>/(test|src)/**/*(*.)@(spec|test).ts?(x)"
    ],
    "clearMocks": true,
    "collectCoverage": true,
    "coverageReporters": [
      "json",
      "lcov",
      "clover",
      "cobertura",
      "text"
    ],
    "coverageDirectory": "coverage",
    "coveragePathIgnorePatterns": [
      "/node_modules/"
    ],
    "testPathIgnorePatterns": [
      "/node_modules/"
    ],
    "watchPathIgnorePatterns": [
      "/node_modules/"
    ],
    "reporters": [
      "default",
      [
        "jest-junit",
        {
          "outputDirectory": "test-reports"
        }
      ]
    ],
    "preset": "ts-jest",
    "globals": {
      "ts-jest": {
        "tsconfig": "tsconfig.dev.json"
      }
    }
  },
  "//": "~~ Generated by projen. To modify, edit .projenrc.ts and run \"npx projen\"."
}

Projen can be extensively configured. For example, if you need to configure webpack as a module bundler, then you need to add a webpack.config.js file and update the projenrc file project.

The other dependencies can be updated in package.json by adding deps in the projenrc.ts file.

const project = new awscdk.AwsCdkTypeScriptApp({
  cdkVersion: '2.1.0',
  defaultReleaseBranch: 'main',
  name: 'projen_hello',
  projenrcTs: true,
  
  deps:[
   "express",
  ],
  
  // add webpack dependencies
  devDeps:[
    "webpack",
    "webpack-cli",
    "ts-loader",
  ]
});
  
// update pre-configured build tasks and execute webpack
project.buildTask.reset
project.buildTask.exec('npx projen');
project.buildTask.exec('npx projen test');
project.buildTask.exec('npx webpack');

Run npx projen build to synthesize a package.json.

Continuous Integration and Continuous Delivery (CI/CD)

When you create a project using Projen, it comes equipped with an automated build process that triggers upon the submission of a pull request. This is one of the key, “out-of-the-box” features that streamlines development workflows.

Projen orchestrates this process through GitHub Actions, utilizing a sequence of tasks predefined in the project’s base ‘Project’ class.

When a build is initiated, it systematically carries out several sub-tasks:

  1. Synthesis: It starts by synthesizing all the project files, ensuring they are up-to-date and correctly configured.
  2. Bundling: Next, it bundles the necessary assets for the project.
  3. Compilation: The project’s code is then compiled.
  4. Testing: Following compilation, Projen runs the suite of tests defined for the project.
  5. Packaging: Finally, it packages everything together, preparing it for deployment or distribution.

Projen manages these steps by auto-generating a build.yml file, which it places within the workflow directory of your project’s structure. This YAML file contains all the instructions for the GitHub Actions to execute the build process.

For instance, when you run the command npx projen new awscdk-app-ts, Projen sets up a TypeScript application for AWS CDK. It automatically creates a ‘build.yml’ file through the default projenrc file, which can be found in the github/workflow folder of your project repository. This automated process is designed to save time and reduce manual errors, making it an essential feature for efficient project management.

 .github       
   workflow    
    build.yml  

A Projen build is self-mutating because files generated by Projen are part of the source directory. To ensure that a pull request branch always represents the final state of the repository, you can enable the mutableBuild option in your project configuration (currently only supported for projects derived from NodeProject).

The build process can be customized by adding any task in the project class, which can execute a shell command.

const buildproject = project.addTask('build'); 
buildproject.exec('npm run build');

You can spawn a subtask as well.

const buildproject = project.addTask('world');
buildproject.exec('echo world!');

const testproject = project.addTask('test');
testproject.exec('npm test');
testproject.spawn(buildproject);

The Task also supports the condition option that determines if the condition is true before running the task.

const hello = project.addTask('hello', {
  condition: '[ -n "$CI" ]', // only execute if the CI environment variable is defined
  exec: 'echo running in a CI environment'
});

Releases and Versioning

Projen uses Conventional Commits to generate semantic versioning of the releases automatically. This means that based on the commit message format, it can create the release version automatically.

Initially, the project is released under version 0.0.0. Anything may change at any time and public APIs should not be considered stable. Commits marked as a breaking change will increase the minor version. All other commits will increase the patch version.

You need to manually promote the major version to 1 once your project is considered stable. For major versions 1 and above, if a release includes fix commits only, it will increase the patch version. If a release includes any feat commits, then the new version will be a minor version.

Commit Messages                     Release versions         

feat: <Message>                     1.0.X (Patch)            
fix: <Message>                      1.X.0 (Minor)            
BREAKING CHANGE: <Message>          X.0 (Major)              

API Documentation

One of the nice, out-of-the-box features that comes with Projen for AWS CDK constructs is the creation of API documentation for your constructs. By leveraging jsii-docgen, Projen’s build step will generate API documentation (API.md) from the comments in your code.

This feature is powerful for several reasons. Firstly, it ensures that documentation is kept up-to-date with the codebase, as the API documentation is generated directly from the source code comments. This reduces the risk of discrepancies between the code and its documentation, which can lead to misunderstandings and errors in usage.

Secondly, it streamlines the development process by automating a task that is often tedious and time-consuming. Developers can focus more on writing code and less on updating documentation manually.

Thirdly, it promotes better coding practices, as developers are encouraged to write clear and detailed comments in their code. This not only benefits the generation of documentation, but also helps any new developers who may work on the codebase in the future to understand the code more quickly and thoroughly.

Moreover, having readily available and accurate documentation can significantly enhance the developer experience. It makes it more straightforward for users of the CDK constructs to understand the functionality, parameters, return types, and the structure of the code they are working with.

In the context of team collaboration and open-source projects, this feature is especially beneficial. It ensures that anyone who contributes to the codebase is able to generate and view the latest documentation without any additional setup or configuration, facilitating smoother collaboration and integration processes.

Let’s recap all of the features that Projen can introduce into your project right out of the box:

  1. Projen’s automation for linting and testing to maintain high code quality from the beginning.
  2. Automated API documentation feature to keep your project’s documentation synchronized with the latest code changes.
  3. Polyglot capabilities to cater to a diverse development team, ensuring flexibility in language preference.
  4. The publisher module to streamline the release process across multiple package managers, saving time and reducing the scope for human error.
  5. A list of awesome projects developed with Projen for inspiration or use as a template.

Conclusion

As we wrap up our deep dive into some of the advanced features of Projen within AWS CDK, it’s clear that Projen helps alleviate a lot of the pain points of a new greenfield project. By leveraging Projen, developers can navigate the complexities of polyglot programming, automate the mundane tasks of publishing and documentation, and ensure consistent code quality through linting and testing. Projen elevates the development workflow to a level where efficiency and scalability are the norms, not the exception.

What’s more compelling is Projen’s commitment to developer empowerment. Through its automated systems, it encourages developers to adhere to best practices without the overhead of manual enforcement. Its ability to seamlessly integrate with various package managers and generate detailed API documentation from inline comments signifies a leap in developer tooling.

Contact an AWS Representative to know how we can help accelerate your business.

Further Reading

Alain Krok image

Alain Krok

Alain Krok is a Senior Solutions Architect with a passion for emerging technologies. His past experience includes designing and implementing IoT solutions for the oil and gas industry and working on robotics projects. He enjoys pushing the limits and indulging in extreme sports when he is not designing software.

Dinesh Sajwan profile

Dinesh Sajwan

Dinesh Sajwan is a Senior Solutions Architect. His passion for emerging technologies allows him to stay on the cutting edge and identify new ways to apply the latest advancements to solve even the most complex business problems. His diverse expertise and enthusiasm for both technology and adventure position him as a uniquely creative problem-solver.

Michael Tran profile

Michael Tran

Michael Tran is a Senior Solutions Architect with Prototyping Acceleration team at Amazon Web Services. He provides technical guidance and helps customers innovate by showing the art of the possible on AWS. He specializes in building prototypes in the AI/ML space.

Introducing picamzero: Simplifying Raspberry Pi Camera projects for beginners

Post Syndicated from Laura Sach original https://www.raspberrypi.org/blog/picamzero-raspberry-pi-camera-projects-for-beginners/

Thousands of learners worldwide take their first steps into text-based programming using the Python programming language. Python is not only beginner-friendly, but is also used extensively in industry.

An educator helps two young learners with a coding project in a classroom.

In 2015, Python developer Daniel Pope, who has a keen interest in education, noticed that beginners often have great ideas for creating projects but struggle because the software libraries they need to use are aimed at more confident programmers. To address this, he created Pygame Zero — a simplified version of the popular PyGame software. Since then, various developers have expanded the range of ‘zero’ libraries for Python.

How Python zero libraries help beginner programmers

The Raspberry Pi Foundation has a long history of supporting Python zero libraries. GPIO Zero was launched back in 2015, followed by guizero and then picozero. The goal of all ‘zero’ libraries is the same: to help beginner programmers create amazing projects using simple, understandable code, supported by useful documentation. 

The Picamera2 library is a powerful tool for advanced users, but beginners — such as Astro Pi: Mission Space Lab programme participants — would benefit from a zero library to allow them to use the Raspberry Pi Camera module. 

The Astro Pi Mark II units.
The Astro Pi Mark II units
Image taken by Astro Pi: Mission Space Lab programme participants

Picamzero: how to get started

The Code Club Projects and Youth Programmes teams at the Raspberry Pi Foundation have joined forces to create picamzero: a new library that makes it simple for beginners to use the Raspberry Pi Camera board.

As with the other ‘zero’ libraries, it’s straightforward to get started. You can install picamzero by typing two commands in your Raspberry Pi’s terminal:

sudo apt update

sudo apt install python3-picamzero

Once it’s installed, setting up your program to communicate with your camera is easy:

from picamzero import Camera

cam = Camera()

You can ask picamzero to take a time-lapse sequence and make a video of your images using a single line of code.

cam.capture_sequence("mysequence.jpg", make_video=True)

Picamzero also makes it easy to add text and image overlays to your images.

A Lego scene captured using picamzero.
A Lego scene captured using picamzero

We’ve written beginner-friendly documentation for the new library so that you can explore what you can create using just a few lines of code. We’ve also updated our resources so that you can start making exciting projects using picamzero straight away:

We hope you enjoy using picamzero. Please get in touch if you have any feedback or suggestions. Happy coding!

The post Introducing picamzero: Simplifying Raspberry Pi Camera projects for beginners appeared first on Raspberry Pi Foundation.

Amazon Q Developer Code Challenge

Post Syndicated from Aaron Sempf original https://aws.amazon.com/blogs/devops/amazon-q-developer-code-challenge/

Amazon Q Developer is a generative artificial intelligence (AI) powered conversational assistant that can help you understand, build, extend, and operate AWS applications. You can ask questions about AWS architecture, your AWS resources, best practices, documentation, support, and more.

With Amazon Q Developer in your IDE, you can write a comment in natural language that outlines a specific task, such as, “Upload a file with server-side encryption.” Based on this information, Amazon Q Developer recommends one or more code snippets directly in the IDE that can accomplish the task. You can quickly and easily accept the top suggestions (tab key), view more suggestions (arrow keys), or continue writing your own code.

However, Amazon Q Developer in the IDE is more than just a code completion plugin. Amazon Q Developer is a generative AI (GenAI) powered assistant for software development that can be used to have a conversation about your code, get code suggestions, or ask questions about building software. This provides the benefits of collaborative paired programming, powered by GenAI models that have been trained on billions of lines of code, from the Amazon internal code-base and publicly available sources.

The challenge

At the 2024 AWS Summit in Sydney, an exhilarating code challenge took center stage, pitting a Blue Team against a Red Team, with approximately 10 to 15 challengers in each team, in a battle of coding prowess. The challenge consisted of 20 tasks, starting with basic math and string manipulation, and progressively escalating in difficulty to include complex algorithms and intricate ciphers.

The Blue Team had a distinct advantage, leveraging the powerful capabilities of Amazon Q Developer, the most capable generative AI-powered assistant for software development. With Q Developer’s guidance, the Blue Team navigated increasingly complex tasks with ease, tapping into Q Developer’s vast knowledge base and problem-solving abilities. In contrast, the Red Team competed without assistance, relying solely on their own coding expertise and problem-solving skills to tackle daunting challenges.

As the competition unfolded, the two teams battled it out, each striving to outperform the other. The Blue Team’s efficient use of Amazon Q Developer proved to be a game-changer, allowing them to tackle the most challenging tasks with remarkable speed and accuracy. However, the Red Team’s sheer determination and technical prowess kept them in the running, showcasing their ability to think outside the box and devise innovative solutions.

The culmination of the code challenge was a thrilling finale, with both teams pushing the boundaries of their skills and ultimately leaving the audience in a state of admiration for their remarkable achievements.

Graph of elapsed time of teams in the AWS Sydney Summit code challenge

The graph shows the average completion time in which Team Blue “Q Developer” completed more questions across the board in less time than Team Red “Solo Coder”. Within the 1-hour time limit, Team Blue got all the way to Question 19, whereas Team Red only got to Question 16.

There are some assumptions and validations. People who consider themselves very experienced programmers were encouraged to choose team Red and not use AI, to test themselves against team Blue, those using AI. The code challenges were designed to test the output of applying logic. They were specifically designed to be passable without the use of Amazon Q Developer, to test the optimization of writing logical code with Amazon Q Developer. As a result, the code tasks worked well with Amazon Q Developer due to the nature of and underlying training of Amazon Q Developer models. Many people who attended the event were not Python Programmers (we constrained the challenge to Python only), and walked away impressed at how much of the challenge they could complete.

As an example of one of the more complex questions competitors were given to solve was:

Implement the rail fence cipher.
In the Rail Fence cipher, the message is written downwards on successive "rails" of an imaginary fence, then moving up when we get to the bottom (like a zig-zag). Finally the message is then read off in rows.

For example, using three "rails" and the message "WE ARE DISCOVERED FLEE AT ONCE", the cipherer writes out: 

W . . . E . . . C . . . R . . . L . . . T . . . E
. E . R . D . S . O . E . E . F . E . A . O . C .
. . A . . . I . . . V . . . D . . . E . . . N . .

Then reads off: WECRLTEERDSOEEFEAOCAIVDEN

Given variable a. Use a three-rail fence cipher so that result is equal to the decoded message of variable a.

The questions were both algorithmic and logical in nature, which made them great for testing conversational natural language capability to solve questions using Amazon Q Developer, or by applying one’s own logic to write code to solve the question.

Top scoring individual per team:

Total Questions Complete individual time (min)
With Q Developer (Blue Team) 19 30.46
Solo Coder (Red Team) 16 58.06

By comparing the top two competitors, and considering the solo coder was a highly experienced programmer versus the top Q Developer coder, who was a relatively new programmer not familiar with Python, you can see the efficiency gain when using Q Developer as an AI peer programmer. It took the entire 60 minutes for the solo coder to complete 16 questions, whereas the Q Developer coder got to the final question (Question 20, incomplete) in half of the time.

Summary

Integrating advanced IDE features and adopting paired programming have significantly improved coding efficiency and quality. However, the introduction of Amazon Q Developer has taken this evolution to new heights. By tapping into Q Developer’s vast knowledge base and problem-solving capabilities, the Blue Team was able to navigate complex coding challenges with remarkable speed and accuracy, outperforming the unassisted Red Team. This highlights the transformative impact of leveraging generative AI as a collaborative pair programmer in modern software development, delivering greater efficiency, problem-solving, and, ultimately, higher-quality code. Get started with Amazon Q Developer for your IDE by installing the plugin and enabling your builder ID today.

About the authors:

Aaron Sempf

Aaron Sempf is Next Gen Tech Lead for the AWS Partner Organization in Asia-Pacific and Japan. With over twenty years in software engineering and distributed system, he focuses on solving for large scale complex integration and event driven systems. In his spare time, he can be found coding prototypes for autonomous robots, IoT devices, distributed solutions and designing Agentic Architecture patterns for GenAI assisted business automation.

Paul Kukiel

Paul Kukiel

Paul Kukiel is a Senior Solutions Architect at AWS. With a background of over twenty years in software engineering, he particularly enjoys helping customers build modern, API Driven software architectures at scale. In his spare time, he can be found building prototypes for micro front ends and event driven architectures.

Bridging the gap from Scratch to Python: Introducing ‘Paint with Python’

Post Syndicated from Marc Scott original https://www.raspberrypi.org/blog/learn-to-code-python/

We have developed an innovative activity to support young people as they transition from visual programming languages like Scratch to text-based programming languages like Python.

An illustration of a web browser window with colourful tags and labels around it.

This activity introduces a unique interface that empowers learners to easily interact with Python while they create a customised painting app.

“The kids liked the self-paced learning, it allowed them to work at their own rate. They liked using RGB tables to find their specific colours.” – Code Club mentor

Why learn to code Python?

We’ve long been championing Python as an ideal tool for young people who want to start text-based programming. Python has simple syntax and needs very few lines of code to get started, and there is a vibrant community of supportive programmers surrounding it.

However, we know that starting with Python can be challenging for young people who have never done any text-based coding. They can face obstacles such as software installation issues, getting used to a new syntax, and the need for appropriate typing skills.

How ‘Paint with Python’ helps learners get started

‘Paint with Python’ is an online educational activity that addresses many of these challenges and helps young people learn to code Python for the first time. It’s entirely web-based, requiring no software installation beyond a web browser. Instructions are displayed in a side panel, allowing learners to read and code without needing to switch tabs.

To help young people with creating their painting app, much of the initial code is pre-written behind the scenes, which enables learners to focus on experimenting with Python and observing the outcomes. They engage with the code by clicking on suggested options or, in some cases, by typing small snippets of Python. For example, they can select colours from a range of options or, as they grow more confident, type RGB values to create custom colours.

The activity is fully responsive for mobile and tablet devices and provides a final view of the full program on the last page, together with suggested routes to continue learning text-based programming.

An accessible introduction to text-based programming

We believe this activity offers an accessible way for young learners to begin their journey with text-based programming and learning to code Python. The code they write is straightforward and the activity is designed to minimise errors. When mistakes do occur, the interface provides clear, constructive feedback, guiding learners to make corrections.

Try out ‘Paint with Python’ at rpf.io/paint-with-python. We’d love to hear your feedback! Please send any thoughts you have to [email protected]

This activity was developed with support from the Cisco Foundation. Through our funding partnership with them, we’ve been able to provide thousands of young people with the inspiration and opportunity to progress their coding skills anywhere, and on any device.

The post Bridging the gap from Scratch to Python: Introducing ‘Paint with Python’ appeared first on Raspberry Pi Foundation.

Make your interaction with Zabbix API faster: Async zabbix_utils.

Post Syndicated from Aleksandr Iantsen original https://blog.zabbix.com/make-your-interaction-with-zabbix-api-faster-async-zabbix_utils/27837/

In this article, we will explore the capabilities of the new asynchronous modules of the zabbix_utils library. Thanks to asynchronous execution, users can expect improved efficiency, reduced latency, and increased flexibility in interacting with Zabbix components, ultimately enabling them to create efficient and reliable monitoring solutions that meet their specific requirements.

There is a high demand for the Python library zabbix_utils. Since its release and up to the moment of writing this article, zabbix_utils has been downloaded from PyPI more than 15,000 times. Over the past week, the library has been downloaded more than 2,700 times. The first article about the zabbix_utils library has already gathered around 3,000 views. Among the array of tools available, the library has emerged as a popular choice, offering developers and administrators a comprehensive set of functions for interacting with Zabbix components such as Zabbix server, proxy, and agents.

Considering the demand from users, as well as the potential of asynchronous programming to optimize interaction with Zabbix, we are pleased to present a new version of the library with new asynchronous modules in addition to the existing synchronous ones. The new zabbix_utils modules are designed to provide a significant performance boost by taking advantage of the inherent benefits of asynchronous programming to speed up communication between Zabbix and your service or script.

You can read the introductory article about zabbix_utils for a more comprehensive understanding of working with the library.

Benefits and Usage Scenarios

From expedited data retrieval and real-time event monitoring to enhanced scalability, asynchronous programming empowers you to build highly efficient, flexible, and reliable monitoring solutions adapted to meet your specific needs and challenges.

The new version of zabbix_utils and its asynchronous components may be useful in the following scenarios:

  • Mass data gathering from multiple hosts: When it’s necessary to retrieve data from a large number of hosts simultaneously, asynchronous programming allows requests to be executed in parallel, significantly speeding up the data collection process;
  • Mass resource exporting: When templates, hosts or problems need to be exported in parallel. This parallel execution reduces the overall export time, especially when dealing with a large number of resources;
  • Sending alerts from or to your system: When certain actions need to be performed based on monitoring conditions, such as sending alerts or running scripts, asynchronous programming provides rapid condition processing and execution of corresponding actions;
  • Scaling the monitoring system: With an increase in the number of monitored resources or the volume of collected data, asynchronous programming provides better scalability and efficiency for the monitoring system.

Installation and Configuration

If you already use the zabbix_utils library, simply updating the library to the latest version and installing all necessary dependencies for asynchronous operation is sufficient. Otherwise, you can install the library with asynchronous support using the following methods:

  • By using pip:
~$ pip install zabbix_utils[async]

Using [async] allows you to install additional dependencies (extras) needed for the operation of asynchronous modules.

  • By cloning from GitHub:
~$ git clone https://github.com/zabbix/python-zabbix-utils
~$ cd python-zabbix-utils/
~$ pip install -r requirements.txt
~$ python setup.py install

The process of working with the asynchronous version of the zabbix_utils library is similar to the synchronous one, except for some syntactic differences of asynchronous code in Python.

Working with Zabbix API

To work with the Zabbix API in asynchronous mode, you need to import the AsyncZabbixAPI class from the zabbix_utils library:

from zabbix_utils import AsyncZabbixAPI

Similar to the synchronous ZabbixAPI, the new AsyncZabbixAPI can use the following environment variables: ZABBIX_URL, ZABBIX_TOKEN, ZABBIX_USER, ZABBIX_PASSWORD. However, when creating an instance of the AsyncZabbixAPI class you cannot specify a token or a username and password, unlike the synchronous version. They can only be passed when calling the login() method. The following usage scenarios are available here:

  • Use preset values of environment variables, i.e., not pass any parameters to AsyncZabbixAPI:
~$ export ZABBIX_URL="https://zabbix.example.local"
api = AsyncZabbixAPI()
  • Pass only the Zabbix API address as input, which can be specified as either the server IP/FQDN address or DNS name (in this case, the HTTP protocol will be used) or as an URL of Zabbix API:
api = AsyncZabbixAPI(url="127.0.0.1")

After declaring an instance of the AsyncZabbixAPI class, you need to call the login() method to authenticate with the Zabbix API. There are two ways to do this:

  • Using environment variable values:
~$ export ZABBIX_USER="Admin"
~$ export ZABBIX_PASSWORD="zabbix"

or

~$ export ZABBIX_TOKEN="xxxxxxxx"

and then:

await api.login()
  • Passing the authentication data when calling login():
await api.login(user="Admin", password="zabbix")

Like ZabbixAPI, the new AsyncZabbixAPI class supports version getting and comparison:

# ZabbixAPI version field
ver = api.version
print(type(ver).__name__, ver) # APIVersion 6.0.29

# Method to get ZabbixAPI version
ver = api.api_version()
print(type(ver).__name__, ver) # APIVersion 6.0.29

# Additional methods
print(ver.major)     # 6.0
print(ver.minor)     # 29
print(ver.is_lts())  # True

# Version comparison
print(ver < 6.4)        # True
print(ver != 6.0)       # False
print(ver != "6.0.24")  # True

After authentication, you can make any API requests described for all supported versions in the Zabbix documentation.

The format for calling API methods looks like this:

await api_instance.zabbix_object.method(parameters)

For example:

await api.host.get()

After completing all needed API requests, it is necessary to call logout() to close the API session if authentication was done using username and password, and also close the asynchronous sessions:

await api.logout()

More examples of usage can be found here.

Sending Values to Zabbix Server/Proxy

The asynchronous class AsyncSender has been added, which also helps to send values to the Zabbix server or proxy for items of the Zabbix Trapper data type.

AsyncSender can be imported as follows:

from zabbix_utils import AsyncSender

Values ​​can be sent in a group, for this it is necessary to import ItemValue:

import asyncio
from zabbix_utils import ItemValue, AsyncSender


items = [
    ItemValue('host1', 'item.key1', 10),
    ItemValue('host1', 'item.key2', 'Test value'),
    ItemValue('host2', 'item.key1', -1, 1702511920),
    ItemValue('host3', 'item.key1', '{"msg":"Test value"}'),
    ItemValue('host2', 'item.key1', 0, 1702511920, 100)
]

async def main():
    sender = AsyncSender('127.0.0.1', 10051)
    response = await sender.send(items)
    # processing the received response

asyncio.run(main())

As in the synchronous version, it is possible to specify the size of chunks when sending values in a group using the parameter chunk_size:

sender = AsyncSender('127.0.0.1', 10051, chunk_size=2)
response = await sender.send(items)

In the example, the chunk size is set to 2. So, 5 values passed in the code above will be sent in three requests of two, two, and one value, respectively.

Also it is possible to send a single value:

sender = AsyncSender(server='127.0.0.1', port=10051)
resp = await sender.send_value('example_host', 'example.key', 50, 1702511920))

If your server has multiple network interfaces, and values need to be sent from a specific one, the AsyncSender provides the option to specify a source_ip for sent values:

sender = AsyncSender(
    server='zabbix.example.local',
    port=10051,
    source_ip='10.10.7.1'
)
resp = await sender.send_value('example_host', 'example.key', 50, 1702511920)

AsyncSender also supports reading connection parameters from the Zabbix agent/agent2 configuration file. To do this, you need to set the use_config flag and specify the path to the configuration file if it differs from the default /etc/zabbix/zabbix_agentd.conf:

sender = AsyncSender(
    use_config=True,
    config_path='/etc/zabbix/zabbix_agent2.conf'
)

More usage examples can be found here.

Getting values from Zabbix Agent/Agent2 by item key.

In cases where you need the functionality of our standart zabbix_get utility but native to your Python project and working asynchronously, consider using the AsyncGetter class. A simple example of its usage looks like this:

import asyncio
from zabbix_utils import AsyncGetter

async def main():
    agent = AsyncGetter('10.8.54.32', 10050)
    resp = await agent.get('system.uname')
    print(resp.value) # Linux zabbix_server 5.15.0-3.60.5.1.el9uek.x86_64

asyncio.run(main())

Like AsyncSender, the AsyncGetter class supports specifying the source_ip address:

agent = AsyncGetter(
    host='zabbix.example.local',
    port=10050,
    source_ip='10.10.7.1'
)

More usage examples can be found here.

Conclusions

The new version of the zabbix_utils library provides users with the ability to implement efficient and scalable monitoring solutions, ensuring fast and reliable communication with the Zabbix components. Asynchronous way of interaction gives a lot of room for performance improvement and flexible task management when handling a large volume of requests to Zabbix components such as Zabbix API and others.

We have no doubt that the new version of zabbix_utils will become an indispensable tool for developers and administrators, helping them create more efficient, flexible, and reliable monitoring solutions that best meet their requirements and expectations.

The post Make your interaction with Zabbix API faster: Async zabbix_utils. appeared first on Zabbix Blog.

Bringing Python to Workers using Pyodide and WebAssembly

Post Syndicated from Hood Chatham original https://blog.cloudflare.com/python-workers


Starting today, in open beta, you can now write Cloudflare Workers in Python.

This new support for Python is different from how Workers have historically supported languages beyond JavaScript — in this case, we have directly integrated a Python implementation into workerd, the open-source Workers runtime. All bindings, including bindings to Vectorize, Workers AI, R2, Durable Objects, and more are supported on day one. Python Workers can import a subset of popular Python packages including FastAPI, Langchain, Numpy and more. There are no extra build steps or external toolchains.

To do this, we’ve had to push the bounds of all of our systems, from the runtime itself, to our deployment system, to the contents of the Worker bundle that is published across our network. You can read the docs, and start using it today.

We want to use this post to pull back the curtain on the internal lifecycle of a Python Worker, share what we’ve learned in the process, and highlight where we’re going next.

Beyond “Just compile to WebAssembly”

Cloudflare Workers have supported WebAssembly since 2018 — each Worker is a V8 isolate, powered by the same JavaScript engine as the Chrome web browser. In principle, it’s been possible for years to write Workers in any language — including Python — so long as it first compiles to WebAssembly or to JavaScript.

In practice, just because something is possible doesn’t mean it’s simple. And just because “hello world” works doesn’t mean you can reliably build an application. Building full applications requires supporting an ecosystem of packages that developers are used to building with. For a platform to truly support a programming language, it’s necessary to go much further than showing how to compile code using external toolchains.

Python Workers are different from what we’ve done in the past. It’s early, and still in beta, but we think it shows what providing first-class support for programming languages beyond JavaScript can look like on Workers.

The lifecycle of a Python Worker

With Pyodide now built into workerd, you can write a Worker like this:

from js import Response

async def on_fetch(request, env):
    return Response.new("Hello world!")

…with a wrangler.toml file that points to a .py file:

name = "hello-world-python-worker"
main = "src/entry.py"
compatibility_date = "2024-03-18"

…and when you run npx wrangler@latest dev, the Workers runtime will:

  1. Determine which version of Pyodide is required, based on your compatibility date
  2. Create an isolate for your Worker, and automatically inject Pyodide
  3. Serve your Python code using Pyodide

This all happens under the hood — no extra toolchain or precompilation steps needed. The Python execution environment is provided for you, mirroring how Workers written in JavaScript already work.

A Python interpreter built into the Workers runtime

Just as JavaScript has many engines, Python has many implementations that can execute Python code. CPython is the reference implementation of Python. If you’ve used Python before, this is almost certainly what you’ve used, and is commonly referred to as just “Python”.

Pyodide is a port of CPython to WebAssembly. It interprets Python code, without any need to precompile the Python code itself to any other format. It runs in a web browser — check out this REPL. It is true to the CPython that Python developers know and expect, providing most of the Python Standard Library. It provides a foreign function interface (FFI) to JavaScript, allowing you to call JavaScript APIs directly from Python — more on this below. It provides popular open-source packages, and can import pure Python packages directly from PyPI.

Pyodide struck us as the perfect fit for Workers. It is designed to allow the core interpreter and each native Python module to be built as separate WebAssembly modules, dynamically linked at runtime. This allows the code footprint for these modules to be shared among all Workers running on the same machine, rather than requiring each Worker to bring its own copy. This is essential to making WebAssembly work well in the Workers environment, where we often run thousands of Workers per machine — we need Workers using the same programming language to share their runtime code footprint. Running thousands of Workers on every machine is what makes it possible for us to deploy every application in every location at a reasonable price.

Just like with JavaScript Workers, with Python Workers we provide the runtime for you:

Pyodide is currently the exception — most languages that target WebAssembly do not yet support dynamic linking, so each application ends up bringing its own copy of its language runtime. We hope to see more languages support dynamic linking in the future, so that we can more effectively bring them to Workers.

How Pyodide works

Pyodide executes Python code in WebAssembly, which is a sandboxed environment, separated from the host runtime. Unlike running native code, all operations outside of pure computation (such as file reads) must be provided by a runtime environment, then imported by the WebAssembly module.

LLVM provides three target triples for WebAssembly:

  1. wasm32-unknown-unknown – this backend provides no C standard library or system call interface; to support this backend, we would need to manually rewrite every system or library call to make use of imports we would define ourselves in the runtime.
  2. wasm32-wasi – WASI is a standardized system interface, and defines a standard set of imports that are implemented in WASI runtimes such as wasmtime.
  3. wasm32-unknown-emscripten – Like WASI, Emscripten defines the imports that a WebAssembly program needs to execute, but also outputs an accompanying JavaScript library that implements these imported functions.

Pyodide uses Emscripten, and provides three things:

  1. A distribution of the CPython interpreter, compiled using Emscripten
  2. A foreign function interface (FFI) between Python and JavaScript
  3. A set of third-party Python packages, compiled using Emscripten’s compiler to WebAssembly.

Of these targets, only Emscripten currently supports dynamic linking, which, as we noted above, is essential to providing a shared language runtime for Python that is shared across isolates. Emscripten does this by providing implementations of dlopen and dlsym, which use the accompanying JavaScript library to modify the WebAssembly program’s table to link additional WebAssembly-compiled modules at runtime. WASI does not yet support the dlopen/dlsym dynamic linking abstractions used by CPython.

Pyodide and the magic of foreign function interfaces (FFI)

You might have noticed that in our Hello World Python Worker, we import Response from the js module:

from js import Response

async def on_fetch(request, env):
    return Response.new("Hello world!")

Why is that?

Most Workers are written in JavaScript, and most of our engineering effort on the Workers runtime goes into improving JavaScript Workers. There is a risk in adding a second language that it might never reach feature parity with the first language and always be a second class citizen. Pyodide’s foreign function interface (FFI) is critical to avoiding this by providing access to all JavaScript functionality from Python. This can be used by the Worker author directly, and it is also used to make packages like FastAPI and Langchain work out-of-the-box, as we’ll show later in this post.

An FFI is a system for calling functions in one language that are implemented in another language. In most cases, an FFI is defined by a “higher-level” language in order to call functions implemented in a systems language, often C. Python’s ctypes module is such a system. These sorts of foreign function interfaces are often difficult to use because of the nature of C APIs.

Pyodide’s foreign function interface is an interface between Python and JavaScript, which are two high level object-oriented languages with a lot of design similarities. When passed from one language to another, immutable types such as strings and numbers are transparently translated. All mutable objects are wrapped in an appropriate proxy.

When a JavaScript object is passed into Python, Pyodide determines which JavaScript protocols the object supports and dynamically constructs an appropriate Python class that implements the corresponding Python protocols. For example, if the JavaScript object supports the JavaScript iteration protocol then the proxy will support the Python iteration protocol. If the JavaScript object is a Promise or other thenable, the Python object will be an awaitable.

from js import JSON

js_array = JSON.parse("[1,2,3]")

for entry in js_array:
   print(entry)

The lifecycle of a request to a Python Worker makes use of Pyodide’s FFI, wrapping the incoming JavaScript Request object in a JsProxy object that is accessible in your Python code. It then converts the value returned by the Python Worker’s handler into a JavaScript Response object that can be delivered back to the client:

Why dynamic linking is essential, and static linking isn’t enough

Python comes with a C FFI, and many Python packages use this FFI to import native libraries. These libraries are typically written in C, so they must first be compiled down to WebAssembly in order to work on the Workers runtime. As we noted above, Pyodide is built with Emscripten, which overrides Python’s C FFI — any time a package tries to load a native library, it is instead loaded from a WebAssembly module that is provided by the Workers runtime. Dynamic linking is what makes this possible — it is what lets us override Python’s C FFI, allowing Pyodide to support many Python packages that have native library dependencies.

Dynamic linking is “pay as you go”, while static linking is “pay upfront” — if code is statically linked into your binary, it must be loaded upfront in order for the binary to run, even if this code is never used.

Dynamic linking enables the Workers runtime to share the underlying WebAssembly modules of packages across different Workers that are running on the same machine.

We won’t go too much into detail on how dynamic linking works in Emscripten, but the main takeaway is that the Emscripten runtime fetches WebAssembly modules from a filesystem abstraction provided in JavaScript. For each Worker, we generate a filesystem at runtime, whose structure mimics a Python distribution that has the Worker’s dependencies installed, but whose underlying files are shared between Workers. This makes it possible to share Python and WebAssembly files between multiple Workers that import the same dependency. Today, we’re able to share these files across Workers, but copy them into each new isolate. We think we can go even further, by employing copy-on-write techniques to share the underlying resource across many Workers.

Supporting Server and Client libraries

Python has a wide variety of popular HTTP client libraries, including httpx, urllib3, requests and more. Unfortunately, none of them work out of the box in Pyodide. Adding support for these has been one of the longest running user requests for the Pyodide project. The Python HTTP client libraries all work with raw sockets, and the browser security model and CORS do not allow this, so we needed another way to make them work in the Workers runtime.

Async Client libraries

For libraries that can make requests asynchronously, including aiohttp and httpx, we can use the Fetch API to make requests. We do this by patching the library, instructing it to use the Fetch API from JavaScript — taking advantage of Pyodide’s FFI. The httpx patch ends up quite simple —fewer than 100 lines of code. Simplified even further, it looks like this:

from js import Headers, Request, fetch

def py_request_to_js_request(py_request):
    js_headers = Headers.new(py_request.headers)
    return Request.new(py_request.url, method=py_request.method, headers=js_headers)

def js_response_to_py_response(js_response):
  ... # omitted

async def do_request(py_request):
  js_request = py_request_to_js_request(py_request)
    js_response = await fetch(js_request)
    py_response = js_response_to_py_response(js_response)
    return py_response

Synchronous Client libraries

Another challenge in supporting Python HTTP client libraries is that many Python APIs are synchronous. For these libraries, we cannot use the fetch API directly because it is asynchronous.

Thankfully, Joe Marshall recently landed a contribution to urllib3 that adds Pyodide support in web browsers by:

  1. Checking if blocking with Atomics.wait() is possible
    a. If so, start a fetch worker thread
    b. Delegate the fetch operation to the worker thread and serialize the response into a SharedArrayBuffer
    c. In the Python thread, use Atomics.wait to block for the response in the SharedArrayBuffer
  2. If Atomics.wait() doesn’t work, fall back to a synchronous XMLHttpRequest

Despite this, today Cloudflare Workers do not support worker threads or synchronous XMLHttpRequest, so neither of these two approaches will work in Python Workers. We do not support synchronous requests today, but there is a way forward…

WebAssembly Stack Switching

There is an approach which will allow us to support synchronous requests. WebAssembly has a stage 3 proposal adding support for stack switching, which v8 has an implementation of. Pyodide contributors have been working on adding support for stack switching to Pyodide since September of 2022, and it is almost ready.

With this support, Pyodide exposes a function called run_sync which can block for completion of an awaitable:

from pyodide.ffi import run_sync

def sync_fetch(py_request):
   js_request = py_request_to_js_request(py_request)
   js_response  = run_sync(fetch(js_request))
   return js_response_to_py_response(js_response)

FastAPI and Python’s Asynchronous Server Gateway Interface

FastAPI is one of the most popular libraries for defining Python servers. FastAPI applications use a protocol called the Asynchronous Server Gateway Interface (ASGI). This means that FastAPI never reads from or writes to a socket itself. An ASGI application expects to be hooked up to an ASGI server, typically uvicorn. The ASGI server handles all of the raw sockets on the application’s behalf.

Conveniently for us, this means that FastAPI works in Cloudflare Workers without any patches or changes to FastAPI itself. We simply need to replace uvicorn with an appropriate ASGI server that can run within a Worker. Our initial implementation lives here, in the fork of Pyodide that we maintain. We hope to add a more comprehensive feature set, add test coverage, and then upstream this implementation into Pyodide.

You can try this yourself by cloning cloudflare/python-workers-examples, and running npx wrangler@latest dev in the directory of the FastAPI example.

Importing Python Packages

Python Workers support a subset of Python packages, which are provided directly by Pyodide, including numpy, httpx, FastAPI, Langchain, and more. This ensures compatibility with the Pyodide runtime by pinning package versions to Pyodide versions, and allows Pyodide to patch internal implementations, as we showed above in the case of httpx.

To import a package, simply add it to your requirements.txt file, without adding a version number. A specific version of the package is provided directly by Pyodide. Today, you can use packages in local development, and in the coming weeks, you will be able to deploy Workers that define dependencies in a requirements.txt file. Later in this post, we’ll show how we’re thinking about managing new versions of Pyodide and packages.

We maintain our own fork of Pyodide, which allows us to provide patches specific to the Workers runtime, and to quickly expand our support for packages in Python Workers, while also committing to upstreaming our changes back to Pyodide, so that the whole ecosystem of developers can benefit.

Python packages are often big and memory hungry though, and they can do a lot of work at import time. How can we ensure that you can bring in the packages you need, while mitigating long cold start times?

Making cold starts faster with memory snapshots

In the example at the start of this post, in local development, we mentioned injecting Pyodide into your Worker. Pyodide itself is 6.4MB — and Python packages can also be quite large.

If we simply shoved Pyodide into your Worker and uploaded it to Cloudflare, that’d be quite a large Worker to load into a new isolate — cold starts would be slow. On a fast computer with a good network connection, Pyodide takes about two seconds to initialize in a web browser, one second of network time and one second of cpu time. It wouldn’t be acceptable to initialize it every time you update your code for every isolate your Worker runs in across Cloudflare’s network.

Instead, when you run npx wrangler@latest deploy, the following happens:

  1. Wrangler uploads your Python code and your requirements.txt file to the Workers API
  2. We send your Python code, and your requirements.txt file to the Workers runtime to be validated
  3. We create a new isolate for your Worker, and automatically inject Pyodide plus any packages you’ve specified in your requirements.txt file.
  4. We scan the Worker’s code for import statements, execute them, and then take a snapshot of the Worker’s WebAssembly linear memory. Effectively, we perform the expensive work of importing packages at deploy time, rather than at runtime.
  5. We deploy this snapshot alongside your Worker’s Python code to Cloudflare’s network.
  6. Just like a JavaScript Worker, we execute the Worker’s top-level scope.

When a request comes in to your Worker, we load this snapshot and use it to bootstrap your Worker in an isolate, avoiding expensive initialization time:

This takes cold starts for a basic Python Worker down to below 1 second. We’re not yet satisfied with this though. We’re confident that we can drive this down much, much further. How? By reusing memory snapshots.

Reusing Memory Snapshots

When you upload a Python Worker, we generate a single memory snapshot of the Worker’s top-level imports, including both Pyodide and any dependencies. This snapshot is specific to your Worker. It can’t be shared, even though most of its contents are the same as other Python Workers.

Instead, we can create a single, shared snapshot ahead of time, and preload it into a pool of “pre-warmed” isolates. These isolates would already have the Pyodide runtime loaded and ready — making a Python Worker work just like a JavaScript Worker. In both cases, the underlying interpreter and execution environment is provided by the Workers runtime, and available on-demand without delay. The only difference is that with Python, the interpreter runs in WebAssembly, within the Worker.

Snapshots are a common pattern across runtimes and execution environments. Node.js uses V8 snapshots to speed up startup time. You can take snapshots of Firecracker microVMs and resume execution in a different process. There’s lots more we can do here — not just for Python Workers, but for Workers written in JavaScript as well, caching snapshots of compiled code from top-level scope and the state of the isolate itself. Workers are so fast and efficient that to-date we haven’t had to take snapshots in this way, but we think there are still big performance gains to be had.

This is our biggest lever towards driving cold start times down over the rest of 2024.

Future proofing compatibility with Pyodide versions and Compatibility Dates

When you deploy a Worker to Cloudflare, you expect it to keep running indefinitely, even if you never update it again. There are Workers deployed in 2018 that are still running just fine in production.

We achieve this using Compatibility Dates and Compatibility Flags, which provide explicit opt-in mechanisms for new behavior and potentially backwards-incompatible changes, without impacting existing Workers.

This works in part because it mirrors how the Internet and web browsers work. You publish a web page with some JavaScript, and rightly expect it to work forever. Web browsers and Cloudflare Workers have the same type of commitment of stability to developers.

There is a challenge with Python though — both Pyodide and CPython are versioned. Updated versions are published regularly and can contain breaking changes. And Pyodide provides a set of built-in packages, each with a pinned version number. This presents a question — how should we allow you to update your Worker to a newer version of Pyodide?

The answer is Compatibility Dates and Compatibility Flags.

A new version of Python is released every year in August, and a new version of Pyodide is released six (6) months later. When this new version of Pyodide is published, we will add it to Workers by gating it behind a Compatibility Flag, which is only enabled after a specified Compatibility Date. This lets us continually provide updates, without risk of breaking changes, extending the commitment we’ve made for JavaScript to Python.

Each Python release has a five (5) year support window. Once this support window has passed for a given version of Python, security patches are no longer applied, making this version unsafe to rely on. To mitigate this risk, while still trying to hold as true as possible to our commitment of stability and long-term support, after five years any Python Worker still on a Python release that is outside of the support window will be automatically moved forward to the next oldest Python release. Python is a mature and stable language, so we expect that in most cases, your Python Worker will continue running without issue. But we recommend updating the compatibility date of your Worker regularly, to stay within the support window.

In between Python releases, we also expect to update and add additional Python packages, using the same opt-in mechanism. A Compatibility Flag will be a combination of the Python version and the release date of a set of packages. For example, python_3.17_packages_2025_03_01.

How bindings work in Python Workers

We mentioned earlier that Pyodide provides a foreign function interface (FFI) to JavaScript — meaning that you can directly use JavaScript objects, methods, functions and more, directly from Python.

This means that from day one, all binding APIs to other Cloudflare resources are supported in Cloudflare Workers. The env object that is provided by handlers in Python Workers is a JavaScript object that Pyodide provides a proxy API to, handling type translations across languages automatically.

For example, to write to and read from a KV namespace from a Python Worker, you would write:

from js import Response

async def on_fetch(request, env):
    await env.FOO.put("bar", "baz")
    bar = await env.FOO.get("bar")
    return Response.new(bar) # returns "baz"

This works for Web APIs too — see how Response is imported from the js module? You can import any global from JavaScript this way.

Get this JavaScript out of my Python!

You’re probably reading this post because you want to write Python instead of JavaScript. from js import Response just isn’t Pythonic. We know — and we have actually tackled this challenge before for another language (Rust). And we think we can do this even better for Python.

We launched workers-rs in 2021 to make it possible to write Workers in Rust. For each JavaScript API in Workers, we, alongside open-source contributors, have written bindings that expose a more idiomatic Rust API.

We plan to do the same for Python Workers — starting with the bindings to Workers AI and Vectorize. But while workers-rs requires that you use and update an external dependency, the APIs we provide with Python Workers will be built into the Workers runtime directly. Just update your compatibility date, and get the latest, most Pythonic APIs.

This is about more than just making bindings to resources on Cloudflare more Pythonic though — it’s about compatibility with the ecosystem.

Similar to how we recently converted workers-rs to use types from the http crate, which makes it easy to use the axum crate for routing, we aim to do the same for Python Workers. For example, the Python standard library provides a raw socket API, which many Python packages depend on. Workers already provides connect(), a JavaScript API for working with raw sockets. We see ways to provide at least a subset of the Python standard library’s socket API in Workers, enabling a broader set of Python packages to work on Workers, with less of a need for patches.

But ultimately, we hope to kick start an effort to create a standardized serverless API for Python. One that is easy to use for any Python developer and offers the same capabilities as JavaScript.

We’re just getting started with Python Workers

Providing true support for a new programming language is a big investment that goes far beyond making “hello world” work. We chose Python very intentionally — it’s the second most popular programming language after JavaScript — and we are committed to continuing to improve performance and widen our support for Python packages.

We’re grateful to the Pyodide maintainers and the broader Python community — and we’d love to hear from you. Drop into the Python Workers channel in the Cloudflare Developers Discord, or start a discussion on Github about what you’d like to see next and which Python packages you’d like us to support.

Top Architecture Blog Posts of 2023

Post Syndicated from Andrea Courtright original https://aws.amazon.com/blogs/architecture/top-architecture-blog-posts-of-2023/

2023 was a rollercoaster year in tech, and we at the AWS Architecture Blog feel so fortunate to have shared in the excitement. As we move into 2024 and all of the new technologies we could see, we want to take a moment to highlight the brightest stars from 2023.

As always, thanks to our readers and to the many talented and hardworking Solutions Architects and other contributors to our blog.

I give you our 2023 cream of the crop!

#10: Build a serverless retail solution for endless aisle on AWS

In this post, Sandeep and Shashank help retailers and their customers alike in this guided approach to finding inventory that doesn’t live on shelves.

Building endless aisle architecture for order processing

Figure 1. Building endless aisle architecture for order processing

Check it out!

#9: Optimizing data with automated intelligent document processing solutions

Who else dreads wading through large amounts of data in multiple formats? Just me? I didn’t think so. Using Amazon AI/ML and content-reading services, Deependra, Anirudha, Bhajandeep, and Senaka have created a solution that is scalable and cost-effective to help you extract the data you need and store it in a format that works for you.

AI-based intelligent document processing engine

Figure 2: AI-based intelligent document processing engine

Check it out!

#8: Disaster Recovery Solutions with AWS managed services, Part 3: Multi-Site Active/Passive

Disaster recovery posts are always popular, and this post by Brent and Dhruv is no exception. Their creative approach in part 3 of this series is most helpful for customers who have business-critical workloads with higher availability requirements.

Warm standby with managed services

Figure 3. Warm standby with managed services

Check it out!

#7: Simulating Kubernetes-workload AZ failures with AWS Fault Injection Simulator

Continuing with the theme of “when bad things happen,” we have Siva, Elamaran, and Re’s post about preparing for workload failures. If resiliency is a concern (and it really should be), the secret is test, test, TEST.

Architecture flow for Microservices to simulate a realistic failure scenario

Figure 4. Architecture flow for Microservices to simulate a realistic failure scenario

Check it out!

#6: Let’s Architect! Designing event-driven architectures

Luca, Laura, Vittorio, and Zamira weren’t content with their four top-10 spots last year – they’re back with some things you definitely need to know about event-driven architectures.

Let's Architect

Figure 5. Let’s Architect artwork

Check it out!

#5: Use a reusable ETL framework in your AWS lake house architecture

As your lake house increases in size and complexity, you could find yourself facing maintenance challenges, and Ashutosh and Prantik have a solution: frameworks! The reusable ETL template with AWS Glue templates might just save you a headache or three.

Reusable ETL framework architecture

Figure 6. Reusable ETL framework architecture

Check it out!

#4: Invoking asynchronous external APIs with AWS Step Functions

It’s possible that AWS’ menagerie of services doesn’t have everything you need to run your organization. (Possible, but not likely; we have a lot of amazing services.) If you are using third-party APIs, then Jorge, Hossam, and Shirisha’s architecture can help you maintain a secure, reliable, and cost-effective relationship among all involved.

Invoking Asynchronous External APIs architecture

Figure 7. Invoking Asynchronous External APIs architecture

Check it out!

#3: Announcing updates to the AWS Well-Architected Framework

The Well-Architected Framework continues to help AWS customers evaluate their architectures against its six pillars. They are constantly striving for improvement, and Haleh’s diligence in keeping us up to date has not gone unnoticed. Thank you, Haleh!

Well-Architected logo

Figure 8. Well-Architected logo

Check it out!

#2: Let’s Architect! Designing architectures for multi-tenancy

The practically award-winning Let’s Architect! series strikes again! This time, Luca, Laura, Vittorio, and Zamira were joined by Federica to discuss multi-tenancy and why that concept is so crucial for SaaS providers.

Let's Architect

Figure 9. Let’s Architect

Check it out!

And finally…

#1: Understand resiliency patterns and trade-offs to architect efficiently in the cloud

Haresh, Lewis, and Bonnie revamped this 2022 post into a masterpiece that completely stole our readers’ hearts and is among the top posts we’ve ever made!

Resilience patterns and trade-offs

Figure 10. Resilience patterns and trade-offs

Check it out!

Bonus! Three older special mentions

These three posts were published before 2023, but we think they deserve another round of applause because you, our readers, keep coming back to them.

Thanks again to everyone for their contributions during a wild year. We hope you’re looking forward to the rest of 2024 as much as we are!

Best practices for managing Terraform State files in AWS CI/CD Pipeline

Post Syndicated from Arun Kumar Selvaraj original https://aws.amazon.com/blogs/devops/best-practices-for-managing-terraform-state-files-in-aws-ci-cd-pipeline/

Introduction

Today customers want to reduce manual operations for deploying and maintaining their infrastructure. The recommended method to deploy and manage infrastructure on AWS is to follow Infrastructure-As-Code (IaC) model using tools like AWS CloudFormation, AWS Cloud Development Kit (AWS CDK) or Terraform.

One of the critical components in terraform is managing the state file which keeps track of your configuration and resources. When you run terraform in an AWS CI/CD pipeline the state file has to be stored in a secured, common path to which the pipeline has access to. You need a mechanism to lock it when multiple developers in the team want to access it at the same time.

In this blog post, we will explain how to manage terraform state files in AWS, best practices on configuring them in AWS and an example of how you can manage it efficiently in your Continuous Integration pipeline in AWS when used with AWS Developer Tools such as AWS CodeCommit and AWS CodeBuild. This blog post assumes you have a basic knowledge of terraform, AWS Developer Tools and AWS CI/CD pipeline. Let’s dive in!

Challenges with handling state files

By default, the state file is stored locally where terraform runs, which is not a problem if you are a single developer working on the deployment. However if not, it is not ideal to store state files locally as you may run into following problems:

  • When working in teams or collaborative environments, multiple people need access to the state file
  • Data in the state file is stored in plain text which may contain secrets or sensitive information
  • Local files can get lost, corrupted, or deleted

Best practices for handling state files

The recommended practice for managing state files is to use terraform’s built-in support for remote backends. These are:

Remote backend on Amazon Simple Storage Service (Amazon S3): You can configure terraform to store state files in an Amazon S3 bucket which provides a durable and scalable storage solution. Storing on Amazon S3 also enables collaboration that allows you to share state file with others.

Remote backend on Amazon S3 with Amazon DynamoDB: In addition to using an Amazon S3 bucket for managing the files, you can use an Amazon DynamoDB table to lock the state file. This will allow only one person to modify a particular state file at any given time. It will help to avoid conflicts and enable safe concurrent access to the state file.

There are other options available as well such as remote backend on terraform cloud and third party backends. Ultimately, the best method for managing terraform state files on AWS will depend on your specific requirements.

When deploying terraform on AWS, the preferred choice of managing state is using Amazon S3 with Amazon DynamoDB.

AWS configurations for managing state files

  1. Create an Amazon S3 bucket using terraform. Implement security measures for Amazon S3 bucket by creating an AWS Identity and Access Management (AWS IAM) policy or Amazon S3 Bucket Policy. Thus you can restrict access, configure object versioning for data protection and recovery, and enable AES256 encryption with SSE-KMS for encryption control.
  1. Next create an Amazon DynamoDB table using terraform with Primary key set to LockID. You can also set any additional configuration options such as read/write capacity units. Once the table is created, you will configure the terraform backend to use it for state locking by specifying the table name in the terraform block of your configuration.
  1. For a single AWS account with multiple environments and projects, you can use a single Amazon S3 bucket. If you have multiple applications in multiple environments across multiple AWS accounts, you can create one Amazon S3 bucket for each account. In that Amazon S3 bucket, you can create appropriate folders for each environment, storing project state files with specific prefixes.

Now that you know how to handle terraform state files on AWS, let’s look at an example of how you can configure them in a Continuous Integration pipeline in AWS.

Architecture

Architecture on how to use terraform in an AWS CI pipeline

Figure 1: Example architecture on how to use terraform in an AWS CI pipeline

This diagram outlines the workflow implemented in this blog:

  1. The AWS CodeCommit repository contains the application code
  2. The AWS CodeBuild job contains the buildspec files and references the source code in AWS CodeCommit
  3. The AWS Lambda function contains the application code created after running terraform apply
  4. Amazon S3 contains the state file created after running terraform apply. Amazon DynamoDB locks the state file present in Amazon S3

Implementation

Pre-requisites

Before you begin, you must complete the following prerequisites:

Setting up the environment

  1. You need an AWS access key ID and secret access key to configure AWS CLI. To learn more about configuring the AWS CLI, follow these instructions.
  2. Clone the repo for complete example: git clone https://github.com/aws-samples/manage-terraform-statefiles-in-aws-pipeline
  3. After cloning, you could see the following folder structure:
AWS CodeCommit repository structure

Figure 2: AWS CodeCommit repository structure

Let’s break down the terraform code into 2 parts – one for preparing the infrastructure and another for preparing the application.

Preparing the Infrastructure

  1. The main.tf file is the core component that does below:
      • It creates an Amazon S3 bucket to store the state file. We configure bucket ACL, bucket versioning and encryption so that the state file is secure.
      • It creates an Amazon DynamoDB table which will be used to lock the state file.
      • It creates two AWS CodeBuild projects, one for ‘terraform plan’ and another for ‘terraform apply’.

    Note – It also has the code block (commented out by default) to create AWS Lambda which you will use at a later stage.

  1. AWS CodeBuild projects should be able to access Amazon S3, Amazon DynamoDB, AWS CodeCommit and AWS Lambda. So, the AWS IAM role with appropriate permissions required to access these resources are created via iam.tf file.
  1. Next you will find two buildspec files named buildspec-plan.yaml and buildspec-apply.yaml that will execute terraform commands – terraform plan and terraform apply respectively.
  1. Modify AWS region in the provider.tf file.
  1. Update Amazon S3 bucket name, Amazon DynamoDB table name, AWS CodeBuild compute types, AWS Lambda role and policy names to required values using variable.tf file. You can also use this file to easily customize parameters for different environments.

With this, the infrastructure setup is complete.

You can use your local terminal and execute below commands in the same order to deploy the above-mentioned resources in your AWS account.

terraform init
terraform validate
terraform plan
terraform apply

Once the apply is successful and all the above resources have been successfully deployed in your AWS account, proceed with deploying your application. 

Preparing the Application

  1. In the cloned repository, use the backend.tf file to create your own Amazon S3 backend to store the state file. By default, it will have below values. You can override them with your required values.
bucket = "tfbackend-bucket" 
key    = "terraform.tfstate" 
region = "eu-central-1"
  1. The repository has sample python code stored in main.py that returns a simple message when invoked.
  1. In the main.tf file, you can find the below block of code to create and deploy the Lambda function that uses the main.py code (uncomment these code blocks).
data "archive_file" "lambda_archive_file" {
    ……
}

resource "aws_lambda_function" "lambda" {
    ……
}
  1. Now you can deploy the application using AWS CodeBuild instead of running terraform commands locally which is the whole point and advantage of using AWS CodeBuild.
  1. Run the two AWS CodeBuild projects to execute terraform plan and terraform apply again.
  1. Once successful, you can verify your deployment by testing the code in AWS Lambda. To test a lambda function (console):
    • Open AWS Lambda console and select your function “tf-codebuild”
    • In the navigation pane, in Code section, click Test to create a test event
    • Provide your required name, for example “test-lambda”
    • Accept default values and click Save
    • Click Test again to trigger your test event “test-lambda”

It should return the sample message you provided in your main.py file. In the default case, it will display “Hello from AWS Lambda !” message as shown below.

Sample Amazon Lambda function response

Figure 3: Sample Amazon Lambda function response

  1. To verify your state file, go to Amazon S3 console and select the backend bucket created (tfbackend-bucket). It will contain your state file.
Amazon S3 bucket with terraform state file

Figure 4: Amazon S3 bucket with terraform state file

  1. Open Amazon DynamoDB console and check your table tfstate-lock and it will have an entry with LockID.
Amazon DynamoDB table with LockID

Figure 5: Amazon DynamoDB table with LockID

Thus, you have securely stored and locked your terraform state file using terraform backend in a Continuous Integration pipeline.

Cleanup

To delete all the resources created as part of the repository, run the below command from your terminal.

terraform destroy

Conclusion

In this blog post, we explored the fundamentals of terraform state files, discussed best practices for their secure storage within AWS environments and also mechanisms for locking these files to prevent unauthorized team access. And finally, we showed you an example of how efficiently you can manage them in a Continuous Integration pipeline in AWS.

You can apply the same methodology to manage state files in a Continuous Delivery pipeline in AWS. For more information, see CI/CD pipeline on AWS, Terraform backends types, Purpose of terraform state.

Arun Kumar Selvaraj

Arun Kumar Selvaraj is a Cloud Infrastructure Architect with AWS Professional Services. He loves building world class capability that provides thought leadership, operating standards and platform to deliver accelerated migration and development paths for his customers. His interests include Migration, CCoE, IaC, Python, DevOps, Containers and Networking.

Manasi Bhutada

Manasi Bhutada is an ISV Solutions Architect based in the Netherlands. She helps customers design and implement well architected solutions in AWS that address their business problems. She is passionate about data analytics and networking. Beyond work she enjoys experimenting with food, playing pickleball, and diving into fun board games.

Introducing zabbix_utils – the official Python library for Zabbix API

Post Syndicated from Aleksandr Iantsen original https://blog.zabbix.com/python-zabbix-utils/27056/

Zabbix is a flexible and universal monitoring solution that integrates with a wide variety of different systems right out of the box. Despite actively expanding the list of natively supported systems for integration (via templates or webhook integrations), there may still be a need to integrate with custom systems and services that are not yet supported. In such cases, a library taking care of implementing interaction protocols with the Zabbix API, Zabbix server/proxy, or Agent/Agent2 becomes extremely useful. Given that Python is widely adopted among DevOps and SRE engineers as well as server administrators, we decided to release a library for this programming language first.

We are pleased to introduce zabbix_utils – a Python library for seamless interaction with Zabbix API, Zabbix server/proxy, and Zabbix Agent/Agent2. Of course, there are popular community solutions for working with these Zabbix components in Python. Keeping this fact in mind, we have tried to consolidate popular issues and cases along with our experience to develop as convenient a tool as possible. Furthermore, we made sure that transitioning to the tool is as straightforward and clear as possible. Thanks to official support, you can be confident that the current version of the library is compatible with the latest Zabbix release.

In this article, we will introduce you to the main capabilities of the library and provide examples of how to use it with Zabbix components.

Usage Scenarios

The zabbix_utils library can be used in the following scenarios, but is not limited to them:

  • Zabbix automation
  • Integration with third-party systems
  • Custom monitoring solutions
  • Data export (hosts, templates, problems, etc.)
  • Integration into your Python application for Zabbix monitoring support
  • Anything else that comes to mind

You can use zabbix_utils for automating Zabbix tasks, such as scripting the automatic monitoring setup of your IT infrastructure objects. This can involve using ZabbixAPI for the direct management of Zabbix objects, Sender for sending values to hosts, and Getter for gathering data from Agents. We will discuss Sender and Getter in more detail later in this article.

For example, let’s imagine you have an infrastructure consisting of different branches. Each server or workstation is deployed from an image with an automatically configured Zabbix Agent and each branch is monitored by a Zabbix proxy since it has an isolated network. Your custom service or script can fetch a list of this equipment from your CMDB system, along with any additional information. It can then use this data to create hosts in Zabbix and link the necessary templates using ZabbixAPI based on the received information. If the information from CMDB is insufficient, you can request data directly from the configured Zabbix Agent using Getter and then use this information for further configuration and decision-making during setup. Another part of your script can access AD to get a list of branch users to update the list of users in Zabbix through the API and assign them the appropriate permissions and roles based on information from AD or CMDB (e.g., editing rights for server owners).

Another use case of the library may be when you regularly export templates from Zabbix for subsequent import into a version control system. You can also establish a mechanism for loading changes and rolling back to previous versions of templates. Here a variety of other use cases can also be implemented – it’s all up to your requirements and the creative usage of the library.

Of course, if you are a developer and there is a requirement to implement Zabbix monitoring support for your custom system or tool, you can implement sending data describing any events generated by your custom system/tool to Zabbix using Sender.

Installation and Configuration

To begin with, you need to install the zabbix_utils library. You can do this in two main ways:

  • By using pip:
~$ pip install zabbix_utils
  • By cloning from GitHub:
~$ git clone https://github.com/zabbix/python-zabbix-utils
~$ cd python-zabbix-utils/
~$ python setup.py install

No additional configuration is required. But you can specify values for the following environment variables: ZABBIX_URL, ZABBIX_TOKEN, ZABBIX_USER, ZABBIX_PASSWORD if you need. These use cases are described in more detail below.

Working with Zabbix API

To work with Zabbix API, it is necessary to import the ZabbixAPI class from the zabbix_utils library:

from zabbix_utils import ZabbixAPI

If you are using one of the existing popular community libraries, in most cases, it will be sufficient to simply replace the ZabbixAPI import statement with an import from our library.

At that point you need to create an instance of the ZabbixAPI class. T4here are several usage scenarios:

  • Use preset values of environment variables, i.e., not pass any parameters to ZabbixAPI:
~$ export ZABBIX_URL="https://zabbix.example.local"
~$ export ZABBIX_USER="Admin"
~$ export ZABBIX_PASSWORD="zabbix"
from zabbix_utils import ZabbixAPI


api = ZabbixAPI()
  • Pass only the Zabbix API address as input, which can be specified as either the server IP/FQDN address or DNS name (in this case, the HTTP protocol will be used) or as an URL, and the authentication data should still be specified as values for environment variables:
~$ export ZABBIX_USER="Admin"
~$ export ZABBIX_PASSWORD="zabbix"
from zabbix_utils import ZabbixAPI

api = ZabbixAPI(url="127.0.0.1")
  • Pass only the Zabbix API address to ZabbixAPI, as in the example above, and pass the authentication data later using the login() method:
from zabbix_utils import ZabbixAPI

api = ZabbixAPI(url="127.0.0.1")
api.login(user="Admin", password="zabbix")
  • Pass all parameters at once when creating an instance of ZabbixAPI; in this case, there is no need to subsequently call login():
from zabbix_utils import ZabbixAPI

api = ZabbixAPI(
    url="127.0.0.1",
    user="Admin",
    password="zabbix"
)

The ZabbixAPI class supports working with various Zabbix versions, automatically checking the API version during initialization. You can also work with the Zabbix API version as an object as follows:

from zabbix_utils import ZabbixAPI

api = ZabbixAPI()

# ZabbixAPI version field
ver = api.version
print(type(ver).__name__, ver) # APIVersion 6.0.24

# Method to get ZabbixAPI version
ver = api.api_version()
print(type(ver).__name__, ver) # APIVersion 6.0.24

# Additional methods
print(ver.major)    # 6.0
print(ver.minor)    # 24
print(ver.is_lts()) # True

As a result, you will get an APIVersion object that has major and minor fields returning the respective minor and major parts of the current version, as well as the is_lts() method, returning true if the current version is LTS (Long Term Support), and false otherwise. The APIVersion object can also be compared to a version represented as a string or a float number:

# Version comparison
print(ver < 6.4)      # True
print(ver != 6.0)     # False
print(ver != "6.0.5") # True

If the account and password (or starting from Zabbix 5.4 – token instead of login/password) are not set as environment variable values or during the initialization of ZabbixAPI, then it is necessary to call the login() method for authentication:

from zabbix_utils import ZabbixAPI

api = ZabbixAPI(url="127.0.0.1")
api.login(token="xxxxxxxx")

After authentication, you can make any API requests described for all supported versions in the Zabbix documentation.

The format for calling API methods looks like this:

api_instance.zabbix_object.method(parameters)

For example:

api.host.get()

After completing all the necessary API requests, it’s necessary to execute logout() if authentication was done using login and password:

api.logout()

More examples of usage can be found here.

Sending Values to Zabbix Server/Proxy

There is often a need to send values to Zabbix Trapper. For this purpose, the zabbix_sender utility is provided. However, if your service or script sending this data is written in Python, calling an external utility may not be very convenient. Therefore, we have developed the Sender, which will help you send values to Zabbix server or proxy one by one or in groups. To work with Sender, you need to import it as follows:

from zabbix_utils import Sender

After that, you can send a single value:

from zabbix_utils import Sender

sender = Sender(server='127.0.0.1', port=10051)
resp = sender.send_value('example_host', 'example.key', 50, 1702511920)

Alternatively, you can put them into a group for simultaneous sending, for which you need to additionally import ItemValue:

from zabbix_utils import ItemValue, Sender


items = [
    ItemValue('host1', 'item.key1', 10),
    ItemValue('host1', 'item.key2', 'Test value'),
    ItemValue('host2', 'item.key1', -1, 1702511920),
    ItemValue('host3', 'item.key1', '{"msg":"Test value"}'),
    ItemValue('host2', 'item.key1', 0, 1702511920, 100)
]

sender = Sender('127.0.0.1', 10051)
response = sender.send(items)

For cases when there is a necessity to send more values than Zabbix Trapper can accept at one time, there is an option for fragmented sending, i.e. sequential sending in separate fragments (chunks). By default, the chunk size is set to 250 values. In other words, when sending values in bulk, the 400 values passed to the send() method for sending will be sent in two stages. 250 values will be sent first, and the remaining 150 values will be sent after receiving a response. The chunk size can be changed, to do this, you simply need to specify your value for the chunk_size parameter when initializing Sender:

from zabbix_utils import ItemValue, Sender


items = [
    ItemValue('host1', 'item.key1', 10),
    ItemValue('host1', 'item.key2', 'Test value'),
    ItemValue('host2', 'item.key1', -1, 1702511920),
    ItemValue('host3', 'item.key1', '{"msg":"Test value"}'),
    ItemValue('host2', 'item.key1', 0, 1702511920, 100)
]

sender = Sender('127.0.0.1', 10051, chunk_size=2)
response = sender.send(items)

In the example above, the chunk size is set to 2. So, 5 values passed will be sent in three requests of two, two, and one value, respectively.

If your server has multiple network interfaces, and values need to be sent from a specific one, the Sender provides the option to specify a source_ip for the sent values:

from zabbix_utils import Sender

sender = Sender(
    server='zabbix.example.local',
    port=10051,
    source_ip='10.10.7.1'
)
resp = sender.send_value('example_host', 'example.key', 50, 1702511920)

It also supports reading connection parameters from the Zabbix Agent/Agent2 configuration file. To do this, set the use_config flag, after which it is not necessary to pass connection parameters when creating an instance of Sender:

from zabbix_utils import Sender

sender = Sender(
    use_config=True,
    config_path='/etc/zabbix/zabbix_agent2.conf'
)
response = sender.send_value('example_host', 'example.key', 50, 1702511920)

Since the Zabbix Agent/Agent2 configuration file can specify one or even several Zabbix clusters consisting of multiple Zabbix server instances, Sender will send data to the first available server of each cluster specified in the ServerActive parameter in the configuration file. In case the ServerActive parameter is not specified in the Zabbix Agent/Agent2 configuration file, the server address from the Server parameter with the standard Zabbix Trapper port – 10051 will be taken.

By default, Sender returns the aggregated result of sending across all clusters. But it is possible to get more detailed information about the results of sending for each chunk and each cluster:

print(response)
# {"processed": 2, "failed": 0, "total": 2, "time": "0.000108", "chunk": 2}

if response.failed == 0:
    print(f"Value sent successfully in {response.time}")
else:
    print(response.details)
    # {
    #     127.0.0.1:10051: [
    #         {
    #             "processed": 1,
    #             "failed": 0,
    #             "total": 1,
    #             "time": "0.000051",
    #             "chunk": 1
    #         }
    #     ],
    #     zabbix.example.local:10051: [
    #         {
    #             "processed": 1,
    #             "failed": 0,
    #             "total": 1,
    #             "time": "0.000057",
    #             "chunk": 1
    #         }
    #     ]
    # }
    for node, chunks in response.details.items():
        for resp in chunks:
            print(f"processed {resp.processed} of {resp.total} at {node.address}:{node.port}")
            # processed 1 of 1 at 127.0.0.1:10051
            # processed 1 of 1 at zabbix.example.local:10051

More usage examples can be found here.

Getting values from Zabbix Agent/Agent2 by item key.

Sometimes it can also be useful to directly retrieve values from the Zabbix Agent. To assist with this task, zabbix_utils provides the Getter. It performs the same function as the zabbix_get utility, allowing you to work natively within Python code. Getter is straightforward to use; just import it, create an instance by passing the Zabbix Agent’s address and port, and then call the get() method, providing the data item key for the value you want to retrieve:

from zabbix_utils import Getter

agent = Getter('10.8.54.32', 10050)
resp = agent.get('system.uname')

In cases where your server has multiple network interfaces, and requests need to be sent from a specific one, you can specify the source_ip for the Agent connection:

from zabbix_utils import Getter

agent = Getter(
    host='zabbix.example.local',
    port=10050,
    source_ip='10.10.7.1'
)
resp = agent.get('system.uname')

The response from the Zabbix Agent will be processed by the library and returned as an object of the AgentResponse class:

print(resp)
# {
#     "error": null,
#     "raw": "Linux zabbix_server 5.15.0-3.60.5.1.el9uek.x86_64",
#     "value": "Linux zabbix_server 5.15.0-3.60.5.1.el9uek.x86_64"
# }

print(resp.error)
# None

print(resp.value)
# Linux zabbix_server 5.15.0-3.60.5.1.el9uek.x86_64

More usage examples can be found here.

Conclusions

The zabbix_utils library for Python allows you to take full advantage of monitoring using Zabbix, without limiting yourself to the integrations available out of the box. It can be valuable for both DevOps and SRE engineers, as well as Python developers looking to implement monitoring support for their system using Zabbix.

In the next article, we will thoroughly explore integration with an external service using this library to demonstrate the capabilities of zabbix_utils more comprehensively.

Questions

Q: Which Agent versions are supported for Getter?

A: Supported versions of Zabbix Agents are the same as Zabbix API versions, as specified in the readme file. Our goal is to create a library with full support for all Zabbix components of the same version.

Q: Does Getter support Agent encryption?

A: Encryption support is not yet built into Sender and Getter, but you can create your wrapper using third-party libraries for both.

from zabbix_utils import Sender

def psk_wrapper(sock, tls):
    # ...
    # Implementation of TLS PSK wrapper for the socket
    # ...

sender = Sender(
    server='zabbix.example.local',
    port=10051,
    socket_wrapper=psk_wrapper
)

More examples can be found here.

Q: Is it possible to set a timeout value for Getter?

A: The response timeout value can be set for the Getter, as well as for ZabbixAPI and Sender. In all cases, the timeout is set for waiting for any responses to requests.

# Example of setting a timeout for Sender
sender = Sender(server='127.0.0.1', port=10051, timeout=30)

# Example of setting a timeout for Getter
agent = Getter(host='127.0.0.1', port=10050, timeout=30)

Q: Is parallel (asynchronous) mode supported?

A: Currently, the library does not include asynchronous classes and methods, but we plan to develop asynchronous versions of ZabbixAPI and Sender.

Q: Is it possible to specify multiple servers when sending through Sender without specifying a configuration file (for working with an HA cluster)?

A: Yes, it’s possible by the following way:

from zabbix_utils import Sender


zabbix_clusters = [
    [
        'zabbix.cluster1.node1',
        'zabbix.cluster1.node2:10051'
    ],
    [
        'zabbix.cluster2.node1:10051',
        'zabbix.cluster2.node2:20051',
        'zabbix.cluster2.node3'
    ]
]

sender = Sender(clusters=zabbix_clusters)
response = sender.send_value('example_host', 'example.key', 10, 1702511922)

print(response)
# {"processed": 2, "failed": 0, "total": 2, "time": "0.000103", "chunk": 2}

print(response.details)
# {
#     "zabbix.cluster1.node1:10051": [
#         {
#             "processed": 1,
#             "failed": 0,
#             "total": 1,
#             "time": "0.000050",
#             "chunk": 1
#         }
#     ],
#     "zabbix.cluster2.node2:20051": [
#         {
#             "processed": 1,
#             "failed": 0,
#             "total": 1,
#             "time": "0.000053",
#             "chunk": 1
#         }
#     ]
# }

The post Introducing zabbix_utils – the official Python library for Zabbix API appeared first on Zabbix Blog.

Building resilient serverless applications using chaos engineering

Post Syndicated from Marcia Villalba original https://aws.amazon.com/blogs/compute/building-resilient-serverless-applications-using-chaos-engineering/

This post is written by Suranjan Choudhury (Head of TME and ITeS SA) and Anil Sharma (Sr PSA, Migration) 

Chaos engineering is the process of stressing an application in testing or production environments by creating disruptive events, such as outages, observing how the system responds, and implementing improvements. Chaos engineering helps you create the real-world conditions needed to uncover hidden issues and performance bottlenecks that are challenging to find in distributed applications.

You can build resilient distributed serverless applications using AWS Lambda and test Lambda functions in real world operating conditions using chaos engineering.  This blog shows an approach to inject chaos in Lambda functions, making no change to the Lambda function code. This blog uses the AWS Fault Injection Simulator (FIS) service to create experiments that inject disruptions for Lambda based serverless applications.

AWS FIS is a managed service that performs fault injection experiments on your AWS workloads. AWS FIS is used to set up and run fault experiments that simulate real-world conditions to discover application issues that are difficult to find otherwise. You can improve application resilience and performance using results from FIS experiments.

The sample code in this blog introduces random faults to existing Lambda functions, like an increase in response times (latency) or random failures. You can observe application behavior under introduced chaos and make improvements to the application.

Approaches to inject chaos in Lambda functions

AWS FIS currently does not support injecting faults in Lambda functions. However, there are two main approaches to inject chaos in Lambda functions: using external libraries or using Lambda layers.

Developers have created libraries to introduce failure conditions to Lambda functions, such as chaos_lambda and failure-Lambda. These libraries allow developers to inject elements of chaos into Python and Node.js Lambda functions. To inject chaos using these libraries, developers must decorate the existing Lambda function’s code. Decorator functions wrap the existing Lambda function, adding chaos at runtime. This approach requires developers to change the existing Lambda functions.

You can also use Lambda layers to inject chaos, requiring no change to the function code, as the fault injection is separated. Since the Lambda layer is deployed separately, you can independently change the element of chaos, like latency in response or failure of the Lambda function. This blog post discusses this approach.

Injecting chaos in Lambda functions using Lambda layers

A Lambda layer is a .zip file archive that contains supplementary code or data. Layers usually contain library dependencies, a custom runtime, or configuration files. This blog creates an FIS experiment that uses Lambda layers to inject disruptions in existing Lambda functions for Java, Node.js, and Python runtimes.

The Lambda layer contains the fault injection code. It is invoked prior to invocation of the Lambda function and injects random latency or errors. Injecting random latency simulates real world unpredictable conditions. The Java, Node.js, and Python chaos injection layers provided are generic and reusable. You can use them to inject chaos in your Lambda functions.

The Chaos Injection Lambda Layers

Java Lambda Layer for Chaos Injection

Java Lambda Layer for Chaos Injection

The chaos injection layer for Java Lambda functions uses the JAVA_TOOL_OPTIONS environment variable. This environment variable allows specifying the initialization of tools, specifically the launching of native or Java programming language agents. The JAVA_TOOL_OPTIONS has a javaagent parameter that points to the chaos injection layer. This layer uses Java’s premain method and the Byte Buddy library for modifying the Lambda function’s Java class during runtime.

When the Lambda function is invoked, the JVM uses the class specified with the javaagent parameter and invokes its premain method before the Lambda function’s handler invocation. The Java premain method injects chaos before Lambda runs.

The FIS experiment adds the layer association and the JAVA_TOOL_OPTIONS environment variable to the Lambda function.

Python and Node.js Lambda Layer for Chaos Injection

Python and Node.js Lambda Layer for Chaos Injection

When injecting chaos in Python and Node.js functions, the Lambda function’s handler is replaced with a function in the respective layers by the FIS aws:ssm:start-automation-execution action. The automation, which is an SSM document, saves the original Lambda function’s handler to in AWS Systems Manager Parameter Store, so that the changes can be rolled back once the experiment is finished.

The layer function contains the logic to inject chaos. At runtime, the layer function is invoked, injecting chaos in the Lambda function. The layer function in turn invokes the Lambda function’s original handler, so that the functionality is fulfilled.

The result in all runtimes (Java, Python, or Node.js), is invocation of the original Lambda function with latency or failure injected. The observed changes are random latency or failure injected by the layer.

Once the experiment is completed, an SSM document is provided. This rolls back the layer’s association to the Lambda function and removes the environment variable, in the case of the Java runtime.

Sample FIS experiments using SSM and Lambda layers

In the sample code provided, Lambda layers are provided for Python, Node.js and Java runtimes along with sample Lambda functions for each runtime.

The sample deploys the Lambda layers and the Lambda functions, FIS experiment template, AWS Identity and Access Management (IAM) roles needed to run the experiment, and the AWS Systems Manger (SSM) Documents. AWS CloudFormation template is provided for deployment.

Step 1: Complete the prerequisites

  • To deploy the sample code, clone the repository locally:
    git clone https://github.com/aws-samples/chaosinjection-lambda-samples.git
  • Complete the prerequisites documented here.

Step 2: Deploy using AWS CloudFormation

The CloudFormation template provided along with this blog deploys sample code. Execute runCfn.sh.

When this is complete, it returns the StackId that CloudFormation created:

Step 3: Run the chaos injection experiment

By default, the experiment is configured to inject chaos in the Java sample Lambda function. To change it to Python or Node.js Lambda functions, edit the experiment template and configure it to inject chaos using steps from here.

Step 4: Start the experiment

From the FIS Console, choose Start experiment.

 Start experiment

Wait until the experiment state changes to “Completed”.

Step 5: Run your test

At this stage, you can inject chaos into your Lambda function. Run the Lambda functions and observe their behavior.

1. Invoke the Lambda function using the command below:

aws lambda invoke --function-name NodeChaosInjectionExampleFn out --log-type Tail --query 'LogResult' --output text | base64 -d

2. The CLI commands output displays the logs created by the Lambda layers showing latency introduced in this invocation.

In this example, the output shows that the Lambda layer injected 1799ms of random latency to the function.

The experiment injects random latency or failure in the Lambda function. Running the Lambda function again results in a different latency or failure. At this stage, you can test the application, and observe its behavior under conditions that may occur in the real world, like an increase in latency or Lambda function’s failure.

Step 6: Roll back the experiment

To roll back the experiment, run the SSM document for rollback. This rolls back the Lambda function to the state before chaos injection. Run this command:

aws ssm start-automation-execution \
--document-name “InjectLambdaChaos-Rollback” \
--document-version “\$DEFAULT” \
--parameters \
‘{“FunctionName”:[“FunctionName”],”LayerArn”:[“LayerArn”],”assumeRole”:[“RoleARN
”]}’ \
--region eu-west-2

Cleaning up

To avoid incurring future charges, clean up the resources created by the CloudFormation template by running the following CLI command. Update the stack name to the one you provided when creating the stack.

aws cloudformation delete-stack --stack-name myChaosStack

Using FIS Experiments results

You can use FIS experiment results to validate expected system behavior. An example of expected behavior is: “If application latency increases by 10%, there is less than a 1% increase in sign in failures.” After the experiment is completed, evaluate whether the application resiliency aligns with your business and technical expectations.

Conclusion

This blog explains an approach for testing reliability and resilience in Lambda functions using chaos engineering. This approach allows you to inject chaos in Lambda functions without changing the Lambda function code, with clear segregation of chaos injection and business logic. It provides a way for developers to focus on building business functionality using Lambda functions.

The Lambda layers that inject chaos can be developed and managed separately. This approach uses AWS FIS to run experiments that inject chaos using Lambda layers and test serverless application’s performance and resiliency. Using the insights from the FIS experiment, you can find, fix, or document risks that surface in the application while testing.

For more serverless learning resources, visit Serverless Land.

How to add notifications and manual approval to an AWS CDK Pipeline

Post Syndicated from Jehu Gray original https://aws.amazon.com/blogs/devops/how-to-add-notifications-and-manual-approval-to-an-aws-cdk-pipeline/

A deployment pipeline typically comprises several stages such as dev, test, and prod, which ensure that changes undergo testing before reaching the production environment. To improve the reliability and stability of release processes, DevOps teams must review Infrastructure as Code (IaC) changes before applying them in production. As a result, implementing a mechanism for notification and manual approval that grants stakeholders improved access to changes in their release pipelines has become a popular practice for DevOps teams.

Notifications keep development teams and stakeholders informed in real-time about updates and changes to deployment status within release pipelines. Manual approvals establish thresholds for transitioning a change from one stage to the next in the pipeline. They also act as a guardrail to mitigate risks arising from errors and rework because of faulty deployments.

Please note that manual approvals, as described in this post, are not a replacement for the use of automation. Instead, they complement automated checks within the release pipeline.

In this blog post, we describe how to set up notifications and add a manual approval stage to AWS Cloud Development Kit (AWS CDK) Pipeline.

Concepts

CDK Pipeline

CDK Pipelines is a construct library for painless continuous delivery of CDK applications. CDK Pipelines can automatically build, test, and deploy changes to CDK resources. CDK Pipelines are self-mutating which means as application stages or stacks are added, the pipeline automatically reconfigures itself to deploy those new stages or stacks. Pipelines need only be manually deployed once, afterwards, the pipeline keeps itself up to date from the source code repository by pulling the changes pushed to the repository.

Notifications

Adding notifications to a pipeline provides visibility to changes made to the environment by utilizing the NotificationRule construct. You can also use this rule to notify pipeline users of important changes, such as when a pipeline starts execution. Notification rules specify both the events and the targets, such as Amazon Simple Notification Service (Amazon SNS) topic or AWS Chatbot clients configured for Slack which represents the nominated recipients of the notifications. An SNS topic is a logical access point that acts as a communication channel while Chatbot is an AWS service that enables DevOps and software development teams to use messaging program chat rooms to monitor and respond to operational events.

Manual Approval

In a CDK pipeline, you can incorporate an approval action at a specific stage, where the pipeline should pause, allowing a team member or designated reviewer to manually approve or reject the action. When an approval action is ready for review, a notification is sent out to alert the relevant parties. This combination of notifications and approvals ensures timely and efficient decision-making regarding crucial actions within the pipeline.

Solution Overview

The solution explains a simple web service that is comprised of an AWS Lambda function that returns a static web page served by Amazon API Gateway. Since Continuous Deployment and Continuous Integration (CI/CD) are important components to most web projects, the team implements a CDK Pipeline for their web project.

There are two important stages in this CDK pipeline; the Pre-production stage for testing and the Production stage, which contains the end product for users.

The flow of the CI/CD process to update the website starts when a developer pushes a change to the repository using their Integrated Development Environment (IDE). An Amazon CloudWatch event triggers the CDK Pipeline. Once the changes reach the pre-production stage for testing, the CI/CD process halts. This is because a manual approval gate is between the pre-production and production stages. So, it becomes a stakeholder’s responsibility to review the changes in the pre-production stage before approving them for production. The pipeline includes an SNS notification that notifies the stakeholder whenever the pipeline requires manual approval.

After approving the changes, the CI/CD process proceeds to the production stage and the updated version of the website becomes available to the end user. If the approver rejects the changes, the process ends at the pre-production stage with no impact to the end user.

The following diagram illustrates the solution architecture.


This diagram shows the CDK pipeline process in the solution and how applications or updates are deployed using AWS Lambda Function to end users.

Figure 1. This image shows the CDK pipeline process in our solution and how applications or updates are deployed using AWS Lambda Function to end users.

Prerequisites

For this walkthrough, you should have the following prerequisites:

Add notification to the pipeline

In this tutorial, perform the following steps:

  • Add the import statements for AWS CodeStar notifications and SNS to the import section of the pipeline stack py
import aws_cdk.aws_codestarnotifications as notifications
import aws_cdk.pipelines as pipelines
import aws_cdk.aws_sns as sns
import aws_cdk.aws_sns_subscriptions as subs
  • Ensure the pipeline is built by calling the ‘build pipeline’ function.

pipeline.build_pipeline()

  • Create an SNS topic.

topic = sns.Topic(self, "MyTopic1")

  • Add a subscription to the topic. This specifies where the notifications are sent (Add the stakeholders’ email here).

topic.add_subscription(subs.EmailSubscription("[email protected]"))

  • Define a rule. This contains the source for notifications, the event trigger, and the target .

rule = notifications.NotificationRule(self, "NotificationRule", )

  • Assign the source the value pipeline.pipeline The first pipeline is the name of the CDK pipeline(variable) and the .pipeline is to show it is a pipeline(function).

source=pipeline.pipeline,

  • Define the events to be monitored. Specify notifications for when the pipeline starts, when it fails, when the execution succeeds, and finally when manual approval is needed.
events=["codepipeline-pipeline-pipeline-execution-started", "codepipeline-pipeline-pipeline-execution-failed","codepipeline-pipeline-pipeline-execution-succeeded", 
"codepipeline-pipeline-manual-approval-needed"],
  • For the complete list of supported event types for pipelines, see here
  • Finally, add the target. The target here is the topic created previously.

targets=[topic]

The combination of all the steps becomes:

pipeline.build_pipeline()
topic = sns.Topic(self, "MyTopic1")
topic.add_subscription(subs.EmailSubscription("[email protected]"))
rule = notifications.NotificationRule(self, "NotificationRule",
source=pipeline.pipeline,
events=["codepipeline-pipeline-pipeline-execution-started", "codepipeline-pipeline-pipeline-execution-failed","codepipeline-pipeline-pipeline-execution-succeeded", 
"codepipeline-pipeline-manual-approval-needed"],
targets=[topic]
)

Adding Manual Approval

  • Add the ManualApprovalStep import to the aws_cdk.pipelines import statement.
from aws_cdk.pipelines import (
CodePipeline,
CodePipelineSource,
ShellStep,
ManualApprovalStep
)
  • Add the ManualApprovalStep to the production stage. The code must be added to the add_stage() function.
 prod = WorkshopPipelineStage(self, "Prod")
        prod_stage = pipeline.add_stage(prod,
            pre = [ManualApprovalStep('PromoteToProduction')])

When a stage is added to a pipeline, you can specify the pre and post steps, which are arbitrary steps that run before or after the contents of the stage. You can use them to add validations like manual or automated gates to the pipeline. It is recommended to put manual approval gates in the set of pre steps, and automated approval gates in the set of post steps. So, the manual approval action is added as a pre step that runs after the pre-production stage and before the production stage .

  • The final version of the pipeline_stack.py becomes:
from constructs import Construct
import aws_cdk as cdk
import aws_cdk.aws_codestarnotifications as notifications
import aws_cdk.aws_sns as sns
import aws_cdk.aws_sns_subscriptions as subs
from aws_cdk import (
    Stack,
    aws_codecommit as codecommit,
    aws_codepipeline as codepipeline,
    pipelines as pipelines,
    aws_codepipeline_actions as cpactions,
    
)
from aws_cdk.pipelines import (
    CodePipeline,
    CodePipelineSource,
    ShellStep,
    ManualApprovalStep
)


class WorkshopPipelineStack(cdk.Stack):
    def __init__(self, scope: Construct, id: str, **kwargs) -> None:
        super().__init__(scope, id, **kwargs)
        
        # Creates a CodeCommit repository called 'WorkshopRepo'
        repo = codecommit.Repository(
            self, "WorkshopRepo", repository_name="WorkshopRepo",
            
        )
        
        #Create the Cdk pipeline
        pipeline = pipelines.CodePipeline(
            self,
            "Pipeline",
            
            synth=pipelines.ShellStep(
                "Synth",
                input=pipelines.CodePipelineSource.code_commit(repo, "main"),
                commands=[
                    "npm install -g aws-cdk",  # Installs the cdk cli on Codebuild
                    "pip install -r requirements.txt",  # Instructs Codebuild to install required packages
                    "npx cdk synth",
                ]
                
            ),
        )

        
         # Create the Pre-Prod Stage and its API endpoint
        deploy = WorkshopPipelineStage(self, "Pre-Prod")
        deploy_stage = pipeline.add_stage(deploy)
    
        deploy_stage.add_post(
            
            pipelines.ShellStep(
                "TestViewerEndpoint",
                env_from_cfn_outputs={
                    "ENDPOINT_URL": deploy.hc_viewer_url
                },
                commands=["curl -Ssf $ENDPOINT_URL"],
            )
    
        
        )
        deploy_stage.add_post(
            pipelines.ShellStep(
                "TestAPIGatewayEndpoint",
                env_from_cfn_outputs={
                    "ENDPOINT_URL": deploy.hc_endpoint
                },
                commands=[
                    "curl -Ssf $ENDPOINT_URL",
                    "curl -Ssf $ENDPOINT_URL/hello",
                    "curl -Ssf $ENDPOINT_URL/test",
                ],
            )
            
        )
        
        # Create the Prod Stage with the Manual Approval Step
        prod = WorkshopPipelineStage(self, "Prod")
        prod_stage = pipeline.add_stage(prod,
            pre = [ManualApprovalStep('PromoteToProduction')])
        
        prod_stage.add_post(
            
            pipelines.ShellStep(
                "ViewerEndpoint",
                env_from_cfn_outputs={
                    "ENDPOINT_URL": prod.hc_viewer_url
                },
                commands=["curl -Ssf $ENDPOINT_URL"],
                
            )
            
        )
        prod_stage.add_post(
            pipelines.ShellStep(
                "APIGatewayEndpoint",
                env_from_cfn_outputs={
                    "ENDPOINT_URL": prod.hc_endpoint
                },
                commands=[
                    "curl -Ssf $ENDPOINT_URL",
                    "curl -Ssf $ENDPOINT_URL/hello",
                    "curl -Ssf $ENDPOINT_URL/test",
                ],
            )
            
        )
        
        # Create The SNS Notification for the Pipeline
        
        pipeline.build_pipeline()
        
        topic = sns.Topic(self, "MyTopic")
        topic.add_subscription(subs.EmailSubscription("[email protected]"))
        rule = notifications.NotificationRule(self, "NotificationRule",
            source = pipeline.pipeline,
            events = ["codepipeline-pipeline-pipeline-execution-started", "codepipeline-pipeline-pipeline-execution-failed", "codepipeline-pipeline-manual-approval-needed", "codepipeline-pipeline-manual-approval-succeeded"],
            targets=[topic]
            )


When a commit is made with git commit -am "Add manual Approval" and changes are pushed with git push, the pipeline automatically self-mutates to add the new approval stage.

Now when the developer pushes changes to update the build environment or the end user application, the pipeline execution stops at the point where the approval action was added. The pipeline won’t resume unless a manual approval action is taken.

Image showing the CDK pipeline with the added Manual Approval action on the AWS Management Console

Figure 2. This image shows the pipeline with the added Manual Approval action.

Since there is a notification rule that includes the approval action, an email notification is sent with the pipeline information and approval status to the stakeholder(s) subscribed to the SNS topic.

Image showing the SNS email notification sent when the pipeline starts

Figure 3. This image shows the SNS email notification sent when the pipeline starts.

After pushing the updates to the pipeline, the reviewer or stakeholder can use the AWS Management Console to access the pipeline to approve or deny changes based on their assessment of these changes. This process helps eliminate any potential issues or errors and ensures only changes deemed relevant are made.

Image showing the review action on the AWS Management Console that gives the stakeholder the ability to approve or reject any changes.

Figure 4. This image shows the review action that gives the stakeholder the ability to approve or reject any changes. 

If a reviewer rejects the action, or if no approval response is received within seven days of the pipeline stopping for the review action, the pipeline status is “Failed.”

Image showing when a stakeholder rejects the action

Figure 5. This image depicts when a stakeholder rejects the action.

If a reviewer approves the changes, the pipeline continues its execution.

Image showing when a stakeholder approves the action

Figure 6. This image depicts when a stakeholder approves the action.

Considerations

It is important to consider any potential drawbacks before integrating a manual approval process into a CDK pipeline. one such consideration is its implementation may delay the delivery of updates to end users. An example of this is business hours limitation. The pipeline process might be constrained by the availability of stakeholders during business hours. This can result in delays if changes are made outside regular working hours and require approval when stakeholders are not immediately accessible.

Clean up

To avoid incurring future charges, delete the resources. Use cdk destroy via the command line to delete the created stack.

Conclusion

Adding notifications and manual approval to CDK Pipelines provides better visibility and control over the changes made to the pipeline environment. These features ideally complement the existing automated checks to ensure that all updates are reviewed before deployment. This reduces the risk of potential issues arising from bugs or errors. The ability to approve or deny changes through the AWS Management Console makes the review process simple and straightforward. Additionally, SNS notifications keep stakeholders updated on the status of the pipeline, ensuring a smooth and seamless deployment process.

Jehu Gray

Jehu Gray is an Enterprise Solutions Architect at Amazon Web Services where he helps customers design solutions that fits their needs. He enjoys exploring whats possible with IaC such as CDK.

Abiola Olanrewaju

Abiola Olanrewaju is an Enterprise Solutions Architect at Amazon Web Services where he helps customers design and implement scalable solutions that drive business outcomes. He has a keen interest in Data Analytics, Security and Automation.

Serge Poueme

Serge Poueme is a Solutions Architect on the AWS for Games Team. He started his career as a software development engineer and enjoys building new products. At AWS, Serge focuses on improving Builders Experience for game developers and optimize servers hosting using Containers. When he is not working he enjoys playing Far Cry or Fifa on his XBOX