Post Syndicated from Arturs Lontons original https://blog.zabbix.com/scheduled-report-generation-in-zabbix-5-4/14776/
The release of version 5.4 grants Zabbix users the ability to receive scheduled PDF reports in their mailbox, which is a very sought-after feature. This post and the video will cover all-new report-related configuration parameters and walk you through setting up scheduled report generation.
Contents
I. Reporting in Zabbix 5.4 (0:45)
II. Scheduled reports (2:26)
III. Questions & Answers (13:28)
Reporting in Zabbix 5.4
Zabbix 5.4 is our first big step in bringing out-of-the-box reporting for our end users. With this feature, we now have a foundation to build upon in the future and make reporting more robust and versatile over time. Since reports are 100% based on dashboard widgets, it’s only a matter of time until more report-focused widgets get released, thus enabling not only better dashboards, but also improving the reporting functionality.
- We have implemented a new web service component responsible for generating reports — of course, you can install this server in a quick and easy fashion by using the provided packages.
- Reporting works out of the box without the need to deploy or develop any custom scripts.
- The initial configuration is easy to understand and implement.
- Reporting will use the existing Email media types to send out these reports.
- The reports do respect your permissions, as well as roles introduced in Zabbix 5.2.
- You will be able to test the report before implementing it as per our schedules just by clicking the Test button.
Scheduled reports
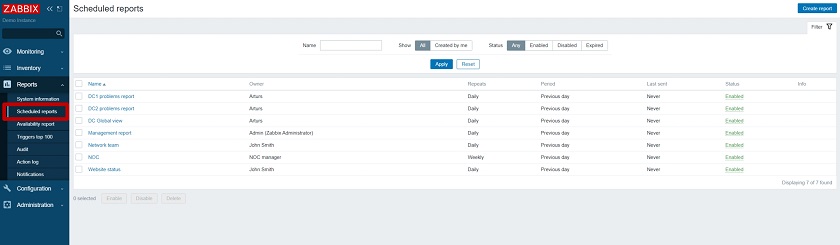
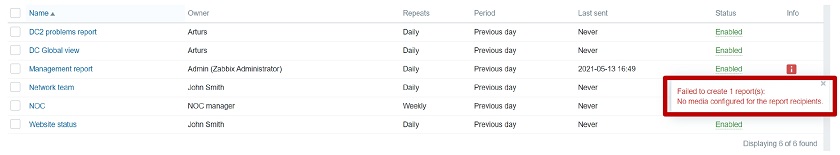
We have added a new Scheduled report section, where the list of reports is available, displaying the report Name, their Owner, Repeats (daily, weekly, etc.), the Period for which the report is generated, and the Last sent date.
 Scheduled reports
NOTE. When you configure new reports, and they have not been sent out yet, the Last sent date will be set to ‘Never.’
Creating a report
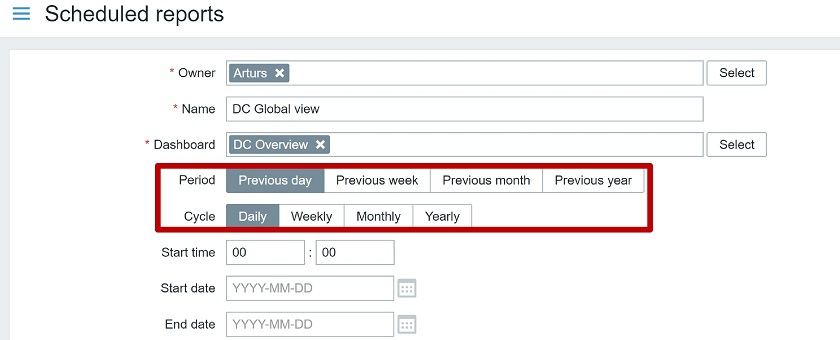
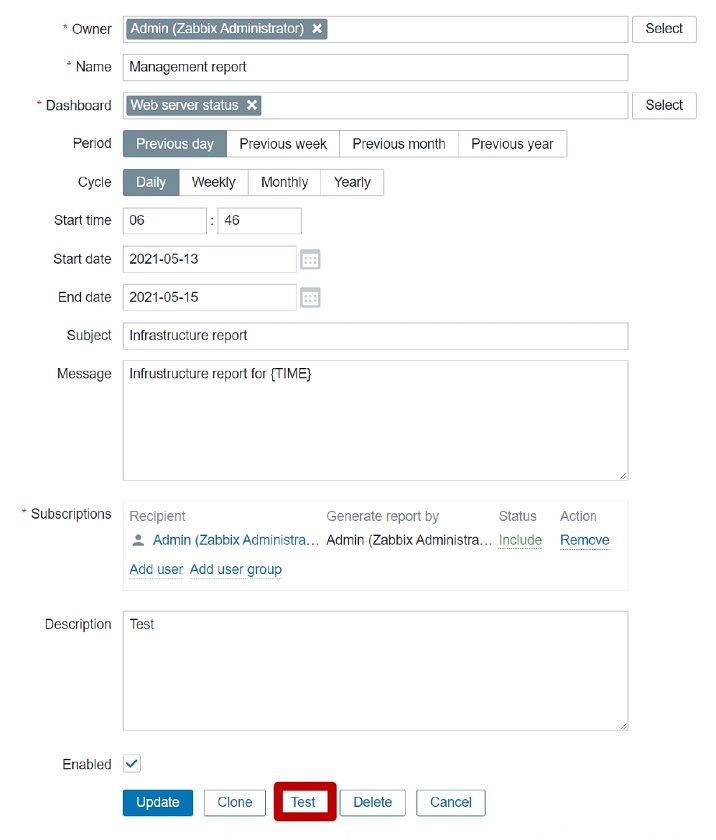
When you create a report, you will also have to fill in a couple of fields:
- Owner,
- Name of the report,
- Dashboard, the report will be based on,
- Period — if you send the report for the Previous day, Previous week, Previous month, of Previous year,
- Cycle — how often you send the report Daily/Weekly/Monthly/ Yearly,
- Start time (Zabbix server time is used here),
- Start date and end date.
Creating reports
Receiving a report
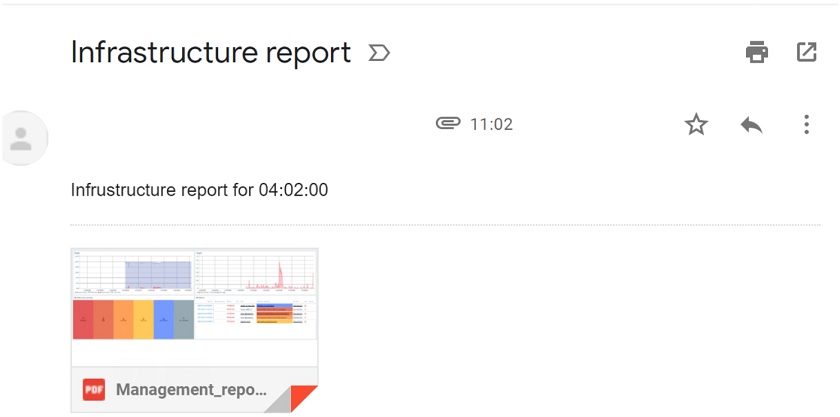
When you receive a PDF report to your mailbox, you can also use the {TIME} macro to display server time both in the subject and the body of the message.
Receiving a report
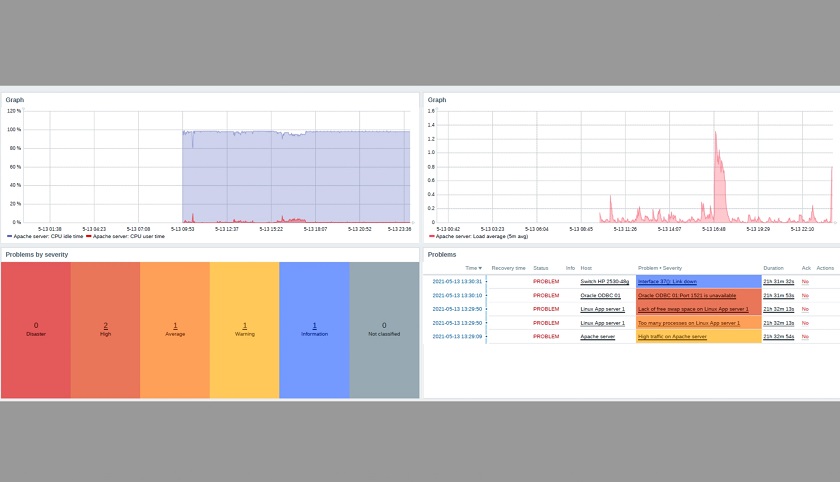
In the PDF report, you can display any information from the included dashboard – Graphs, Problems, Latest data, and much more. Thanks to all of the available widgets, we will be able to customize our reports in a very granular fashion.
 Receiving a report example
The report does respect user permissions. So, in the example above, the report shows only the data to which the user (either the recipient or the report creator) has access.
Permissions
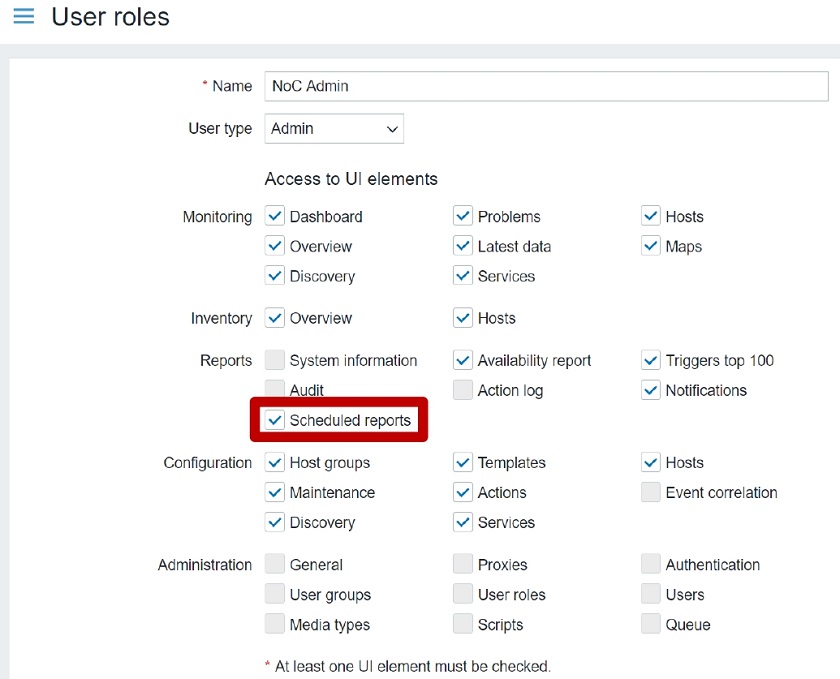
After upgrading to Zabbix 5.4, you will see two new options in the User roles section:
- Scheduled reports UI element. Under the UI elements, you can grant or deny access to the Scheduled reports section. This is accessible only to Super admin and Admin user Types.
 Permissions
If the Scheduled reports UI element is unchecked for the role, the user won’t be able to access the Scheduled report section and will see an error message. The same behavior is true if you use a URL to access the Scheduled reports.
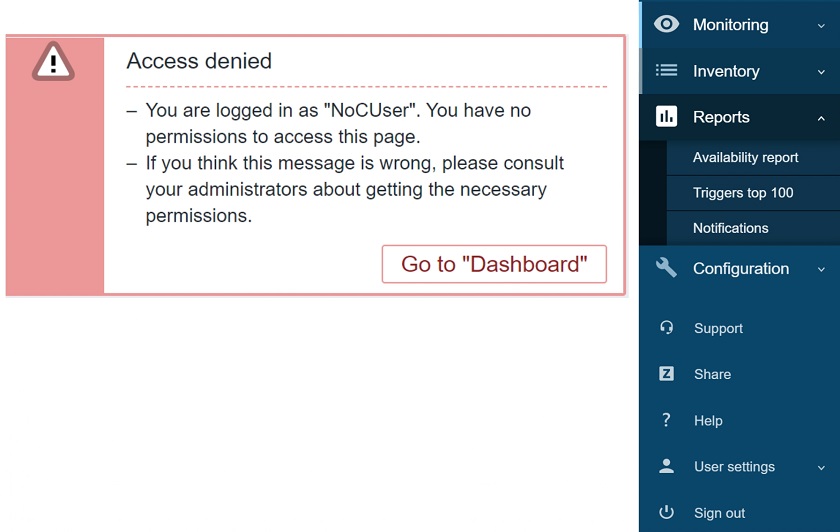 Access to scheduled reports denied message for the users of a user role
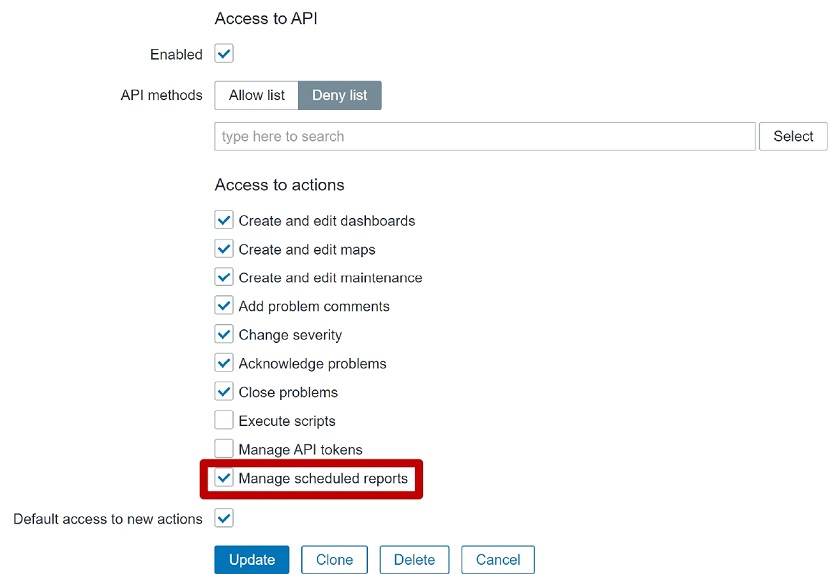
You can also manage scheduled report permissions in the Access to actions section by checking the Manage scheduled reports box. This action permission grants or denies the ability to create or edit scheduled reports and is also accessible to Admin and Super admin user types.
 Manage scheduled reports
If this check box is unchecked, the users won’t be able to create new or edit existing reports, though they will be able to access the UI section and see the list of reports and how they are configured.
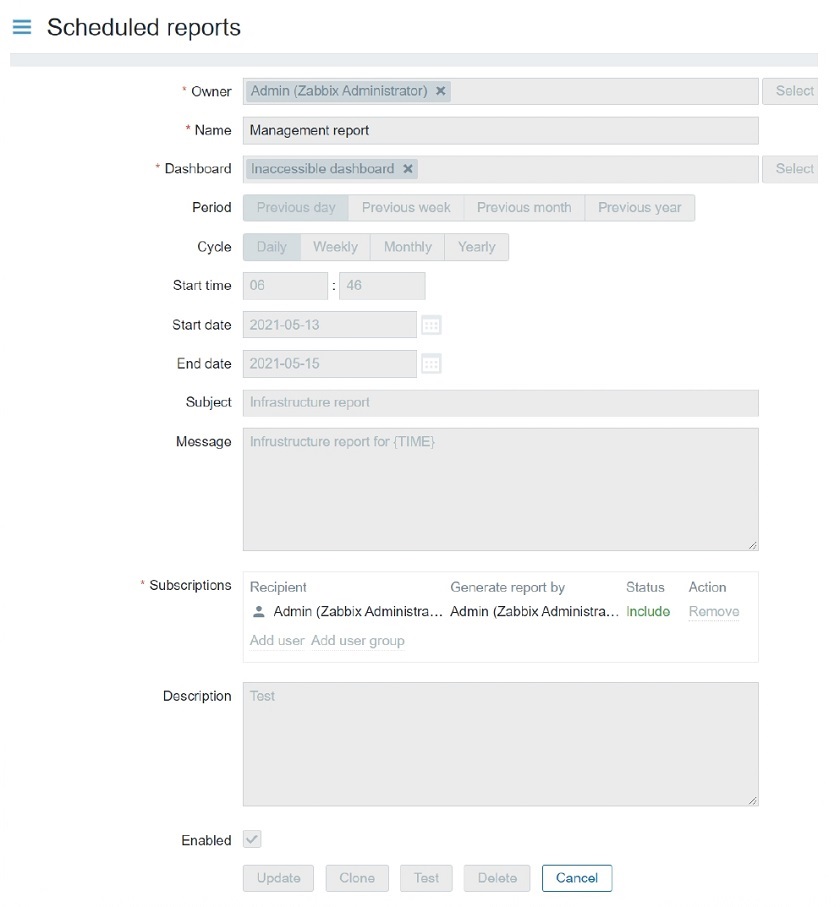 Access to Manage scheduled reports restricted
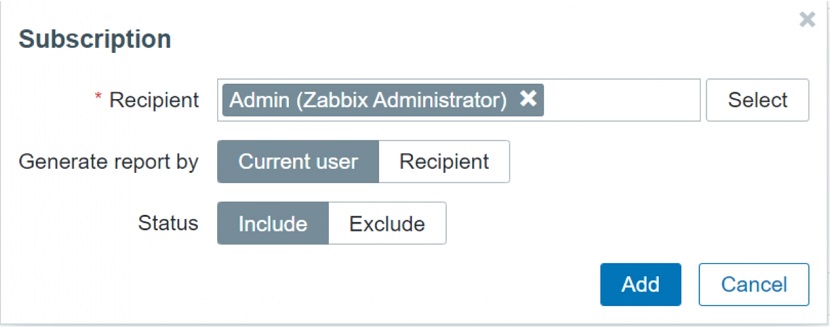
Recipients of scheduled reports
When you are defining a new report, you can select the recipient. Report subscription can contain a user or a user group.
- When selecting a user, you can specify to include or exclude the user from the subscription.
- User group to host group permissions still apply.
- You can specify which user is going to be generating the report – recipient or the creator of the report.:
 Report recipients
For example, if we need to send some extra information to our NOC team that might not be directly available to them, you can select Current user, and the report will be generated with the permissions of the report creator. Since it is the admin that is creating the report, you can add some extra information that wouldn’t be visible to your NOC team or other regular users. They still won’t be able to access it in Zabbix, but they’ll receive it in their mailbox if you configure the report for them.
Report prerequisites
Diving a bit deeper into the technical side of things, we need to set up two additional packages to enable the reports:
- zabbix-web-service — the additional reporting service by default listening to port 10053. The service needs to be reachable from the Zabbix server and can be deployed on the same machine as our frontend or our server. We also have the option to deploy it on a completely separate machine. The zabbix-web-service package should be available if you have added the Zabbix repository.
#yum install zabbix-web-service
- Google Chrome is required. However, on some distributions, Chromium is reported to also work, though this is not 100% tested. Note that Google Chrome packages are not included in Zabbix. The Google Chrome packages can simply be downloaded from the Google Chrome website and then installed on the zabbix-web-service host.
#wget https://dl.google.com/linux/direct/google-chrome-stable_current_x86_64.rpm

#yum install google-chrome-stable_current_x86_64.rpm
Configuring reports — Web service
We have a whole new configuration file for the web service. Web service supports many different configuration options:
- Logging — similar to that for server and for proxy. You can set up debug levels, select the log types, rotations, and so on.
### Option: LogType –system (syslog), file, console (standard output)
### Option: LogFile–Log file location
### Option: LogFileSize -Size in MB before rotation
### Option: DebugLevel –0 -5
- List of allowed server addresses that can access this web service.
### Option: AllowedIP List of comma delimited IP addresses, optionally in CIDR notation, or DNS names of Zabbix servers
- Timeout settings
### Option: Timeout -Spend no more than Timeout seconds on processing (Default –3)
- Listen port
### Option: ListenPort -Service will listen on this port for connections from the server
(Default -ListenPort=10053)
- Encryption settings by using certificates. This way the communication with the web service can be secured.
### Option: TLSAccept –unencrypted or cert
### Option: TLSCAFile–pathname of a file containing top level CA(s) certificates
### Option: TLSCertFile–pathname of a file containing the service certificate
### Option: TLSKeyFile–pathname of a file containing the service private key
Configuring reports — Server
In addition, the server settings now contain report-related parameters:
- The number of report writer instances.
### Option: StartReportWriters -Number of pre-forked report writer instances.
(Default –0)
NOTE. You need to have at least one StartReportWriter
NOTE. The number of the necessary report writers will depend on the number of reports and how often you generate them.
- Zabbix Web Service URL (to be passed on to the server)
### Option: WebServiceURL -URL to Zabbix web service, used to perform web-related tasks. (No default value)
#Example: http://192.168.1.156:10053/report
You need to make sure that we can communicate with the Zabbix Web Service URL and permit the incoming traffic through this port to the web service.
Configuring reports — Frontend
As the last step, you need to enable communication between the frontend and the web service.
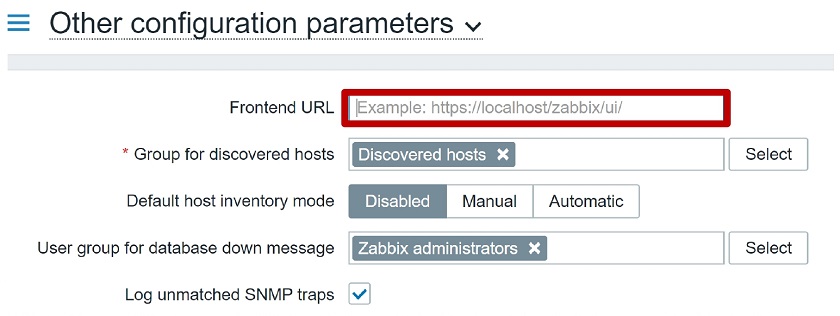
In Administration > General > Other, we have a new configuration parameter where you need to specify your frontend URL that will be reachable by the web service.
 Frontend URL
Once this is done, we can create a report.
Reports — testing
After you have created the report, you can test it. You can click the Test button and send out your test report to see if it works. The users to which we’re sending the report need to have an Email media assigned to them in the User settings.
NOTE. Currently, {TIME} macros are resolved only with the scheduled generation and are not available in test reports, though this might change in the future.
 Testing reports
Common issues
Some parameters can certainly be misconfigured, so let’s look at the most common issues:
- Make sure that you have a properly configured Email media assigned to the user that should be receiving the report. Otherwise, they will fail to receive it.
— Make sure that the Email media type settings are properly configured.
— Once you define the media type, if you’re creating it from scratch, make sure that you test the media type and generate a test report.
 Media configuration failed
NOTE. Sending out the report failed in this example siince no media is configured for the report recipients.
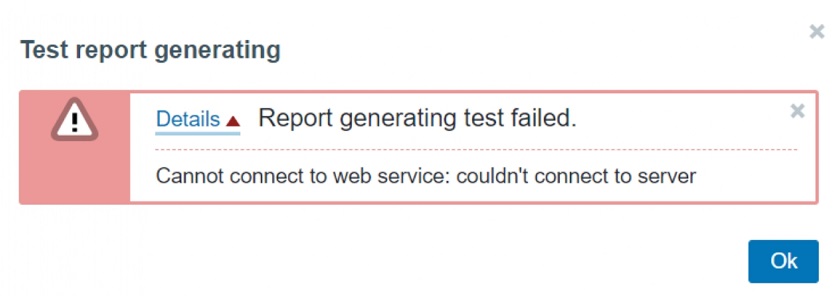
- Make sure that the correct Web service address is configured on the Zabbix server in the WebServiceURL parameter.
— Confirm that the Zabbix server can connect to the Zabbix web service and that so that we can connect to the specified port/IP address.
— Check your firewall settings if the web service is running on a dedicated machine.
— Make sure that third-party security software, such as SELinux or firewalls don’t block the communication.
Wrong WebServiceURL parameter
Otherwise, you will receive an error message on the Frontend. The error messages should be sufficient enough to point you in the right direction.
- Make sure that the Web service URL is configured without any typos. Otherwise, you will reach the web service, but the report page will output an error — ‘404 page not found’.
WebServiceURL=http://192.168.1.156:10053/reportwrong
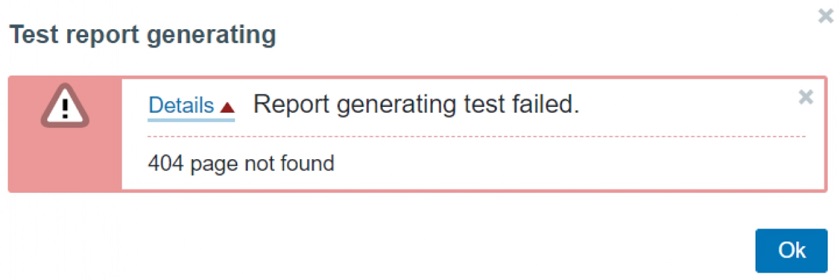 Typos in configuration error message
NOTE. If you see this error message, check for typos in the Zabbix server configuration file for WebServiceURL.
- Don’t forget to assign the Frontend URL in Administration > General > Other.
— If a URL is misconfigured, you might start receiving empty reports.
— If the URL syntax is wrong, you will receive an error message about the malformed URL.

Malformed URL error message
 Frontend URL configuration parameter
- Google Chrome is not pre-packaged with Zabbix,
— You need to have Google Chrome package installed separately. You can download Google Chrome from the official Google Chrome website, for instance, by using wget.
— Make sure that Google Chrome is available via $PATH environmental variable. If you don’t have it configured, you will receive the error message, so you will need to modify the path variable and make sure the executable is available there.
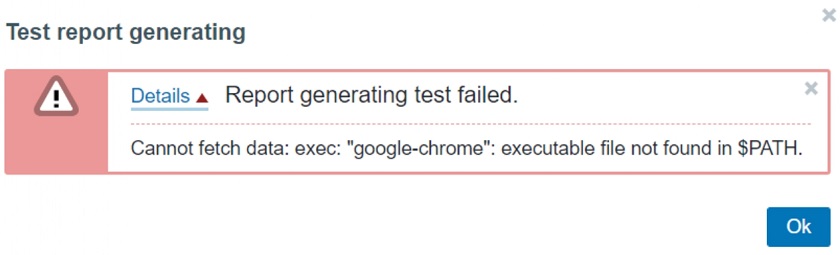
$PATH environmental variable error
Questions & Answers
Question. What are the possibilities to customize the page size like A4, A3?
Answer. It will be based on how you customize your Dashboard. Currently, you cannot customize the page and select portrait or landscape, for instance.