Tag Archives: Super Bowl

A look at Internet traffic trends during Super Bowl LVIII

Post Syndicated from David Belson http://blog.cloudflare.com/author/david-belson/ original https://blog.cloudflare.com/super-bowl-lviii


After winning Super Bowl LVII in 2023, the Kansas City Chiefs entered Super Bowl LVIII with an opportunity to pull off back-to-back wins, a feat last achieved by the New England Patriots two decades earlier, in 2003 and 2004. They faced the San Francisco 49ers, five-time Super Bowl champions, although their last win was nearly three decades ago, in 1995. The game started slowly, remaining scoreless until the start of the second quarter, after which both teams traded the lead until a tie score at the end of the game made it only the second Super Bowl to go into overtime. And if you weren’t watching it for the football, the advertisements certainly didn’t disappoint. And if you weren’t watching it for the football or the advertisements, but instead were waiting to see how many times CBS cut away to a shot of Taylor Swift during the game, the answer is… 16. (By my count, at least.)

In this blog post, we will explore which Super Bowl advertisements drove the largest spikes in traffic, as well as examine how traffic to food delivery services, social media, sports betting, and video platform websites and applications changed during the game. In addition, we look at local traffic trends seen during the game, as well as email threat volume across related categories in the weeks ahead of the game.

Cloudflare Radar uses a variety of sources to provide aggregate information about Internet traffic and attack trends. In this blog post, as we did last year and the year before, we use DNS name resolution data from our 1.1.1.1 resolver to estimate traffic to websites. We can’t see who visited the websites mentioned, or what anyone did on the websites, but DNS can give us an estimate of the interest generated by the ads or across a set of sites in the categories listed above.

Ads: URLs are no longer cool

In last year’s blog post, we asked “Are URLs no longer cool?”, noting that many of the advertisements shown during Super Bowl LVII didn’t include a URL. The trend continued into 2024, as over 100 ads were shown throughout Super Bowl LVIII, but only about one-third of them contained URLs — some were displayed prominently, some were in very small type. A few of the advertisements contained QR codes, and a few suggested downloading an app from Apple or Google’s app stores, but neither approach appears to be a definitive replacement for including a link to a website in the ad. And although Artificial Intelligence (AI) has all but replaced cryptocurrency as the thing that everyone is talking about, the lone AI ad during this year’s game was for Microsoft Copilot, which the company is positioning as an “everyday AI companion”.

As we did last year, we again tracked DNS request traffic to our 1.1.1.1 resolver in United States data centers for domains associated with the advertised products or brands. Traffic growth is plotted against a baseline calculated as the mean request volume for the associated domains between 12:00-15:00 EST on Sunday, February 11 (Super Bowl Sunday). The brands highlighted below were chosen because their advertisements drove some of the largest percentage traffic spikes observed during the game.

TurboTax

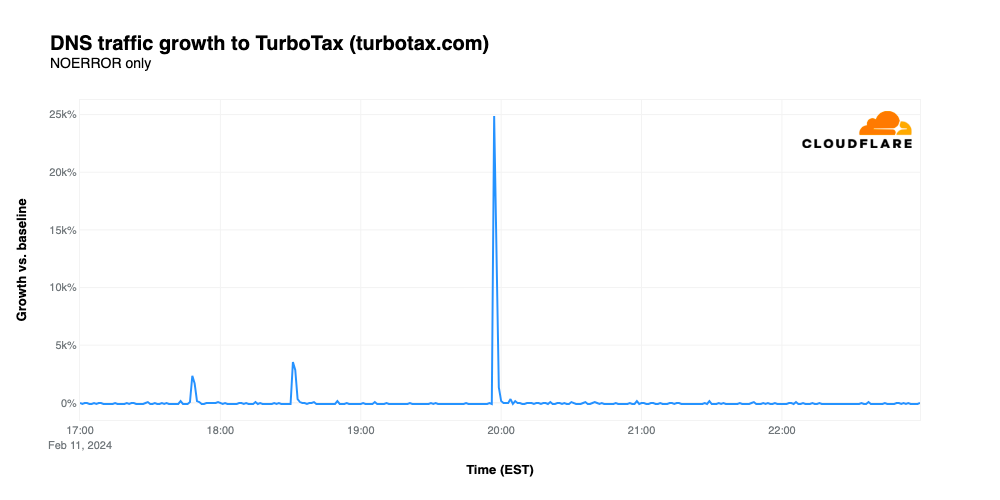
Although most Americans dislike having to pay taxes, they apparently feel that winning a million dollars would make doing so a little less painful. The Intuit TurboTax Super Bowl File ad, starring Emmy Award winner Quinta Brunson, included a URL pointing visitors to turbotax.com, where they could register to win one million dollars. The promotion aired a couple of times before the game began, visible as small spikes in the graph below, but it paid off for Intuit when it was shown at 19:56, driving traffic 24,875% above baseline and placing it as the ad that drove the largest increase in traffic.
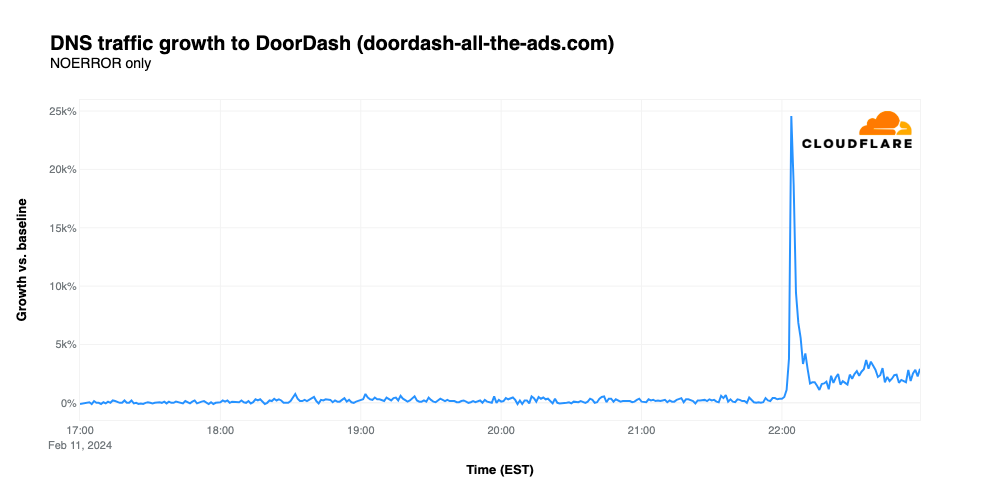
DoorDash

Most DoorDash deliveries are fairly nominal, and should be able to easily fit in the Dasher’s car. However, in a twist, the delivery for the “DoorDash all the ads” promotion includes several cars, as well as candy, cosmetics, trips, mayonnaise, and a myriad of other items, all of which appeared in Super Bowl advertisements, as a way for the company to demonstrate that they deliver more than. The ad, which prominently featured a URL for the contest site, aired at 22:03 EST and drove traffic 24,574% above baseline. The graph below shows that prominent spike, but it also shows traffic remaining 1700-2500% above baseline after the ad aired. This elevated traffic is likely due to efforts to transcribe the full promo code needed to enter the contest. The promo code, as crowdsourced in a Reddit thread, clocks in at a whopping 1,813 characters.
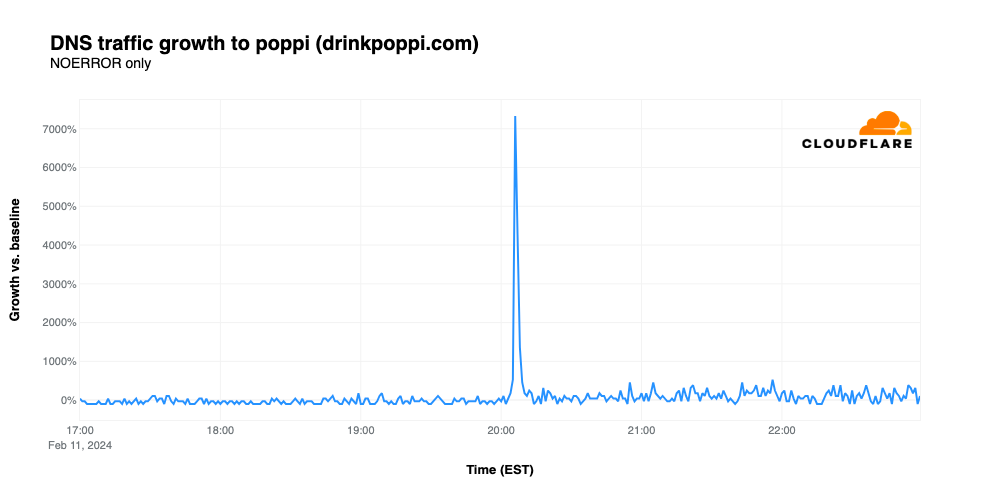
Poppi

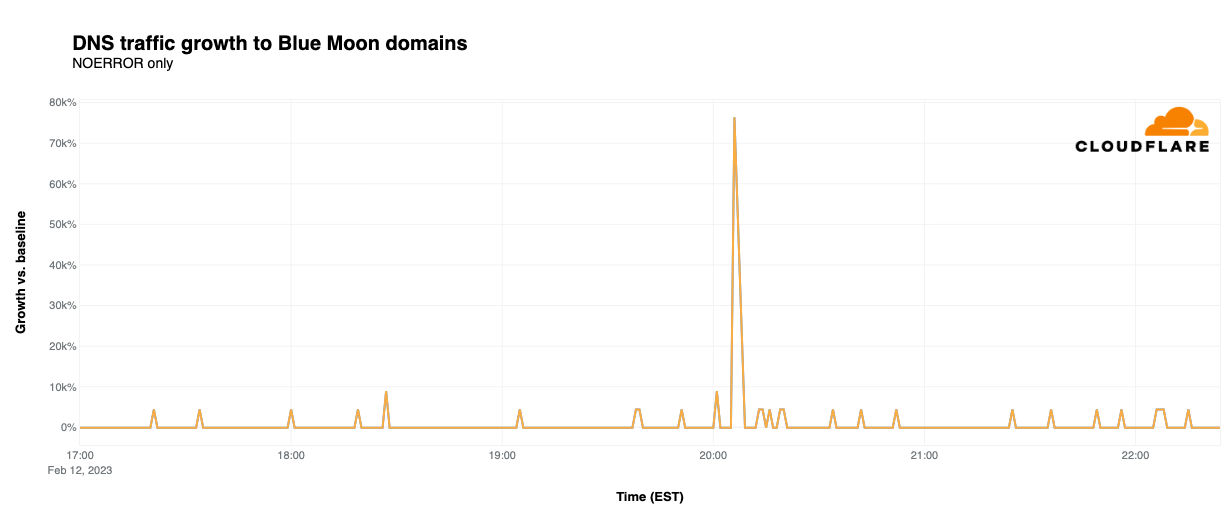
Super Bowl ads for “new” drink brands have frequently driven significant amounts of traffic, such as the growth seen by Cutwater Spirits in 2022. Relative newcomer Poppi, a brand of soda that contains prebiotics, continued the trend, with traffic spiking 7,329% above baseline after its ad appeared at 20:04 EST, despite no URL appearing in the advertisement. However, it appears that not everyone was a fan of the ad, as critics complained that it “food shamed” those who choose to drink traditional sodas.
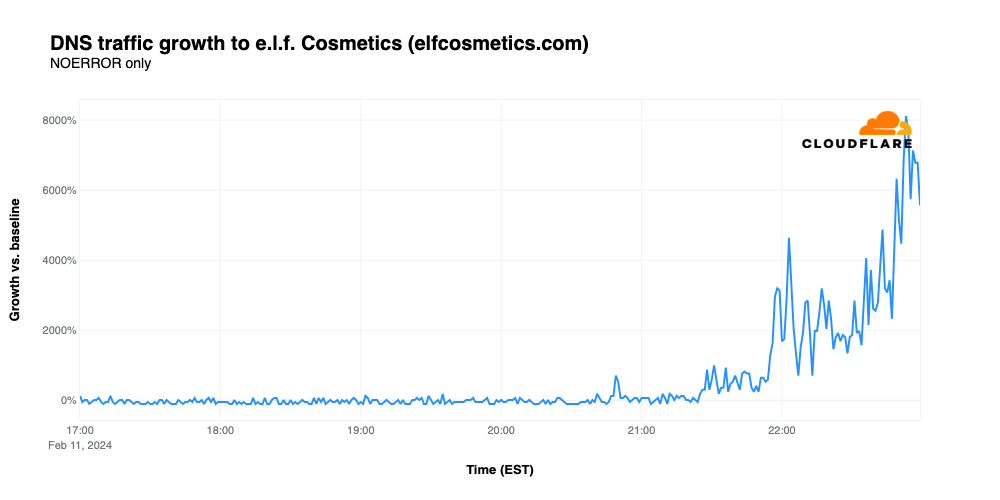
e.l.f. Cosmetics

The cosmetic brand’s second Super Bowl advertisement featured Judge Judy presiding over a courtroom scene featuring musician Meghan Trainor and the cast of the USA Network legal drama Suits. While the ad drove traffic for elfcosmetics.com to 8,118% over baseline despite lacking a URL, the timing of the growth is unusual as it doesn’t align with the time the ad aired (20:22 EST). The traffic starts to tick up around 21:24 EST, just after a Chiefs touchdown put them in the lead, peaking at 22:53, several minutes after the Chiefs won the game. It isn’t clear why e.l.f. appears to buck the trend seen for most Super Bowl ads, showing a gradual ramp in traffic before peaking, as opposed to a large spike aligned with the time that the ad was broadcast.

In addition to the advertisements discussed above, a number of others also experienced traffic spikes greater than 1,000% above baseline, including ads for the NFL, Hallow, He Gets Us, homes.com, Kawasaki, Robert F. Kennedy, Jr. 2024, Snapchat, Skechers, and Volkswagen.

App traffic sees mixed impacts

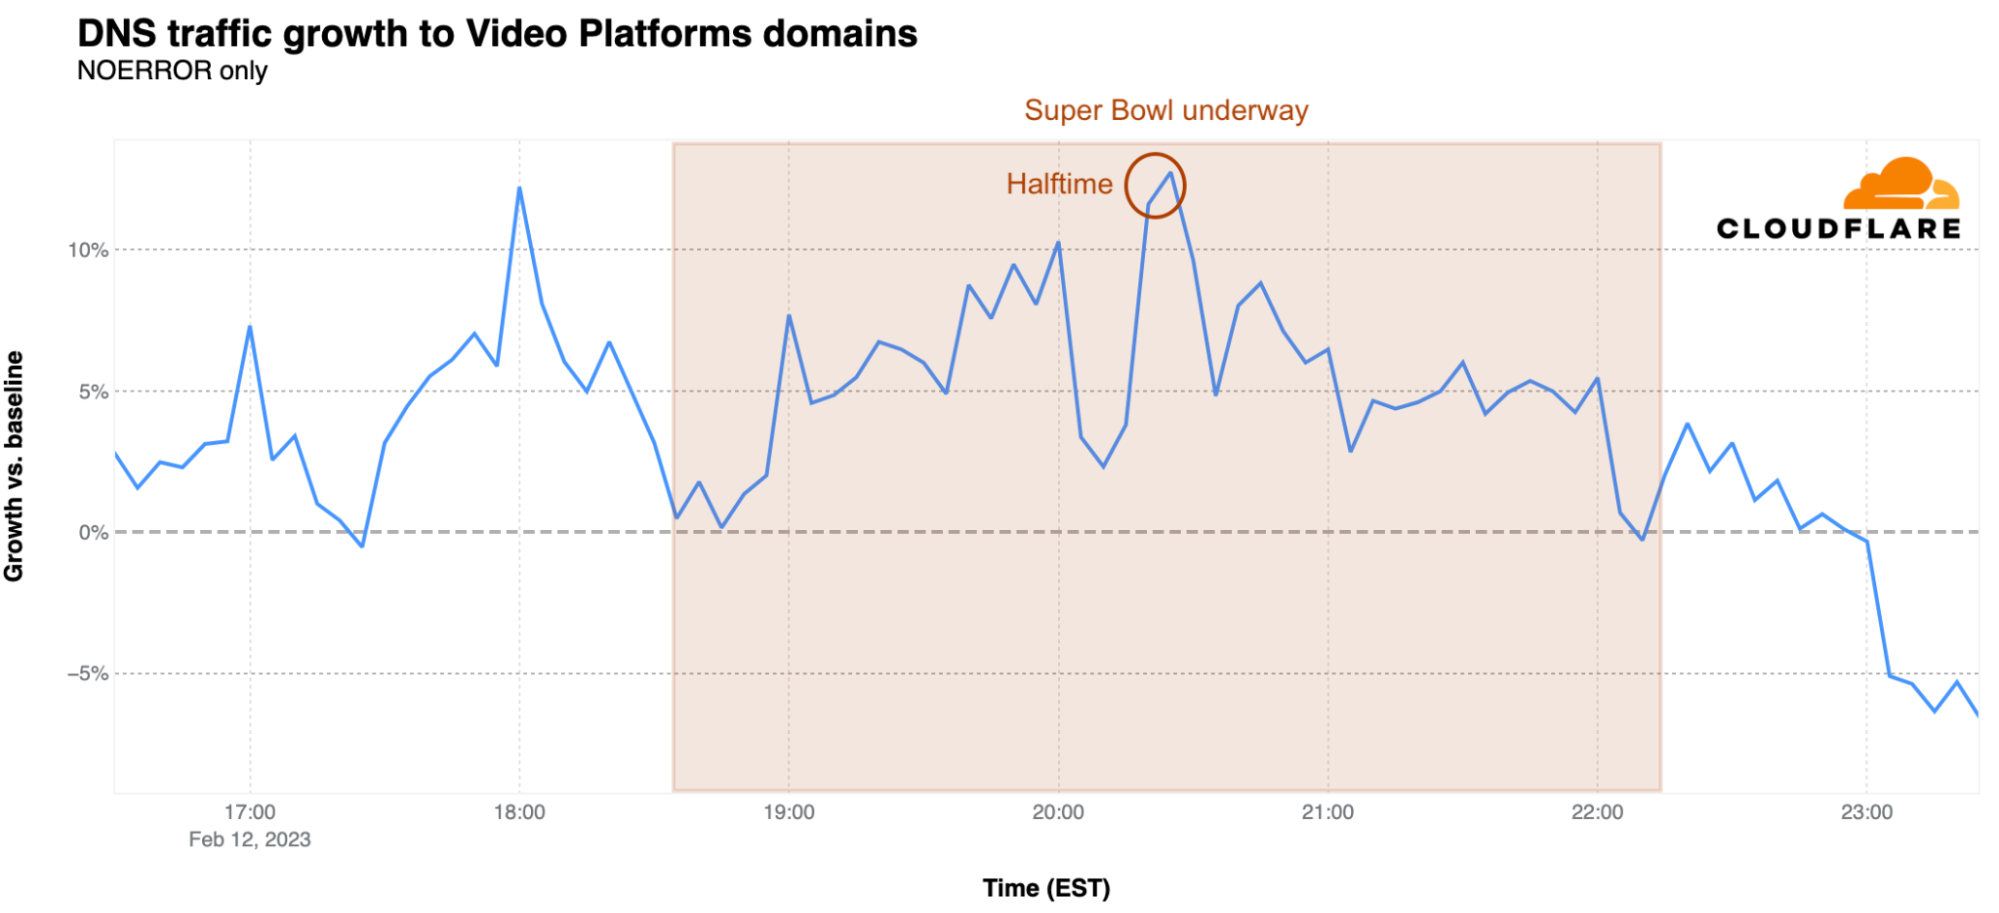
Using the same baseline calculations described above, we also looked at traffic for domains associated with several groups of sites, including food delivery, messaging, social media, and sports betting to see how events that occurred during the game impacted traffic. Traffic shifts among most of these groups remained fairly nominal during the game, with sports betting seeing the largest movement. Halftime is clearly visible within the graphs, as viewers apparently focused on the musical performance, which featured R&B singer Usher, joined by guests Alicia Keys, H.E.R., will.i.am, Ludacris, and Lil Jon.
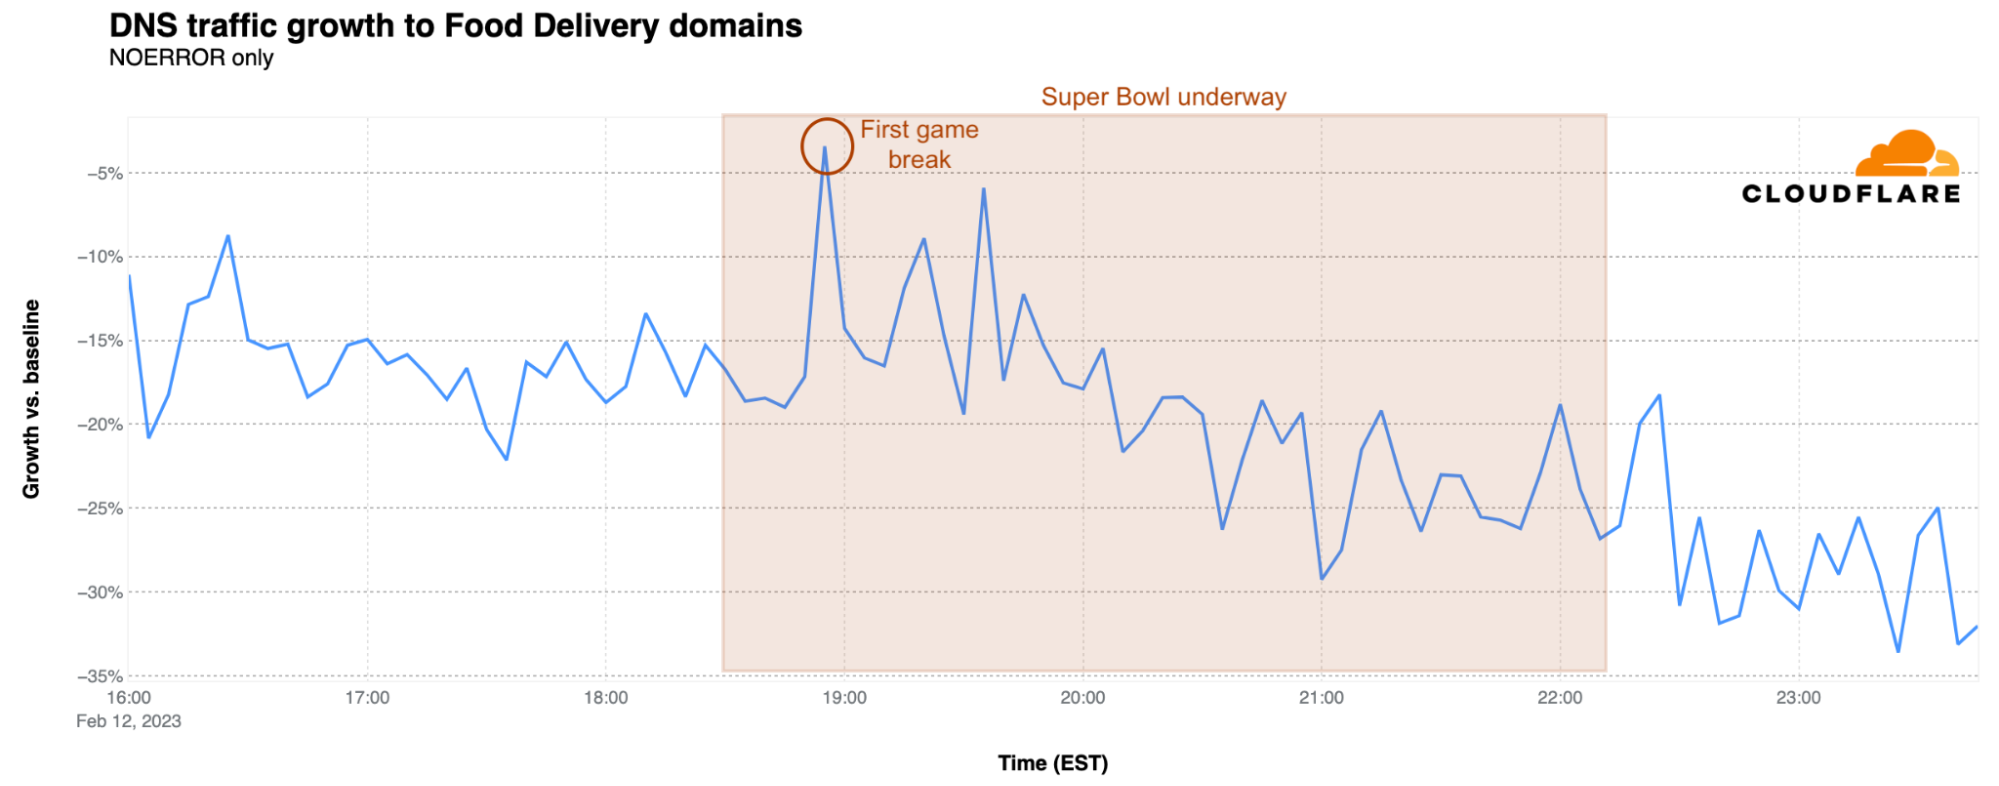
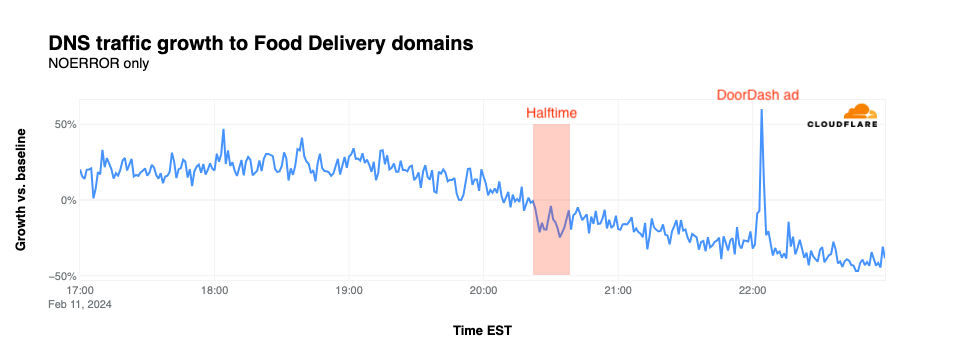
Food delivery

Traffic for food delivery sites remained relatively constant, on average, through the first quarter of the game, and started to decline as the second quarter started. A more significant dip is visible during halftime, with the drop continuing through the end of overtime. The outlier, of course, is the spike that occurred when the DoorDash advertisement aired, even though it featured a domain other than doordash.com, which is a member of this group.
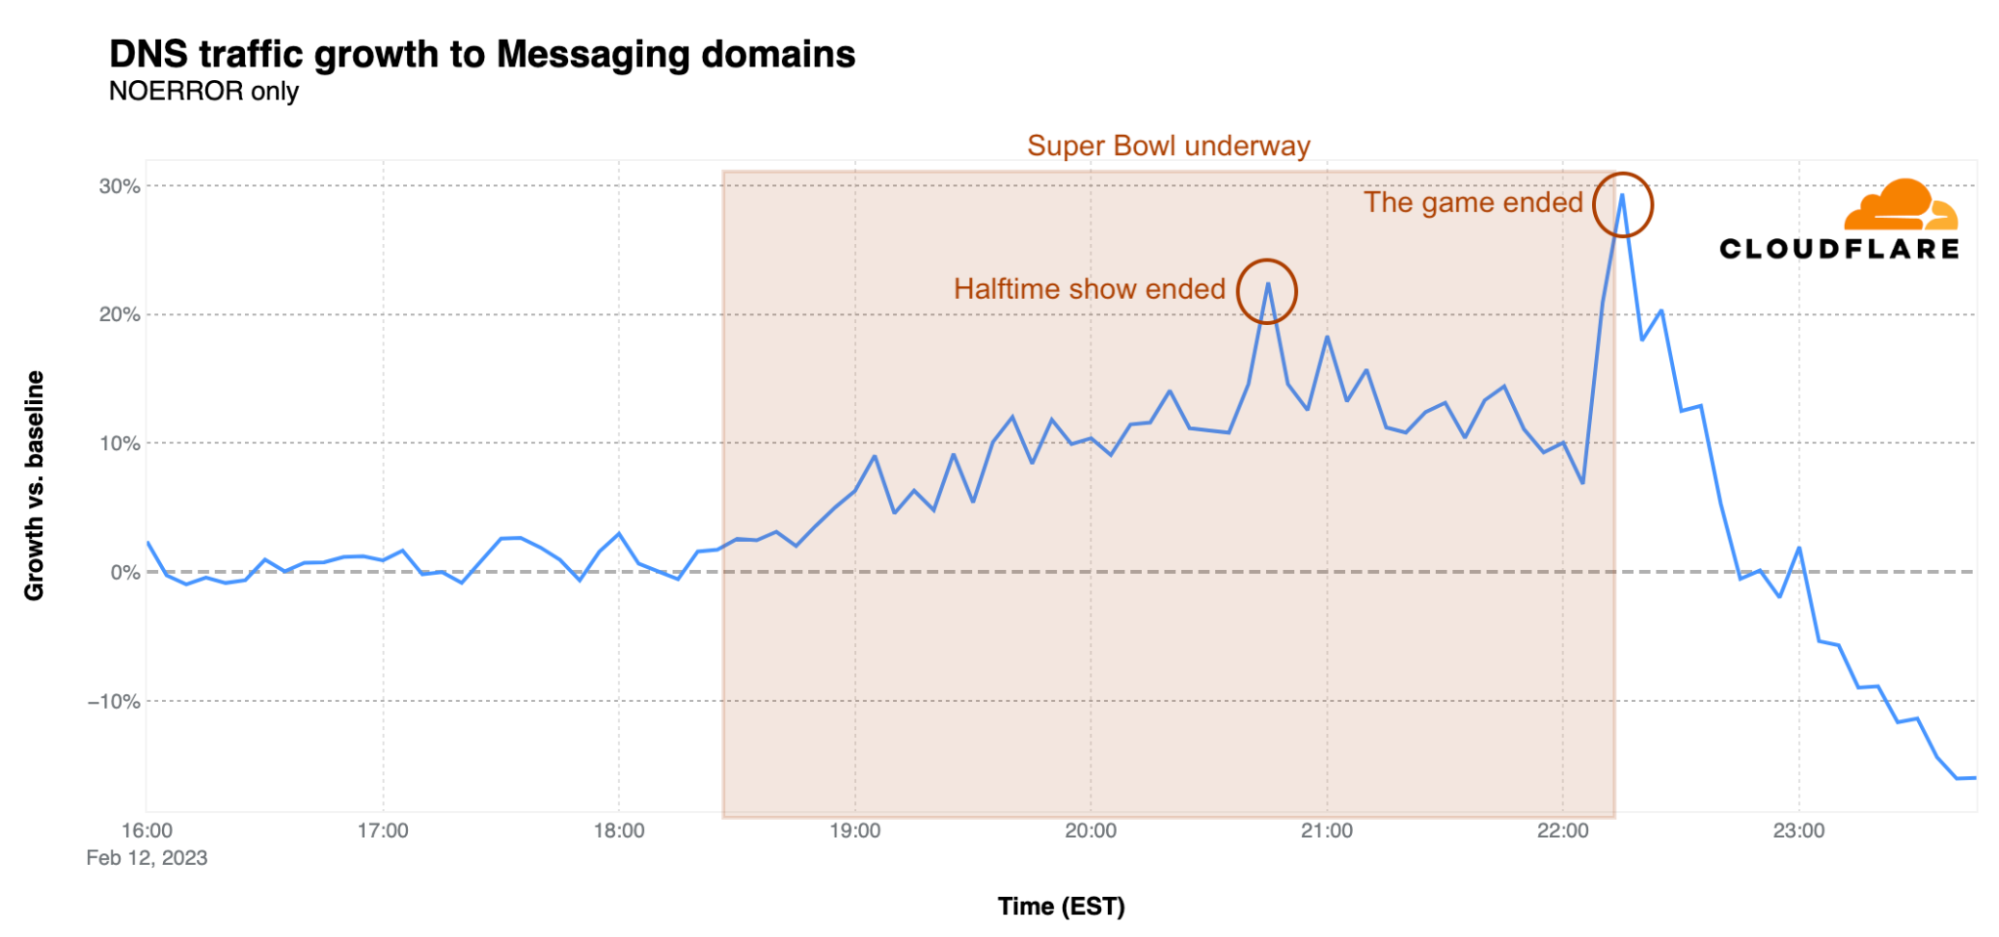
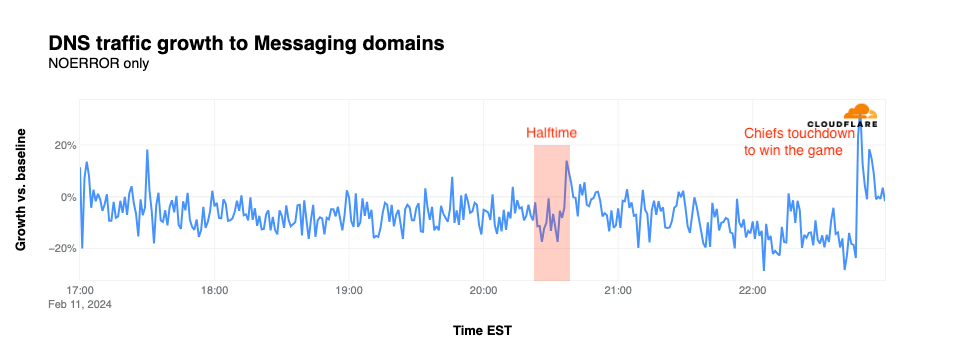
Messaging

Traffic to domains associated with messaging applications generally remained just below baseline throughout the first half of the game. The spikes above baseline during the first half were nominal, and don’t appear to be associated with any notable in-game events. Traffic picked back up briefly as the halftime show ended, jumping to 14% above baseline. After that, traffic continued to drop until 22:46 EST, when the Chiefs sealed their victory with an overtime touchdown, causing traffic for messaging sites to spike to 34% above baseline.
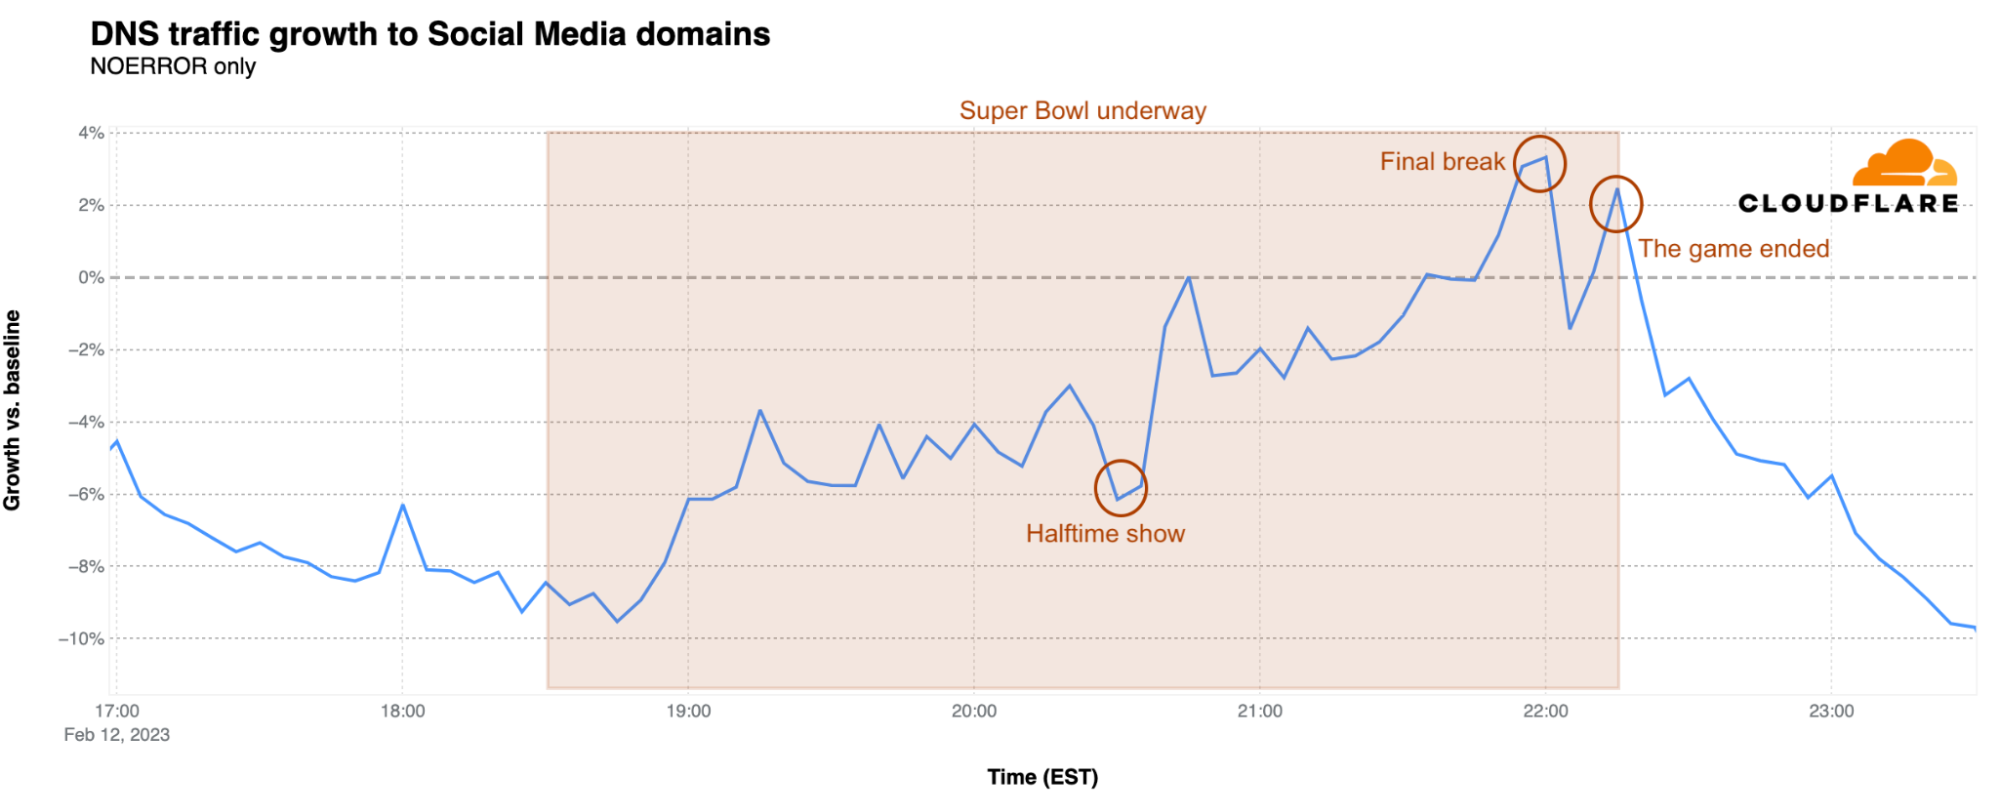
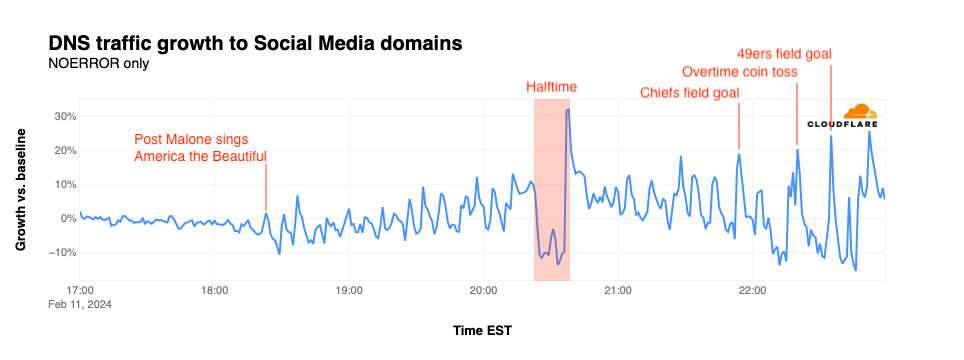
Social media

Traffic for social media sites often spikes in conjunction with major plays, such as fumbles or touchdowns, as fans take to their favorite sites and apps to share photos or videos, or to celebrate or vent, depending on the team they support. Although social media traffic was fairly flat ahead of the start of the game, it began to see some spikiness as Post Malone sang America the Beautiful. This nominal spikiness continued through halftime, although none of the peaks were clearly correlated with major plays during the first half.  Similar to messaging, a notable drop in traffic occurred during halftime followed by a spike as Usher’s halftime show ended. In the second half, traffic spiked as the Chiefs tied the game with a field goal, for the overtime coin toss, and as the 49ers took the lead with an overtime field goal. Interestingly, that final spike visible in the graph occurs approximately six minutes after the Chiefs’ game-winning touchdown during an ad break ahead of the post-game show.
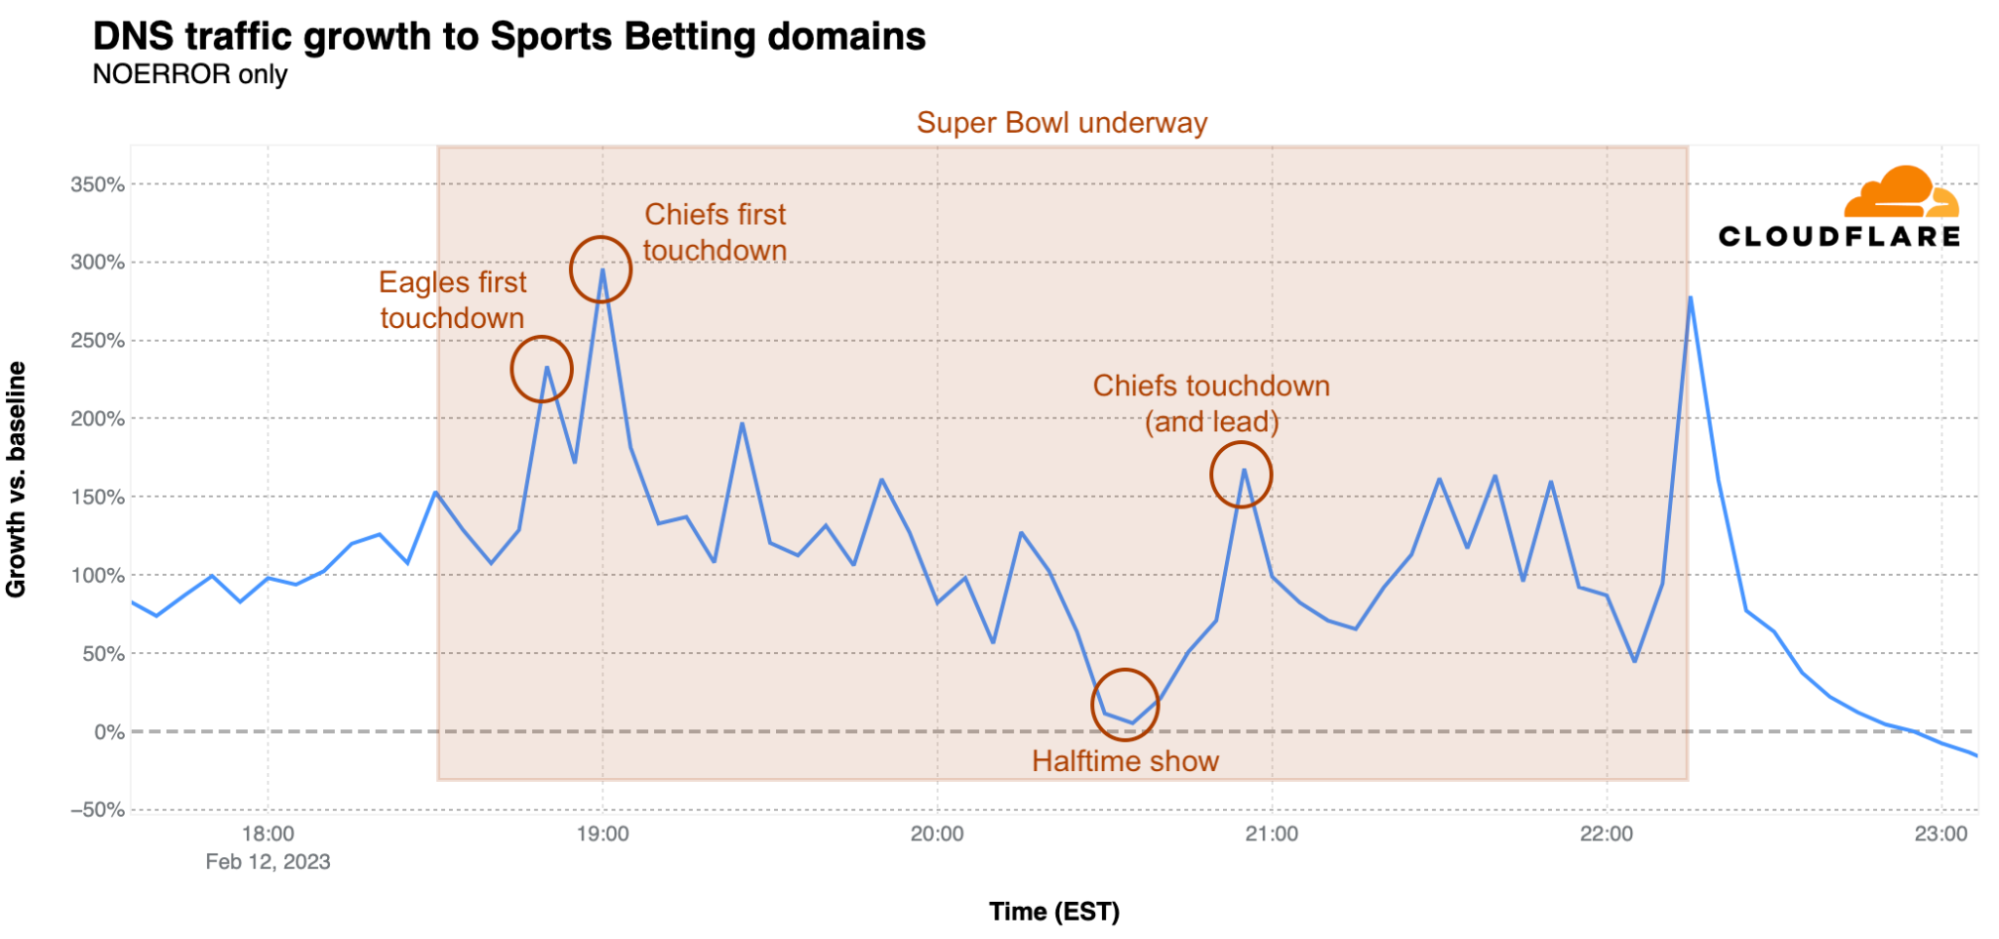
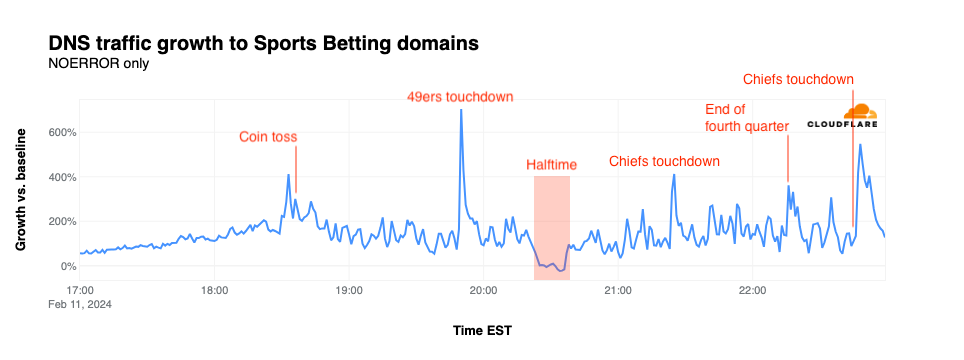
Sports betting

Compared to the relatively anemic traffic growth (when it was actually above baseline) seen for the categories above, traffic for domains associated with sports betting sites and apps remained significantly above baseline throughout the game with the exception of the dip during halftime, similar to what was also seen in the categories above. The first spike occurred just minutes before the coin toss, jumping to 412% above baseline. The game’s first touchdown, scored by the 49ers, caused traffic to spike 705% above baseline. A 413% spike occurred when the Chiefs took the lead late in the third quarter, with a slightly smaller one occurring at the end of regulation play as the game entered overtime. The final spike occurred just a couple of minutes after the Chiefs scored the game-winning touchdown, reaching 548% above baseline.

Zooming in to Kansas City and San Francisco

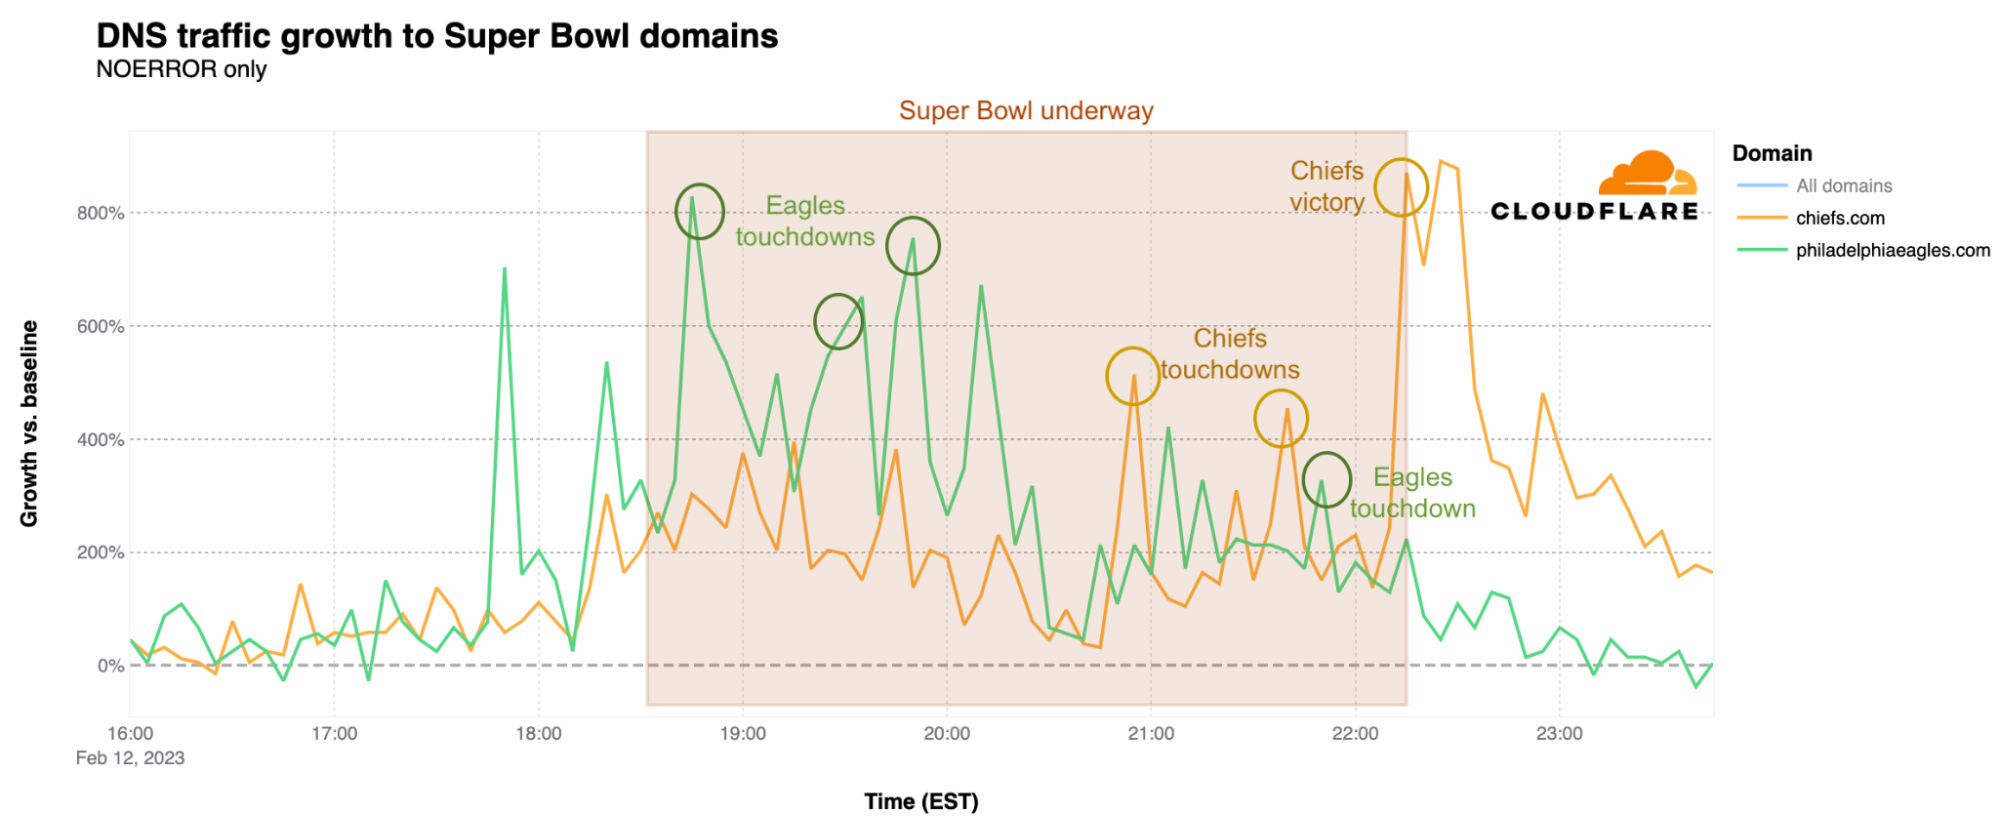
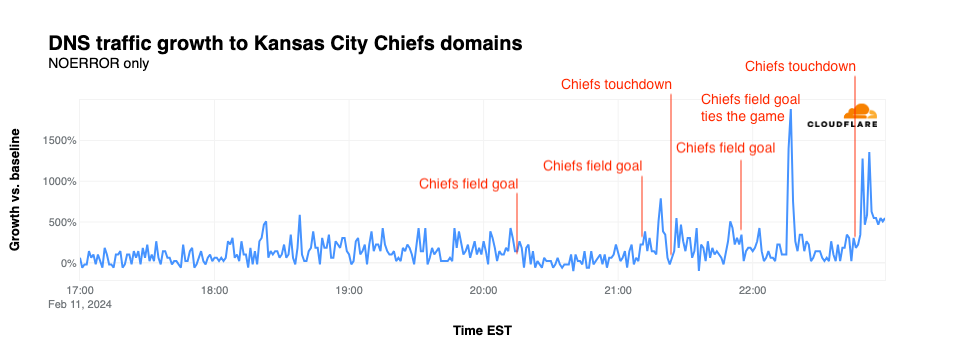
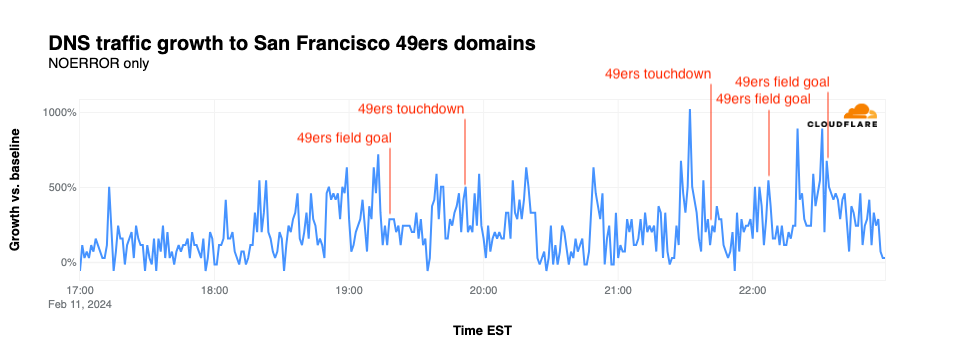
Using the same baseline calculations highlighted in the previous two sections, we also looked at changes in DNS traffic for the domains associated with the Kansas City Chiefs (chiefs.com) and the San Francisco 49ers (49ers.com). In addition, we looked at HTTP traffic from these two cities, using traffic levels from one week prior as a baseline.

By and large, DNS traffic for chiefs.com did not appear to be significantly impacted by most of the team’s field goals or touchdowns during the game, as seen in the graph below. The exception is the traffic spike seen as the team tied the game towards the end of the fourth quarter, forcing the game into overtime. That play resulted in a spike of traffic for the team’s website that reached 1,887% above baseline. Traffic spiked again after the Chiefs won the game, spiking to 1,360% above baseline.

DNS traffic for 49ers.com did not exhibit significant shifts correlated with field goals or touchdowns. The most significant spike reached 1,023% over baseline at the end of the third quarter, minutes after the team called for a timeout.

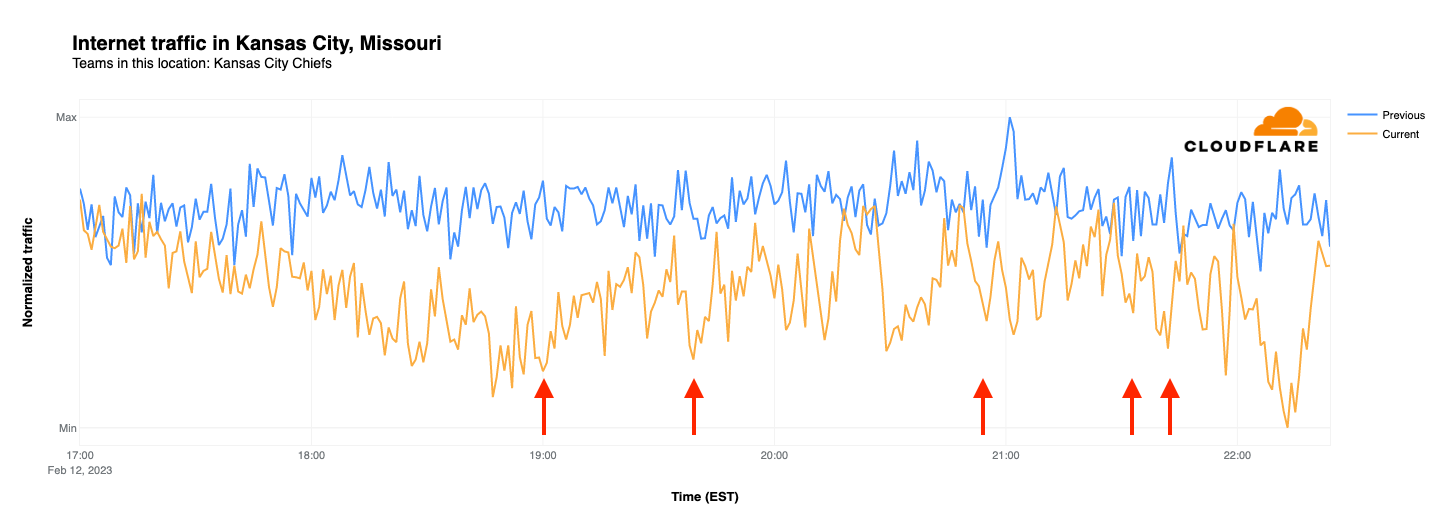
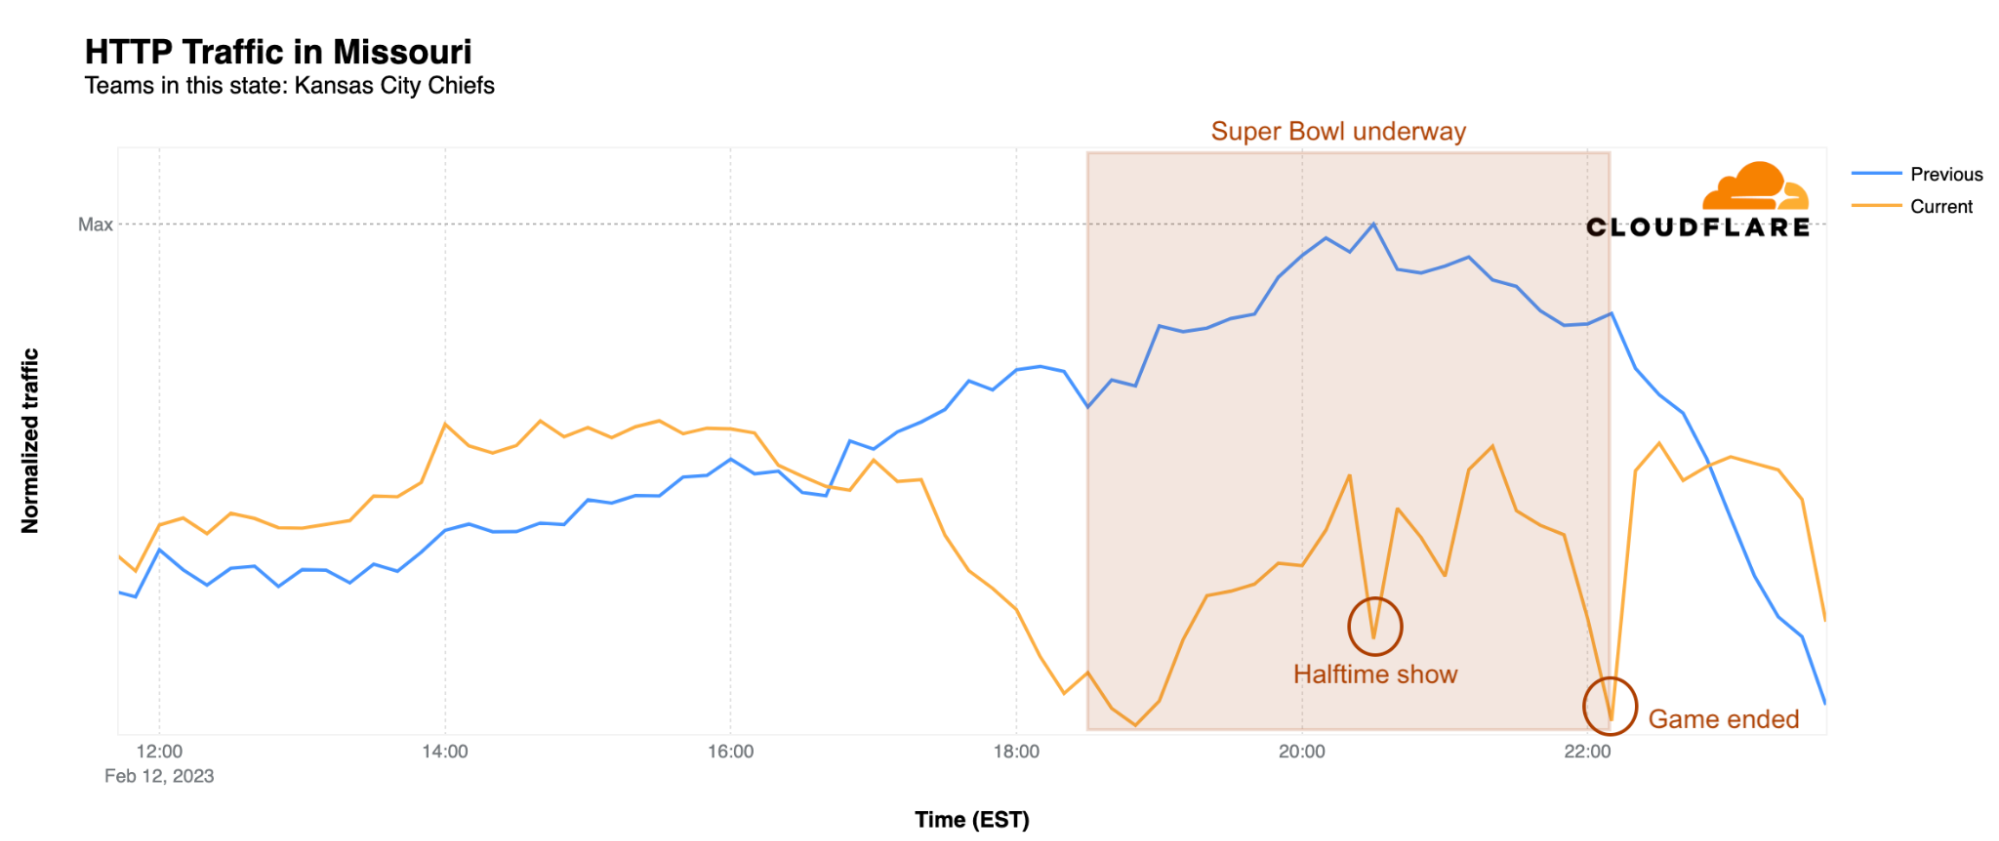
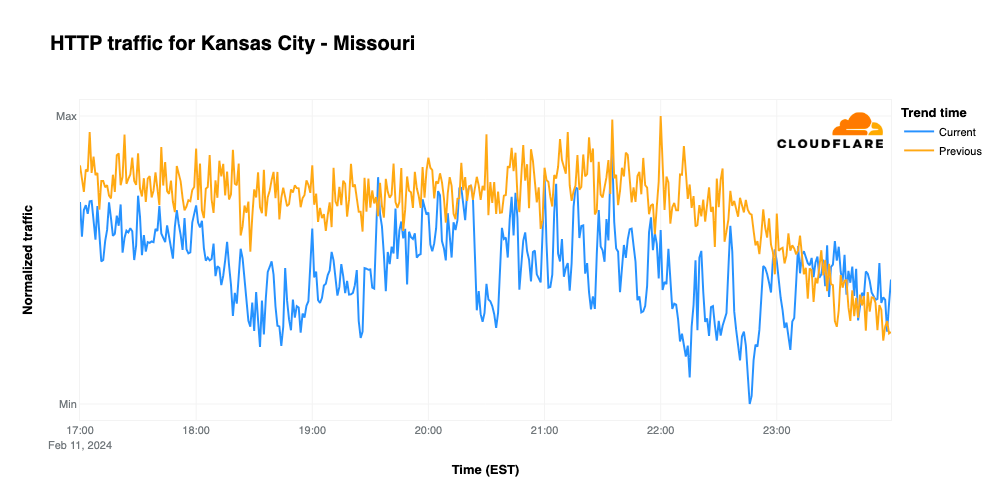
When comparing traffic trends for Kansas City and San Francisco, they could hardly be more different. Looking at request traffic from Kansas City, we find that it remains below traffic seen during the same time frame on February 4, with notable drops at the start of the game, during halftime, and when the Chiefs tied the game with a field goal late in the fourth quarter. Traffic hit its lowest point when the Chiefs won the game, but then recovered to meet/exceed the prior week’s traffic levels once the broadcast had concluded.

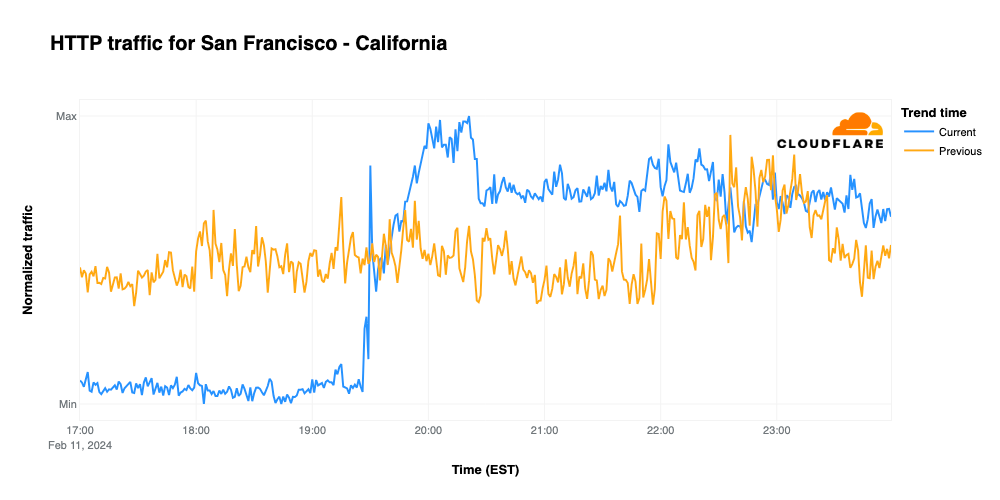
In contrast, traffic from San Francisco remained well below traffic levels seen the previous Sunday before unexpectedly spiking around 19:30 EST. Request traffic then remained well above the previous week’s levels until San Francisco kicked a field goal to take the initial lead during overtime play. Traffic remained roughly in line with the previous week until the broadcast ended, and then remained slightly higher.

Email threats and “The Big Game”

As we noted in last year’s blog post, spammers and scammers will frequently try to take advantage of the popularity of major events when running their campaigns, hoping the tie-in will entice the user to open the message and click on a malicious link, or visit a malicious website where they give up a password or credit card number. The Cloudflare Area 1 Email Security team once again analyzed the subject lines of email messages processed by the service in the weeks leading up to the Super Bowl to identify malicious, suspicious, and spam messages across four topic areas: Super Bowl/football, sports media/websites, sports gambling, and food delivery.
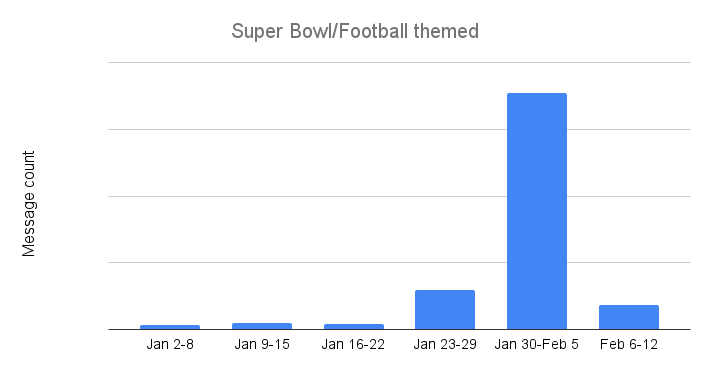
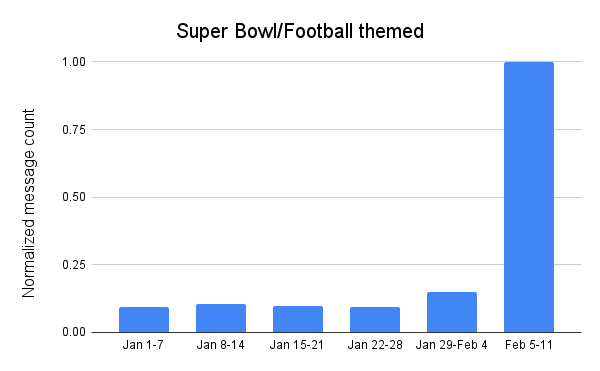
Super Bowl/Football

Spammers and scammers apparently didn’t feel that the “Super Wild Card Weekend” nor the divisional playoffs were sufficiently interesting to use as bait for their campaigns, as the volume of Super Bowl and football themed unwanted and potentially malicious email messages throughout January remained relatively low and fairly consistent. However, they apparently knew that the big game itself would draw interest, as the volume of such messages increased more than 6x over the prior week in the days ahead of the game.

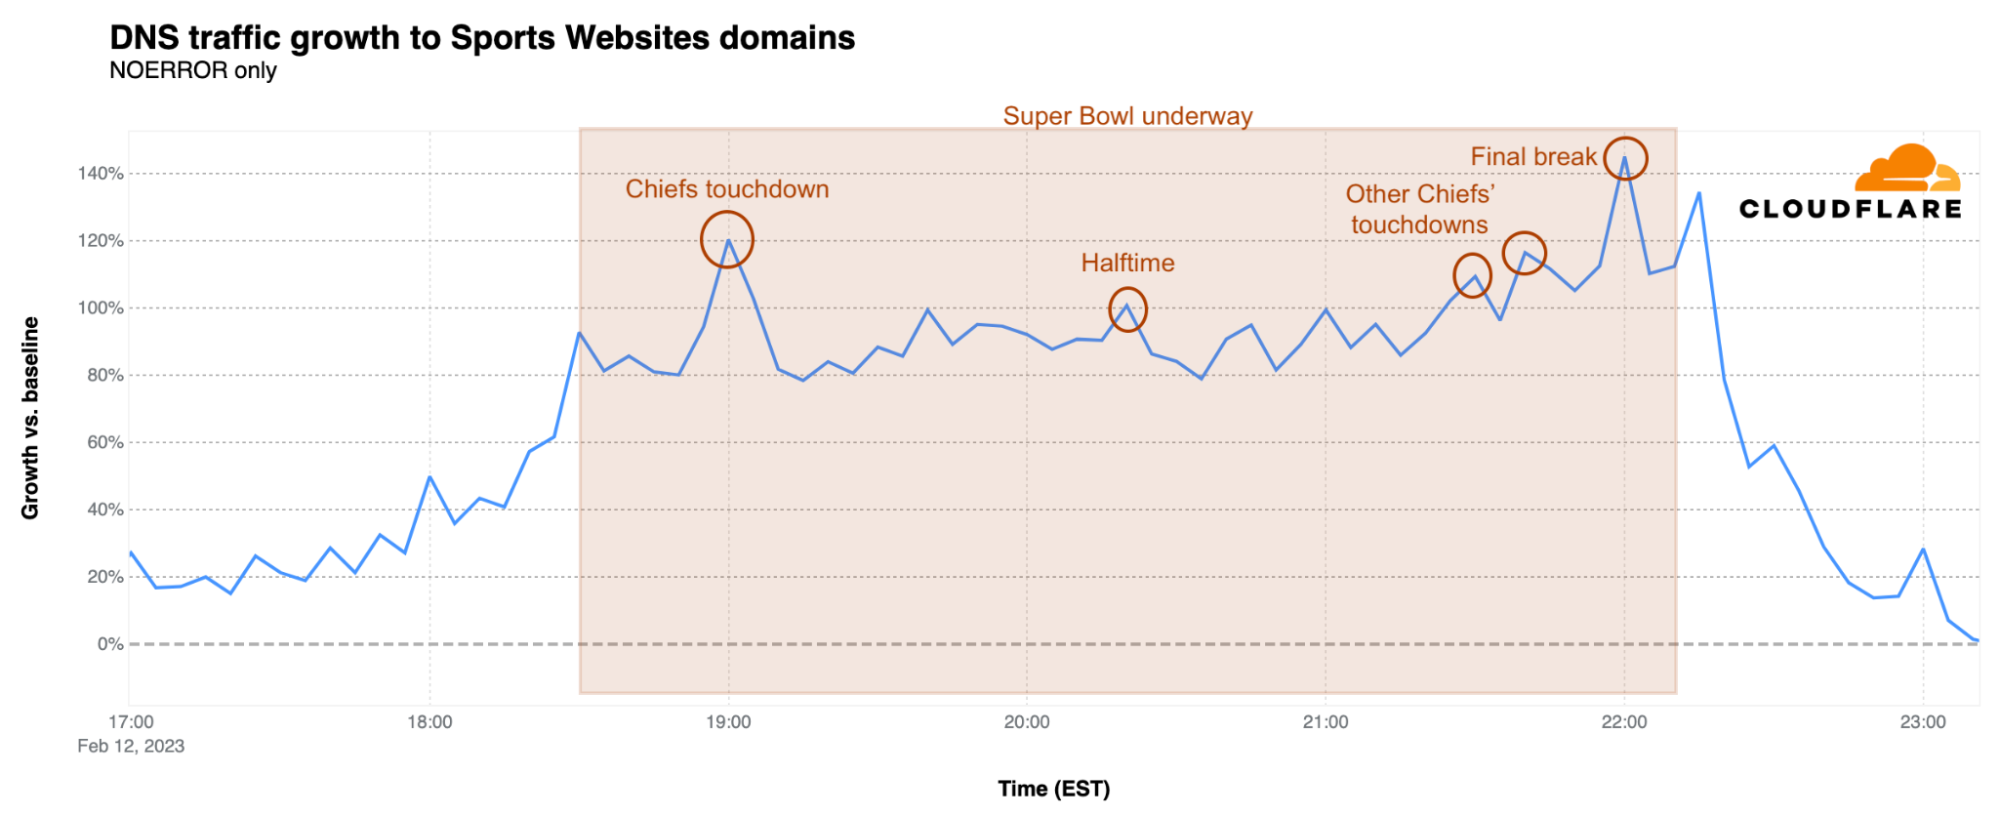
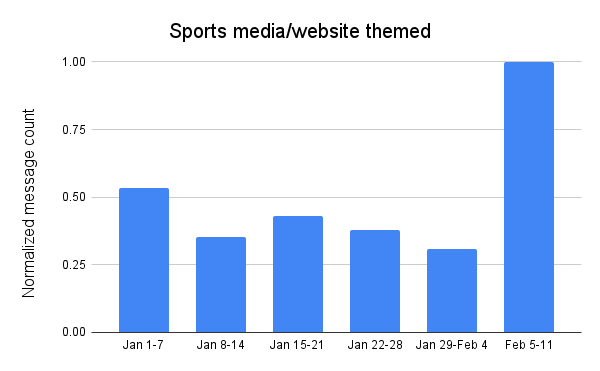
Sports media/websites

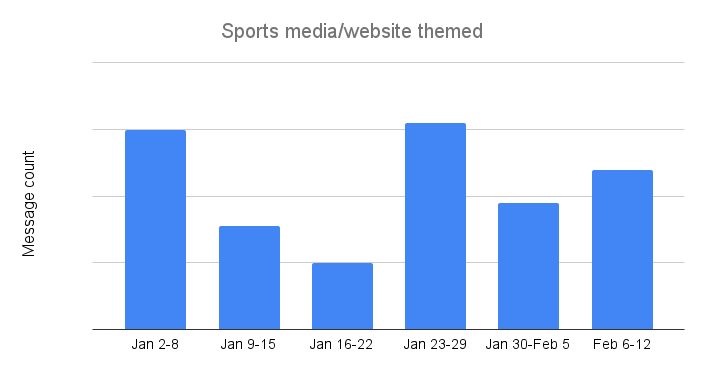
Attackers appeared to lose interest in using messages with subject lines related to sports media and websites as January progressed, with the volume of related messages peaking the first week of the month. However, similar to Super Bowl and football themed messages, this theme took on renewed interest in the week leading up to the Super Bowl, with message volume reaching over 3x the previous week, and 1.8x the peak seen durinthe first week of the year.
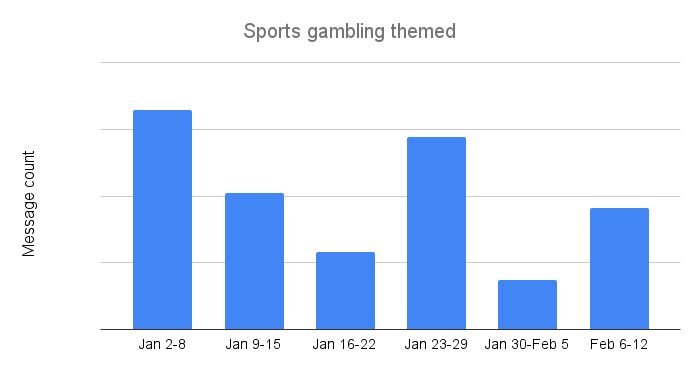
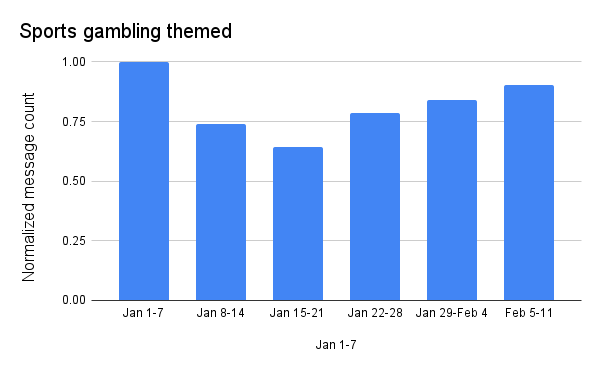
Sports gambling

The final weekend of regular season games (on January 6 & 7) again drove the highest volume of sports gambling themed messages, similar to the pattern seen in 2023. Message volume dropped by about a third over the next two weeks, but picked back up around the divisional and conference playoff games and into the Super Bowl. Even with the growth into the Super Bowl, gambling-themed spam and malicious message volume remained 10% lower than the peak seen a month earlier.
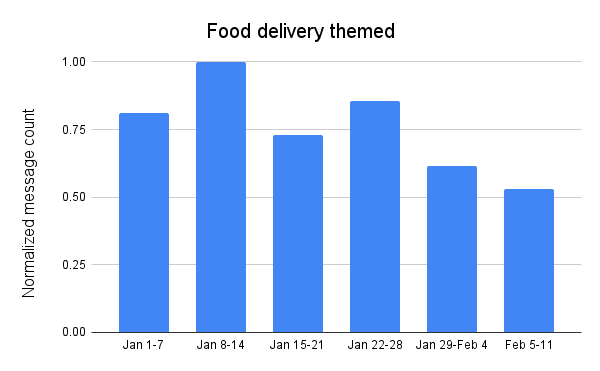
Food delivery

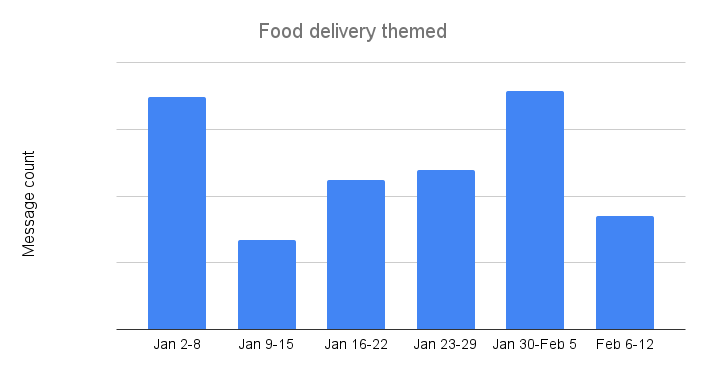
Peak volume of food delivery themed messages was an order of magnitude (10x) higher than the Super Bowl and football themed peak, which was the next largest. Due to the popularity of such services, it appears that it is a regular theme for spam and potentially malicious messages, as volume remained extremely high throughout January. After peaking the week of January 8-14, message volume was lower each of the following weeks, reaching its nadir in the week leading up to the Super Bowl, 47% lower than the peak volume.

Conclusion

Likely peaking during the so-called “dot.com” Super Bowls nearly a quarter-century ago, most Super Bowl ads no longer drive traffic to associated websites by including a URL in their ad. However, as our DNS traffic analysis found, it appears that viewers don’t seem to have much trouble finding these sites. We also found that in-game events had a mixed impact on traffic across domains associated with multiple types of apps, as well as traffic for the websites associated with the teams playing in the Super Bowl.

For more insights into Internet trends, we encourage you to visit Cloudflare Radar. You can contact the Cloudflare Radar team at [email protected] or on social media at @CloudflareRadar (X/Twitter), cloudflare.social/@radar (Mastodon), and radar.cloudflare.com (Bluesky).

A look at Internet traffic trends during Super Bowl LVII

Post Syndicated from David Belson original https://blog.cloudflare.com/super-bowl-lvii/

A look at Internet traffic trends during Super Bowl LVII

A look at Internet traffic trends during Super Bowl LVII

The Super Bowl has been happening since the end of the 1966 season, the same year that the ARPANET project, which gave birth to the Internet, was initiated. Around 20 years ago, 50% of the US population were Internet users, and that number is now around 92%. So, it’s no surprise that interest in an event like Super Bowl LVII resulted in a noticeable dip in Internet traffic in the United States at the time of the game’s kickoff, dropping to around 5% lower than the previous Sunday. During the game, Rihanna’s halftime show also caused a significant drop in Internet traffic across most states, with Pennsylvania and New York feeling the biggest impact, but messaging and video platforms saw a surge of traffic right after her show ended.

In this blog post, we will dive into who the biggest winners were among Super Bowl advertisers, as well as examine how traffic to food delivery services, social media and sports and betting websites changed during the game. In addition, we look at traffic trends seen at city and state levels during the game, as well as email threat volume across related categories in the weeks ahead of the game.

Cloudflare Radar uses a variety of sources to provide aggregate information about Internet traffic and attack trends. In this blog post, as we did last year and the year before, we use DNS name resolution data from our 1.1.1.1 resolver to estimate traffic to websites. We can’t see who visited the websites mentioned, or what anyone did on the websites, but DNS can give us an estimate of the interest generated by the ads or across a set of sites in the categories listed above.

Ads: are URLs no longer cool?

In contrast to Super Bowl commercials of the past 25 years, many of this year’s advertisements didn’t include a URL, possibly suggesting strong confidence by brands in their search engine results placement, or an assumption that the viewer would engage with the brand through an app on their phone, rather than a website. To that end, several ads did include an app store-related call to action, encouraging the viewer to download the associated mobile app. And possibly in an effort to capitalize on the success of Coinbase’s QR code commercial during Super Bowl LVI, a number of brands, including Toyota, Michelob Ultra, and Mr. Peanut included QR codes as a way for viewers to get additional information or see more.

As we did last year, we again tracked DNS request traffic to our 1.1.1.1 resolver in United States data centers for domains associated with the advertised products or brands. Traffic growth is plotted against a baseline calculated as the mean request volume for the associated domains between 1200-1500 EST on Sunday, February 12 (Super Bowl Sunday.) Although over 50 brands advertised during the game, the brands highlighted below were chosen because their advertisements drove some of the largest percentage traffic spikes, as well as one interesting tale.

BlueMoon

Although the commercial initially seemed to be for sibling beer brands Coors Light and Miller Lite, there was a twist at the end, This twist was only fitting, as the ad was actually for Blue Moon, which is often served with a twist of orange on the rim of the glass. Although beer ads don’t usually drive significant traffic spikes, this one did, reaching 76,400% above baseline for Blue Moon’s site. Coors Light saw a 275% bump in DNS traffic coincident with the ad, while Miller Lite grew 120%. However, traffic for Coors and Miller was fairly volatile at other times during the game.

A look at Internet traffic trends during Super Bowl LVII

LimitBreak

Although last year’s advertisements included a number of cryptocurrency-related brands, they were all but absent from this year’s slate of ads. The closest we got during this year’s game was a commercial from LimitBreak, which describes itself as “bringing the free-to-play gaming experience to Web3 and beyond”, in which it promoted a giveaway of thousands of its Dragon series NFTs. This ad featured a QR code and a URL, and given the nearly 54,000% increase in DNS traffic observed, both were effective means of driving traffic to the LimitBreak website.

A look at Internet traffic trends during Super Bowl LVII

Temu

Upstart mobile shopping app Temu purchased multiple Super Bowl ad slots to promote its “shop like a billionaire” campaign, urging viewers to download its mobile app. As seen in the graph below, these advertisements drove spikes in traffic, and continued engagement, each time they ran. The first airing at 19:16 EST drove a 222% spike over baseline in DNS traffic. However, the second airing at 21:12 EST apparently resulted in significantly more interest, driving a 475% traffic increase. A third airing at 22:20 EST reached 169% over baseline, with another one just after that reaching over 200%.

A look at Internet traffic trends during Super Bowl LVII

Dunkin’

In early January, Boston-area media blew up with the news that local celebrity Ben Affleck was spotted working the drive-through window at one of the coffee chain’s Medford locations, raising some speculation that he was filming a Super Bowl commercial. That speculation turned out to be true, as the commercial aired at 18:53 EST. But the commercial had a side effect: DNS traffic for dunkin.com, associated with DunkinWorks (a small personal coaching and training business), spiked 8,000% when the commercial aired, as shown in the graph below. (It isn’t clear what drove the later three spikes for dunkin.com, as the advertisement didn’t air again nationally during the remainder of the game.) We can only hope that the dunkin.com system administrators were fueled with plenty of coffee and donuts as they dealt with the rapid growth in traffic.

A look at Internet traffic trends during Super Bowl LVII

Site categories: touchdowns bring attention

As we saw last year, there are two factors that bring a surge of traffic to the websites of Super Bowl participants: touchdowns and winning. However, nothing is more impactful than the sweet taste of victory. Both the Kansas City Chiefs’ and Philadelphia Eagles’ websites experienced a surge in DNS traffic just before the game started, as compared to a baseline calculated as the mean request volume for the associated domains between 12:00-15:00 EST on Sunday, February 12 (Super Bowl Sunday.). The Eagles website had its peak just around the time of the kickoff, with 828% growth over baseline, and continued to grow more rapidly than traffic to the Chiefs’ website until 20:55 EST, when traffic to chiefs.com began to pull ahead.

What happened at that time? That was the moment of the Chiefs’ third touchdown of the game, when DNS traffic to the team’s website had its first peak of the evening, at 514% above baseline. There was a clear spike during another Chiefs touchdown at 21:42 EST, at 454% above baseline, but that was nothing compared to the end of the game, when the Kansas City Chiefs were once again, after their 2019 victory, the winners. At 22:15 EST, when the game ended, DNS traffic to the Chiefs’ website was 871% higher, and peaked 10 minutes later at 890%, as compared to the baseline. At this same time, DNS traffic for the Eagles’ website dropped significantly. As we saw last year as well, winning the Super Bowl clearly drives increased traffic to the victor’s website.

A look at Internet traffic trends during Super Bowl LVII

Sports websites trends also followed the in-game events. There was a clear spike to approximately 90% above baseline when the game started at 18:30 EST, with further growth to 120% over baseline at 19:00 EST during the Kansas City Chiefs’ first touchdown. There were also clear spikes at 21:30 and 21:40 EST coinciding with the two more Chiefs touchdowns. The Super Bowl peak for these websites was reached during the final break at 22:00 EST, reaching 145% above baseline, just before the Chiefs’ game-winning field goal. After a brief drop as the game ended, there was an additional spike to 134%.

A look at Internet traffic trends during Super Bowl LVII

Rihanna’s impact on messaging and social media sites

What happened following Rihanna’s performance during the Super Bowl halftime show? As the game resumed, we saw a clear increase in traffic for messaging websites, with a first peak right after the end of the show at around 20:45 EST, 22% over baseline. The biggest peak, however, was when the game ended. At 22:15 EST, DNS traffic for messaging sites was 30% higher than the earlier baseline.

A look at Internet traffic trends during Super Bowl LVII

Rihanna’s announcement of her second pregnancy, which made news after her performance, also impacted traffic to social media platforms. After a small increase when halftime started, there was a clear drop during Rihanna’s show, followed by a jump from 6% below baseline back to 0% right after the show. An additional 3% of traffic growth was reached during the final break at 22:00 EST, just before the Kansas City Chiefs’ winning field goal. After a brief drop, traffic reached 2% above baseline as the game ended.

A look at Internet traffic trends during Super Bowl LVII

Is halftime also a time for rewatching ads?

The arrival of halftime at 20:21 EST also brought a surge in DNS traffic for video platforms. The first peak was reached at 18:00 EST, before the game started, at 12% above baseline. The peak during halftime was reached at 20:25 EST with 13% growth above baseline, suggesting that viewers may have been looking at that time to Super Bowl related videos or just using the time to browse those platforms.

A look at Internet traffic trends during Super Bowl LVII

Food delivery websites saw flat to lower DNS traffic just before the game as compared to the earlier baseline, suggesting that food orders were placed/scheduled earlier in the afternoon, hours before the game. At kickoff, traffic was 19% below baseline, but there was a clear spike at the time of the first break and right after the first Kansas City touchdown at 18:55 EST. After falling again during the game, there was a small increase in traffic observed just after the game ended.

A look at Internet traffic trends during Super Bowl LVII

What about betting sites? They expected a big day during the Super Bowl, given that more states have recently legalized gambling on sports. The peak was reached at 19:00 EST, as DNS traffic reached 295% over baseline, when the Chiefs had their first touchdown, The first Eagles touchdown, minutes before, resulted in a 233% spike. The lowest traffic for betting sites during the Super Bowl was during the halftime show. In the second half of the game, two other clear spikes in traffic are visible. The first was at 20:55 EST at 167% above baseline when the Chiefs pulled ahead with a touchdown, and then a jump to 278% over baseline when the game ended.

A look at Internet traffic trends during Super Bowl LVII

Rihanna runs this town city

While the so-called NFL cities across the country are loyal to their local teams, looking at traffic trends across cities from both conferences makes it clear that fans everywhere find joy, not division, in the unknown pleasures of a good halftime show. The drop visible in both graphs below between 20:30-20:50 EST coincides with Rihanna’s return to live performance, as she last performed live in January 2018. Based on the observed drop in traffic, viewers apparently turned away from their computers and devices, giving their attention to Rihanna, or at least stopped their general Internet surfing during the halftime show. As the graphs show, traffic recovered as soon as halftime was over.

A look at Internet traffic trends during Super Bowl LVII

Zooming in to individual cities, we examined the traffic patterns observed in both Philadelphia and Kansas City. While both teams have fans across the country, we can use their home cities as a proxy. In this case, we compared normalized Internet traffic levels between 17:00-22:30 EST on Super Bowl Sunday (February 12) with the same time frame on the prior Sunday (February 5).

In Kansas City last Sunday, traffic volumes remained fairly consistent across the surveyed time period. However, on Super Bowl Sunday, traffic levels were initially similar, but by the start of the game were 84% lower than the same time the previous week. Slight drops in traffic are visible coincident with Chiefs touchdowns, but don’t stand out from the overall noisiness of the graph. The graph reached its nadir at 22:13 EST when the Chiefs broke the tie and kicked the game-winning field goal, with the significant drop in traffic likely due to an increased shift in focus towards the outcome of the game, even by those that hadn’t previously been paying close attention.

A look at Internet traffic trends during Super Bowl LVII

As the graph below shows, last Sunday saw Internet traffic in Philadelphia gradually decline as the evening wore on. On Super Bowl Sunday, traffic started out slightly lower than the week prior, and also diverged as game time approached, reaching nearly 50% lower at kickoff. As the Eagles took an early lead, their first touchdown resulted in a noticeable drop in traffic from Philadelphia, seen at 18:52 EST, less than 10 minutes after the start of the game. Visible drops in traffic are also coincident with the Eagles’ other three touchdowns, although they don’t stand out against the volatility of the graph. Traffic began to drop towards the end of the game, as the tie score added tension, and reached its lowest point when it became clear that the Eagles were not going to emerge victorious in Super Bowl LVII.

A look at Internet traffic trends during Super Bowl LVII

In addition to looking at traffic impacts at a city level, we can also zoom out to examine Internet traffic trends in the Super Bowl states. Arizona, which hosted the big game at State Farm Stadium in Glendale, saw a drop in state-level traffic starting around 13:00 EST. At the time of the kickoff, traffic was 25% lower than the previous Sunday, but the biggest impact was during the wildly popular halftime show by Rihanna. At 20:30 EST, traffic was 29% lower than the same time on the previous Sunday. After the game ended, traffic levels returned to normal around 23:30 EST.

A look at Internet traffic trends during Super Bowl LVII

In Pennsylvania, home of the Philadelphia Eagles, traffic began to dip after 15:00 EST and reached its first low point around kickoff, when it was 28% lower than the previous Sunday. Just like in Arizona, the biggest difference was during Rihanna’s halftime show, when it was a whopping 33% lower than usual. However, just a few minutes after the game ended at 22:30 EST, traffic returned to normal.

A look at Internet traffic trends during Super Bowl LVII

What about the winning team’s state of Missouri? There, traffic started to decrease only after 17:00 EST and was actually higher than the previous Sunday before that point. With the kickoff came a clear drop, resulting in 28% less traffic than the previous Sunday at the same time. Traffic increased a bit heading towards halftime, but dropped again during Rihanna’s show, when it was 30% lower than usual. The biggest drop in traffic, not surprisingly, was during the exciting moment of the Kansas City Chiefs’ winning field goal. At 22:15 EST, traffic was 33% lower than the previous Sunday. However, after 22:50 EST, Internet traffic in Missouri was back on the fast track, with traffic increasing to levels higher than the previous Sunday.

A look at Internet traffic trends during Super Bowl LVII

Rihanna’s halftime performance had a clear impact on Internet traffic at a state level, which dropped across all states with NFL teams at the time of her show. Below we take a closer look at the most populous states, among which Pennsylvania, New York and Arizona were winners, with the largest traffic declines. The impacts in Pennsylvania and Arizona are shown above, and the graph below shows the traffic trends seen in New York.

A look at Internet traffic trends during Super Bowl LVII

California, Texas, Florida, and New York all had their fair share of Internet traffic dropping before and throughout the game, but it was during the halftime show when things really got interesting. At the time of Rihanna’s performance, Internet traffic in California was 24% lower than the previous Sunday, while in Texas it was 21% below a week earlier, and Florida also saw a 21% drop. Meanwhile, New York had a clear 30% decrease in traffic during the show and, as shown above, Pennsylvania took the cake with a 33% drop. Illinois, Ohio, Georgia, North Carolina, and Michigan were close behind with 23%, 27%, 22%, 25%, and 22% drops respectively.

This seems to be a clear indication that the Super Bowl in general, but also the much-anticipated halftime shows, and the winning celebrations, all have a massive impact on the Internet, causing a noticeable dip in Internet traffic, especially in the state of the winning team.

Do email spammers and scammers take advantage of “The Big Game”?

Spammers and scammers will frequently try to take advantage of the popularity of major events when running their campaigns, hoping the tie-in will entice the user to open the message and click on a malicious link, or visit a malicious website where they give up a password or credit card number. Cloudflare Area 1 Email Security analyzed the subject lines of email messages processed by the service in the weeks leading up to the Super Bowl to identify malicious, suspicious, and spam messages across four topic areas: Super Bowl/football, sports gambling, sports media/websites, and food delivery.

As the “regular” season NFL games wrapped up, Super Bowl and football themed email threat volume remained relatively low. However, campaigns clearly picked up between January 23-29 as the message count grew sevenfold. However, campaigns kicked into high gear once the Chiefs and Eagles were headed to the Super Bowl, as the number of identified messages between January 30 and February 5 was nearly six times higher than the previous week. These campaigns quickly ended in the week before the big game, though, as Super Bowl and football themed suspicious, malicious, and spam email volume dropped by nearly 90%.

A look at Internet traffic trends during Super Bowl LVII

Overall, the number of sports gambling themed subject lines remained fairly low over the survey period. This is somewhat surprising, given that an increasing number of US states have recently legalized betting on sporting events. Interestingly, the trend was highest at the beginning of the year, although that first week was too late to capture potential interest in college football “bowl” games. However, the weeks ahead of the NFL conference championship games (January 23-29) and the Super Bowl (February 6-12) saw message volume increase to levels nearly 2.5x higher than previous weeks.

A look at Internet traffic trends during Super Bowl LVII

Sports media and website themed suspicious, malicious, and spam email messages apparently don’t draw the clicks, because the volume of such messages seen by Cloudflare Area 1 has remained extremely low since the start of the year, but peaked during the week of January 23-29. And although lower in volume, the observed trends were similar to those seen for sports gambling, with peaks during the same weeks.

A look at Internet traffic trends during Super Bowl LVII

For many people, the Super Bowl is less about the football game than it is about the commercials and the food, and the growth of food delivery services over the last few years have made it easier to ensure that the snacks and libations never run out during the game. Scammers and spammers have apparently learned to take advantage of this hunger, as food delivery themed email messages saw the highest counts across the four categories reviewed here. Peak message counts were seen the weeks of January 2-8 and January 30-February 5. Message volume the weeks following these peaks fell by over 50% in both cases.

A look at Internet traffic trends during Super Bowl LVII

Conclusion

As we have seen time and again, advertising during the Super Bowl can drive significant traffic spikes, and apparently this holds true even if a URL isn’t included as a call to action within the commercial. In addition, the trends observed during the game remain a clear reminder that human behavior drives Internet traffic, especially when the halftime show features a popular singer that last performed live five years ago.

Visit Cloudflare Radar for up to date Internet traffic and attack trends, and follow the Cloudflare Radar Twitter and Mastodon accounts for regular insights on Internet events.